Report - East St. Louis Action Research Project
Report - East St. Louis Action Research Project
Report - East St. Louis Action Research Project

You also want an ePaper? Increase the reach of your titles
YUMPU automatically turns print PDFs into web optimized ePapers that Google loves.
ESLARP GIS: A REPORT ON THE CURRENT STATUS AND OPPORTUNITIES<br />
OF GIS WITHIN THE EAST ST. LOUIS ACTION RESEARCH PROGRAM<br />
PREPARED BY:<br />
KRISTOFER JOHNSON<br />
AS PARTIAL FULFILLMENT OF UP 497 – INDEPENDENT STUDY<br />
AUGUST 2, 2002<br />
DEPARTMENT OF LANDSCAPE ARCHITECTURE<br />
UNIVERSITY OF ILLINOIS URBANA-CHAMPAIGN
INTRODUCTION<br />
The work of a landscape architect is rooted in the characteristics of the site. This<br />
site can be a wide variety of things: an urban plaza, a residential backyard, or a regional<br />
open space network. Yet, in all cases, many of the design constraints and opportunities<br />
are derived from the ecology and spatial attributes of the area. During the site analysis<br />
stage or to explore the benefits of different design proposals, many landscape architects<br />
will employ the use of Geographic Information Systems or GIS. GIS are able to organize<br />
and display the geographic components of a site extremely quickly and easily.<br />
Embedded within each point, line, or polygon layer is an attribute table that contains all<br />
of the information associated with the individual elements of the layer. In addition to<br />
having very basic data, such as an element’s location, length, and size, the attribute table<br />
can be customized by the user to include any type of information desired.<br />
GIS has proven to be a valuable tool for landscape architects and urban planners.<br />
Comprehensive planning has typically run on a twenty-year time schedule. However,<br />
due to the rapid demographic, economic, and political changes that occur in the modern<br />
world, there is now a need to update these plans every five years. With GIS, more<br />
frequent updates are possible and plans have a greater ability to change with new<br />
development. GIS can also be used on many different types of projects. It has been used<br />
successfully on projects ranging from economic and streetscape renewal in Albuquerque,<br />
NM, viewshed preservation in the Hudson River Valley, and recreational master planning<br />
in Chattanooga, TN (Hanna, 1999).<br />
The focus of this report will be on how GIS can be used with grassroots,<br />
neighborhood development organizations. Specifically, it will describe the <strong>East</strong> <strong>St</strong>. <strong>Louis</strong><br />
<strong>Action</strong> <strong>Research</strong> <strong>Project</strong> (ESLARP) and its use of GIS. There will also be a discussion of
the information that can be derived from existing ESLARP GIS data. Following this<br />
section, the opportunities that ESLARP has to generate new types of data will be<br />
examined. Finally, there will be a short discussion on how creating new data can be<br />
incorporated into the ESLARP studio (ARCH 372, LA 236/338, UP 378) that occurs<br />
during the spring semester. Within each subject, this report will attempt to provide both<br />
the benefits of GIS and any possible concerns or limitations that may exist.<br />
ESLARP AND GIS<br />
The <strong>East</strong> <strong>St</strong>. <strong>Louis</strong> <strong>Action</strong> <strong>Research</strong> <strong>Project</strong> began it history with GIS in 1994<br />
under the guidance of then University of Illinois Landscape Architecture Professor Brian<br />
Orland. It was Professor Orland and his Fall 1994 LA 437 studio that first used GIS as a<br />
tool to analyze the site conditions that exist in <strong>East</strong> <strong>St</strong>. <strong>Louis</strong><br />
(www.eslarp.uiuc.edu/la/LA437-F94/main.html). GIS was again used the following year<br />
in many of the 1995 LA 437 projects (www.eslarp.uiuc.edu/la/LA437-F95/main.html).<br />
However, here it can be seen that GIS was not only being used for site analysis, but also<br />
to display different design proposals (Figure 1). Also in 1995, students in the Urban<br />
Planning department used GIS to identify dilapidated structures in the Edgemont<br />
neighborhood (www.eslarp.uiuc.edu/durp/UP419-S95/main.html). From these early<br />
beginnings, Geographic Information Systems have become fully integrated into ESLARP<br />
and the design process of its students.<br />
Perhaps one of the greatest achievements for ESLARP and its GIS resources came<br />
in 1996, when the first version of EGRETS was launched. EGRETS or the <strong>East</strong> <strong>St</strong>. <strong>Louis</strong><br />
Geographic Information Retrieval System (www.eslarp.uiuc.edu/egrets) was cutting-edge
Figure 1: An example of GIS being used as a design tool, not simply an analysis tool<br />
technology when it first arrived and is still a valuable resource for <strong>East</strong> <strong>St</strong>. <strong>Louis</strong> GIS<br />
information (refer to Appendix A for a step-by-step guide through this site).<br />
While at EGRETS, one can view and download pre-packaged maps through the<br />
Atlas section. The maps are categorized into varying geographic scales: neighborhoods,<br />
city-wide, or county-wide. The Alta Sita, Emerson Park, and Landsdowne<br />
neighborhoods have extensive lists of maps (refer to Appendix B). Included in the list<br />
are general maps such as roads, lot boundaries, and building conditions. Yet, there are<br />
also maps of much more specific items such as street drain existence, curb materials, and<br />
trash conditions. It is a credit to ESLARP to have this type of precise information<br />
available.
The visitor to this site also has the option to access raw data through the <strong>St</strong>ore.<br />
The ability to download the data layers themselves, allows the end user to customize the<br />
information according to their needs. This is extremely helpful when the user is trying to<br />
answer a specific question or create a different type of map than that available on the<br />
website. Unfortunately however, not all of the data is offered through the <strong>St</strong>ore. Here<br />
one can only find specific neighborhood data for Alta Sita and the general layers for <strong>East</strong><br />
<strong>St</strong>. <strong>Louis</strong> and <strong>St</strong>. Clair County (refer to Appendix B). For the EGRETS website to be<br />
truly powerful, all of the data should be made available. The ability to access all existing<br />
data through a central site would be especially helpful to students working in the <strong>East</strong> <strong>St</strong>.<br />
<strong>Louis</strong> studio.<br />
Figure 2: ESLARP GIS webpage
There are several other sources of GIS data on the internet. Many of these are<br />
listed on the ESLARP website (www.eslarp.uiuc.edu/gis/index.htm, Figure 2). TIGER<br />
line files are developed by the Census bureau and contain important census information<br />
as well as general data like roads, railroads, streams, etc. These are available for free<br />
from the Geography Network website (www.geographynetwork.com/data/tiger2000).<br />
For state and county-wide datasets, one can go to the Illinois Natural Resources<br />
Geospatial Data Clearinghouse provided by the Illinois Department of Natural Resources<br />
and the Illinois <strong>St</strong>ate Geological Survey (www.isgs.uiuc.edu/nsdihome/ISGSindex.html,<br />
Figure 3). At this site, it is possible to download layers such as roads, railroads, wetlands<br />
Figure 3: Illinois Natural Resources Geospatial Data Clearinghouse homepage
inventories, and municipal boundaries. This site also provides a link to the USGS Digital<br />
Orthophoto Quadrangles (geographically referenced aerial photographs) for the state of<br />
Illinois.<br />
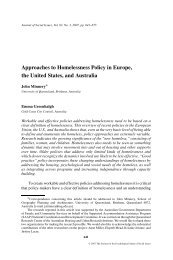
Aside from these sites, there are other GIS datasets available within ESLARP.<br />
Many of these are a result of the Spring 2002 studio. Working in the South End<br />
neighborhood for the first time, the students performed a Neighborhood Conditions<br />
Survey (NCS). The NCS was developed by ESLARP and has also been used in the Alta<br />
Sita, Edgemont, Emerson Park, and Landsdowne neighborhoods. The survey form is<br />
available on the ESLARP website (www.eslarp.uiuc.edu/gis/ncs/training/Diction1.htm,<br />
Figure 4). The purpose of the NCS is to record specific information about each<br />
Figure 4: Excerpt from the ESLARP Neighborhood Conditions Survey form
individual parcel in the neighborhood. Information such as building conditions, trash<br />
conditions, and the number of trees on each property is then input as the attribute data for<br />
the parcel boundaries data layer. The NCS is very beneficial to the students because they<br />
are able to create maps of the neighborhood based on vacant lots, landuse, building<br />
materials, and many other categories.<br />
Other datasets that were either generated or gathered by the Spring 2002 students<br />
include: aerial photography of the neighborhood, a Digital Elevation Model (DEM),<br />
elevation contours, and the mass transit routes (bus and light rail) (refer to Appendix C<br />
for examples of this data). Many students used the aerial photography to increase the<br />
realism of their maps and plans. It seemed that the residents also enjoyed the use if the<br />
aerial photos because they were able to visualize the neighborhood from above and even<br />
identify their own homes. The DEM provided provocative hillshade images that revealed<br />
how the city of <strong>East</strong> <strong>St</strong>. <strong>Louis</strong> sits completely within the Mississippi River floodplain.<br />
The elevation contours were generated from the DEM and were used to discover the low<br />
areas of the neighborhood that could be prone to flooding during heavy rains. With this<br />
information, it was possible to identify the actual properties that may be threatened by<br />
flooding. Finally, the bus and light rail routes were provided by the Bi-<strong>St</strong>ate<br />
Development Agency (www.bi-state.org) that manages <strong>St</strong>. <strong>Louis</strong> regional transit. This<br />
data helped students adapt their landuse plans according to existing transit corridors.<br />
DEVELOPMENT OF EXISTING DATA<br />
ESLARP has many opportunities to develop and generate new layers of<br />
information from the data that already exists. Some of this has already been performed.
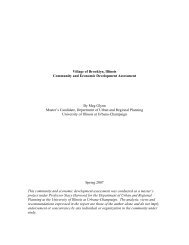
As part of a Summer 2002 Independent <strong>St</strong>udy, the author has examined the South End<br />
NCS and produced several informative maps. Similar to the work developed for other<br />
neighborhoods, these maps include:<br />
• Existing Building Conditions – identify structures for demolition<br />
• Unoccupied Existing Buildings – identify resale/rental opportunities<br />
• Fire Damaged Buildings – identify any patterns or a large fire event<br />
• Trash Conditions – identify properties in need of cleanup<br />
• Existing Landuse – identify opportunities for new development<br />
• Plant Growth in Right of Way – identify walks in need of cleanup<br />
• <strong>St</strong>reet Trees in Right of Way – identify streetscaping or lack thereof<br />
• Existing Trees on Properties – identify properties with a valuable amenity<br />
• Materials of Existing Buildings – identify upcoming maintenance problems<br />
• Recent Improvements on Buildings – identify responsible homeowners<br />
• Height (# of stories) of Buildings – can lead to a 3D spatial representation<br />
• Property conditions – identify problem lots and responsible homeowners<br />
All of these maps were produced by selectively displaying different attributes of the NCS<br />
data layer. They have been saved as 8.5”x11” JPEG images and as individual ESRI<br />
ArcMap documents.<br />
The author has also downloaded several of the TIGER line files created from the<br />
2000 Census. The roads, railroads, streams, lakes, census blocks, municipal boundaries,<br />
and county boundary files have been gathered for <strong>St</strong>. Clair and Madison Counties in<br />
Illinois. Additionally, all of these files except for the census blocks have been<br />
downloaded for <strong>St</strong>. <strong>Louis</strong> City and County, <strong>St</strong>. Clair County, and Jefferson County in<br />
Missouri.<br />
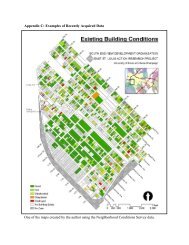
One exciting tool of GIS that could be used with existing data is the Network<br />
Analyst. This allows the user to predict the amount of time required to travel between
two points along a network, generally a road layer. The analyst also can generate service<br />
areas out from or in to a specific point. A good example of this is a fire station. Network<br />
Analyst can predict the area serviced within 2, 5, or 10 minutes of the station along the<br />
road network. Another example is the area served by a supermarket (Figure 5). How<br />
much of an area can reach the supermarket within 5, 10, or 15 minutes Using this tool<br />
would require some data development of the roads layer, however the core information<br />
exists. One would simply need to add the speed along different types of roads to the data<br />
attribute table. Generally, speed limits are not a very good indicator however because<br />
stops and traffic effects need to be incorporated into the speed estimate. ESLARP could<br />
use the Network Analyst to find travel times to different goods and services needed by<br />
the residents and areas serviced by the police and fire departments. This could result in<br />
landuse master plans that are better informed and truly meet the needs of residents.<br />
Existing data could also be used to create a building outlines layer. This could be<br />
done relatively easily using the aerial photography that is now available. Digitizing the<br />
building outlines would be relatively simple and not require an extraordinary amount of<br />
time. However, this dataset would be especially helpful to the studio during the design<br />
stages. As the ESLARP studio continues to work in the South End, the designs generated<br />
will move from the master plan level down to the individual site plan. Having the lot<br />
lines and property boundaries are helpful for overall planning, but they do not provide<br />
precise enough information for site design. Building outlines will help make this jump in<br />
scale possible. Additionally, a building outlines layer in combination with NCS data<br />
would make it possible to generate 3D scenes of the neighborhood and proposed designs.
Travel Times to Existing Supermarkets<br />
Figure 5: This example of the Network Analyst shows how various zones can be delineated according to the<br />
travel time to or from a specific point. This figure shows the travel zones to existing supermarkets in shades of<br />
gray, then overlaid by a color landuse layer.
This would be a great visual tool for residents to see how different designs would affect<br />
the spatial nature of their neighborhood.<br />
OPPORTUNITIES FOR NEW DATA<br />
ESLARP also has the capability to develop many new layers of data and<br />
information. Closely related to the Network Analyst is the Address Matching tool.<br />
Again, this tool uses the roads data layer and can pinpoint any address that is entered. At<br />
first glance, this may not seem like a very useful item. However, this could be a valuable<br />
way to map crime statistics (Ceccato and Snickars, 2000). Many residents of the South<br />
End complained of crime in the area. If a log of crimes could be obtained from the police<br />
department, then a data layer could be created based on where these crimes took place.<br />
This would result in a useful dataset with the ability to represent crime rates spatially.<br />
Crime data could then be examined against many other types of neighborhood<br />
information. One could use this layer and the Network Analyst together to ask the<br />
question: Do more crimes happen in areas that are not quickly or easily serviced by the<br />
police The results of this study could certainly affect the placement of police services in<br />
a new master plan.<br />
An interesting area of current research is the development of resident-generated<br />
GIS or “Bottom-Up GIS” (BUGIS) (Talen, 2000, p.280). BUGIS attempts to reverse the<br />
role of the resident in the GIS process. Typically, the resident is “informed” of their<br />
situation by GIS experts in a top-down fashion. However, with BUGIS it is the resident<br />
that informs and provides the foundation for the GIS data. A primary focus of BUGIS is<br />
to integrate local knowledge and qualitative data into the GIS layers (Talen, 2000).
This approach can have several positive effects on the community and its<br />
development process. First, it can facilitate interaction between residents and open a<br />
dialogue about the area’s problems, opportunities, and expectations. Furthermore, the<br />
ability of the residents to present their perceptions in a dynamic and visual way may<br />
increase neighborhood participation in planning decisions. It is possible that it could<br />
provide a greater sense of empowerment to both the neighborhood and the individual<br />
because it is their voice that is being heard and utilized (Talen, 1999).<br />
During the Spring 2002 studio, this type of resident information was recorded<br />
through the Cognitive Mapping and SWOT (<strong>St</strong>rengths, Weaknesses, Opportunities,<br />
Threats) Analysis exercises. However, it was never translated into a GIS format.<br />
Furthermore, the author believes that these types of exercises should be taken to the next<br />
level in order to generate truly useful information. For example, a resident describing the<br />
trees of the neighborhood as a strength is not as beneficial as them explaining which trees<br />
are important and where they are located.<br />
There are several types of layers that could be created from a resident-generated<br />
GIS activity. Residents could describe strong points of the neighborhood such as areas<br />
they feel are safe, paths they follow to work or school, parks that people use and who<br />
uses them, and streets they feel have improved over time. It is also important to record<br />
information about some of the issues of the area like loitering youths, streets people avoid<br />
due to traffic or crime, and localized flood zones. One of the advantages of GIS is that<br />
information, such as age, sex, race, and income, about the residents supplying the<br />
descriptions could be incorporated into the layer. This could yield insight into
neighborhood social dynamics. For example, it would be possible to observe if older<br />
residents avoid different areas or travel different paths than the younger residents.<br />
There are two basic ways that resident GIS information could be gathered, either<br />
through hand drawn maps or a questionnaire. In both cases, the process of transferring<br />
the raw data into a GIS format would be time consuming. Ideally, a computer with GIS<br />
would be used to record the information in real-time. Unfortunately, this can be both<br />
expensive and difficult in terms equipment, personnel, and proper facilities (Al-<br />
Kodmany, 2001). Another issue that can occur in resident-generated data is the risk of<br />
overrepresentation of certain groups (Ceccato and Snickars, 2000). This would most<br />
certainly occur if the data gathering were performed only at neighborhood meetings. For<br />
example, younger residents are typically not present at these meetings and in order to<br />
obtain a true sample of the collective feelings of the residents they would need to be<br />
included in the process.<br />
One final type of new data that could be developed by ESLARP is a database of<br />
images linked to GIS layers. The Chicago Imagebase <strong>Project</strong> was a pioneer in using GIS<br />
to organize images according to their geographic location. <strong>Research</strong>ers associated with<br />
the project believed that this framework would allow users to easily understand and<br />
orient themselves to the spatial layout of their neighborhood (Al-Kodmany, 2001).<br />
Digital images can easily be linked to either an existing data set or a newly created file.<br />
The advantage of linking to a new layer is that important information about the image<br />
could be stored within that layer. Items such as the date, time, direction, and subject of<br />
the photo could be integrated into the file. Through the use of scripts within the GIS<br />
environment, it could then be possible to run image-based queries of the data (Al-
Kodmany, 2001). An example would be, “show me pictures of clean vacant lots and<br />
where they are located on the map.”<br />
Geographically referenced photographs of the South End neighborhood would be<br />
a tremendous resource for the students of the ESLARP studio. Not only could they<br />
refresh their memories of specific areas, but design sketches and altered images could be<br />
put back into GIS as part of a final presentation. This would be an exciting way to<br />
organize design proposals from the studio, especially if put into a web-based format.<br />
Designs proposals would then be accessible to residents, other students, and the public at<br />
large.<br />
INTEGRATION INTO THE ESLARP STUDIO<br />
GIS should play a significant role in the ESLARP studio. It has the ability to<br />
overlay and manipulate data such that new information becomes apparent and certain<br />
questions can be answered. It is the author’s opinion that one of the simplest layers to<br />
generate and possibly the most helpful to students is the image database. The studio<br />
makes several field trips down to <strong>East</strong> <strong>St</strong>. <strong>Louis</strong> and it would be very easy to have a<br />
group of students take photographs for part of one day. Equipped with digital cameras,<br />
the students could cover the neighborhood in a relatively short period of time. Using a<br />
map and a data form of some kind, they could record the number of the photo, exactly<br />
where it was taken, the direction, date, time, and subject. Different students could<br />
concentrate on different subjects. This would minimize any overlap and would allow for<br />
several different image-based data layers to be created. For example, there could be a<br />
layer that had street images, another with vacant lot images, and still another with
deteriorated housing images. Regardless of the subjects decided upon, these photos<br />
would be an extremely valuable resource to the students. The actual creation of the data<br />
layers would be somewhat time consuming, but the benefits would be worth the effort.<br />
Certainly the resident-generated GIS layers could also be incorporated into the<br />
studio. Door to door interviews or even a mail-based questionnaire would provide<br />
excellent data. There could be some sort of exercise created for use at a SENDO meeting<br />
also. The major issue involved with this is the time required to transfer all of the<br />
information into a GIS dataset. Digitizing hand drawn maps is tedious work and<br />
converting descriptions into a spatial representation can be very difficult. Yet, the author<br />
believes that through group work and the division of responsibilities, it would be possible<br />
to create this type of data. It would again be very beneficial and would hopefully lead to<br />
more intelligent design decisions.<br />
It should be mentioned that the author has created a CD for the students of the<br />
ESLARP studio. This CD contains all of the existing data layers that are available for the<br />
South End, including those generated and downloaded during Summer 2002. The author<br />
will also be creating a booklet of full color maps showing the information that has been<br />
derived from the South End NCS. The layout template used for these maps will be<br />
included on the CD such that any future documents could use the same format.<br />
CONCLUSION<br />
The <strong>East</strong> <strong>St</strong>. <strong>Louis</strong> <strong>Action</strong> <strong>Research</strong> Program has an excellent foundation of GIS<br />
data and several opportunities to develop its GIS capabilities in the future. Much of the<br />
existing data is available through the ESLARP website and EGRETS. The EGRETS
website could become an even more powerful and useful clearinghouse of <strong>East</strong> <strong>St</strong>. <strong>Louis</strong><br />
GIS data if more layers are made available. Also, as more current datasets become<br />
available through the Census Bureau, Federal Emergency Management Association<br />
(FEMA), and other sources, ESLARP should continue to update its information. This<br />
will provide residents, students, and staff with the most current data available, hopefully<br />
resulting in the most informed decisions possible.<br />
Using existing GIS layers, ESLARP can generate new and exciting insight into<br />
the dynamics of <strong>East</strong> <strong>St</strong>. <strong>Louis</strong> neighborhoods. Terrain models and elevation contours<br />
can help identify properties in danger of flooding or perhaps areas suitable for open<br />
space. GIS tools such as Network Analyst and Address Matching can be used to create<br />
maps of service areas, travel times, crime statistics, and many other items. Aerial<br />
photography can serve as the source to create a building outlines layer. This will become<br />
increasingly useful to students as the ESLARP studio continues to refine its design<br />
proposals and bring them to more detailed level.<br />
New datasets like image-based GIS and “Bottom-Up” GIS embody exciting new<br />
opportunities to integrate student involvement and local area knowledge into a realistic<br />
spatial framework. Image layers can aid in the student design process and provide a new<br />
way of presenting design proposals. Resident-generated GIS contains numerous<br />
possibilities for not only beneficial datasets, but also neighborhood interaction and<br />
participation.<br />
Furthermore, students can and should be involved in the creation of these GIS<br />
datasets. This involvement could mean taking photographs, drawing maps with residents,<br />
tallying the results of a questionnaire, or digitizing new layers. Yet in all cases, the
esults of their hard work will be a set of valuable information that can be used well into<br />
the future. ESLARP has the ability to use GIS as a very powerful tool…a tool that can<br />
help create well-informed design solutions that embrace the true needs of <strong>East</strong> <strong>St</strong>. <strong>Louis</strong><br />
residents.
REFERENCES<br />
Al-Kodmany, Kheir. (2001). “Bridging the Gap Between Technical and Local<br />
Knowledge: Tools for Promoting Community-Based Planning and Design.”<br />
Journal of Architectural and Planning <strong>Research</strong>, 18(2): 110-130.<br />
Ceccato, Vania A. and Folke Snickars. (2000). “Adapting GIS Technology to the Needs<br />
of Local Planning.” Environment and Planning B: Planning and Design, 27(6):<br />
923-937.<br />
<strong>East</strong> <strong>St</strong>. <strong>Louis</strong> <strong>Action</strong> <strong>Research</strong> <strong>Project</strong> Website – www.eslarp.uiuc.edu<br />
Geography Network Website – www.geographynetwork.com<br />
Hanna, Karen C. (1999). GIS for Landscape Architects, ESRI Press, Redlands, CA.<br />
Illinois Natural Resources Geospatial Data Clearinghouse Website –<br />
www.isgs.uiuc.edu/nsdihome/ISGSindex.html<br />
Talen, Emily. (1999). “Constructing Neighborhoods from the Bottom Up: the Case for<br />
Resident-Generated GIS.” Environment and Planning B: Planning and Design,<br />
26(4): 533-554.<br />
__________. (2000). “Bottom-Up GIS: A New Tool for Individual and Group<br />
Expression in Participatory Planning.” Journal of the American Planning<br />
Association, 66(3): 279-294.