UNIVERSITY OF CALIFORNIA Los Angeles - Users - UCLA
UNIVERSITY OF CALIFORNIA Los Angeles - Users - UCLA
UNIVERSITY OF CALIFORNIA Los Angeles - Users - UCLA

You also want an ePaper? Increase the reach of your titles
YUMPU automatically turns print PDFs into web optimized ePapers that Google loves.
<strong>UNIVERSITY</strong> <strong>OF</strong> <strong>CALIFORNIA</strong><br />
<strong>Los</strong> <strong>Angeles</strong><br />
Record of Creative Work<br />
A comprehensive exam report submitted<br />
in partial satisfaction of the requirements for the degree<br />
Master of Fine Arts in the Department of Design | Media Arts<br />
By<br />
Jihyun Kim<br />
Nov 26, 2008
:Kinetic Data Visualization of Natural Phenomena<br />
Jihyun Kim<br />
University of California, <strong>Los</strong> <strong>Angeles</strong><br />
Department of Design | Media Arts
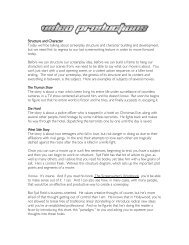
J.KIM_A LANDSCAPE <strong>OF</strong> EVENTS 4
A Landscape of Events, Installation View, May.2008<br />
New Wight Gallery, <strong>Los</strong> <strong>Angeles</strong>, USA
Abstract<br />
A Landscape of Events<br />
The acceleration of data collection and geographic technologies has<br />
changed the physical and virtual boundaries of nature, perceptions of<br />
geometry, geopolitical paradigms, and ecological issues. Perception now<br />
extends beyond our immediate physical and phenomenological<br />
experiences of space. Historically, in many cultures around the world, the<br />
concept of landscape implied a process of distancing nature from a<br />
perceiving human subject, and has been conflated with countless<br />
predetermined cultural, social, and political meanings. What, then, does<br />
such a notion of distancing mean within a contemporary urban context<br />
and new technologies This project explores landscapes within a<br />
contemporary art/urban context and interrogates the physical and<br />
emotional aspects of our current engagement with technologies.<br />
A Landscape of Events is a kinetic data visualization that simultaneously<br />
objectifies nature, subjectivizes landscape, and visualizes natural<br />
phenomena. This project employs (near) real-time data from natural<br />
events that resist visual recognition and cannot be experienced in everyday<br />
spaces. This project investigates different interpretations of ocean wind<br />
and suggests the evocation of interaction with this indeterminate space.<br />
This project utilizes data, physical objects, and space to visualize the<br />
experience of natural phenomena and experiment in creating a subjective<br />
scene. A Landscape of Events is moments that exist somewhere in the<br />
physical realm and encourage viewers to question their sense of their<br />
surroundings in order to counter the pervasive atmosphere of passivity in<br />
contemporary urban life.<br />
J.KIM_A LANDSCAPE <strong>OF</strong> EVENTS 6
“Nature is an enigmatic object, an object that is<br />
not absolutely object; it is not absolutely in front<br />
of us. It is our ground, not what is in front of us,<br />
but what bears us.”<br />
[Maurice Merleau-Ponty]<br />
J.KIM_A LANDSCAPE <strong>OF</strong> EVENTS 7
Table of Contents<br />
Abstract<br />
Table of Contents<br />
1. Introduction 10<br />
1.1. Background<br />
1.2. Objectives<br />
1.3. Project Overview<br />
2. Absence of Landscapes 16<br />
2.1. Modern Nature<br />
2.2. Urban Experiences<br />
2.3. Air and wind<br />
3. Framing to Mapping 28<br />
3.1. GIS as New Media<br />
3.2. Map and Visualization<br />
3.2. New Realities<br />
4. A Landscape of Events 43<br />
4.1. Virtual Process: Data and Tools<br />
4.2. Physical Process: Mechanical System<br />
4.3. Aesthetic Process: Forms and Materials<br />
5. Conclusion 62<br />
Bibliography<br />
Figures<br />
J.KIM_A LANDSCAPE <strong>OF</strong> EVENTS 8
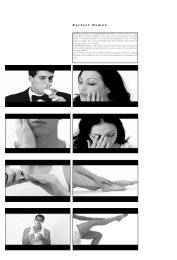
A Landscape of Events<br />
Salt Water, Movements, and Corrosion<br />
NOAA station 46026, Nov. 2008<br />
<strong>Los</strong> <strong>Angeles</strong>, USA
1. Introduction<br />
<br />
1.1. Background<br />
New technologies, particularly data collection and geographic mapping<br />
technologies such as global positioning systems (GPS), geographic<br />
information systems (GIS), and remote sensing, have produced complex<br />
concepts of place/space and blurred the physical and virtual boundaries of<br />
nature, the perceptions of geometry, ecological issues, and geopolitical<br />
paradigms. Place/space now exists as a mobile sphere where physical and<br />
virtual realms cross each other and create different perspectives. Within<br />
such an infinite and abstruse context, the fixed boundaries of time/space<br />
do not exist and nature is not limited solely to traditional ecological<br />
environment frameworks concerning issues of global warming,<br />
overpopulation, and vanishing species. Space/place is no longer a fixed<br />
physical scene. Rather, within this conceptualization, space is more about<br />
the landscape made, created, and recreated by humans and their social,<br />
economical, and cultural activities.<br />
Figure 1. Hans Haacke,<br />
Wind and Water Sculpture,<br />
Tri-Quarterly Supplement,<br />
1967<br />
According to Paul Virilio, “Landscape has no fixed meaning, no<br />
privileged vantage point. It is oriented only by the itinerary of the<br />
passerby.” 1 Landscape is a complex experience constituted not by one’s<br />
cultural, economic, political and technological environment that is<br />
differently distributed and conceived in different parts of the world but by<br />
individuals themselves. So there can be various ways to interpret the<br />
meaning of landscape. The traditional landscape art genre was radically<br />
transformed in the 1960s, when many artists stopped merely representing<br />
the land, and new technologies, such as video, spread out to public.<br />
1<br />
Virilio, Paul, Translated by Julie Rose. A Landscape of Events. MIT Press, 2000, p xi<br />
* The title, A Landscape of Events, is from this book.<br />
J.KIM_A LANDSCAPE <strong>OF</strong> EVENTS 10
Landscape is meditative moments that are connected to life, art, nature,<br />
and humankind through everyday life; these are the ways in which we<br />
articulate and enact individual experiences, or re-order our responses, in<br />
the space we live now.<br />
The concept of landscape implies a process of distancing nature from<br />
the perceiving human subject. Historically, in many cultures around the<br />
world, this concept of landscape has been conflated with countless<br />
predetermined cultural meanings. Such socio-culturally defined<br />
distancing often privileges the visual/verbal objectification of landscape<br />
while marginalizing all of the non-visual/verbal forces, such as human<br />
subjectivity and individual imagination. What, then, does such a notion of<br />
distancing mean within a contemporary urban context–i.e. a rendered<br />
world Mark Hansen explores this concept in a rendered world using the<br />
following worlds:<br />
[A]lmost every aspect of our daily lives is "rendered" in data. New data<br />
collection technologies have made it easy to record continuous, highresolution<br />
measurements of our physical environment (weather patterns,<br />
seismic events, and the human genome). We are also constantly<br />
monitoring our movements through and interactions with our physical<br />
surroundings (automobile and air traffic, large-scale land use, and<br />
advanced manufacturing facilities). In computer-mediated settings, our<br />
activities either depend crucially on or consist entirely of complex digital<br />
data (networked games, peer-to-peer technologies, and Internet usage).<br />
As a result, the flow of data has become an important force in<br />
contemporary life. 2<br />
Figure 2. Carl Andre, 2 (1H x<br />
12S), Aluminum Double<br />
Twelver, 1999<br />
We are living in an age increasingly overloaded with information in a<br />
rendered world which consists of a variety of realities. Whenever we<br />
encounter digital data and representations in everyday life, there is always<br />
some ‘distancing’ that results from reducing our images to bits and pixels.<br />
In that way, perception can extend beyond our immediate physical and<br />
phenomenological experience of space. My project attempts to not only<br />
visualize a landscape of events that employs real time data from natural<br />
phenomena but also explore landscapes within contemporary urban/art<br />
context. This project interrogates the physical and emotional aspects of<br />
2<br />
Mark Hansen, 2007<br />
J.KIM_A LANDSCAPE <strong>OF</strong> EVENTS 11
our current engagements with technologies. This project also provokes<br />
curiosity, leading to a critical exploration of the boundaries between the<br />
real and the virtual, land and non-land, natural and artificial, and the<br />
material and the abstract through data recomposed natural events.<br />
1.2. Objectives<br />
A Landscape of Events simultaneously objectifies nature, subjectivizes<br />
landscapes, and visualizes the liminal and invisible scene of natural<br />
phenomena. This project employs real-time data from natural events that<br />
resist visual recognition and cannot be experienced in everyday spaces<br />
such as ocean wind, tide, ground water flow, and ground movement.<br />
Unremarkable, customary yet noticeable movements are the constituent<br />
materials of this project. Just as artists have been exploring nature through<br />
the actions of traveling, walking, mapping, excavating, and building, I<br />
study the incidental planetary rhythms of wind, water, and ground<br />
through near real-time data measurements. I then manipulate the data<br />
through the processes of reconstitution, arrangement, and distortion.<br />
This thesis is to explore landscapes within contemporary urban/art<br />
context and interrogate the virtual, physical, and emotional aspects of our<br />
current engagements with technology.<br />
Figure 3. James Turrell,<br />
Roden Crater, near<br />
Flagstaff, Arizona, in<br />
progress since 1980<br />
Chapter 2 of this thesis, titled Absence of Landscapes, investigates the<br />
foundational theories of modern nature and new urban experiences. I will<br />
investigate the effects of those new phenomena found in our<br />
contemporary urban life. This chapter discusses their changing meanings<br />
of nature and urban experiences – not only how they influence our<br />
everyday lives, but also how we view them. As a cultural, historical,<br />
theoretical, philosophical and/or aesthetic background for this thesis, I<br />
describe ideas of Félix Guattari and Estern thoughts in this chapter.<br />
Another focus of this chapter is to investigate how new technologies are<br />
inspiring a new sense of landscape and the impact of these technologies on<br />
contemporary digital urban life. Following this, I introduce wind as the<br />
topic of focus in this thesis and accompanying project.<br />
J.KIM_A LANDSCAPE <strong>OF</strong> EVENTS 12
Chapter 3, framing to mapping, covers geo-related technologies,<br />
particularly GIS as a new media, map and visualization, and<br />
multitudinous realities. After discussing GIS, I explore how the fields of<br />
cartography and mapping are changing due to these new technologies.<br />
The analysis then investigates current information visualization flow and<br />
introduces some of my previous experiments as examples. The analysis<br />
then explores multitude realities, and I suggest a different way of<br />
visualization through a hybrid reality.<br />
Chapter 4 describes how methodologies can be used to address kinetic<br />
information visualization of natural phenomena, in particular, ocean<br />
wind. In terms of process, the project is divided into three main parts: (a)<br />
a virtual process – analysis of data and methodology for investigation,<br />
which is part of the traditional process of information visualization, (b) a<br />
physical process – developing mechanical systems for representing near<br />
real-time data movements of natural events, and (c) a hybrid process –<br />
combining the aesthetic components that connect virtual and physical<br />
processes. The project intertwines not only the fields of technology and<br />
art, but also the virtual and the real.<br />
Finally, my Conclusion rearticulates my central concept and provides an<br />
overview of the project’s exhibition including my own observation and<br />
viewers’ reactions.<br />
1.3. Project Overview<br />
Figure 4. Walter De Maria,<br />
The Equal Area Series,<br />
1976-77<br />
A Landscape of Events presents a kinetic data visualization beyond<br />
screen-based representations. The project employs (near) real-time data<br />
from natural phenomena, in particular, ocean wind from the west<br />
coastline of US. The wind exists neither in heaven nor on earth, neither in<br />
west nor east, and neither in presence nor history. It exists as invisible<br />
space between everything, in the middle, amid considerations as a<br />
potential territory. This project utilizes data, physical objects, and space to<br />
visualize natural phenomena as a physical form. It experiments in creating<br />
J.KIM_A LANDSCAPE <strong>OF</strong> EVENTS 13
a subjective scene that allows a full range of possibilities from data,<br />
material, form, and scale.<br />
The project presents real-time natural productive movements based on<br />
ocean wind data that is updated every 10 minutes. Performatory<br />
movements of wind data create traces of corrosion as time passes. Wind<br />
traces are overlaid again and again, and the aluminum sheet is deeply<br />
corroded. Movements represent the presence of the wind and corrosion<br />
traces represent the history of the wind. The salt water coagulated after<br />
being pumped out from underneath the aluminum sheet, and there were<br />
some visible secretions. The physical form of the work consists of<br />
construction materials from our surroundings such as metal, concrete, and<br />
machinery.<br />
The project examines our experience of the spatial and perceptual<br />
conditions through objects/installations and visualizes environmental<br />
events. The project invites different interpretations of natural phenomena<br />
as those events interact with the indeterminate space created by my<br />
project. In my work, the viewer shares our subjective experiences, and<br />
moments of instantaneous communication with the natural events. A<br />
Landscape of Events is moments that exist somewhere in the physical<br />
realm and encourage viewers to question their sense of their surroundings.<br />
Figure 5. A Landscape of<br />
Events, <strong>Los</strong> <strong>Angeles</strong>, 2008<br />
J.KIM_A LANDSCAPE <strong>OF</strong> EVENTS 14
A Landscape of Events<br />
Salt Water, Movements, Corrosion and<br />
Secretions after one week<br />
NOAA station 46028, Nov. 2008<br />
<strong>Los</strong> <strong>Angeles</strong>, USA
2. Absence of Landscapes<br />
HAMM: Nature has forgotten us.<br />
CLOV: There’s no more nature.<br />
Samuel Beckett – Endgame<br />
2.1. Modern Nature<br />
Now in the age of new media, we often experience nature indirectly<br />
and mediated with man-made images and perspectives, but we still<br />
constantly receive messages from the environment. Nature is a subject of<br />
permanent interest and relevance as seen in landscape paintings, art and<br />
photography everywhere. Nature might always be the most popular<br />
subject of art; it is also arguably the most open-ended.<br />
Figure 6. Ned Kahn.<br />
Technorama Façade,The<br />
Swiss Science Center,<br />
Switzerland. 2002<br />
The web survey project by Komar and Melamid in 1995 concerning<br />
the ‘Most Wanted and Least Wanted Paintings’ 3 reflects “the artists'<br />
interpretation of a professional market research survey about aesthetic<br />
preferences and taste in painting.” 4 As the result of the survey, the most<br />
popular pictures were landscape paintings for almost every country in the<br />
world, and this says landscape be the most popular subject of everyday life.<br />
However, at the same time, we can see how the representation and<br />
imagination is limited. Such culturally defined distancing often privileges<br />
the visual objectification of landscape while marginalizing all of the nonvisual<br />
forces at work in nature.<br />
3<br />
form Golan Levin’s keynote presentation at Infovis07, ‘Visualization without computer’<br />
4<br />
http://www.diacenter.org/km/index.html(accessed May, 29,2008) In 1994, they began the<br />
process which resulted in America's Most Wanted and America's Least Wanted paintings,<br />
which were exhibited in New York at the Alternative Museum under the title "People's<br />
Choice."<br />
J.KIM_A LANDSCAPE <strong>OF</strong> EVENTS 16
Figure 7. Komar & Melamid, Most Wanted and Least Wanted Paintings, 1995<br />
Images present us, simultaneously, in terms of culture, power,<br />
symbolism, and politics with the same redundancies of behavior. Within<br />
this image-oriented environment/landscape, there are no more individual<br />
experiences of absolute time and space in our ordinary life. In<br />
consideration of these ideas, there are several theoretical and philosophical<br />
views about image in modern society. For example, in Regis Debray’s book<br />
Vie et mort de l'image[1992], a survey of the metamorphosis of the image,<br />
the author criticizes the equality of the visual organ – ‘visuality = real =<br />
truth’ and the disappearance of invisible and subjective things. He states<br />
that if everything can be seen, then nothing is valuable. Singularity is<br />
decreasing with the progressive debasement of objects and spaces, and<br />
discreditable and banal visuality is increasing.<br />
I often think that there is potential for creating singularities focusing<br />
on invisible communication and human subjectivity. I propose mental<br />
ecologies as an act for creating stylistic si ngularities within the otherwise<br />
closed world of continuously recycled and redundant mass-media imagery<br />
in everyday life. In short, Félix Guattari’s ideas and Eastern views of<br />
nature are two influential theories behind this thesis.<br />
Ecosophy Guattari wrote about our ordinary life in the new media<br />
society, “At best there is the creation or innovation of new Universes of<br />
references; at the worst there as deadening influence of the mass media to<br />
which millions of individuals are currently condemned.” Guattari<br />
explores ecosophy as one of the foundational theories of nature as mental<br />
and invisible. It consists of three intrinsic and inseparable spheres of<br />
ecology: the environment, social relations and human subjectivity. He<br />
writes that mental ecology’s “ways of operating will be more like those of<br />
an artist, rather than of professional psychiatrists who are always haunted<br />
J.KIM_A LANDSCAPE <strong>OF</strong> EVENTS 17
y an automated ideal of scientificity.” 5 His perspective involves shifting<br />
“the human and social sciences from scientific paradigms towards ethicoaesthetic<br />
paradigms.” 6 Guattari states:<br />
[G]eopolitical configurations are changing at a great pace whilst the<br />
Universes of technoscience, biology, computer technology,<br />
telemetrics and the media further destabilizes out mental<br />
coordinates on a daily basis. The suffering of the Third World,<br />
demographic cancer, the monstrous growth and degradation of the<br />
urban fabric, the insidious destruction of the biosphere by pollution<br />
and the incapacity of the system to reconstruct a social economy<br />
adapted to the new technologies – all of this ought to lead to the<br />
mobilization of minds, sensibilities and wills.<br />
Openness Eastern thought presents a complementary idea of nature<br />
that emphasizes mental ecology, invisible energy, imagination and<br />
openness such as Qi, I Ching and Buddism. In Eastern culture, ecology in<br />
art is using both natural and man-generated forces, the materials and<br />
human energy of a given environment, in order to enhance life in a given<br />
environment and possibly beyond those geographic borders. In this<br />
context, art is considered part of people’s ordinary life and the mediationbased<br />
communications which communicate between humans and nature.<br />
In other words, instead of creating simulative images and objects, arts are<br />
considered to create things that help people to communicate with nature<br />
more easily. For example, there is a traditional architectural structure in<br />
Korea in the past called ‘Jung-Ja’, which is a kind of arbor. This is<br />
different from the European and Western arbor, located inside manmade<br />
gardens; Jung-Ja was usually located and constructed in nature itself. The<br />
frame of Jung-Ja becomes the real screen of nature, and people inside the<br />
space could move into and experience the real scene surrounding them.<br />
Figure 8. Roni Horn,<br />
The library of water, 2007<br />
Again, in Eastern thought, the domination of nature is closely linked to<br />
other systems of domination like our everyday life. For instance, in the<br />
preface to the book, Buddha Mind in Contemporary Art, the editors<br />
Jacquelyn Bass and Mary Jane Jacob state the importance of Buddhism<br />
and nature in art. “The influence and resonance of Buddhism is<br />
5<br />
Guattari, Felix. The three ecologies. Athlone Press, 2001, p49<br />
6<br />
Ibid.,, p10<br />
J.KIM_A LANDSCAPE <strong>OF</strong> EVENTS 18
important, not as a prescriptive religious doctrine, but as a perspective<br />
that has achieved a state of synthesis with some important element of art<br />
practice.” 7 Bass and Jacob also mention:<br />
[A]nother intent was to cultivate the potential for satisfying aesthetic<br />
experience engendered by an open, aware state of mind. We hope to<br />
address, within a field rethinking its own practice, bow the audience<br />
can best access and have a rich experience with art. 8 … is realization<br />
that art resides not in the mind of the artist or in the art object, but in<br />
the mind of the viewer. This realization parallels the Buddha’s insight<br />
that suffering resides not in events or objects but in our mind 9<br />
In my opinion, there are some connections between the contemporary<br />
West and the East of the past, and the most significant idea that makes a<br />
connection between both is openness and mind in nature. In this context,<br />
Umberto Eco’s Open Work provides an influential idea: “A work of art is a<br />
complete and closed form in its uniqueness as a balanced organic whole,<br />
while at the same time constituting an open product on account of its<br />
susceptibility to countless different interpretations.” 10 Brass described<br />
Marcel Duchamp as an artist who changed not only “how we experience<br />
art, but how we experience life.” 11 “If you wish” Duchamp said at the end<br />
of his life, “my art would be that of meaning: each second, each breath is a<br />
work which is inscribed nowhere, which in neither visual nor cerebral. It’s<br />
a sort of constant euphoria.” 12<br />
My project questions the modern landscape which means not only the<br />
absence of traditional concept of nature, but also the absence of individual<br />
imagination and human subjectivity in the complex and passive urban life.<br />
In terms of the concept, personally, my project consists of the following<br />
purposes: (a) the individual’s possibility of sensing and being themselves<br />
without external pressures and preconceptions and (b) the idea of<br />
representing and transforming nature in different forms and contents that<br />
Figure 9. Marcel<br />
Duchamp, Rotoreliefs,<br />
1935<br />
7<br />
Baas, Jacquelynn and Mary Jane Jacob., Ed., Buddha mind in contemporary art. University<br />
of California Press, 2004, p11<br />
8<br />
Ibid., p11<br />
9<br />
Ibid., p20<br />
10<br />
Eco, Umberto. Open Work. Harvard University Press, 1989, p49<br />
11<br />
Baas and Jacob. Buddha mind in contemporary art. p20<br />
12<br />
Tompkins, Calvin. Duchamp: A Biography. Henry Holt, 1996, p408<br />
J.KIM_A LANDSCAPE <strong>OF</strong> EVENTS 19
can be applied in a new space/place – a hybrid reality or a utopia under<br />
the concept of a new urbanism. To describe these concepts more<br />
effectively, I will provide appropriate examples from Olafure Eliasson’s<br />
solo exhibition Take Your Time and Norman Foster’s Crystal Island.<br />
Figure 10. Olafur Eliasson,<br />
The weather project,<br />
Tate Modern, 2003-4<br />
Take your time Olafure Eliasson’s recent exhibition, Take Your Time,<br />
in SF MOMA, is an interesting reference because his works are about<br />
“seeing yourself sensing.” He proposed the concept, being alter,<br />
“progression constantly in dialog with the viewer (Eliasson, 2003 in his<br />
interview)” The important points in his proposal are the individual’s idea<br />
of space, duration, and the view of him or herself. In contemporary society,<br />
it is easy to lose individuals’ sense with cultural mass media imagery. I<br />
think, like Guattari mentioned, individuality is an important aspect can<br />
be used to recreate a valuable urban life. In her review on ARTFORUM,<br />
Anne M. Wager says;<br />
[W]hereas for Eliasson, “seeing yourself sensing”– being alter, that is, to<br />
your self and surroundings - has long been the goal.... In “take your time”,<br />
“your” perception is the theme. For Eliasson the topic is not new. Yet it<br />
seems to have taken a while for him to realize who exactly who you might<br />
be, and how they should deposing of their time.<br />
Figure 11.Norman Foster,<br />
Crystal Island, 2007<br />
*A new mixed-use destination<br />
for Moscow<br />
Crystal Island For the future, I can imagine other types of places<br />
where we can live, like those we see in Science Fiction movies: for<br />
example a hybrid space where we actually live now, the outer space,<br />
and a new form of space, such as the one proposed by Norman Foster,<br />
who is a London-based architect, and contributed to the design of<br />
Crystal Island. How are physical space and nature reconceptualised<br />
by the new technologies built within new/hybrid environments<br />
What kinds of interaction will be possible in the new/hybrid space<br />
In this regard, Norman Foster’s Crystal Island project is remarkable.<br />
Forster sees Crystal Island as a paradigm of compact, mixed-use,<br />
sustainable city planning, with an innovative energy strategy and<br />
‘smart’ skin, which buffers against climate extremes.<br />
J.KIM_A LANDSCAPE <strong>OF</strong> EVENTS 20
2.2. Urban Experiences<br />
A city is a space where people’s lives and deaths, their presence and<br />
history, their wealth and poverty, and the holy and secular parts of their<br />
lives are compressed together. People live together in cities and their lives<br />
can not be described without cities, which are an aggregate of human<br />
activities. How many people live in cities “According to the UN, the<br />
number of urban dwellers is expected to increase from roughly 3.2 billion<br />
today to more than 4.9 billion by 2030.” 13 New York, <strong>Los</strong> <strong>Angeles</strong>,<br />
London, Tokyo, and Seoul are gigantic industrialized and media-oriented<br />
cities, and convey icons of high-rise concrete buildings, automobiles,<br />
freeways and so forth.<br />
Figure 12. View of cities<br />
from Google Earth, 2008<br />
(FromTop: <strong>Los</strong> <strong>Angeles</strong>, New<br />
York, and Seoul)<br />
Regarding Virilio’s concept of landscape from Virilio, which, as I wrote<br />
above, is “oriented only by the experiences and the itinerary of the<br />
passerby,” most landscape now is closer to urban scape than the<br />
traditional natural scape. Then what about life in the city To maintain<br />
the system of the city, people just pursue their everyday actions without an<br />
aim and they are becoming consumer-driven. In contemporary cities,<br />
individual subjects are disappearing along with personal style. I believe<br />
new technologies can make it possible to develop more active and creative<br />
ways of communication in the urban lifestyle thus encouraging diverse<br />
styles.<br />
Figure 13. Archigram, Plug-in City, 1964<br />
13<br />
Potere, David and Annemarie Schneider. “A critical look at representations of urban areas<br />
in global maps”, GeoJournal, 2007, p 55<br />
J.KIM_A LANDSCAPE <strong>OF</strong> EVENTS 21
Tehnological Living In the 1960s, Archigram proposed new forms<br />
of cities with new environments where new technologies are possible<br />
everywhere; for example, a media city, a plug-in city, and an instant<br />
city, and those cities of imagination. These cities that were<br />
represented as graphic based works now became a reality in these days.<br />
Pedestrians are not just people who are passing by, but they are also<br />
people who can interact with multi-user environments such as<br />
mobile apparatus and locative media in urban spaces. These also can<br />
be defined as social and cultural spaces that allow telecommunication<br />
between people with different purposes.<br />
Figure 14. Blast Theory,<br />
Can You See Me Now,<br />
UK, 2001<br />
*A game that happens<br />
simultaneously online and on<br />
the streets. (down) An urban<br />
gamer running while playing<br />
the game.<br />
The apparatus is merged with physical space and recreates a<br />
different urban context. For instance, in one new media art genre<br />
there are locative games which use mobile devices such as the project<br />
Can you see me now. 14 Another example is happening now in Seoul,<br />
Korea. When people in Korea want to protest against the<br />
government’s policies, these days, they use mobile devices and media<br />
to communicate with other individuals, not only as a planning tool<br />
for arranging meetings, but also to report on situations in real-time<br />
through another media, such as internet communities. The following<br />
is a quote by Van Loon, explaining a multiplicity of rhythms in<br />
ordinary life:<br />
[E]veryday life consists of a multiplicity of rhythms. Everyday life thus<br />
entails a range of flows, each with their own ‘proper time’ (e.g, duration,<br />
pace, frequency). Likewise, we could argue that everyday life consist of<br />
multiplicity of spatialization, including forms of embodiment. If we were to<br />
use ‘space of places’, we would have to bear in mind the inherently<br />
dynamic, volatile, contested, unstable, and multiplicitous (rather than<br />
duplicitous) nature of ‘place’. 15<br />
With embedded ubiquitous computing technologies, urban life is<br />
now becoming a hybrid reality, i.e. a networked entity. New<br />
technologies such as mobile devices and locative media are making<br />
urban life more active and creative with nomadic and playful<br />
14<br />
http://www.blasttheory.co.uk/bt/work_cysmn.html (accessed June.10.2008)<br />
15<br />
Loon, Van J. “Social spatialization and everyday life.” Space and Culture, vol.5, no.2, p.88-<br />
95, 2002<br />
J.KIM_A LANDSCAPE <strong>OF</strong> EVENTS 22
movements. I believe that the new interfaces from those technologies<br />
can provide the potential for creating individual singularities. Stated<br />
by N. Katherine Hayles in Adriana de Souza e Silva’s article, “there is<br />
no longer a homogeneous context for a given spatial art, but rather<br />
pockets of different contexts in it.” 16<br />
New Experience There is a sense in which physical experience can<br />
be more interesting in comparison with the simulated imagery, which<br />
is focused on images viewed in limited space, especially, in front or<br />
inside of media screens. Although some art works and projects have<br />
used physical objects such as gloves and goggles to make people feel<br />
physically involved and take steps to individualized responses, I think<br />
these projects still limit the body to the space inside a room or near<br />
multimedia equipment; movement of the human body limits in how<br />
their experiences its environment. The new experience should be<br />
more open and invisible.<br />
In conclusion, with a ubiquitous computing environment with mobile<br />
devices and locative media, the meaning of private and public space is<br />
becoming important and expanded as a space which has convergent and<br />
divergent possibilities. No one can live without public space and media<br />
technologies now. The street can be used for a creative canvas and new<br />
technology can be the tool for artists, and pedestrians can participate,<br />
enjoy, and recreate those events from them. The new experience can be<br />
blurred not only the gap between image and reality, but also the gap<br />
between the virtual and the real.<br />
Figure 15. Rafael Lozano-<br />
Hemmer, Under Scan, 2005<br />
* Featuring over 1,000 interactive<br />
portraits in public urban space.<br />
16<br />
Adriana de Souza e Silva, "From Cyber to Hybrid: Mobile Technologies as Interfaces of<br />
Hybrid Spaces", Space and Culture, Vol. 9, No. 3. Aug, 2006, p. 269<br />
J.KIM_A LANDSCAPE <strong>OF</strong> EVENTS 23
2.3. Air and wind<br />
In this thesis project, I use ocean wind data from the NOAA (National<br />
Oceanic and Atmospheric Administration)’s buoy center 17 to visualize<br />
and create phenomena of natural circumstances as a new art form. Many<br />
people think about, write about, and describe wind from various fields,<br />
such as science, industry, military, and government. In the nineteenth<br />
century, meteorological technologies became an increasingly valid and<br />
popular branch of science. The field of meteorology now uses advanced<br />
technologies and almost every country has advanced systems for observing,<br />
measuring, anticipating and managing meteorological data. Just as the<br />
French sociologist of science, Bruno Latour said, “air had become public;<br />
gas had become a branch of military; a whole science of atmospheric<br />
manipulation had been declared.”<br />
Nature<br />
Weathering<br />
Biological<br />
dispersal<br />
...<br />
Speed<br />
Propeller<br />
Fans<br />
...<br />
Urban<br />
Wind power<br />
Ventilation<br />
...<br />
In addition, wind/air has become an open-ended subject in culture and<br />
art fields. For example, Latour describes, “Air first we feel nothing, we are<br />
insensitive, we are naturalized. And then suddenly we feel not something,<br />
but the absence of something we did not know before could possibly be<br />
lacking.” 18 In his book, Air and Dreams: An Essay on the Imagination of<br />
Movement,” Gaston Bachelard wrote “all immanence is joined a<br />
transcendence, and describes air as a solitary, imageless, iconoclastic<br />
representation of the imagination, a form of poetic meditation that<br />
replaces predetermined and socialized recognitions.”<br />
Eastern thoughts and perspective is another influential view for my<br />
project which is the notion of the wind. In an Eastern context, wind is<br />
considered as the first step for creating energy in the world. In his thesis,<br />
Hong-key Yoon describes wind as a key starting point of the<br />
environmental cycle:<br />
[T]he energy of Yin-Yang belches and becomes wind; ascends and becomes<br />
cloud; descends and becomes rain; flows underground and becomes vital<br />
17<br />
http://www.ndbc.noaa.gov/ (accessed Febrary.03.2008)<br />
18 Jones, Caroline A., Ed. Sensorium: Embodied Experience, Technology, and Contemporary<br />
Art .The MIT Press, 2006, p105<br />
J.KIM_A LANDSCAPE <strong>OF</strong> EVENTS 24
energy" Here we see that the transformation of Yin-Yang energy is explained<br />
only up to the point of its becoming vital energy…subsequent paragraph of the<br />
text expounds "the canon states that as the vital energy emerges to the wind, it<br />
disperses '' The implication is that the vital energy becomes wind when it slips<br />
out of the earth. 19<br />
Figure 16. Diagrammatic interpretation of the early Chinese idea of an environmental<br />
cycle 20<br />
Wind exists in a far-flung and minute place that is out of the reach of<br />
time. On the other hand, it is the place of an enormous ‘gap’ – a ‘gap’ that<br />
allows individual imagination.<br />
19<br />
Yoon, Hong-key. “An early Chinese Idea of a Dynamic Environmental Cycle”. GeoJournal<br />
10.2 , 1985, p211<br />
20<br />
Ibid., p211<br />
J.KIM_A LANDSCAPE <strong>OF</strong> EVENTS 25
Figure 17. Wind Flow (between West and East)<br />
In summary, from these examples, there are potentials for individual<br />
subjective imaginary exploration through natural phenomena, especially<br />
wind. Wind is important topic among the other natural phenomena, and<br />
that is why I chose this data for my project. I would like to explore wind and<br />
interrogate the physical and emotional aspects of our current engagements<br />
with technologies. The wind exists neither in heaven nor on earth, neither in<br />
west nor east, and neither in presence nor history. It exists as invisible space<br />
between everything, in the middle, amid considerations as a potential<br />
territory at the beginning of all crystallization.<br />
J.KIM_A LANDSCAPE <strong>OF</strong> EVENTS 26
A Landscape of Events<br />
Results from the installation<br />
(up) NOAA Station CARO3, One day, May.2008<br />
(down) NOAA Station 46042, 3 days, Nov.2008<br />
<strong>Los</strong> <strong>Angeles</strong>, USA
3. Framing to Mapping<br />
The greatest value of a picture is when it forces us<br />
to notice what we never expected to see.<br />
JOHN TUKEY<br />
3.1. GIS as New Media<br />
A necessary component of this thesis is the investigation and discussion<br />
of the geographic information system (GIS) which are spatially referenced<br />
to the Earth. GIS associated attributes and mapping tools are increasingly<br />
available on the World Wide Web (WWW) and a growing number of<br />
Web sites offer advanced GIS services such as route finding and geocoding<br />
system. GIS technologies are becoming part of our daily lives, and linked<br />
with multimedia and various virtual, mixed, and hyper realities.<br />
[G]IS integrates hardware, software, and data for capturing, managing,<br />
analyzing, and displaying all forms of geographically referenced information.” 21<br />
Using GIS, a system for capturing, storing, analyzing and managing data, the<br />
cartography of a map can be supplemented with textual information, digital<br />
images, sound, diagrams, and other miscellaneous graphical information. 22<br />
Figure 18. Yves Klein,<br />
RP5, Globe Terrestre<br />
Bleu, 37.5 * 24.5 *<br />
21.5cm,1962<br />
In general, the meaning of GIS can be understood in the following ways.<br />
First, “GIS has increasingly become an important means to communicate<br />
certain aspects of the real world to the general public.” 23 For example,<br />
organizations such as NASA(National Aeronautics and Space<br />
Administration), USGS (U.S. Geological Survey), and NOAA (National<br />
21<br />
http://www.gis.com/ (GIS allows us to view, understand, question, interpret, and<br />
visualize data in many ways that reveal relationships, patterns, and trends in the form of<br />
maps, globes, reports, and charts.)<br />
22<br />
Tor Bernhardsen. Geographic Information System. Wiley; 3 edition , 2002 , p313<br />
23<br />
Sui, Daniel Z and Michael F. Goodchild. “GIS as media” International Journal of<br />
Geographical Information Science, 2001, p388<br />
J.KIM_A LANDSCAPE <strong>OF</strong> EVENTS 28
Oceanic and Atmospheric Administration) provide geographic data to<br />
public as ‘a common language’ and ways of observing and ‘discovering’ the<br />
world. 24 We can easily access these webpage and get various data from<br />
there. For example, web sites such as Map Quest and Google Map serve<br />
millions of users every day, and they have changed conceptions of what<br />
constitutes an ordinary life, and have produced new art forms as well. In<br />
these aspects, the primary goal of all GIS operations in the end is “to<br />
communicate information to an audience in society.” 25 Second, significant<br />
changes have occurred in the past decade in the part played by digital<br />
geographical information in people’s lives.<br />
Figure 19. “To bring the real world into GIS, one has to make of simplified models of the<br />
real world. Uniform phenomena can be classified and described in the real-world model,<br />
which is converted into a data model by applying elements of geometry and quality. The<br />
data model is transferred to a database that can handle digital data, from which the data<br />
can be presented.” 26<br />
GIS technologies expand the possibilities of visualization of nature and<br />
earth beyond flatland. By examining GIS, instead of focusing on<br />
visualizing geographical data as the representation of a graphical image on<br />
the screen, I should emphasize the different ways of recognizing,<br />
investigating, and documenting GIS-based data as phenomenological<br />
methodology. Like Haque mentioned in his essay, “Technology is used to<br />
provoke interactions between people, and between people and their<br />
spaces.” 27 The concept of GIS, one of new media, has many possibilities<br />
for new interactions between people, and between people and their spaces<br />
and nature beyond the traditional interaction through images on the<br />
media screen.<br />
24<br />
Sui, Daniel Z and Michael F. Goodchild. “GIS as media”, P388<br />
25<br />
Ibid., p388<br />
26<br />
Tor Bernhardsen. Geographic Information System. Wiley; 3 edition , 2002 , p37<br />
27<br />
Haque, “Hardspace, softspace and the possibilities of open source architecture”,<br />
www.haque.co.uk, 2002 (accessed Mar 24, 2008)<br />
J.KIM_A LANDSCAPE <strong>OF</strong> EVENTS 29
History of GIS<br />
*GIS class notes, 2007, spring<br />
- Map-making started<br />
(1200 B.C., )<br />
- Pioneer research<br />
(late 1950’s to early 1970’s)<br />
- Major research and<br />
development<br />
(1970’s to early ‘80’s)<br />
- Commercial development<br />
(1980’s to present)<br />
- Currently, GIS is booming<br />
everywhere.<br />
Figure 20. “What a wonderful world it would be” 28<br />
28<br />
Pickles, John. A History of Spaces: Cartographic Reason, Mapping, and the Geo-Codes<br />
World. London and New York: Routledge, 2003 , p147<br />
J.KIM_A LANDSCAPE <strong>OF</strong> EVENTS 30
3.2. Map and Visualization<br />
Map and Worlds Maps are the representation of reality but they also<br />
have the potential of imagination. There is a belief that maps are true and<br />
“the ‘real’ is always produced on terms of a particular economy of<br />
capacities created through social, economies, political and technical<br />
assemblages.” 29 Maps are not simulacra, such as some images that do not<br />
have relationships to an outside; they are real. When people look at maps,<br />
there may be an assumption that maps represent a reality, which exists<br />
somewhere on the earth. At the same time, maps can prompt imagination<br />
and stories. For example, seeing the world map in my room helped me not<br />
only to gain knowledge about other areas of world where others live, but<br />
also to imagine my own stories. These are one of important aspects of<br />
visualization.<br />
Maps are one of primary and most common way to visualize the world,<br />
“Maps and mapping have always been theoretical and practical<br />
importance to geographer and cartographers, and they have had long<br />
standing technical and metaphorical importance for the theory and<br />
practice of fields such as geology, surveying, astronomy, anthropology, art<br />
history and literature.” 30 It has a long history and has many ways to<br />
visualize the scientific research to artistic practice. It also has a meaning of<br />
observing the world beyond the space where people are living right now.<br />
In the book, A History of Spaces, there is a good summary by the author,<br />
Pickles, about the meaning of map and cartographic practices.<br />
Figure 21. Several<br />
levels of generalization<br />
have to be carried out<br />
in order to represent<br />
the real world on a<br />
map.(Geographic<br />
Information System.<br />
Wiley, p44)<br />
[M]aps no longer are scene to simply represent territory, but are<br />
understood as producing it; in important ways ‘maps precede territory’,<br />
they inscribe boundaries and construct objects that in turn become our<br />
realities. …Geomorphological mappings do not so much mirror the physical<br />
world, but create textual abstractions that name and give structural form<br />
to the myriad fluxes and flows; they inscribe form and process through<br />
graphical representation and circulate these in ways that render them<br />
real... 31<br />
29 Pickles, John. A History of Spaces: Cartographic Reason, Mapping, and the Geo-Codes<br />
World, 2003 , p91<br />
30<br />
Ibid., p27<br />
31<br />
Ibid., p145<br />
J.KIM_A LANDSCAPE <strong>OF</strong> EVENTS 31
With new digital technologies for mapping, now, there is a lot of maps<br />
we can see though internet as almost real-time. As the new digital<br />
technologies spread out, like Pickles mentions in his book, “Perhaps we<br />
should place emphasizes on the worlds that are being produced in the<br />
digital transition, the conceptions of history with which they work, and<br />
the forms of socio-political life to which they contribute." 32 New<br />
technologies for maps and mapping have an impact on contemporary<br />
urban society and public practices. 33 The following is a quote by Board,<br />
explaining about represented and generalized maps and models:<br />
[I]t is comparatively easy to visualize maps as representational; models of real<br />
world, but it is important to realize that they are also conceptual models<br />
containing the essence of some generalization about reality. In that role, maps<br />
are useful analytical tools which help investigators to see the real world in a<br />
new light, or even to allow them an entirely new view of reality. 34<br />
Figure 22. Mark Hansen/<br />
Ben Rubin, Listening<br />
Post, 2004<br />
Data Visualization The democratization of information has<br />
important implications for how we understand space, culture, economy,<br />
society, and nature. As we know, data visualization is a powerful tool for<br />
representing, understanding and sharing information. In many fields, the<br />
goal of visualization is to provide the viewer with a better understanding<br />
of data or solving an isolated part of the specific problems for the scientific<br />
and social achievements. Visualization also can offer a method for seeing<br />
the unseen. It also enriches the process of scientific discovery and fosters<br />
profound and unexpected insights. Ben Fry mentions “one goal of<br />
information design is to show comparisons between elements.” 35<br />
Conceivably, contrast, hierarchy, and grouping are other elements to<br />
show differences. 36 One aspect of visualization is that it becomes different<br />
according to size, weight, color, and so on.<br />
32<br />
Pickles, John. A History of Spaces: Cartographic Reason, Mapping, and the Geo-Codes<br />
World, 2003 , p146<br />
33<br />
Ibid., p146<br />
34<br />
Ibid., p27 (Board, C. “Maps as models." Edited by R.J. Chorley and P. Haggett, models in<br />
Geography, London: Methuen, 1967, p671-726)<br />
35<br />
Ben Fry, “Computational Information design.”, 2004, p110<br />
36<br />
Ibid., p113<br />
J.KIM_A LANDSCAPE <strong>OF</strong> EVENTS 32
Figure 23. Golan Levin and<br />
RSG, JJ (Empathic Network<br />
Visualization), 2002<br />
In terms of visualization itself as a representation of reality, there have<br />
been issues such as omissions of original data, range, and scale. Interaction,<br />
the new way of communication by new technologies, can be helpful to<br />
solve these problems effectively with functions of zooming in/out,<br />
selecting/clicking, etc. Ben Fry also stated that the elements of interaction<br />
for the last step of visualization are to amplify and emphasize information<br />
visualization. In addition, there are also different directions of<br />
information visualization; data visualization is a more creative form than<br />
static elements. Golan Levin’s JJ is a good example that uses peoples’<br />
“facial expressions to visualize the emotional content of network traffic.” 37<br />
Figure 24. FundRace.org, an online tool. <strong>Users</strong> can seek information on local donations<br />
[W]hen you hear the term “information overloaded,” you probably know exactly<br />
what it means because it’s something you deal with daily. In Richard Saul<br />
Wurman’s book information Anxiety(doubleday), he describes how the New York<br />
times on an average Sunday contains more information than a Renaissance-era<br />
person had access to in his entire lifetime. 38<br />
Since we are living in an age increasingly ‘overloaded’ with information,<br />
the role of visualization will become more and more important. There is<br />
likely to be a positive trend towards data visualization – the collection and<br />
sharing of such data with the public. In this way, I think the boundary of<br />
37<br />
http://www.flong.com/projects/jj/<br />
38<br />
Ben Fry, Visualizing data, p2<br />
J.KIM_A LANDSCAPE <strong>OF</strong> EVENTS 33
data collection and visualization can be unlimited, and there are many<br />
possibilities to recall individual subjectivity. I had an opportunity to visit<br />
both InfoVis07 and InfoVis08 and found certain differences across the<br />
two conferences. At InfoVis08, there was more research about socialrelated<br />
information visualizations than scientific visualizations, as well as<br />
more information on perception, design, and interaction issues. Beyond<br />
scientific visualization, information visualization, particularly social<br />
related data sets, has begun to draw attention.<br />
The democratization of information gives the public access to more<br />
data. For example, during and after the U.S. election, people could track<br />
the amount of donations to the candidates and the voting rate at almost<br />
real time. In addition, the public can generate information themselves and<br />
share it. Many Eyes, a public web site “where users may upload data, create<br />
interactive visualizations, and carry on discussion” 39 is an example to<br />
explain data collecting/sharing platform operated by the public.<br />
Following is a description about the webpage:<br />
[T]he goal of the site is to support collaboration around visualizations at a large<br />
scale by fostering a social style of data analysis in which visualizations not only<br />
serve as a discovery tool for individuals but also as a medium to spur discussion<br />
among users. 40<br />
Figure 25. Many Eyes: “ a cleverly used stacked graph that shows relative differences in<br />
the type of postings on two online link aggregators, a world map showing the average<br />
account balance per capita, a bubble chart showing the size of the endowments of<br />
different US universities, and a tag cloud showing two word occurrences in the work of<br />
Yeats” 41<br />
39<br />
Viégas, Fernanda and B. Martin Wattenberg., al.,”Many Eyes: A Site for Visualization at<br />
Internet Scale’, 2007, p1121<br />
40<br />
Ibid. , p1121<br />
41<br />
Ibid. , p1124<br />
J.KIM_A LANDSCAPE <strong>OF</strong> EVENTS 34
Experiments I have been exploring data as a new material that can be a<br />
different way of observing and representing ordinary life and realities.<br />
With a deep interest in data and data visualization, last year (2007) I took<br />
classes on basic GIS, Database Aesthetics, Computer Programming and<br />
Statistical Computing to learn and understand more about data<br />
visualization and associated techniques. Here are three experiments that I<br />
conducted during the past year.<br />
Lovecity 42 was a simple group experiment with the main purpose of<br />
finding the physical locations of people registered on the website<br />
www.lovecity.com. We explored the website and were able to get<br />
information about the age, sex, interests and location of users. Various<br />
programs were used to obtain and manage this data, such as Python for<br />
scraping and parsing data from the web, Stata for the statistical analysis of<br />
the data, Filemaker for cleaning up the data, and ArcGIS 43 to map the<br />
data.<br />
Figure 26. Red/Blue colors represent Female/Male’s numbers and locations in the website<br />
This was a good practice, but when I thought about data visualization<br />
as a creative practice, there should be more interesting ways of visualizing<br />
these data. After this experiment, I started to look at creating more<br />
42<br />
During DMA Database Aesthetics class (2007, Spring Pro. Mark Hansen)<br />
43<br />
http://www.esri.com/software/arcgis/index.html (ArcGIS is an integrated collection of<br />
software products for all your GIS needs. It provides a standards-based platform for your<br />
work on the Web, mobile devices, and desktop applications.) (accessed Mar 24, 2008)<br />
J.KIM_A LANDSCAPE <strong>OF</strong> EVENTS 35
innovative ways of visualizing data with other content, rather than simply<br />
directly representing data, and using computer screens as the dominant<br />
form.<br />
Weekly YouTube 44 was created as a group project during the<br />
Statistical Computing class with Statistics Department students at<br />
<strong>UCLA</strong>. Interesting starting points for this project included using<br />
text-based data instead of numeric data, and representing it as an old<br />
media form (a paper), although the data is from a new media<br />
platform, the YouTube.com website. We stored data from the<br />
website for one week, and were able to analyze a portion of each of<br />
the main categories, the most viewed, and people’s comments about<br />
particular videos during the period. We mainly used Python<br />
Beautiful Soup 45 software for this project to store as well as other<br />
tools such as MySQL and R to analyze the stored data. Possible tools<br />
that can be used for this kind of projects will be discussed in the next<br />
chapter.<br />
Figure 27. Analyzed categories<br />
from the YouTube website<br />
during one week period<br />
Figure 28. The portions of pages depend on the relevant percentages of the categories<br />
44<br />
Fall, 2007 (Pro. Mark Hansen)<br />
45<br />
http://www.crummy.com/software/BeautifulSoup/ (accessed March.12.2008) Beautiful<br />
Soup is a Python HTML/XML parser designed for quick turnaround projects like screenscraping<br />
J.KIM_A LANDSCAPE <strong>OF</strong> EVENTS 36
Figure 29. Case Study of<br />
Terrain Analysis based on<br />
DEM: Mt.St.Helens, 2007,<br />
Spring<br />
Isles Blossom 46 was the next experiment I conducted is a landscape<br />
visualization that uses geographic data obtained by remote sensing. Each<br />
screen of this work represents various perspectives and subjective<br />
distortions of islands. After thinking about the process of generation of<br />
the data, I thought about trying to blur the data and adding noises to the<br />
already filtered data. This work was especially inspired by Asian<br />
traditional landscape paintings which have various perspectives in one<br />
painting using a vertical format. I downloaded numeric Digital Elevation<br />
Models (DEM) 47 data from the USGS (U.S. Geological Survey) 48 , and<br />
produced a 3D model with a program called ArsGIS. The processes are set<br />
out below:<br />
DEM(Digital elevation model) contains an array of elevation measurements,<br />
usually organized as a square or rectangular grid. This process of creating a<br />
DEM in the ArcGIS environment can be divided into three phases:<br />
1) acquisition of the DEM data from a secondary source<br />
2) converting the DEM into a format ArcGIS can work with<br />
3) the creation of shadedrelief models, slope and aspect maps and isolines for<br />
topographic maps. 49<br />
Figure 30. Case Study: Combined view from five different perspectives (San Francisco Bay<br />
Area)<br />
46<br />
During DMA Design|Media Art Studio class (2007, Spring, Pro. Rebeca Méndez)<br />
47<br />
A digital elevation model (DEM) is a digital representation of ground surface topography<br />
or terrain. DEMs are commonly built using remote sensing techniques, however, they may<br />
also be built from land surveying. [Wiki] The USGS Digital Elevation Model (DEM) data<br />
files are digital representations of cartographic information.<br />
48<br />
http://www.usgs.gov/(accessed Mar 24, 2008)<br />
49<br />
GIS class notes, 2007, spring<br />
J.KIM_A LANDSCAPE <strong>OF</strong> EVENTS 37
Figure 32. Isles Blossom,<br />
2007, Details<br />
Figure 31. Isles Blossom, 2007, Inkjet Print, 24*90 inch (Each),<br />
Islands in US (From Left: Long Island, San Juan, Hawaii)<br />
J.KIM_A LANDSCAPE <strong>OF</strong> EVENTS 38
Figure 33. Q.S.<br />
Serafijn / NOX, D-<br />
Tower, Netherlands,<br />
2003<br />
*A coherent hybrid of<br />
different media where<br />
architecture is part of a<br />
larger interactive system<br />
of relationships.<br />
Visualization without screens Data is invisible and there are<br />
many visualization methods that can make it visible. As a result,<br />
collected data from our real world is transformed to the virtual world.<br />
Data becomes trapped in the virtual world. People can only interact<br />
with it through a computer. Given the importance of data in our<br />
ordinary lives, the ways in which we visualize data is too limited.<br />
Why not try to bring out the data in the real world again,<br />
representing it in pure space through real movement in the form of<br />
nature Such represnetations begin to perform a natural behavior<br />
and/or natural production. ‘D-tower’ conceived by artist Q.S.<br />
Serafijn and architect Lars Spuybroek/NOX-Architekten in<br />
Netherlands is one good example that shows not only data generated<br />
by the public (e.g., people’s everyday emotions) but also consequently<br />
changes in color state of the sculpture everyday.<br />
Kinetic Information Sculpture Interestingly, at the end of his<br />
PhD dissertation, Ben Fry mentions a different form of information<br />
visualization called kinetic information sculpture. “A step further<br />
would look at how to make the visualization of data more like a kind<br />
of ‘kinetic information sculpture’.” 50 In his book, Virilio also states<br />
that sculpture and new land art are important esthetic subjects in this<br />
media-oriented society. Also, in his master’s thesis, Casey Reas<br />
proposed behavioral kinetic sculpture as a new method of interaction<br />
in this digital world:<br />
[A]s the decade’s progress, we will find ourselves interacting with machines<br />
more and more frequently, but what will be the qualities of these interactions<br />
Through integrating information processing technologies into kinetic sculpture<br />
we are able to explore new methods and properties of interaction…. 51<br />
To avoid using privileged visual methods such as media screens and/or<br />
ink on paper and to provide a more reliable representation of nature, in<br />
my project, I tried to use a new method to visualize data–a physical system<br />
Figure 34. Casey<br />
Reas, Trundle, 2001<br />
51<br />
Reas, Casey. “Behavioral Kinetic Sculpture” MS diss., Massachusetts Institute of Technology,<br />
Program in Media Arts & Sciences, 2001<br />
J.KIM_A LANDSCAPE <strong>OF</strong> EVENTS 39
which has real time kinetic movement. In this thesis, I am proposing this<br />
kinetic information visualization as a new form of data visualization that<br />
can reveal and transfer data in the physical form and in real space.<br />
3.2. New Realities<br />
In contemporary society, we have to adjust to new realities (i.e. virtual,<br />
hyper, mixed, and hybrid realities) of the plethora of the mass media in<br />
contemporary urban life. With life in various realities, like Jean<br />
Baudrillard said, “the surrounding universe and our very bodies are<br />
becoming monitoring screens,” the landscape around us now unfolds as a<br />
screen. In his book, The Ecstasy of Communication, Baudrillard stated,<br />
“The landscape, the immense geographical landscape seems a vast, barren<br />
body whose very expanse is unnecessary (even off the highway it is boring<br />
to cross), from the moment that all events are concentrated in the cities,<br />
which are also being reduced to several extremely miniaturized high<br />
places.” 52<br />
In cities, people are becoming consumer-driven, and our bodies have to<br />
deal with various media screens, from the screens of TVs to those of<br />
mobile phones. However, it is impossible to judge such a media evaluation<br />
either positively or negatively. Baudrillard proposed an interesting idea<br />
about the image and screen in our modern life, which he referred to as<br />
‘hyper-reality.’ In the book Continental Philosophy, editors McNeill and<br />
Feldman describe this concept:<br />
Figure 35. Herbert Bayer,<br />
Diagram of the Field of Vision,<br />
1930<br />
[B]audrillard argued that technological existence unfolds as the<br />
presentation of simulacra, that is, of images that correspond to no<br />
underlying reality or truth, but operate as a play of signification in which it<br />
becomes increasingly impossible to identify any original or<br />
uncontaminated reality. Where reality becomes virtualized in this manner,<br />
there the virtual and the real became fused, existence has been<br />
transformed into what Baudrillard called “hyperreality”. 53<br />
52<br />
Baudrillard, Jean, The Ecstasy of Communication. Translated by Bernard and Caroline<br />
Schutze, Semiotext(e), 1988, p19<br />
53<br />
McNeill, William and Karen S. Feldman., ed., Continental Philosophy: an anthology.<br />
Blackwell, 1998. p443<br />
J.KIM_A LANDSCAPE <strong>OF</strong> EVENTS 40
In addition, with his concept of hyperreality, the development of<br />
locative media, such as mobile devices, navigation systems with global<br />
positioning systems, and ubiquitous computing environments, has in<br />
recent times blurred not only the gap between image and reality, but also<br />
the gap between virtual and real. Adriana de Souza e Silva provides a good<br />
summary of the social transitions caused by these technologies in his<br />
article, “From Cyber to Hybrid: Mobile Technologies as Interfaces of<br />
Hybrid Spaces”<br />
[T]he internet undeniably opened our consciousness to the possibility of<br />
large-scale communities known as multiuse environment, which were not<br />
confined to the same physical place. The cell phone has been frequently<br />
studied as a means of two-way communication, whereby private spaces<br />
are created inside public spaces [Gergen, 2002; Plant, 2001; Puro,<br />
2002]. 54 .<br />
Again, in my thesis project, instead of visualizing data as a graphical<br />
representation in the virtual world, the goal is to explore the different<br />
ways of observing, documenting, and visualizing not only those<br />
phenomena but also the processes themselves in the hybrid world. Within<br />
the discourse of materiality, how physical material characteristics are<br />
perceived through human senses is an important subject for my research.<br />
Figure 36. Diagrams of Hyper reality within the Contest of the Real-Virtual Continuum 55<br />
54<br />
Adriana de Souza e Silva, "From Cyber to Hybrid: Mobile Technologies as Interfaces of<br />
Hybrid Spaces", Space and Culture, Vol. 9, No. 3. 2006, p272<br />
55<br />
Ibid. , p266<br />
J.KIM_A LANDSCAPE <strong>OF</strong> EVENTS 41
A Landscape of Events<br />
Details, May/Nov.2008<br />
<strong>Los</strong> <strong>Angeles</strong>, USA
4. A Landscape of Events<br />
The complex urban life makes people look for something else<br />
- an event, escape, and the world of utopia.<br />
JOSEPH CORNELL<br />
Process The project is divided into three main parts: (a) a virtual process<br />
– analysis of data and methodology for investigation, which is part of the<br />
traditional process of information visualization, (b) a physical process –<br />
developing mechanical systems for representing near -time data<br />
movements of natural events, and (c) a hybrid process – combining the<br />
aesthetic components that connect virtual and physical processes. The<br />
project combines and intertwines not only the fields of technology and art,<br />
but also the virtual and the real.<br />
Error!<br />
J.KIM_A LANDSCAPE <strong>OF</strong> EVENTS 43
4.1. Virtual Process: Data and Tools<br />
Data In his PhD dissertation, Computational Information Design, Ben<br />
Fry proposed seven stages of information visualization in order to make<br />
his process accessible to a wider audience; “a tool is introduced to simplify<br />
the computational process for beginners and can be used as a sketching<br />
platform by more advanced users.” 56 For my thesis project, the first<br />
influential idea concerning this process is the possibility and flexibility to<br />
visualize data as on my own; this led me to the topic I chose for my thesis<br />
project. However, as I stated above, my project is not visualizing data as a<br />
screen-based representation, but as a physical kinetic information<br />
visualization/installation.<br />
For this project, I started with Fry’s stages to explore and manage my<br />
dataset, and the stages that he proposed are as follows:<br />
[A]cquire–Parse–Filter–Mine–Represent–Refine–Interact 57<br />
Figure 37. Initial idea sketches<br />
for rainfall and tide dataset.<br />
1. acquire: the matter of obtaining the data, whether from a file on a disk<br />
or from a source over a network.<br />
2. parse: providing some structure around what the data means, ordering<br />
it into categories.<br />
3. filter: removing all but the data of interest.<br />
4. mine: the application of methods from statistics or data mining, as a<br />
way to discern patterns or place the data in mathematical context.<br />
5. represent: determination of a simple representation, whether the data<br />
takes one of many shapes such as a bar graph, list, or tree.<br />
6. refine: improvements to the basic representation to make it clearer and<br />
more visually engaging.<br />
7. interact: the addition of methods for manipulating the data or<br />
controlling what features are visible.<br />
In my project, I followed 6 stages from ‘acquire’ to ‘refine’. Before<br />
starting the first step, I took an additional step – analyzing datasets to<br />
check the suitability of my project. I needed a dataset that is updating in<br />
real time and is generally from a location. Although my project is not<br />
56<br />
Fry, Ben. “Computational Information design.” PhD diss., Massachusetts Institute of<br />
Technology, Program in Media Arts & Sciences, 2004<br />
57<br />
Fry, “Computational Information design.”, 2004<br />
J.KIM_A LANDSCAPE <strong>OF</strong> EVENTS 44
about using data for a scientific purpose, this stage was important for me<br />
to prepare and understand structures and characters of the data prior to<br />
starting the next steps. First, I analyzed a dataset from the NOAA Ocean<br />
Wind Buoy Center. 58 Their website provides data acquired from buoys<br />
form all over the world and is updated in near real time. As a result of this<br />
stage, I found that there are twelve types of data structures in the NOAA<br />
website. Among them, four types of data structures provide wind data,<br />
which are wind speed and direction. The website currently provides<br />
updated data from over 700 stations, and 465 stations provide wind data<br />
(data fields: cwind, drift, supl, and txt). I used some programming<br />
languages for this step and I will briefly describe the many tools used for<br />
this stage in the next paragraph.<br />
Figure 38. Twelve types of data<br />
structures form NOAA’s website<br />
Wind Unit<br />
A standard unit<br />
1 km/h = 0.278 m/sec<br />
= 0.621 mph(mile/h)<br />
= 0.540 kn(knot)=0.911 ft/sec<br />
1 m/sec 2 kn,<br />
1 kn 1852 m/h<br />
1 m/s = 3,6 km/h<br />
= 1,944 knots<br />
= 2,237 miles per hour<br />
Figure 39. Four types of data structures with wind speed (WSPD) and direction (WSPD)<br />
58<br />
http://www.ndbc.noaa.gov/ (accessed Febrary.03.2008)<br />
J.KIM_A LANDSCAPE <strong>OF</strong> EVENTS 45
Tools In fall 2007, I took a course called Statistical Computing from<br />
Mark Hansen in the <strong>UCLA</strong> Statistics Department. During this class, he<br />
introduced tools that could be used in different ways for different<br />
purposes and explore the artifacts of communication. An outline of these<br />
tools is given below:<br />
[E]macs, Unix tools, Python<br />
Regular expressions, manipulating text<br />
R, data types, basic computations, writing functions, objects and methods<br />
Code distribution, R packages, software licenses<br />
Scripting visualization via Processing<br />
Databases, SQL, R interface to MySQL, XML<br />
Statistical computation in real-time systems<br />
Figure 40. Beaufort wind<br />
scale is an empirical<br />
measure for describing wind<br />
speed based mainly on<br />
observed sea conditions.<br />
[Wiki]<br />
For my data analysis stage, I mainly used Python urllib, 59 which is<br />
scripting language, to acquire and parse the large sample data from the<br />
website. R 60 , an integrated suite of software facilities was used for data<br />
manipulation, calculation and graphical display of samples. Next, like Ben<br />
Fry, I used Processing 61 as a necessary supplementary component.<br />
Figure 41. Examples of wind data analysis for 4weeks: station 40007<br />
In my project, I used Python to get and update data continuously (in<br />
this project, every 10min). The Python module saves each station’s<br />
updated data files in the proceeding data folder. Processing was used to get<br />
data and phase it and send signals to Arduino 62 and simulate data on the<br />
computer screen.<br />
59<br />
http://www.python.org/ (accessed March.12.2008)<br />
60<br />
http://www.r-project.org/ (accessed March.12.2008)<br />
61<br />
http://processing.org/ (accessed March.12.2008) Processing is a simple programming<br />
environment that was created to make it easier to develop visually oriented applications.<br />
62<br />
http://www.arduino.cc/ (accessed March.20.2008)<br />
J.KIM_A LANDSCAPE <strong>OF</strong> EVENTS 46
Figure 42. Historical wind data analysis from NOAA:<br />
From this, I can set the maximum and minimum values of wind speed in my program.<br />
Figure 43. Possible data stations near west coastline:<br />
Different color s show different timelines (updating timelines are form 6min to one hour).<br />
J.KIM_A LANDSCAPE <strong>OF</strong> EVENTS 47
Figure 44. Wind Observation and Visualization: 6 Stations from South Carolina Coastline<br />
NOAA Station: 41012, 41008, 41004, 41013, 41036, 41025<br />
Data Acquired: Dec.16. 2007<br />
Figure 45. Wind Observation and Visualization: 12 Stations from South Carolina Coastline<br />
NOAA Station: 41012, 41008, 41004, 41013, 41036, 41025, 44014, 44009, 44017, 44013, 44007, 44027<br />
Data Acquired : Dec.16. 2007<br />
J.KIM_A LANDSCAPE <strong>OF</strong> EVENTS 48
4.2. Physical Process: Mechanical System<br />
After the data analysis stage, I started looking for a specific system that<br />
I could apply to my concept – a kinetic information sculpture that can<br />
create physical motion out of data. For data, I would input values for realtime<br />
wind speed and direction. The values would be naturally derived<br />
input controlling the device. It would have the realistic coordination,<br />
location, and movement of natural phenomena. First, I thought of a<br />
system that could mark X and Y coordinates on a plate, like CNC<br />
machines and old plotters.<br />
Figure 46. NIMS( Networked<br />
InfoMechanical System), Per<br />
Henrik Borgstrom, <strong>UCLA</strong><br />
(sourse: NIMS paper)<br />
*Advanced system with tension<br />
controllers.<br />
Figure 48. Karlsruhe, You Don’t<br />
Matter, 2008<br />
*A plotting machine into an output<br />
device, that can draw, scratch or cut<br />
Plotter System Uli Franke and Jürg Lehni's Hektor 63 and NIMS-PL<br />
from the Department of Electrical Engineering at <strong>UCLA</strong> are inspirational<br />
projects that use a similar system. I had a chance to visit NIMS-PL lab and<br />
see the cabled robotic system, “which has been used for a diverse amount<br />
of applications such as environmental sensing, search and rescue, sports<br />
and entertainment, and air vehicle<br />
simulators.” 64 I also talked to a developer<br />
of the machine, who gave me<br />
information and idea about making the<br />
kind of plotter system I wanted. After I<br />
had visited the lab, I immediately started<br />
to construct my little robot. During the<br />
process, I had dozens of decisions to<br />
make and many problems to solve.<br />
Figure 47. Uli Franke and Jürg Lehni's,<br />
Hektor, 2002<br />
*Hektor is light and fragile installation consists of<br />
two motors, toothed belts and a can holder that<br />
handles regular spray cans.<br />
Basically, I used two stepper motors to control the length of the cables,<br />
and two keychain retractors to function in place of gravity. Of course,<br />
using four motors is more accurate for controlling positions, but I had to<br />
be conservative with my budget at that time. Fortunately, I had a chance<br />
to develop a machine with the four stepper motors after the exhibition.<br />
Stepper motors were mounted onto the aluminum sheet along two edges<br />
of the rectangle. They move cables to control position by pulling and<br />
63<br />
http://www.hektor.ch/ (accessed May.22.2008)<br />
64<br />
Energy Based Path Planning for a Novel Cabled Robotic System.<br />
http://research.cens.ucla.edu/areas/2005/NIMS/ (accessed May.22.2008)<br />
J.KIM_A LANDSCAPE <strong>OF</strong> EVENTS 49
eleasing. I used a coated stainless cable for its flexibility and corrosion<br />
resistance.<br />
Figure 49.<br />
A moving device sketch<br />
Figure 51. Equations were used to<br />
get step numbers to run motors<br />
and transform them to the real<br />
world situation.<br />
[Example Code]<br />
Distances<br />
Figure 50.<br />
Ideas for movements<br />
distance_1[i]=sqrt(2*sq(L)2*L*(map(s,0,MAXsp,0,L))*<br />
(cos(radians(d))+sin(radians(d)))+sq(map(s,0,MAXsp,0,L)));<br />
// i=station, l= a radius of a aluminum sheet, MAXsp= a maximum wind speed<br />
Step Numbers<br />
intmotor_1=(int)(200*(dis_1(sqrt(2)*L))/PI*D);<br />
// for a 200step motor<br />
J.KIM_A LANDSCAPE <strong>OF</strong> EVENTS 50
Module System My intent was to make the piece a modular system –<br />
able to be rearranged, modified, expanded or reduced like the media itself<br />
(aluminum size, length of cable, etc.). The modules also could be joined<br />
together to produce a map of data collection locations.<br />
Figure 52. Module Diagram<br />
Figure 53.<br />
First module prototype<br />
[<br />
Figure 54. Module Prototype<br />
(Power Supplies, 2 sets of arduino+2stepper Motors, Water Pump)<br />
Controlling Stepper Motor Motors are simple and useful for making<br />
realistic animation and motion in the physical environment. There are<br />
various types of motors, such as DC motors, servos motors, gearedhead<br />
motors, and stepper motors – each motor has different characteristics and<br />
J.KIM_A LANDSCAPE <strong>OF</strong> EVENTS 51
applications. These motors basically create rotary motion, and it is<br />
possible to convert it to run mechanical devices such as levers, pulleys, and<br />
gears. Stepper motors are used for my project to control precisely X-Y<br />
coordination on the aluminum sheet.<br />
Figure 55. Japan<br />
Servo Stepper Motor<br />
KH56KM2-901<br />
With a microcontroller –<br />
arduino 65 board – I was able to<br />
control the steps per degrees of<br />
the stepper motors, and they can<br />
translate the steps into linear<br />
distances. They can very useful<br />
for moving a precise distance or a<br />
specific number of rotations. 66<br />
The general concepts of stepper<br />
motors are below.<br />
Figure 56. ULN2004 transistor<br />
[T]he stepper motor combines both precise positioning and a full 360-degree<br />
range of motion. Stepper motors move in discrete steps around a circle. For<br />
example a 200step motor moves 360 degrees in 200 steps (1.8 degrees per<br />
backward. They have reasonably good torque, as well. However, they are more<br />
complex to connect than other motors. 67<br />
Figure 57. Assembled<br />
circuit<br />
Figure 58. Unipolar connection diagram (KH56KM2-901)<br />
65<br />
http://www.arduino.cc/ (accessed May.22.2008)<br />
66<br />
O'Sullivan, Dan. and Tom Igoe. Physical Computing: Sensing and Controlling the<br />
Physical World with Computers. Course Technology PTR, 2004, p260<br />
67<br />
O'Sullivan, Dan., Physical Computing, p250<br />
J.KIM_A LANDSCAPE <strong>OF</strong> EVENTS 52
Figure 59. Two weeks running test<br />
12 motors (KH56KM2) with 3arduinos and 1 power supply (3V/40AMP)<br />
Figure 60. NPN<br />
transistor<br />
Washer Pump To control salt water, windshield washer pumps for cars<br />
are used. They usually require 12V of electricity to function, but 5V of<br />
power was enough to pump water up to 4 inches from underneath of an<br />
aluminum sheet.<br />
Figure 61. Tip 120, an NPN transistor, with diode (1N5399) was used to control the<br />
amount of water and time for the pump.<br />
Figure 62. Windshield<br />
washer pump<br />
manufactured by<br />
CRP-Contitech/Meyle.<br />
Special Electrical Needs of Motors (power supply) Like other<br />
motors, stepper motors need more power than the arduino type of<br />
microcontroller. Because motors draw so much current when they start<br />
up, they affect the current going to the circuit that controls them. To<br />
avoid this problem, I used bigger power supply than required because the<br />
efficiency of power supplies may be lower than the labeled description.<br />
Some tips I learned during the creation of my installations are (1) use<br />
regulated supplies, which ensures that the voltage will not drop as the<br />
current increases (2) use switching supplies which are more efficient than<br />
linear ones; however, depending on the product, SMPS’s (Switching<br />
Mode Power Supplies’) efficiencies vary, and (3) use decoupling capacitors.<br />
J.KIM_A LANDSCAPE <strong>OF</strong> EVENTS 53
4.3. Aesthetic Process: Forms and Materials<br />
Kinetic Information System In terms of visualizing the data in my<br />
project, there are two main ways of data visualization – the kinetic<br />
movements of the present which occur as a real time movement by means<br />
of a plotter system, and the tracing of past movements which corrode<br />
sheets of aluminum. In his MS thesis, Behavioral Kinetic Sculpture, Casey<br />
Reas explains the word Kinematics “as the study of motion unattached to<br />
forces or objects” and Kinetics “as motions resulting from forces directly<br />
connected with physical systems.” 68<br />
In my work, the motions represent the presence and the trace visualizes<br />
the history of the presence. I can call the system as being a real-time<br />
kinetic information system. As a final form, the project is like a space,<br />
environment and nature. The movement is transformed from ocean wind<br />
data (virtual, but from real data) to the real world. When the wind breeze<br />
is light, the device moves slowly, and the water pump spouts out a small<br />
amount of water, while the behavior is fast and strong when the wind<br />
breezes strongly.<br />
Corrosion Despite the degree of control that the system will have, I was<br />
willing to let the system produce some unpredictable effects, so that the<br />
results of visualizing the natural data in this way will be unexpected, like<br />
nature itself. What I hope to do is represent natural phenomena using<br />
nature itself – not by using unnatural graphical patterns or paint. I am<br />
looking for something from nature itself, particularly related wind, in this<br />
project. During wind data research, I was looking for phenomena with<br />
wind which is my first series of data. After research, I found one interest<br />
method which is galvanic corrosion, one common form of corrosion in<br />
marine environments.<br />
Figure 63. Andy Warhol,<br />
Copper Oxidation<br />
Galvanic corrosion is an electrochemical process, in which one metal<br />
corrodes preferentially with another, when the two (or more) dissimilar<br />
metals come in contact with an electrolyte solution such as slat water. I<br />
68<br />
Reas, Casey. “Behavioral Kinetic Sculpture” MS diss., Massachusetts Institute of<br />
Technology, Program in Media Arts & Sciences, 2001, p.20<br />
J.KIM_A LANDSCAPE <strong>OF</strong> EVENTS 54
felt that the corrosion on the artificial materials resembled the connection<br />
between the artificial human and nature.<br />
Figure 64. Galvanic Series Table: I<br />
used aluminum (+) and<br />
stainless steel(-).<br />
I experimented with the distance between the positive and negative<br />
poles (the aluminum and the stainless steel) in the salt/baking powder<br />
water. I also applied many different power supplies, from 3V to 6V.<br />
Higher voltage/current produced more gases (oxygen and hydrogen),<br />
created more oxidation and heat – it is almost like a short circuit. For this<br />
project, I used 5V DC and 350 milliamps power supplies and it was fine<br />
for a week [based on personal communication with Eric Graham (Center<br />
for Embedded Networked Sensing)].<br />
Figure 65. Setting for the first<br />
corrosion test (aluminum + steel<br />
wool) in March 2008<br />
Figure 66. Setting for the corrosion<br />
test<br />
J.KIM_A LANDSCAPE <strong>OF</strong> EVENTS 55
Figure 67. Results form the second corrosion test as time passes<br />
After the exhibition, I had the opportunity to develop the system<br />
further. I was able to run modules for more than a week; wind traces were<br />
overlaid again and again, and the aluminum sheet was deeply corroded.<br />
The salt water coagulated after being pumped out from underneath the<br />
aluminum sheet, and the combination of salt water, an electrolyte, and the<br />
thread of the moving device led to some visible secretions. I did not expect<br />
the exact results when I started, but the experiment was interesting<br />
enough. When I looked at the system for a while, I surprisingly had a<br />
similar feeling to when I saw a seascape on a boat. It feels like being in<br />
nature itself, and in a kind of minimized space.<br />
J.KIM_A LANDSCAPE <strong>OF</strong> EVENTS 56
Figure 69.<br />
Immaterial | Ultramaterial,<br />
Toshiro Mori<br />
Materials My project replaces this ‘virtual’ information with the<br />
‘hybrid’ world. I think dealing with physical materials is getting<br />
important because we are losing a sense for the real materials as screenbased<br />
media make us involved the virtual world. For this project, I have<br />
used raw materials of everyday life instead of commercial<br />
materials/products and they maybe all in the daily object not only for<br />
me but also other people who live in cities. Materials such as aluminum,<br />
stainless, concrete, wood, plastic, and cable were used which are<br />
materials that we see and touch everyday, like nature.<br />
Fabrication Fabrication, is one of my current interests, by which I<br />
mean producing something that is not a commercial product to sell and<br />
buy in this capital society. In ordinary life, especially in an urban setting,<br />
we sometimes need to buy these products to survive. It is easy to forget<br />
what they are made from and the only see the finished products. Thus,<br />
for this project, I used raw materials from our surroundings and<br />
fabrication technologies.<br />
Figure 70. 3D CNC<br />
Milting Test (During<br />
Tech-Seminar 2008,<br />
Winter )<br />
In winter 2008, I took Tech Seminar course in the <strong>UCLA</strong><br />
Architecture Department, and had access to their fabrication<br />
equipments such as a laser cutter, a 3D printer, and 2D/3D milling<br />
machines that “enable the production of physical objects directly from<br />
digital models, allowing for new forms and aesthetics of space.” 69 For<br />
this project, I used a laser cutter for labeling wind buoy stations of each<br />
concrete frame that I molded. Assembled Modules visualize selected<br />
stations of real-time data.<br />
Figure 71. Laser cutting for labeling<br />
69<br />
http://www.generatorx.no/category/digital-fabrication/ (accessed November 10. 2008)<br />
J.KIM_A LANDSCAPE <strong>OF</strong> EVENTS 57
Figure72. Initial Mapping<br />
plans<br />
Installation Again, the wind just exists as things ‘between’ everything, in<br />
the middle, amid considerations as a potential territory. To present this<br />
concept effectively, it took me a long time to decide things such as the size<br />
of the module, the thickness of the aluminum sheet, the height of the<br />
cement frame and so on. These were decided both according to my<br />
personal aesthetic sense, and for functional reasons. If possible, I have a<br />
concept of applying this work to physical public spaces in the future, for<br />
example to the exterior facades of buildings. Imagine living in outer space,<br />
or in a new type of living space such as in Foster’s Crystal Island; there<br />
should be other types of nature in the ordinary environment rather than<br />
landscape paintings and photographs.<br />
Figure 73. Final Mapping diagram with 10 stations<br />
J.KIM_A LANDSCAPE <strong>OF</strong> EVENTS 58
Molding concrete frames and preparing installation, April-May.2008<br />
Installation room, DMA at <strong>UCLA</strong>, <strong>Los</strong> <strong>Angeles</strong>, USA
A Landscape of Events, Installation View, May.2008<br />
Opening Reception (up), Critic (down), New Wight Gallery, <strong>Los</strong> <strong>Angeles</strong>, USA<br />
Photography by Rebeca Méndez
5. Conclusion<br />
A Landscape of Events<br />
Before the exhibition, I had a tight schedule to develop the robot, build<br />
the installation, and solve the problems involved in doing so. I have not<br />
yet had the chance to think about the shape of results and how people will<br />
react. Exhibiting this project in the gallery was a good opportunity to<br />
observe peoples’ reactions as well as the results of corrosion. Both hearing<br />
from people and watching traces of corrosion were delightful experiences.<br />
One Canadian woman, Dawn, said that she would like to sit for a while<br />
near the installation, and take a rest while thinking, imaging, reading and<br />
whatever. That was one of the best comments I received, and exactly what<br />
I had been looking for.<br />
James Turrell said in his statement in Mapping Space, “I am interested<br />
in posing questions than in answering them.” One purposes of the project<br />
is to explore natural scapes that can pose questions as opposed to<br />
answering and explaining them, like nature itself. Likewise, I encourage<br />
viewers to question their sense of the surroundings, I am questioning it<br />
myself - how can there be virtual without real, human without nature,<br />
here without there, today without tomorrow and yesterday, and always<br />
without never How can we recognize them This project is to explore<br />
landscapes within contemporary urban and art context and interrogate<br />
J.KIM_A LANDSCAPE <strong>OF</strong> EVENTS 61
the physical and emotional aspects of our current engagements with<br />
technologies.<br />
This thesis and its accompanying project is an attempt to explore<br />
visualizing (near) real-time data as a physical form beyond media screens.<br />
To avoid using privileged visual method and to provide a more reliable<br />
representation of nature, I used real time kinetic movements and<br />
corrosion instead of drawing with ink on papers or screens. My work is<br />
the place of an enormous ‘gap’. The ‘gap’ allows imagination and it<br />
belongs to a dimension of reality, nature or a city in a strict sense.<br />
My belief is that this project can be applied to physical public spaces in<br />
the future. For example, it could be installed inside/outside of Foster’s<br />
building as a different approach to nature. It also could be used as a public<br />
sculpture, a façade/skin of building, or even a form of mobile device that<br />
people can bring everywhere. People experience nature indirectly and<br />
their everyday physical experience is usually in the space of cities. When<br />
the project is embedded in cities in a different form from media screens, I<br />
believe that the project can create the gap that recreates a different urban<br />
context.<br />
<br />
<br />
<br />
<br />
<br />
<br />
<br />
J.KIM_A LANDSCAPE <strong>OF</strong> EVENTS 62
A Landscape of Events New Wight Gallery, <strong>Los</strong> <strong>Angeles</strong>, USA
Bibliography<br />
Auge, Marc. Non-places: introduction to an anthropology of supermodernity.<br />
Translated by John Howe. London and New York: Verso, 1995.<br />
Baas, Jacquelynn and Mary Jane Jacob, ed., Buddha mind in contemporary art.<br />
Berkeley: University of California Press, 2004.<br />
Bachelard, Gaston. Air and Dreams: An Essay on the Imagination of Movement.<br />
Translated by Edith R. Farrell and C. Frederick Farrell. Dallas: Dallas Institute<br />
Publications, Dallas Institute of Humanities and Culture, 1988<br />
Bachelard, Gaston. The poetics of space. Translated by Maria Jolas. Boston: Beacon<br />
Press, 1994<br />
Baudrillard, Jean. The Ecstasy of Communication. Translated by Bernard and<br />
Caroline Schutze. New York: Semiotext(e), 1988.<br />
Bernhardsen, Tom. Geographic Information Systems: An Introduction. New York:<br />
Wiley; 3 edition, 2002<br />
Bertin, Jacques. Semiology of Graphics: Diagrams, Networks, Maps. Translated by<br />
William J. Berg. Madison, Wis: University of Wisconsin Press, 1983<br />
Bishop, Ian D. and Eckart Lange, ed., Visualization in landscape and<br />
environmental planning. London and New York: Taylor and Francis, 2005<br />
Burnham, Jack. Beyond modern sculpture; the effects of science and technology on the<br />
sculpture of this century. New York: G. Braziller, 1973<br />
Fry, Ben. Visualizing Data. Sebastopol: O’Reilly, 2007<br />
Guattari, Felix. Chaosmosis: an ethico-aesthetic paradigm. Bloomington: Indiana<br />
University Press, 1995<br />
Guattari, Felix. The three ecologies. London: The Athlone Press, 2001<br />
J.KIM_A LANDSCAPE <strong>OF</strong> EVENTS 64
Jones, Caroline A, ed., Sensorium: Embodied Experience, Technology, and<br />
Contemporary Art. Cambridge: The MIT Press, 2006<br />
Kastner, Jeffrey, ed., Land and environmental art. London: Phaidon Press, 1998<br />
May, Susan. Olafur Eliasson: The Weather Project. London: Tate, 2004<br />
O'Sullivan, Dan. and Tom Igoe. Physical Computing: Sensing and Controlling the<br />
Physical World with Computers. Thomson Course Technology PTR, 2004<br />
Pickles, John. A History of Spaces: Cartographic Reason, Mapping, and the Geo-<br />
Codes World. London and New York: Routledge, 2003<br />
Reas, Casey and Ben Fry. Processing: A Programming Handbook for Visual<br />
Designers and Artists. Cambridge: The MIT Press, 2007<br />
Richter, Gerhard. Atlas. Koln: Verlag der Buchhandlung Walther Konig; New<br />
York: D.A.P/Distributed Art Publishers, 2006.<br />
Tufnell, Ben. Land Art. London: Tate Publishing, 2007<br />
Tufte, Edward R. Beautiful Evidence. Cheshire, Conn.: Graphics Press, 2006<br />
Tufte, Edward R. Envisioning Information. Cheshire, Conn.: Graphics Press, 1990.<br />
Virilio, Paul. A Landscape of Events. Translated by Julie Rose. Cambridge: The<br />
MIT Press, 2000<br />
Virilio, Paul and James Turrell., al. James Turrell : the other horizon Ostfildern-<br />
Ruit. Cantz ; New York: Distribution in the US, D.A.P., c1999.<br />
Journal articles<br />
Adriana de Souza e Silva, "From Cyber to Hybrid: Mobile Technologies as<br />
Interfaces of Hybrid Spaces." Space and Culture, Vol. 9, No. 3. Aug, 2006, p261-<br />
278.<br />
Fry, Ben. “Computational Information design.” PhD diss., Massachusetts<br />
Institute of Technology, Program in Media Arts & Sciences, 2004<br />
J.KIM_A LANDSCAPE <strong>OF</strong> EVENTS 65
Potere, David and Annemarie Schneider. “A critical look at representations of<br />
urban areas in global maps.” GeoJournal, 2007, p 55-80<br />
Loon, Van J. “Social spatialization and everyday life.” Space and Culture, vol.5,<br />
no.2, p88-95, 2002<br />
Sui, Daniel Z and Michael F, Goodchild. “GIS as media.” International Journal<br />
of Geographical Information Science, 2001<br />
Reas, Casey. “Behavioral Kinetic Sculpture.” MS diss., Massachusetts Institute of<br />
Technology, Program in Media Arts & Sciences, 2001<br />
Yoon, Hong-key. “An early Chinese Idea of a Dynamic Environmental Cycle.”<br />
GeoJournal 10.2, 1985, p211-212<br />
Borgstrom, Per Henrik.“Energy Based Path Planning for a Novel Cabled Robotic<br />
System.” 2007<br />
Viégas, Fernanda and B. Martin Wattenberg., al., “Many Eyes: A Site for<br />
Visualization at Internet Scale.” Visualization and Computer Graphics, IEEE<br />
Volume 13, Issue 6, Nov-Dec, p1121 – 1128, 2007<br />
Haque, “Hardspace, softspace and the possibilities of open source architecture”,<br />
www.haque.co.uk, 2002 (accessed Mar 24, 2008)<br />
Web references<br />
http://www.ndbc.noaa.gov/ (accessed Febrary.03.2008)<br />
http://www.r-project.org/ (accessed March.12.2008)<br />
http://processing.org/ (accessed March.12.2008)<br />
http://www.arduino.cc/ (accessed March.20.2008)<br />
http://www.crummy.com/software/BeautifulSoup/ (accessed March.12.2008)<br />
http://www.tate.org.uk/modern/exhibitions/eliasson/default.htm (accessed<br />
March.02.2008)<br />
Magazine<br />
ARTFORUM, Summer 2008, XLVI, NO. 10<br />
J.KIM_A LANDSCAPE <strong>OF</strong> EVENTS 66
Figures<br />
Figure 1. Hans Haacke, Wind and Water Sculpture, Tri-Quarterly Supplement,<br />
1967 (www.leftmatrix.com)<br />
Figure 2. Carl Andre, 2 (1H x 12S), Aluminum Double Twelver, 1999<br />
(www.rulegallery.com/andre3.html)<br />
Figure 3. James Turrell, Roden Crater, near Flagstaff, Arizona, in progress since<br />
1980 (www.marin.cc.ca.us/.../EarthworksStudyImages.htm)<br />
Figure 4. Walter De Maria, The Equal Area Series, 1976-77<br />
(www.diacenter.org/exhibs_b/demaria/)<br />
Figure 5. A Landscape of Events, 2008<br />
Figure 6. Ned Kahn. Technorama Facade, The Swiss Science Center, Switzerland.<br />
2002 (nedkahn.com/sand.html)<br />
Figure 7. Komar & Melamid, Most Wanted and Least Wanted Paintings, 1995<br />
(www.diacenter.org/km/intro.html)<br />
Figure 8. Roni Horn, The library of water, 2007<br />
(www.artangel.org.uk/.../present_library.htm)<br />
Figure 9. Marcel Duchamp, Rotoreliefs, 1935<br />
(www.toutfait.com/.../betancourt/betancourt.html)<br />
Figure 10. Olafur Eliasson, The weather project, Tate Modern, 2003-4<br />
(www.archinect.com)<br />
Figure 11. Norman Foster, Crystal Island, 2007<br />
(www.fosterandpartners.com/News/324/Default.aspx)<br />
Figure 12. View of cities from Google Earth, 2008<br />
Figure 13. Archigram, Plug-in City, 1964<br />
Figure 14. Blast Theory, Can You See Me Now, UK, 2001<br />
(www.blasttheory.co.uk/)<br />
Figure 15. Rafael Lozano-Hemmer, Under Scan, 2005 (www.lozanohemmer.com/eproyecto.html)<br />
Figure 16. Diagrammatic interpretation of the early Chinese idea of an<br />
environmental cycle<br />
Figure 17. Wind Flow (between West and East)<br />
Figure 18. Yves Klein, RP5, Globe Terrestre Bleu, 37.5 * 24.5 * 21.5cm , 1962<br />
Figure 19. To bring the real world into GIS, one has to make of simplified models<br />
of the real world.<br />
Figure 20. What a wonderful world it would be.<br />
Figure 21. Several levels of generalization have to be carried out in order to<br />
represent the real world on a map.<br />
Figure 22. Mark Hansen/ Ben Rubin, Listening Post, 2004<br />
(dma.ucla.edu/gallery/faculty_gallery.phpID=69)<br />
J.KIM_A LANDSCAPE <strong>OF</strong> EVENTS 67
Figure 23. Golan Levin and RSG, JJ (Empathic Network Visualization), 2002<br />
(www.flong.com/projects/jj/)<br />
Figure 24. FundRace.org, an online tool with which users can seek information on<br />
local donations (fundrace.org)<br />
Figure 25. Many Eyes<br />
Figure 26. Red/Blue colors represent Female/Male’s numbers and locations in the<br />
website<br />
Figure 27. Analyzed categories from the YouTube website during one week<br />
period<br />
Figure 28. The portions of pages depend on the relevant percentages of the<br />
categories<br />
Figure 29. Case Study of Terrain Analysis based on DEM: Mt.St.Helens, 2007<br />
(During GIS class)<br />
Figure 30. Case Study: Combined view from five different perspectives (San<br />
Francisco Bay Area)<br />
Figure 31. Isles Blossom, 2007, Inkjet Print, 24*90 inch (Each), Islands in US<br />
(From Left: Long Island, San Juan, Hawaii)<br />
Figure 32. Isles Blossom, 2007, Details<br />
Figure 33. Q.S. Serafijn / NOX, D-Tower, 2003 (www.d-toren.nl/site/)<br />
Figure 34. Casey Reas, Trundle, 2001 (source: his MS thesis)<br />
Figure 35. Herbert Bayer, Diagram of the Field of Vision, 1930<br />
Figure 36. Diagrams of Hyper reality within the Contest of the Real-Virtual<br />
Continuum<br />
Figure 37. Initial idea sketches for rainfall and tide dataset<br />
Figure 38. Twelve types of data structures form NOAA’s website<br />
Figure 39. Four types of data structures with wind speed (WSPD) and direction<br />
(WSPD)<br />
Figure 40. Beaufort wind scale<br />
Figure 41. Examples of wind data analysis for 4weeks: station 40007<br />
Figure 42. Historical wind data analysis from NOAA<br />
Figure 43. Possible data stations near west coastline<br />
Figure 44. Wind Observation and Visualization: 6 Stations from South Carolina<br />
Coastline<br />
Figure 45. Wind Observation and Visualization: 12 Stations from South Carolina<br />
Coastline<br />
Figure 46. NIMS( Networked InfoMechanical System), Per Henrik Borgstrom,<br />
<strong>UCLA</strong><br />
Figure 47. Uli Franke and Jürg Lehni's, Hektor, 2002 (www.hektor.ch)<br />
Figure 48. Karlsruhe, You Don’t Matter, 2008<br />
(youdontmatter.com/index.php/plottingmachine/painting-plotter-/)<br />
Figure 49. A moving device sketch<br />
Figure 50. Ideas for movements<br />
Figure 51. Equations<br />
Figure 52. Module Diagram<br />
J.KIM_A LANDSCAPE <strong>OF</strong> EVENTS 68
Figure 53. First module prototype<br />
Figure 54. Module prototype<br />
Figure 55. Japan Servo Stepper Motor KH56KM2-901<br />
Figure 56. ULN2004 transistor<br />
Figure 57. Assembled circuit<br />
Figure 58. Unipolar connection diagram (KH56KM2-901)<br />
Figure 59. Two weeks running test<br />
Figure 60. NPN transistor<br />
Figure 61. Tip 120<br />
Figure 62. Windshield washer pump manufactured by CRP-Contitech/Meyle<br />
Figure 63. Andy Warhol, Copper Oxidation.<br />
(iaaa.nl/cursusAA&AI/nature.html)<br />
Figure 64. Galvanic Series Table: I used aluminum (+) and stainless steel (-)<br />
Figure 65. Setting for the first corrosion test (aluminum + steel wool) in March<br />
2008<br />
Figure 66. Setting for the corrosion test<br />
Figure 67. Results form the second corrosion test as time passes<br />
Figure 68. Some visible secretions on the aluminum sheet with corrosion<br />
Figure 69. Immaterial | Ultramaterial, Toshiro Mori<br />
Figure 70. 3D CNC Milting Test (During Tech-Seminar 2008, winter)<br />
Figure 71. Laser cutting for labeling<br />
Figure 72. Initial Mapping plans<br />
Figure 73. Final Mapping diagram with 10 stations<br />
J.KIM_A LANDSCAPE <strong>OF</strong> EVENTS 69
\<br />
The moving device, after 7days, Oct, 2008