Trading the Opening Range - The Swing Trading Guide
Trading the Opening Range - The Swing Trading Guide
Trading the Opening Range - The Swing Trading Guide

Create successful ePaper yourself
Turn your PDF publications into a flip-book with our unique Google optimized e-Paper software.
<strong>Trading</strong> <strong>the</strong> 10 O’clock Bulls<br />
Winning Strategies for Active Traders<br />
by<br />
Geoff Bysshe<br />
www.DataViewLLC.com<br />
First Edition 1.02<br />
Copyright 2004 © by DataView, LLC. All rights reserved.<br />
This publication is designed to provide accurate and<br />
authoritative information in regard to <strong>the</strong> subject matter<br />
covered. It is distributed with <strong>the</strong> understanding that <strong>the</strong><br />
author and/or publisher are not engaged in rendering<br />
professional services. If professional advice or o<strong>the</strong>r expert<br />
assistance is required, <strong>the</strong> services of a competent<br />
professional person should be sought.<br />
http://www.dataviewllc.com/
Contents<br />
Acknowledgements ................................................................................. 1<br />
Introduction........................................................................................... 2<br />
Chapter 1. <strong>The</strong> Driving Force Behind Any Market Move................................ 4<br />
What You Need to Know to Be Successful in <strong>the</strong> Markets ............. 4<br />
Sentiment Is <strong>the</strong> Driving Force Behind All Major Price Moves........ 5<br />
How to Use <strong>the</strong> Power of Market Sentiment in Your <strong>Trading</strong> ......... 6<br />
Chapter 2. Why is <strong>the</strong> <strong>Opening</strong> <strong>Range</strong> (OR) so Important........................... 7<br />
Is <strong>the</strong> OR Fundamental or Technical Analysis ........................... 7<br />
What is <strong>the</strong> OR .................................................................... 8<br />
Why is <strong>the</strong> OR So Powerful .................................................... 9<br />
<strong>The</strong> OR Is Used by <strong>the</strong> World’s Most Successful Traders .............10<br />
Is OR <strong>Trading</strong> for You ..........................................................10<br />
Chapter 3. Basic Technical Analysis .........................................................11<br />
Understanding <strong>the</strong> Price and Volume Relationship .....................11<br />
What is a <strong>Swing</strong> High or Low ................................................13<br />
How to Identify <strong>the</strong> Trend Using <strong>Swing</strong>s...................................14<br />
Support and Resistance Simplified ..........................................15<br />
Don’t Over-Analyze <strong>the</strong> Charts ...............................................21<br />
Chapter 4. Assessing <strong>the</strong> <strong>Opening</strong> <strong>Range</strong> (OR)..........................................22<br />
Getting Started with <strong>the</strong> OR ...................................................22<br />
Three Questions for Analyzing <strong>the</strong> OR......................................24<br />
Don’t Ignore <strong>the</strong> Stock’s Big Picture ........................................29<br />
Chapter 5. <strong>Trading</strong> Breakouts and Breakdowns .........................................30<br />
How to Define Your Risk, and Where to Place Your Stop .............30<br />
Three Tactical <strong>Trading</strong> Approaches for <strong>the</strong> OR Breakout .............31<br />
What to Look for in a Breakout ...............................................34<br />
Don’t Chase <strong>the</strong> One that Got Away ........................................41<br />
Chapter 6. <strong>Trading</strong> <strong>the</strong> <strong>Range</strong>—Buying <strong>the</strong> Lows .......................................42<br />
What is Fading <strong>the</strong> OR .........................................................42<br />
Using <strong>the</strong> OR to Buy Against <strong>the</strong> Low of <strong>the</strong> Day .......................42<br />
Using <strong>the</strong> OR to Measure Intraday Relative Strength..................45<br />
Chapter 7. How to Find OR <strong>Trading</strong> Opportunities......................................48<br />
How to Use Market Scanning Tools Effectively...........................48<br />
A Quick Explanation of HotScans’ Functionality .........................50<br />
How to Find OR <strong>Trading</strong> Setups with HotScans..........................54<br />
Three Strategies for Catching OR Breakouts .............................56<br />
Finding Stocks Before <strong>The</strong>y Break Out .....................................62<br />
Finding Candidates for Fading <strong>the</strong> OR Low................................64<br />
Catching <strong>the</strong> OR Low.............................................................66<br />
Conclusion............................................................................................69<br />
http://www.dataviewllc.com/
Acknowledgements<br />
This book would never have been finished without <strong>the</strong> tremendous effort of Susan<br />
Jankowitz of Sparta Technology Associates, Inc. Susan’s assistance in writing,<br />
organizing, and keeping <strong>the</strong> project moving forward was invaluable. I grossly<br />
underestimated <strong>the</strong> amount of time it would take to put toge<strong>the</strong>r this book, and had I<br />
not had Susan <strong>the</strong>re pushing and pulling me through <strong>the</strong> process, this project would<br />
have been reduced to a few newsletters. Sue, thank you for taking so much time away<br />
from your own technical writing consulting business (www.spartatech.com) to help me<br />
with this book.<br />
This book is based on trading experience. As you will learn in <strong>the</strong> pages to follow, my<br />
trading experience began on <strong>the</strong> floor of <strong>the</strong> commodities exchanges in New York with<br />
Keith Schneider in 1990. Remarkably, Keith and I are still working and trading<br />
toge<strong>the</strong>r at DataView, LLC. While I may be <strong>the</strong> person who has written <strong>the</strong> words that<br />
follow, <strong>the</strong> content is <strong>the</strong> result and reflection of this truly remarkable partnership.<br />
Thank you Keith for making this all possible.<br />
I also owe a great deal of thanks to Arthur Stevenson, Ph.D., who spent countless<br />
hours assisting in <strong>the</strong> editorial process and helping me express my thoughts as clearly<br />
as possible. Thank you Arthur for dramatically improving <strong>the</strong> quality of this work.<br />
I’m also very grateful for <strong>the</strong> patience of my wonderful wife, Susan, who has<br />
experienced many lonely nights and weekends during this process. Thank you Susan<br />
for your loving support.<br />
<strong>The</strong>re are many more individuals who supported and assisted in this effort to produce<br />
a book that will help traders gain new insight into <strong>the</strong> markets and improve <strong>the</strong>ir<br />
trading skills. I hope you will feel that we have achieved our goal.<br />
Geoff Bysshe<br />
February 2004<br />
http://www.dataviewllc.com/ 1
Introduction<br />
Welcome to <strong>Trading</strong> <strong>the</strong> 10 O’clock Bulls: Winning Strategies for Active Traders. This<br />
book was started as a series of responses to <strong>the</strong> many questions I have received<br />
about trading from our customers at DataView, LLC. DataView will be mentioned<br />
occasionally throughout this book because it is a big contributor to <strong>the</strong> information and<br />
insights provided in <strong>the</strong>se pages. DataView, LLC was founded by myself and Keith<br />
Schneider in 1995 while we were fund managers at Millennium Partners in New York.<br />
DataView’s mission has always been to deliver to serious traders <strong>the</strong> professional<br />
trading tools we develop and use to find trading opportunities based on unusual price<br />
and volume activity in <strong>the</strong> market indexes, sectors, industry groups and stocks. If you<br />
are interested in DataView’s tools or background you can find all <strong>the</strong> information you’ll<br />
want at www.DataViewLLC.com. For now I’d like to get you started on <strong>the</strong> book!<br />
As a student of <strong>the</strong> market, former floor trader and hedge fund manager, and as a<br />
software developer, I enjoy <strong>the</strong> exchange of trading ideas and market insights. This<br />
desire to share market insights slowly transformed what was intended to be a series of<br />
articles into this book and a more organized answer to <strong>the</strong> question all traders should<br />
always be asking <strong>the</strong>mselves, how can I improve my trading<br />
I believe that one of <strong>the</strong> most important ingredients to success in trading is focus.<br />
Following this belief, this book is primarily focused on one important market principle<br />
that can improve your trading, <strong>the</strong> <strong>Opening</strong> <strong>Range</strong>. <strong>The</strong>re are a few prerequisites to<br />
being able to fully appreciate <strong>the</strong> power of <strong>the</strong> <strong>Opening</strong> <strong>Range</strong> trading approach so<br />
<strong>the</strong>se prerequisites will also be discussed, but <strong>the</strong> intent of this book is not to be a<br />
comprehensive guide to trading. As such, and in an effort to stay focused, this book<br />
will not discuss one very important ingredient in successful trading - money<br />
management. While <strong>the</strong> book will describe how <strong>the</strong> <strong>Opening</strong> <strong>Range</strong> principle is great at<br />
identifying risk and evaluating trades based on well-defined risk/reward parameters, I<br />
have not dedicated a separate chapter to <strong>the</strong> topic of defining risk, managing your<br />
money, and controlling your emotions. If you are familiar with <strong>the</strong>se trading issues<br />
you will quickly see how <strong>the</strong> <strong>Opening</strong> <strong>Range</strong> trading approach offers a very disciplined,<br />
low-risk approach to trading. If you are a novice trader or you are not familiar with<br />
sound methods of money management <strong>the</strong>n I strongly suggest that you invest some<br />
time in educating yourself about money management in trading.<br />
Whe<strong>the</strong>r you’re a seasoned trader or new to <strong>the</strong> stock market, I hope this book helps<br />
you to become a more profitable trader. More specifically, I hope that through this<br />
book you will discover new insights into how and why markets move <strong>the</strong> way <strong>the</strong>y do<br />
intraday, and also gain a new methodology for finding trading opportunities based on<br />
a stock’s intraday price swings. If you are a novice trader this book will provide you<br />
with <strong>the</strong> foundation and background needed to understand all <strong>the</strong> principles discussed<br />
here. For <strong>the</strong> experienced trader <strong>the</strong> book is organized in such a way that you can<br />
simply focus on <strong>the</strong> chapters that you feel will offer you <strong>the</strong> most insight.<br />
<strong>The</strong> focus of <strong>the</strong> book is on intraday price and volume activity but <strong>the</strong> applications of<br />
<strong>the</strong> principles discussed are in no way limited to day trading. <strong>The</strong> <strong>Opening</strong> <strong>Range</strong> can<br />
be used to determine swing trade entry points, trailing stops, and exit points. In many<br />
cases <strong>the</strong> techniques discussed here have prevented me from entering swing trades<br />
too early or exiting <strong>the</strong>m too late.<br />
How This Book Is Organized<br />
This book begins with an explanation as to why any market should be viewed as a<br />
reflection of <strong>the</strong> sentiment of <strong>the</strong> market’s traders and investors. For as long as<br />
markets are traded by people, movements in a market’s price will be dictated by <strong>the</strong><br />
http://www.dataviewllc.com/ 2
sentiment of <strong>the</strong> market participants. <strong>The</strong> <strong>Opening</strong> <strong>Range</strong> principle serves as a road<br />
map for identifying and exploiting price changes that are driven by shifts in market<br />
sentiment.<br />
Chapter 2 introduces <strong>the</strong> concept of <strong>the</strong> <strong>Opening</strong> <strong>Range</strong>. This is not a complex<br />
concept. I believe a trading strategy should make sense intuitively. This chapter will<br />
explain and demonstrate how and why this simple concept works.<br />
Chapter 3 is what I have referred to as prerequisite information. <strong>The</strong> <strong>Opening</strong> <strong>Range</strong><br />
trading approach uses some basic technical analysis. If you are not familiar with<br />
reading charts, or identifying support and resistance levels on charts, <strong>the</strong>n this<br />
chapter is required reading for you. For <strong>the</strong> more experienced technical trader this<br />
chapter will offer a review of <strong>the</strong> basics and perhaps some insight into how to simplify<br />
<strong>the</strong> process of reading <strong>the</strong> charts for <strong>the</strong> purpose of trading <strong>the</strong> <strong>Opening</strong> <strong>Range</strong>.<br />
<strong>The</strong> next three chapters, 4-6, will explain how <strong>the</strong> <strong>Opening</strong> <strong>Range</strong> provides a trading<br />
road map for every stock everyday. <strong>The</strong>se chapters provide detailed descriptions of<br />
what to look for and how to find it when it comes to spotting trading opportunities.<br />
<strong>The</strong> <strong>Opening</strong> <strong>Range</strong> offers many ways to follow momentum, long and short, or buy<br />
weakness and sell strength. <strong>The</strong>se chapters will outline (with examples) a low-risk,<br />
high-reward, systematic approach to trading.<br />
Finally, <strong>the</strong>re will always be tools that make your job as a trader easier and more<br />
efficient. Chapter 7 will show you a tool that will make exploiting <strong>the</strong> opportunities of<br />
<strong>Opening</strong> <strong>Range</strong> as easy as <strong>the</strong> markets will allow.<br />
Throughout this book I will refer to <strong>the</strong> “market”. I use <strong>the</strong> word market to describe<br />
any trading activity. <strong>The</strong> activity may be for a particular stock, index or futures<br />
contract. For example, <strong>the</strong> trading in a stock will be referred to as <strong>the</strong> market for that<br />
stock.<br />
Without any fur<strong>the</strong>r delay, let’s get started.<br />
http://www.dataviewllc.com/ 3
Chapter 1. <strong>The</strong> Driving Force Behind Any Market Move<br />
• What You Need to Know to Be Successful in <strong>the</strong> Markets<br />
• Sentiment Is <strong>the</strong> Driving Force Behind All Major Price Moves<br />
• How to Use <strong>the</strong> Power of Market Sentiment in Your <strong>Trading</strong><br />
What You Need to Know to Be Successful in <strong>the</strong> Markets<br />
In 1990 I got lucky. After years of watching <strong>the</strong> markets through <strong>the</strong> media,<br />
newspapers and books, I started working on <strong>the</strong> floor of <strong>the</strong> New York Commodities<br />
Exchange. My job was to be <strong>the</strong> assistant of a very successful independent floor<br />
trader, Keith Schneider. Keith had been trading on <strong>the</strong> floor since 1977. At <strong>the</strong> time<br />
<strong>the</strong> floor of <strong>the</strong> exchange was home to many futures markets including crude oil, gold,<br />
silver, coffee, sugar, cocoa, cotton, <strong>the</strong> dollar index and more. His trading approach<br />
was extremely disciplined and involved trading multiple markets at once. My main<br />
responsibilities were to help keep track of <strong>the</strong> price movements of markets and place<br />
orders in <strong>the</strong> markets he was trading. Keith was more of a mentor than a boss, and<br />
my responsibilities always felt more like an apprenticeship than a job. Now, 14 years<br />
later we are still working toge<strong>the</strong>r as partners, and <strong>the</strong>refore this book is a reflection<br />
of his trading experiences as well as mine.<br />
I still consider myself fortunate to have been able to start work on <strong>the</strong> floor of <strong>the</strong><br />
Commodities Exchange, because trading on <strong>the</strong> floor lets you experience first hand <strong>the</strong><br />
sights, sounds, and even <strong>the</strong> smell of <strong>the</strong> most powerful forces in any market – fear<br />
and greed. <strong>Trading</strong> on <strong>the</strong> floor also forces you to watch <strong>the</strong> market through <strong>the</strong><br />
actions of <strong>the</strong> participants, as opposed to sitting at a desk following <strong>the</strong> market<br />
through <strong>the</strong> analysis of charts and quote screens. <strong>The</strong> best way to describe <strong>the</strong><br />
difference between trading on <strong>the</strong> floor versus trading from “upstairs” on a computer<br />
is to relate it to a sporting event. Think of <strong>the</strong> difference between being at <strong>the</strong> stadium<br />
during <strong>the</strong> last few minutes of a very close basketball, football, or baseball game<br />
where <strong>the</strong> crowd roars with each twist and turn of <strong>the</strong> game, versus sitting at home<br />
watching it on television. <strong>The</strong>re is no comparison. At <strong>the</strong> stadium you can feel <strong>the</strong><br />
excitement; on <strong>the</strong> trading floor you can sense <strong>the</strong> mood of <strong>the</strong> market.<br />
<strong>The</strong> best part about my experience on <strong>the</strong> floor was that it taught me <strong>the</strong> most<br />
important principle in understanding what makes traders successful. I believe every<br />
successful trader learns this principle or intuitively knows it, and <strong>the</strong>n confirms it<br />
through experience. This principle is that <strong>the</strong>re is really only one underlying marketmoving<br />
force in any stock, index, futures contract, etc. This underlying force is <strong>the</strong><br />
source of every significant price move. <strong>The</strong> underlying force is market sentiment or<br />
<strong>the</strong> market’s mood. If you analyze markets from <strong>the</strong> perspective that every significant<br />
move in a stock’s price is dictated by <strong>the</strong> sentiment surrounding that stock <strong>the</strong>n all of<br />
<strong>the</strong> traditional reasons - news, earnings, <strong>the</strong> economy, etc. make more sense.<br />
<strong>Trading</strong> on <strong>the</strong> floor makes this principle easier to see because every day <strong>the</strong> market’s<br />
mood or sentiment is revealed by its trading activity. As a trader you must look at <strong>the</strong><br />
trading action (<strong>the</strong> price and volume movements) of <strong>the</strong> market as if it was sending<br />
you a message. <strong>The</strong> message is <strong>the</strong> market telling you why and how it moved. For<br />
example did it move quickly with a lot of volume and emotion (fear or greed) Did it<br />
drift in one direction slowly and quietly How did it react immediately after a news<br />
announcement Did it reverse its initial reaction <strong>The</strong> trading floor was an<br />
environment that forced me to experience this message every day. Like <strong>the</strong> emotional<br />
roar of <strong>the</strong> crowd at <strong>the</strong> stadium, <strong>the</strong> intensity of <strong>the</strong> trading activity on <strong>the</strong> floor<br />
http://www.dataviewllc.com/ 4
eflected <strong>the</strong> message of <strong>the</strong> market and it could not be ignored. More importantly <strong>the</strong><br />
message I heard and saw on <strong>the</strong> floor often seemed different than <strong>the</strong> explanations of<br />
<strong>the</strong> day’s activity being reported on <strong>the</strong> evening news, in newspapers and in books.<br />
Fur<strong>the</strong>rmore, experiencing <strong>the</strong> market’s reactions to news events, economic reports<br />
and earnings announcements forced me to rethink much of what I thought I<br />
understood from reading so many books about charts, company valuations, and <strong>the</strong><br />
economy. For example why do stocks with strong earnings often see <strong>the</strong>ir share prices<br />
fall dramatically Why is bad economic news often followed by a stock market rally<br />
<strong>The</strong> answer to <strong>the</strong>se questions lies in market sentiment.<br />
Sentiment Is <strong>the</strong> Driving Force Behind All Major Price Moves<br />
A stock’s sentiment is <strong>the</strong> collective sentiment of <strong>the</strong> traders and investors who have<br />
positions or are considering entering positions in <strong>the</strong> stock. But sentiment is not<br />
simply <strong>the</strong> current mood of traders and investors. Sentiment is <strong>the</strong> prevailing<br />
expectations of <strong>the</strong> market for <strong>the</strong> future prospects of <strong>the</strong> stock. In o<strong>the</strong>r words,<br />
sentiment represents bullish or bearish feelings for <strong>the</strong> future prospects of a stock.<br />
This means <strong>the</strong> current movements of a stock’s price are dictated by what <strong>the</strong> market<br />
expects will happen in <strong>the</strong> future, not what has already taken place! Any news is old<br />
news, any reported earnings data is old information. I’m sure you’ve heard <strong>the</strong><br />
expression, “<strong>the</strong> market is always looking forward.” This is not just a saying. It’s a rule<br />
to trade by and it must be applied to be successful in <strong>the</strong> markets.<br />
To apply <strong>the</strong> principle of trading in conjunction with market sentiment you should look<br />
at a stock’s price action with <strong>the</strong> intent of answering two questions. Is <strong>the</strong> stock<br />
trading in a way that demonstrates that its sentiment is bullish, bearish or undecided<br />
And, is <strong>the</strong>re any reason for it to be trading this way (i.e. news) With answers to<br />
<strong>the</strong>se two questions you can begin to gauge <strong>the</strong> sentiment of <strong>the</strong> stock. This book will<br />
go into more detail about how to interpret price action as it relates to sentiment and<br />
how to trade based on this knowledge. <strong>The</strong> simple explanation can be found in some<br />
common sayings with which you are familiar. For example, “buy <strong>the</strong> rumor sell <strong>the</strong><br />
news”. Let’s look at an example of this phrase. Often a stock experiences a bullish run<br />
for days, but <strong>the</strong>n a piece of good news is announced and <strong>the</strong> stock sells off hard,<br />
erasing <strong>the</strong> gains of <strong>the</strong> last few days. In this scenario, if you had bought <strong>the</strong> stock<br />
when <strong>the</strong> news came out you would have lost money. Why does this happen Simple.<br />
<strong>The</strong> market participants were expecting or knew that <strong>the</strong>re was a chance that good<br />
news would come out in <strong>the</strong> near future. As a result <strong>the</strong>y had good reason to be<br />
bullish on <strong>the</strong> stock’s price and this sentiment drove <strong>the</strong> price of <strong>the</strong> stock higher.<br />
When news is released traders and investors must decide if <strong>the</strong> news was as good as<br />
expected and <strong>the</strong>n fur<strong>the</strong>r assess whe<strong>the</strong>r <strong>the</strong>re is more potentially good news on <strong>the</strong><br />
horizon. If <strong>the</strong>y can’t expect fur<strong>the</strong>r good news <strong>the</strong>n <strong>the</strong>y will become less bullish and<br />
take profits. If <strong>the</strong> news was not as good as <strong>the</strong>y had hoped <strong>the</strong>ir sentiment may turn<br />
bearish. Any shift in sentiment that would lead traders to become less bullish will<br />
create <strong>the</strong> desire to sell and that will tend to push <strong>the</strong> price of <strong>the</strong> stock lower.<br />
Market sentiment exists on many levels. <strong>The</strong>re is sentiment that is directly related to<br />
<strong>the</strong> prospects of a specific company. <strong>The</strong>re is also sentiment based on <strong>the</strong> company’s<br />
industry group, and <strong>the</strong>re is sentiment regarding <strong>the</strong> condition of <strong>the</strong> whole market.<br />
One of <strong>the</strong> most obvious examples of industry group sentiment was <strong>the</strong> Internet<br />
bubble in <strong>the</strong> late 90’s. During this time a company needed only to put a “.com” at <strong>the</strong><br />
end of its name and sentiment for <strong>the</strong> stock would become insanely bullish, and as a<br />
result <strong>the</strong> share price would climb. As you know, when <strong>the</strong> market is said to be in a<br />
bull market it means that share prices in general are rising. Share prices will not rise<br />
unless <strong>the</strong> underlying sentiment of <strong>the</strong> market is bullish or improving. In a strong bull<br />
market <strong>the</strong> overall market sentiment can be strong enough to create increasingly<br />
http://www.dataviewllc.com/ 5
ullish sentiment for industry groups and individual stocks. When this occurs it seems<br />
as though every stock is going up regardless of its specific prospects looking forward.<br />
How to Use <strong>the</strong> Power of Market Sentiment in Your <strong>Trading</strong><br />
Now that you know that it is not <strong>the</strong> news that is driving <strong>the</strong> markets but instead<br />
changes in market sentiment, how do you identify when sentiment is changing for <strong>the</strong><br />
better or worse Based on <strong>the</strong> many years of experience Keith Schneider and I have<br />
had as floor traders, money managers, and software developers of trading software,<br />
we believe we know <strong>the</strong> answer.<br />
One of <strong>the</strong> most successful trading principles we have employed as floor traders and<br />
hedge fund managers is to identify key price points in <strong>the</strong> market where market<br />
sentiment is likely to lead to a change in <strong>the</strong> stock’s short term direction or an<br />
acceleration of its current momentum. By using <strong>the</strong>se key inflection points one can<br />
read market sentiment, anticipate a stock’s next move and quickly assess which<br />
stocks are currently offering <strong>the</strong> best trading opportunities based on an analysis of risk<br />
versus reward.<br />
I call this trading principle <strong>the</strong> <strong>Opening</strong> <strong>Range</strong> (OR) trading approach. I do not claim to<br />
be <strong>the</strong> trader who discovered <strong>the</strong> <strong>Opening</strong> <strong>Range</strong>. In fact, I’m happy to say that it has<br />
been used by many very successful professional traders for a long time. Whe<strong>the</strong>r you<br />
are just getting started in trading or you are an experienced trader you can benefit<br />
from understanding how <strong>the</strong> <strong>Opening</strong> <strong>Range</strong> affects a stock’s movements during <strong>the</strong><br />
day. <strong>The</strong> <strong>Opening</strong> <strong>Range</strong> trading approach provides a trading road map for <strong>the</strong> novice<br />
and experienced trader alike.<br />
http://www.dataviewllc.com/ 6
Chapter 2. Why is <strong>the</strong> <strong>Opening</strong> <strong>Range</strong> (OR) so Important<br />
• Is <strong>the</strong> OR Fundamental or Technical Analysis<br />
• What is <strong>the</strong> OR<br />
• Why is <strong>the</strong> OR So Powerful<br />
• <strong>The</strong> OR Is Used by <strong>the</strong> World’s Most Successful Traders<br />
• Is OR <strong>Trading</strong> for You<br />
Is <strong>the</strong> OR Fundamental or Technical Analysis<br />
Before we delve into <strong>Opening</strong> <strong>Range</strong> specifics, let’s put it in <strong>the</strong> perspective of<br />
traditional trading analysis approaches. <strong>The</strong>re are two major approaches to stock and<br />
market analysis – fundamental and technical analysis.<br />
Fundamental Analysis<br />
Fundamental analysis, when applied to stock selection, is <strong>the</strong> analytical method in<br />
which <strong>the</strong> economic value of <strong>the</strong> company or market is <strong>the</strong> primary determinant in<br />
making a trading or investment decision. A company’s revenues, earnings, assets and<br />
liabilities are analyzed to determine whe<strong>the</strong>r an investment opportunity exists.<br />
Fundamentalists believe <strong>the</strong> price of a stock will be driven by its underlying economic<br />
value. <strong>The</strong> objective as a fundamentalist is to buy stocks that are selling below <strong>the</strong>ir<br />
fair economic value, and sell stocks that are trading at valuations that exceed <strong>the</strong>ir fair<br />
economic value.<br />
While <strong>the</strong> fundamental approach sounds like an obvious and simple approach to<br />
investing, determining <strong>the</strong> economic value of a company is not an exact science. More<br />
often than not even professional analysts do not agree on <strong>the</strong> value of a particular<br />
company.<br />
<strong>The</strong> fundamental approach to analyzing stocks does have a lot of merit. In <strong>the</strong> long<br />
run a stock’s price will be dictated by its true economic value. However, as a trading<br />
approach it has a significant weakness. Even if you could correctly determine a<br />
company’s true economic value with absolute certainty <strong>the</strong> market may not agree with<br />
your “correct” assessment for a very long time. In fact, <strong>the</strong> market could undervalue<br />
or overvalue <strong>the</strong> stock for so long that your assessment of <strong>the</strong> true economic value<br />
may change before you have an opportunity to profit from your correct initial<br />
assessment. For example, if you buy a stock for $15 because you feel that bearish<br />
sentiment has driven its price below its true economic value of $20, and <strong>the</strong>n <strong>the</strong><br />
stock trades down to an even more undervalued level of $10 your fundamental<br />
analysis would indicate that it is an even better buy at $10. <strong>The</strong> stock may be a better<br />
value at $10 at that time. But what happens if <strong>the</strong> bearish sentiment continues to<br />
keep <strong>the</strong> stock at $10 for a year, and in that time <strong>the</strong> fundamental condition of <strong>the</strong><br />
stock deteriorates so much that now your analysis shows that <strong>the</strong> stock’s economic<br />
value has also declined to $10. You may have been correct that <strong>the</strong> stock was worth<br />
$20 when you bought it for $15, but now it’s trading for $10 and represents a 50%<br />
loss as an investment. Fur<strong>the</strong>rmore $10 is what you now think it is worth so not only<br />
did you never have a chance to profit from your correct fundamental analysis, but also<br />
your own analysis now indicates that you should not expect to make money on <strong>the</strong><br />
investment unless <strong>the</strong> stock becomes overvalued.<br />
http://www.dataviewllc.com/ 7
Technical Analysis<br />
Technical analysis is <strong>the</strong> method in which a stock’s or market’s historical price and<br />
volume action is <strong>the</strong> primary determinant in making a trading or investment decision.<br />
Technical analysts use charts and modelling techniques to identify price trends and<br />
patterns. Technical analysis is based on <strong>the</strong> belief that a stock’s price is driven by fear,<br />
greed, supply, demand and economic value. Fur<strong>the</strong>rmore, a technical analyst believes<br />
that <strong>the</strong>se market-moving factors create trading patterns in charts of market price and<br />
volume activity that reoccur over time. <strong>The</strong>se price and volume patterns are used to<br />
anticipate future price changes in a stock. An extreme technical analyst will say that<br />
you don’t need to look at anything but <strong>the</strong> charts; all known information is reflected in<br />
<strong>the</strong> charts.<br />
<strong>The</strong>re are many different variations of charts and technical indicators but <strong>the</strong>y all have<br />
<strong>the</strong> common belief that historical price and volume data can be used to indicate when<br />
a stock is under- or overvalued. A technical trader will determine a trade’s entry and<br />
exit points based on ei<strong>the</strong>r historical price levels on charts, projected price levels, time<br />
in a trade or some o<strong>the</strong>r similar type of information relating to time, price and/or<br />
volume.<br />
Many short-term traders have a bias towards some form of technical analysis. This<br />
makes sense. For short-term traders, worrying about fundamentals—how a company’s<br />
sales and earnings performed over <strong>the</strong> last few quarters—won’t have a quantifiable<br />
impact on <strong>the</strong> price of a stock over a period of hours or minutes.<br />
<strong>The</strong> <strong>Opening</strong> <strong>Range</strong> approach is a technical approach to <strong>the</strong> markets. It incorporates<br />
time, price and volume as inputs in determining <strong>the</strong> current bullish, bearish or neutral<br />
bias of <strong>the</strong> stock’s trading activity.<br />
What is <strong>the</strong> OR<br />
<strong>The</strong> <strong>Opening</strong> <strong>Range</strong> (OR) is defined in terms of time and price. <strong>The</strong> time element is<br />
simply <strong>the</strong> first X number of minutes in <strong>the</strong> trading day. <strong>The</strong> number of minutes used<br />
to define <strong>the</strong> <strong>Opening</strong> <strong>Range</strong> is your decision as a trader. In this book I define <strong>the</strong><br />
<strong>Opening</strong> <strong>Range</strong> as <strong>the</strong> first 30 minutes of <strong>the</strong> trading day. In my trading I use both <strong>the</strong><br />
first 5 minutes and <strong>the</strong> first 30 minutes because I have found <strong>the</strong>se periods to work<br />
<strong>the</strong> best for my strategies that are geared towards both swing trading and day<br />
trading. This book will focus on <strong>the</strong> 30-minute OR because I think that this is <strong>the</strong> best<br />
time frame for introducing <strong>the</strong> OR concept. A major reason for this belief is that <strong>the</strong><br />
markets tend to experience a reversal period around 10:00 AM EST, and <strong>the</strong>re are<br />
also economic reports that are released at 10:00 AM so <strong>the</strong> 30-minute OR includes<br />
both of <strong>the</strong>se factors.<br />
<strong>The</strong> price component of <strong>the</strong> OR is <strong>the</strong> day’s trading range at <strong>the</strong> end of <strong>the</strong> OR time<br />
period. This means that <strong>the</strong> 30-minute OR is defined as <strong>the</strong> stock’s high and low for<br />
<strong>the</strong> day at 10:00 AM. <strong>The</strong> OR is not <strong>the</strong> opening price. In fact, <strong>the</strong> opening price is not<br />
a factor in calculating <strong>the</strong> OR. For example, if Amazon, Inc were to open at $46.49<br />
and <strong>the</strong>n sell off to $46.06 at 9:45 AM and <strong>the</strong>n reverse and rally to $46.66 at 9:55<br />
AM and <strong>the</strong>n proceed to sell off into <strong>the</strong> middle of <strong>the</strong> day’s range until sometime after<br />
10:00 AM, its 30-minute OR would be <strong>the</strong> day’s range at 10:00 AM or $46.06 –<br />
$46.66. This is because during <strong>the</strong> 30-minute OR period $46.06 and $46.66 were<br />
Amazon’s low and high, respectively.<br />
http://www.dataviewllc.com/ 8
Why is <strong>the</strong> OR So Powerful<br />
As you can see, defining <strong>the</strong> OR is easy. <strong>The</strong> 30-minute OR is strictly <strong>the</strong> high and <strong>the</strong><br />
low of <strong>the</strong> first 30 minutes of trading. How can something so simple be so powerful<br />
<strong>The</strong> OR Reveals <strong>the</strong> Stock’s Bias for <strong>the</strong> Day<br />
During <strong>the</strong> first 30 minutes of <strong>the</strong> day’s trading traders and investors are reacting to<br />
any news <strong>the</strong>y have heard or analysis <strong>the</strong>y have done since <strong>the</strong> close of <strong>the</strong> prior day.<br />
This makes <strong>the</strong> opening period emotionally charged and informationally rich. I call it<br />
informationally rich because traders have had time to analyze <strong>the</strong> prior day’s price<br />
action, any overnight news, <strong>the</strong> morning’s economic reports and even <strong>the</strong> opening<br />
price action. Any or all of <strong>the</strong>se conditions can dramatically change a trader’s bullish or<br />
bearish sentiment. It is emotionally charged because it is <strong>the</strong> first chance traders have<br />
to trade based on <strong>the</strong>ir overnight conclusions. <strong>The</strong>refore, <strong>the</strong>re are a lot of potential<br />
reasons for <strong>the</strong> flurry of trading activity that occurs when <strong>the</strong> market opens.<br />
Sometimes this activity lasts a few seconds and sometimes it lasts all day. <strong>The</strong> initial<br />
flurry of activity will generally settle down by <strong>the</strong> end of <strong>the</strong> 30-minute OR period.<br />
I like to think of <strong>the</strong> <strong>Opening</strong> <strong>Range</strong> as <strong>the</strong> day’s “price discovery” period. <strong>The</strong> first 30<br />
minutes of trading is <strong>the</strong> period when <strong>the</strong> emotionally charged bulls and bears are<br />
battling for control of <strong>the</strong> stock for <strong>the</strong> day. This battle between <strong>the</strong> bulls and bears in<br />
<strong>the</strong> morning will often determine <strong>the</strong> most significant price levels for <strong>the</strong> rest of <strong>the</strong><br />
day. In o<strong>the</strong>r words, <strong>the</strong> OR defines <strong>the</strong> critical price inflection points for <strong>the</strong> day.<br />
<strong>The</strong> fact that <strong>the</strong> OR is such an emotionally charged and informationally rich period is<br />
also why <strong>the</strong> OR can determine <strong>the</strong> bias for <strong>the</strong> day as being bullish, bearish, or<br />
neutral. <strong>The</strong> OR represents <strong>the</strong> bulls and bears establishing <strong>the</strong>ir initial positions for<br />
<strong>the</strong> day. A move away from <strong>the</strong> OR indicates that one side is stronger than <strong>the</strong> o<strong>the</strong>r.<br />
When a stock moves above <strong>the</strong> OR <strong>the</strong> bulls are in control. This means <strong>the</strong> prevailing<br />
sentiment in <strong>the</strong> stock is bullish. <strong>The</strong> manner in which <strong>the</strong> stock breaks above and<br />
trades above <strong>the</strong> OR will indicate <strong>the</strong> strength of <strong>the</strong> bullish sentiment. <strong>The</strong> same but<br />
opposite analysis applies when a stock moves below its OR. A move below <strong>the</strong> OR<br />
indicates that <strong>the</strong> stock is weak and <strong>the</strong> bears are in control.<br />
<strong>The</strong> most basic application of <strong>the</strong> OR principle is that when a stock is trading above its<br />
<strong>Opening</strong> <strong>Range</strong> you should have a bullish bias, and when it is trading below its<br />
<strong>Opening</strong> <strong>Range</strong> you should have a bearish bias. After reading this book you will be<br />
able to quickly assess whe<strong>the</strong>r <strong>the</strong> stock is in a bullish, bearish or neutral condition by<br />
looking at its trading relative to its <strong>Opening</strong> <strong>Range</strong>. <strong>The</strong> application of this simple rule<br />
can focus your trading in such a way that will keep you in sync with <strong>the</strong> market’s<br />
sentiment. <strong>The</strong> upcoming chapters will describe how to apply and profit from this<br />
simple rule.<br />
<strong>The</strong> OR Provides Price Points for Identifying Opportunity and Risk<br />
<strong>The</strong> OR provides more than just a bias for <strong>the</strong> day. By identifying important price<br />
points at which you can anticipate a market reaction <strong>the</strong> OR provides a road map for<br />
many trading strategies. For example, if you knew that a stock was likely to continue<br />
higher when it trades above a certain price wouldn’t that enable you to prepare to buy<br />
<strong>the</strong> stock at just <strong>the</strong> right time and price Or, if you knew that a stock was likely to<br />
stop going down at a certain price wouldn’t that also help you to plan when you should<br />
purchase that stock More importantly, when you are long a stock do you know at<br />
what price <strong>the</strong> market is telling you that you are wrong to be long, and that you<br />
should take your losses before <strong>the</strong>y get worse Understanding how a stock trades<br />
relative to its <strong>Opening</strong> <strong>Range</strong> can help you get into trades at <strong>the</strong> right time and out of<br />
losing positions without big losses. OR trading strategies identify low-risk, highreward,<br />
trading opportunities.<br />
http://www.dataviewllc.com/ 9
<strong>The</strong> OR’s significance can be proven statistically<br />
I believe that keeping trading strategies simple is <strong>the</strong> best approach. Along <strong>the</strong> same<br />
lines, I believe that <strong>the</strong> fundamental premise of a trading strategy should be simple<br />
and intuitive. <strong>The</strong> <strong>Opening</strong> <strong>Range</strong> principle is based on <strong>the</strong> premise that <strong>the</strong> high and<br />
<strong>the</strong> low of <strong>the</strong> <strong>Opening</strong> <strong>Range</strong> are often significant price points for <strong>the</strong> rest of <strong>the</strong><br />
trading day. I’ve traded stocks and futures since 1990, and I could simply say “trust<br />
me” <strong>the</strong> OR high and low are important, but I don’t need to. <strong>The</strong> proof is in <strong>the</strong>se<br />
simple numbers. This book focuses on <strong>the</strong> 30-minute OR so I’ll give you <strong>the</strong> statistics<br />
for this time period. <strong>The</strong> first 30 minutes of <strong>the</strong> trading day represents slightly less<br />
than 8% of <strong>the</strong> trading day. If <strong>the</strong> market action is truly random <strong>the</strong>n <strong>the</strong> high of <strong>the</strong><br />
day for a stock should occur during <strong>the</strong> first half hour of <strong>the</strong> day about 8% of <strong>the</strong> time.<br />
My research on individual stocks shows that <strong>the</strong> high for <strong>the</strong> day occurs in <strong>the</strong> first 30<br />
minutes about 35% of <strong>the</strong> time! And <strong>the</strong> same can be said for <strong>the</strong> day’s low! This<br />
means that <strong>the</strong>re is a 35% chance that <strong>the</strong> high and low for <strong>the</strong> day in a stock at<br />
10:00 AM will still be <strong>the</strong> high and low of that stock at <strong>the</strong> end of <strong>the</strong> day. Knowing<br />
how to take advantage of this statistical bias in <strong>the</strong> markets can give you a big edge in<br />
finding opportunities and reducing risk in your trading.<br />
<strong>The</strong> OR Is Used by <strong>the</strong> World’s Most Successful Traders<br />
As I stated in chapter 1 <strong>the</strong>re are a lot of successful traders who use <strong>the</strong> OR as a<br />
critical part of <strong>the</strong>ir trading strategies. I did not invent it, I picked it up as a floor<br />
trader. I was convinced that it had merit by one of <strong>the</strong> floor’s greatest traders - Mark<br />
Fisher. Mark has a very systematic approach to trading that is based on <strong>the</strong> <strong>Opening</strong><br />
<strong>Range</strong> principle and is used in many forms by hundreds and maybe thousands of<br />
traders on and off <strong>the</strong> trading floor. He has also recently published a book detailing his<br />
systematic approach to trading. <strong>The</strong> title of <strong>the</strong> book is <strong>The</strong> Logical Trader: Applying a<br />
Method to <strong>the</strong> Madness, and I’d recommend it to anyone who is serious about<br />
improving <strong>the</strong>ir trading.<br />
Is OR <strong>Trading</strong> for You<br />
Whe<strong>the</strong>r you are a swing trader or active day trader <strong>the</strong> OR provides a road map for<br />
analyzing <strong>the</strong> sentiment of <strong>the</strong> market, quantifying risk and identifying trades with<br />
good risk/reward ratios. <strong>The</strong>re are many ways in which a better understanding of how<br />
markets are affected by <strong>the</strong> OR can improve your trading. If you are serious about<br />
trading, you owe it to yourself to understand this market principle.<br />
http://www.dataviewllc.com/ 10
Chapter 3. Basic Technical Analysis<br />
• Understanding <strong>the</strong> Price and Volume Relationship<br />
• What is a <strong>Swing</strong> High or Low<br />
• How to Identify <strong>the</strong> Trend Using <strong>Swing</strong>s<br />
• Support and Resistance Simplified<br />
• Don’t Over-Analyze <strong>the</strong> Charts<br />
<strong>The</strong>re are many books on technical analysis and this chapter will not attempt to<br />
summarize <strong>the</strong> whole discipline. If you are not familiar with reading bar charts and<br />
candlestick charts you owe it to yourself to invest some time in educating yourself in<br />
<strong>the</strong> area of technical analysis. Understanding <strong>the</strong> basics will improve your insight into<br />
<strong>the</strong> market dramatically. This chapter will focus on <strong>the</strong> basic principles of technical<br />
analysis that will help you to effectively read charts and trade <strong>the</strong> OR.<br />
Understanding <strong>the</strong> Price and Volume Relationship<br />
Charts are an important part of trading because a stock’s chart is a visual<br />
representation of all <strong>the</strong> trading activity in that stock. <strong>The</strong>refore, it reflects <strong>the</strong><br />
collective sentiment of all <strong>the</strong> traders of that stock. Remember from chapter 2,<br />
sentiment is <strong>the</strong> most powerful factor in determining how a stock will move. By<br />
reading a chart you can assess whe<strong>the</strong>r <strong>the</strong> current sentiment is bullish, bearish, or<br />
indecisive. More importantly, <strong>the</strong> chart can identify price levels at which <strong>the</strong> sentiment<br />
will likely change for <strong>the</strong> better or worse.<br />
<strong>The</strong>re are three dimensions to reading <strong>the</strong> markets – price, volume and time. <strong>The</strong> first<br />
step to reading <strong>the</strong> charts is to understand <strong>the</strong> basic relationship between price and<br />
volume. A common mistake made by <strong>the</strong> novice chart reader is his/her tendency to<br />
focus on <strong>the</strong> price movements in <strong>the</strong> chart. Price and volume should always be looked<br />
at toge<strong>the</strong>r. A move in price should coincide with an increase in volume. Volume is so<br />
important that many technical analysts say that volume actually precedes price. This<br />
is one way of saying that a big change in volume will often indicate an impending<br />
change in price action. Don’t ignore <strong>the</strong> volume!<br />
<strong>The</strong> basic relationship between price and volume is one where volume confirms price.<br />
“Confirmation” is a technical analysis term that means to support, or agree with. As<br />
with many areas of analysis, technical analysis is a science of looking for coincident<br />
indications that your premise about <strong>the</strong> market is correct. When one indication agrees<br />
with ano<strong>the</strong>r it is called confirmation. For example, if <strong>the</strong> price of a stock is rising you<br />
might anticipate that <strong>the</strong> stock will continue to go higher. If <strong>the</strong>re is an increase in<br />
volume with <strong>the</strong> increase in price, <strong>the</strong> increase in volume provides ano<strong>the</strong>r reason to<br />
believe that <strong>the</strong> price will continue to rise and <strong>the</strong>reby serves as a confirmation of <strong>the</strong><br />
price action.<br />
http://www.dataviewllc.com/ 11
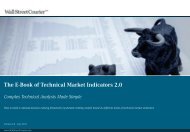
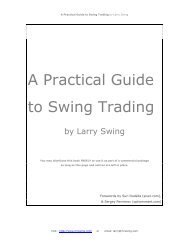
Figure 3-1 is an illustration of a bullish price<br />
and volume pattern. <strong>The</strong> shaded areas<br />
highlight <strong>the</strong> surges in volume that drove <strong>the</strong><br />
price higher. Each surge is followed by a<br />
pause or decline in price on lighter volume.<br />
Relative volume is what is important<br />
Volume should be interpreted in relative<br />
terms. <strong>The</strong> absolute number of shares traded<br />
is not as important as <strong>the</strong> level of volume<br />
activity relative to <strong>the</strong> norm for <strong>the</strong> stock<br />
being analyzed. When referring to “big<br />
volume” or “increased volume” in this book I<br />
mean volume that is higher than normal. This<br />
is important because volume is used to<br />
determine an increased level of interest in<br />
<strong>the</strong> stock as its price changes.<br />
If a stock normally trades two million shares<br />
per day and today it trades 2.2 million shares<br />
<strong>the</strong> stock is just acting normally. On <strong>the</strong><br />
o<strong>the</strong>r hand, if a stock that normally trades<br />
200,000 shares per day trades 400,000<br />
shares today <strong>the</strong>n clearly <strong>the</strong>re is something<br />
unusual going on in that stock. So <strong>the</strong> same<br />
increase of 200,000 shares in two different<br />
Figure 3-1: Daily chart of XM<br />
Satellite Radio (XMSR)<br />
<strong>The</strong> shaded areas highlight how a healthy<br />
upward-trending stock will experience a<br />
surge in volume when <strong>the</strong> price moves<br />
higher.<br />
stocks will have very different implications. <strong>The</strong> fact that <strong>the</strong> second stock traded<br />
twice its normal volume means that <strong>the</strong>re is large new or renewed interest in <strong>the</strong><br />
stock. When <strong>the</strong>re is unusually high interest in <strong>the</strong> stock it is likely to also experience<br />
an increase in volatility or continue to move in <strong>the</strong> direction of <strong>the</strong> volume.<br />
Why does relative volume confirm price<br />
If an increase in volume occurs in conjunction with a rise in price it is interpreted as<br />
bullish. Why If an upward trend is going to continue higher it will require new buyers<br />
at higher prices. Volume in a rising stock reflects <strong>the</strong> amount of buying pressure that a<br />
stock is experiencing. If volume is increasing as <strong>the</strong> stock moves higher it means<br />
<strong>the</strong>re are plenty of interested buyers at <strong>the</strong> higher prices, and that is a bullish<br />
condition.<br />
<strong>The</strong> volume can be viewed as a gauge of <strong>the</strong> sentiment of a stock’s price action. If <strong>the</strong><br />
price and volume are rising toge<strong>the</strong>r <strong>the</strong>n more traders are getting involved as <strong>the</strong><br />
stock climbs. <strong>The</strong> sentiment is bullish. Later in this chapter I will discuss price levels as<br />
ano<strong>the</strong>r gauge of trader sentiment. If a stock which has been trading sideways for a<br />
long time with very little volume starts to rise from one level to <strong>the</strong> next on very light<br />
volume <strong>the</strong> market action is telling you that traders are not very excited about that<br />
move. If <strong>the</strong> same price advance happens with unusually large volume <strong>the</strong>n you know<br />
that <strong>the</strong> sentiment of <strong>the</strong> stock is shifting form neutral to bullish. <strong>The</strong> analysis is<br />
straightforward, and with <strong>the</strong> right tools you can identify <strong>the</strong>se shifts in momentum by<br />
scanning daily as well as intraday trading activity.<br />
Ano<strong>the</strong>r way to interpret higher volume is that it comes from institutional investors.<br />
<strong>The</strong>se fund managers need to buy large quantities of stock when <strong>the</strong>y want to<br />
establish a position that can have an impact on <strong>the</strong>ir overall portfolio. <strong>The</strong>y generally<br />
cannot establish <strong>the</strong>ir whole position in one day because it would move <strong>the</strong> market too<br />
much. When <strong>the</strong>se fund managers act <strong>the</strong>y leave footprints or clues about <strong>the</strong>ir<br />
actions in <strong>the</strong> volume. <strong>The</strong>se volume footprints indicate when and at what price <strong>the</strong><br />
http://www.dataviewllc.com/ 12
institutional investors are active buyers. One reason to keep an eye out for <strong>the</strong>se<br />
volume footprints is that <strong>the</strong>y don’t tend to be isolated events. When fund managers<br />
decide that <strong>the</strong>y want to accumulate a large position in a stock <strong>the</strong>ir buying power can<br />
create large price moves that may continue uninterrupted for a whole day, a few days<br />
or even weeks. Often volume spikes will be followed by a period of lower volume<br />
consolidation which is <strong>the</strong>n followed by ano<strong>the</strong>r surge in buying. This surge-pausesurge<br />
pattern occurs intraday as well as over <strong>the</strong> course of many days.<br />
If you have scanning software to detect <strong>the</strong>se unusual volume patterns it makes <strong>the</strong><br />
job of finding stocks that are moving or that are about to move with <strong>the</strong> support of<br />
strong buying behind <strong>the</strong>m much easier. HotScans by DataView<br />
(www.dataviewllc.com) is an example of such software. In addition to scanning for<br />
unusual volume patterns, it also displays price and relative volume using very easy to<br />
interpret gauges.<br />
What is a <strong>Swing</strong> High or Low<br />
<strong>The</strong> terms “swing high” and “swing low” are used a lot in trading, and <strong>the</strong>y are<br />
important concepts not only for determining significant price levels and <strong>the</strong> trend, but<br />
also for managing risk in trading. A swing low is <strong>the</strong> low of a prior sell off. A swing<br />
high is <strong>the</strong> high of a prior rally.<br />
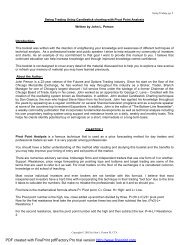
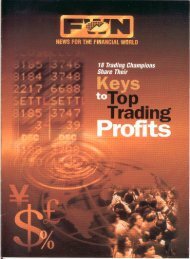
Figure 3-2: A <strong>Swing</strong> High<br />
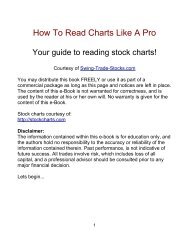
Figure 3-3: A <strong>Swing</strong> Low<br />
A swing high (<strong>the</strong> highest bar,<br />
shown in red) is formed when a<br />
period’s high is higher than both<br />
<strong>the</strong> period before and after it.<br />
A swing low (<strong>the</strong> lowest bar,<br />
shown in red) is formed when a<br />
period’s low is lower than both <strong>the</strong><br />
period before and after it.<br />
A swing low requires at least three periods (bars on a bar chart) to be established. A<br />
swing low is formed when a period’s low is lower than both <strong>the</strong> period before it and<br />
<strong>the</strong> period after it. A swing high is <strong>the</strong> reverse. It is formed when a period’s high is<br />
higher than both <strong>the</strong> period before and after it. You cannot say that a particular bar on<br />
a chart is <strong>the</strong> lowest <strong>the</strong> stock will go until <strong>the</strong> stock experiences a period in which it<br />
does not continue to go lower. <strong>The</strong>refore, in its simplest definition a swing low is not<br />
established until a period occurs in which a stock does not make a new low for <strong>the</strong><br />
move. Figures 3-2 and 3-3 illustrate how swings are formed.<br />
A swing’s significance is determined by how many periods make up <strong>the</strong> swing and <strong>the</strong><br />
percent change in price from <strong>the</strong> prior swing point. For example, a swing low which<br />
represents <strong>the</strong> low of <strong>the</strong> last 30 periods and <strong>the</strong> beginning of a rally that has lasted<br />
for 20 periods would be considered to be a more significant swing low than one that<br />
was formed after a 3-period decline and a 3-period rise.<br />
http://www.dataviewllc.com/ 13
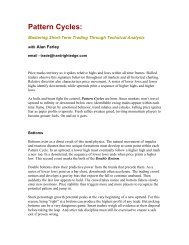
In figure 3-4, <strong>the</strong> major and minor<br />
swings are labelled with down arrows<br />
on <strong>the</strong> swing highs and up arrows on<br />
<strong>the</strong> swing lows. Identifying swings<br />
points can be somewhat subjective in<br />
that <strong>the</strong> size of <strong>the</strong> move and <strong>the</strong><br />
time frame required to constitute a<br />
swing are personal decisions.<br />
Figure 3-4: Daily Chart of Walt Disney<br />
Co. (DIS)<br />
How to Identify <strong>the</strong> Trend<br />
Using <strong>Swing</strong>s<br />
An uptrend is simply a series of<br />
higher highs and higher lows. When a<br />
stock is trending nicely it will not<br />
retrace, or move lower than, <strong>the</strong> low<br />
point of its previous correction. And,<br />
when it rallies, it rallies to a new high<br />
for <strong>the</strong> trend. Figure 3-5 is a daily<br />
line chart of Netease.com illustrating <strong>The</strong> red down arrow indicate swing highs, and <strong>the</strong><br />
this concept of higher highs and blue up arrows indicate swing lows.<br />
lower lows. <strong>The</strong> red down arrows<br />
indicate swing highs and <strong>the</strong> blue up arrows indicate <strong>the</strong> swing lows.<br />
As you can see in Figure 3-5, a trend is a<br />
series of successively higher swing highs<br />
while <strong>the</strong> swing lows are also successively<br />
higher. While identifying a trend is not<br />
difficult, determining “<strong>the</strong>” trend is very<br />
subjective. This is because <strong>the</strong>re are many<br />
trends in progress in every stock. <strong>The</strong>re are<br />
long-term trends that span weeks, months or<br />
years, intermediate-term trends that span<br />
days or weeks, and short-term trends that<br />
may span days, hours or minutes. <strong>The</strong>refore,<br />
when you are evaluating <strong>the</strong> trend of a stock<br />
you must first determine your time frame,<br />
and how you will define a valid swing in<br />
terms of price and time.<br />
When a prior swing low is broken in an<br />
uptrend <strong>the</strong> uptrend should be considered to<br />
be over. A downtrend is not confirmed,<br />
however, until <strong>the</strong>re is a second lower low.<br />
During this period between <strong>the</strong> time when<br />
<strong>the</strong> market is in nei<strong>the</strong>r a clear uptrend or a<br />
clear downtrend <strong>the</strong> market should be<br />
considered to be mixed or consolidating. An<br />
extended period of trendless market action is<br />
commonly referred to as a “choppy” market.<br />
Figure 3-5: Daily Chart of<br />
Netease.com (NTES)<br />
This daily line chart of NTES is an<br />
example of a very strong uptrend. It is a<br />
strong trend because each swing high is<br />
higher than <strong>the</strong> previous swing high, and<br />
each swing low is higher than <strong>the</strong><br />
previous swing low.<br />
http://www.dataviewllc.com/ 14
Figure 3-6 illustrates <strong>the</strong> transition from an uptrend to a downtrend on <strong>the</strong> daily chart<br />
of Bank of America (BAC). In this example a swing of at least four or five days is<br />
considered to be significant.<br />
Figure 3-6: Daily chart of Bank Of America (BAC)<br />
In this daily chart, BAC<br />
sold off from its high at<br />
point A and created a<br />
swing low at point B.<br />
Its rally from <strong>the</strong> low at<br />
point B was weak and<br />
created a swing high at<br />
point C which was lower<br />
than A. When BAC<br />
broke its swing low at<br />
point B significantly it<br />
was an indication that<br />
<strong>the</strong> uptrend was over.<br />
<strong>The</strong> new swing low at<br />
point D would <strong>the</strong>n<br />
serve as confirmation of<br />
a new downtrend when<br />
it was broken by a<br />
fur<strong>the</strong>r price decline.<br />
How to use <strong>the</strong> swing trend in your trading<br />
<strong>The</strong> reason for determining <strong>the</strong> condition of a stock based on its swing trend is<br />
summarized in <strong>the</strong> common expression, “<strong>The</strong> trend is your friend”. Looking at market<br />
action in terms of swings is a good way to see if <strong>the</strong>re is a predominantly bullish or<br />
bearish bias to a stock. <strong>Swing</strong>s are not always as clean as <strong>the</strong> examples you see here,<br />
but when <strong>the</strong>y are it is a very powerful signal because it indicates a real bullish or<br />
bearish bias in <strong>the</strong> stock. Do not expect to be able to easily identify a bullish or<br />
bearish trend in every stock. It doesn’t always exist. But, now you know what to look<br />
for, and when you see it don’t ignore it. Trade with it using <strong>the</strong> principles of support<br />
and resistance covered next.<br />
What is support and resistance<br />
Support and Resistance Simplified<br />
Support is <strong>the</strong> technical analyst’s term for a price level at which <strong>the</strong> stock is likely to<br />
stop going down. To help you remember this, think of support as something holding<br />
<strong>the</strong> market up or as a price level that will hold <strong>the</strong> market up. Resistance is <strong>the</strong><br />
technical analyst’s term to describe <strong>the</strong> opposite condition. Resistance is a price level<br />
that holds <strong>the</strong> stock price down. <strong>The</strong> principles of support and resistance apply to all<br />
chart time frames. It doesn’t matter if you are looking at a tick chart, a one-minute<br />
chart or a monthly chart. Knowing that such price levels exist and understanding how<br />
to identify <strong>the</strong>m is an important skill for most successful day traders.<br />
How to identify and assess support and resistance<br />
Your next question should be: "How do I find <strong>the</strong>se areas of support and resistance on<br />
a chart" <strong>The</strong>re are many patterns that indicate support and resistance, but focusing<br />
http://www.dataviewllc.com/ 15
on <strong>the</strong> basics is enough to make a big impact on your trading. Identifying major areas<br />
of support and resistance is as simple as looking at <strong>the</strong> chart and finding <strong>the</strong> prices at<br />
which <strong>the</strong> market stopped advancing (swing highs) and stopped going down (swing<br />
lows). <strong>Swing</strong> highs represent resistance and swing lows represent support. Most<br />
technical analysis text books will define <strong>the</strong> support or resistance level created by <strong>the</strong><br />
highs and lows as being <strong>the</strong> exact price of <strong>the</strong> high or low. As a trader, however, I<br />
strongly advise you to view support and resistance as being an area around <strong>the</strong> chart<br />
point. When <strong>the</strong> market approaches a support or resistance level you must watch <strong>the</strong><br />
price and volume action to determine if, and where, <strong>the</strong> market will respect (stop at)<br />
<strong>the</strong> chart point. Sometimes <strong>the</strong> market will stop right at <strong>the</strong> high or low, but often it<br />
will stop slightly above or below <strong>the</strong> actual chart point.<br />
Once you have identified a price level as being ei<strong>the</strong>r support or resistance <strong>the</strong>re are a<br />
number of factors that should be considered in determining how significant or strong<br />
<strong>the</strong> support or resistance level will be. <strong>The</strong>se factors are as follows:<br />
1. Time. <strong>The</strong> more time a stock trades at a price level <strong>the</strong> more significant that<br />
level becomes. This may not occur in <strong>the</strong> form of multiple clearly defined<br />
swings, but ra<strong>the</strong>r in a consolidation period where many of <strong>the</strong> lows of <strong>the</strong><br />
consolidation area are at <strong>the</strong> same price level forming support.<br />
2. Number of occurrences. This is ano<strong>the</strong>r way of looking at how much time a<br />
stock has traded at a particular level. If a stock has created multiple swing lows<br />
at <strong>the</strong> same price level over time, <strong>the</strong>n that price level will be significant<br />
support in <strong>the</strong> future.<br />
3. Volume. <strong>The</strong> higher <strong>the</strong> relative volume is at a particular price level, <strong>the</strong> more<br />
likely it is that <strong>the</strong> price level will become significant support or resistance. This<br />
should make sense. If support, for example, is a function of <strong>the</strong> number of<br />
buyers willing to purchase <strong>the</strong> stock at a certain price, <strong>the</strong>n a price level which<br />
has attracted high volume in <strong>the</strong> past is more likely to act as support than <strong>the</strong><br />
price level that has not attracted volume in <strong>the</strong> past.<br />
4. How recently it was formed. Support and resistance are created by <strong>the</strong> fact<br />
that <strong>the</strong>re is real demand (creating support) or a big supply of stock (creating<br />
resistance) at certain price levels. Support and resistance levels that have been<br />
created recently are likely to be more significant than those that were formed<br />
weeks or months ago. It is for this reason that <strong>the</strong> day trader should always<br />
know <strong>the</strong> prior day’s high and low. <strong>The</strong>se points represent <strong>the</strong> most recent<br />
support and resistance on <strong>the</strong> daily chart.<br />
http://www.dataviewllc.com/ 16
Let’s look at some examples.<br />
In <strong>the</strong> first example, Figure<br />
3-7, Nextel (NXTL) is trading<br />
in a range between $11 and<br />
$14.60 on a daily chart. <strong>The</strong><br />
support and resistance areas<br />
are labelled with a horizontal<br />
dotted line. Notice that<br />
between November and early<br />
December NXTL had<br />
established $14.60 as<br />
resistance by reversing its<br />
trend (swing highs) around<br />
that level twice, and it also<br />
established $11.00 as<br />
support by reversing its trend<br />
<strong>the</strong>re twice (swing lows).<br />
<strong>The</strong>refore, it should not have<br />
surprised traders in <strong>the</strong><br />
following months when NXTL<br />
stopped near each of <strong>the</strong>se<br />
levels two more times over<br />
<strong>the</strong> next three months. In<br />
Figure 3-7: Daily chart of Nextel Comm. (NXTL)<br />
This daily chart of NXTL is an example of how <strong>the</strong> $14.00-<br />
14.60 level acted as resistance while <strong>the</strong> $11.00 level was<br />
support for five months.<br />
this example you can see that <strong>the</strong> real resistance area was from just above $14 up to<br />
<strong>the</strong> $14.60 level.<br />
In <strong>the</strong> second example in Figure 3-8, Figure 3-8: Daily chart of Microsoft<br />
Microsoft (MSFT) is in a trading range Corp. (MSFT)<br />
between $23.95 and $26.50 as<br />
indicated by <strong>the</strong> dotted horizontal<br />
lines. In June MSFT provided an<br />
example of why support should be<br />
considered an area. In <strong>the</strong> months<br />
before June MSFT had established<br />
$23.95 as support with three swing<br />
lows at this level. <strong>The</strong>n in June it<br />
broke <strong>the</strong> support and closed below it<br />
at $23.60 (labelled as point A), but<br />
<strong>the</strong> following day it did not continue to<br />
decline. Two days after breaking <strong>the</strong><br />
support, MSFT traded back above its<br />
prior support level ($23.95) with real<br />
strength. While <strong>the</strong> chart points may<br />
have indicated that support was at<br />
$23.95, <strong>the</strong> market action revealed<br />
that <strong>the</strong>re was support in <strong>the</strong> area<br />
right below $23.95 as well. When a<br />
stock is trading near a support or<br />
Point A in <strong>the</strong> MSFT chart illustrates how support<br />
resistance level you must assess is often an area ra<strong>the</strong>r than a specific point<br />
whe<strong>the</strong>r or not <strong>the</strong> stock will respect around a price level.<br />
<strong>the</strong>se levels. This respect might come<br />
slightly above or below <strong>the</strong> point you are anticipating from reading <strong>the</strong> chart.<br />
http://www.dataviewllc.com/ 17
Old resistance becomes new support<br />
So far I’ve described support as being identified by looking for swing or consolidation<br />
lows, and I’ve described resistance as being <strong>the</strong> result of swing or consolidation highs.<br />
However, whenever a support or resistance level is broken by a significant amount it<br />
reverses its role. This means that when a stock rises convincingly above a resistance<br />
level <strong>the</strong>n <strong>the</strong> old resistance price level will now act as support.<br />
A role reversal for support and resistance may be a little counterintuitive, but this is a<br />
very important concept in reading support and resistance. <strong>The</strong> best way to understand<br />
why this happens is to look at how <strong>the</strong> sentiment of <strong>the</strong> traders in a stock impacts<br />
support and resistance levels. Let’s break <strong>the</strong> traders in <strong>the</strong> stock into three categories<br />
based on <strong>the</strong>ir sentiment – bulls (longs), bears (shorts), and undecided.<br />
Now let’s look at <strong>the</strong> condition where a stock<br />
breaks above resistance by a significant<br />
amount as shown in Figure 3-9.<br />
In Figure 3-9 <strong>the</strong> stock has established a<br />
resistance level at <strong>the</strong> price indicated by <strong>the</strong><br />
red dashed line labelled “Resistance”. This is<br />
considered resistance based on <strong>the</strong> numerous<br />
times that <strong>the</strong> stock has stopped going up<br />
when it reached that level. Consider what has<br />
been happening at or near that resistance level<br />
each time <strong>the</strong> stock gets <strong>the</strong>re prior to <strong>the</strong><br />
breakout. <strong>The</strong> shorts are selling to establish<br />
<strong>the</strong>ir short positions, and longs that bought <strong>the</strong><br />
stock lower are selling to take profits. Both<br />
types of traders are selling because <strong>the</strong>y think<br />
<strong>the</strong> stock’s uptrend may be ending at this<br />
level.<br />
Figure 3-9: Resistance<br />
Becoming Support<br />
In this representation of a line chart<br />
point B represents <strong>the</strong> expected support<br />
level after <strong>the</strong> stock has traded up to<br />
point A.<br />
Now think about how <strong>the</strong>se traders feel when <strong>the</strong> market moves above <strong>the</strong> resistance<br />
level to <strong>the</strong> point labelled “A”. Both <strong>the</strong> longs and <strong>the</strong> shorts will realize (or at least<br />
strongly suspect) that <strong>the</strong> stock’s uptrend is resuming. If <strong>the</strong> stock is above <strong>the</strong><br />
resistance line <strong>the</strong> shorts are losing money, and <strong>the</strong>y are going to be looking to buy<br />
back <strong>the</strong>ir short positions if <strong>the</strong> stock retraces close to <strong>the</strong>ir breakeven price. This<br />
breakeven price will be somewhere close to <strong>the</strong> resistance level. <strong>The</strong> longs that took<br />
profits at <strong>the</strong> resistance level are also going to be regretting <strong>the</strong>ir sales. <strong>The</strong>refore,<br />
<strong>the</strong>y will be looking to buy <strong>the</strong> stock if it dips back close to where <strong>the</strong>y sold it. In<br />
addition, <strong>the</strong>re are undecided traders, some of whom will become bullish as <strong>the</strong>y see<br />
<strong>the</strong> stock’s uptrend resume. <strong>The</strong>se traders are now also wishing <strong>the</strong>y had gone long<br />
before <strong>the</strong> stock moved above <strong>the</strong> resistance level so <strong>the</strong>y too will be looking to buy<br />
<strong>the</strong> next dip. Finally, <strong>the</strong> most bullish longs, <strong>the</strong> ones that did not even take profits,<br />
are now wishing that <strong>the</strong>y had bought more before <strong>the</strong> stock moved above <strong>the</strong><br />
resistance level.<br />
As you can see, when <strong>the</strong> stock moved above <strong>the</strong> resistance level <strong>the</strong> sentiment of<br />
traders can easily be focused on a desire to buy <strong>the</strong> stock. And, as <strong>the</strong> stock begins to<br />
sell off from its high at point A and moves closer to <strong>the</strong> old resistance level each of <strong>the</strong><br />
traders becomes a more interested buyer. This buying interest is what creates <strong>the</strong><br />
support at <strong>the</strong> old resistance. <strong>The</strong> result of <strong>the</strong> support is a new swing low that is<br />
created as illustrated by point B.<br />
This example started by assuming that <strong>the</strong> stock moved above <strong>the</strong> resistance level by<br />
a “significant amount”. You may be thinking – how much is significant <strong>The</strong> answer is<br />
in <strong>the</strong> example. <strong>The</strong> reason old resistance becomes support is because traders become<br />
http://www.dataviewllc.com/ 18
more bullish when <strong>the</strong> stock breaks through <strong>the</strong> resistance level. This shift in<br />
sentiment causes <strong>the</strong>m to want to buy <strong>the</strong> stock back at <strong>the</strong> level where <strong>the</strong>y had<br />
previously sold it, or buy <strong>the</strong> stock at a level where <strong>the</strong>y had previously wished <strong>the</strong>y<br />
had bought it. For this shift in sentiment to occur <strong>the</strong> move above <strong>the</strong> resistance level<br />
must be enough to convince traders that <strong>the</strong>y were wrong in thinking that <strong>the</strong><br />
resistance was potentially <strong>the</strong> end of <strong>the</strong> uptrend. If a stock only moves slightly above<br />
a resistance level and <strong>the</strong>n falls back below it, <strong>the</strong> increase in bullish sentiment will<br />
not occur. In fact, such price action can have <strong>the</strong> reverse effect and turn traders more<br />
bearish because <strong>the</strong>y will see that <strong>the</strong> stock tried to move above <strong>the</strong> resistance and<br />
“failed”. This is one reason why support or resistance is an area and not a point!<br />
<strong>The</strong> same principle applies when a stock moves below a support level. <strong>The</strong> old support<br />
becomes resistance. Think about how this relates to your own experiences in <strong>the</strong><br />
market. How many times have you bought a stock because you had noticed that it<br />
had a tendency to stop at a particular level only to watch it continue to go lower And<br />
<strong>the</strong>n, when you are sitting with a losing position how often do you think about how<br />
nice it would be if you could get <strong>the</strong> opportunity to sell <strong>the</strong> position at <strong>the</strong> same price<br />
you bought it so that you wouldn’t have to take a loss When you do this you become<br />
part of <strong>the</strong> collective market mood converting old support into new resistance.<br />
Before we look at an example where<br />
support and resistance successfully<br />
switch roles let’s look at a failure. If you<br />
take a closer look at <strong>the</strong> previously<br />
discussed MSFT chart you will see an<br />
example where <strong>the</strong> initial move below<br />
support was not significant enough for<br />
<strong>the</strong> support to become resistance.<br />
Figure 3-10 is <strong>the</strong> same June time<br />
frame shown in Figure 3-8 earlier in this<br />
chapter.<br />
If you re-examine <strong>the</strong> break below <strong>the</strong><br />
support at $23.95 in early June you will<br />
see <strong>the</strong> following sequence. First MSFT<br />
broke and closed below its support on<br />
big volume (labelled as point A). <strong>The</strong><br />
next day MSFT’s high was <strong>the</strong> prior<br />
support level indicating that old support<br />
was now resistance - as you might<br />
expect (labelled as point B). On <strong>the</strong><br />
o<strong>the</strong>r hand, <strong>the</strong>re was also a strong<br />
indication that MSFT was still<br />
experiencing support. This indication<br />
was <strong>the</strong> fact that MSFT traded below<br />
<strong>the</strong> prior day’s low, but did not continue<br />
to move lower. In fact, it closed up for<br />
<strong>the</strong> day. <strong>The</strong> following day, two days<br />
from <strong>the</strong> breakdown day, MSFT traded<br />
above <strong>the</strong> prior day’s high which should<br />
Figure 3-10: Daily Chart of Microsoft<br />
Corp. (MSFT)<br />
In early June MSFT broke below its support<br />
level but did not follow through. When it traded<br />
back up above <strong>the</strong> prior day’s high and <strong>the</strong> old<br />
support level it was clear that <strong>the</strong> support<br />
“area” had held.<br />
have been resistance for two reasons. One, it was <strong>the</strong> high of <strong>the</strong> prior day, and two,<br />
it was <strong>the</strong> old support level. <strong>The</strong> move above this high made it clear that <strong>the</strong><br />
sentiment that had created <strong>the</strong> support at $23.95 had not been changed by <strong>the</strong> small<br />
and short move below it. When MSFT moved above this high traders should have<br />
realized that <strong>the</strong> bulls were in control and <strong>the</strong> breakdown of <strong>the</strong> $23.95 support level<br />
was going to fail and reverse.<br />
http://www.dataviewllc.com/ 19
Now let’s look at an example of resistance successfully switching roles. In Figure 3-11<br />
you can see Netease.com (NTES) follow a sequence of old resistance becoming new<br />
support.<br />
Figure 3-11: Daily Chart of Netease.com (NTES)<br />
NTES demonstrates how a strongly trending stock will find support at its<br />
prior resistance levels.<br />
In this example red dashed horizontal lines have been drawn at major resistance<br />
levels as <strong>the</strong> stock trended higher. Notice how each of <strong>the</strong>se levels acted as support<br />
once NTES moved above <strong>the</strong>m in a significant way. Also note <strong>the</strong> instance in which <strong>the</strong><br />
resistance did not provide support - <strong>the</strong> failed move higher at point A. On this day<br />
NTES did not “follow through” after <strong>the</strong> prior-day close above <strong>the</strong> resistance point. <strong>The</strong><br />
term “follow through” is ano<strong>the</strong>r way of saying that <strong>the</strong> stock moved significantly<br />
beyond a support or resistance level. <strong>The</strong> volume on this day is not shown in <strong>the</strong><br />
example but it was very light, which was a warning sign that NTES might not follow<br />
through. <strong>The</strong> following day was a big-volume down day that began a significant<br />
correction from <strong>the</strong> resistance level. Two weeks later, when <strong>the</strong> stock did break this<br />
resistance level in a significant way this resistance area became real support.<br />
<strong>The</strong> basics of a breakout<br />
<strong>The</strong> “breakout” is a commonly traded pattern. A breakout occurs when <strong>the</strong> stock<br />
moves above <strong>the</strong> resistance level of a consolidation period. A consolidation period is<br />
created when a stock trades in a well-defined range over a period of time. <strong>The</strong><br />
examples of NXTL in Figure 3-7 and MSFT in Figure 3-8 previously discussed in this<br />
chapter are good examples of well-defined ranges. <strong>The</strong>y are considered to be welldefined<br />
because <strong>the</strong>y have numerous instances in which <strong>the</strong> particular support or<br />
resistance level was tested or reached and was followed by a reversal. In o<strong>the</strong>r words<br />
<strong>the</strong>re are numerous swing highs and swing lows at <strong>the</strong> respective resistance and<br />
support levels.<br />
<strong>The</strong> more time a stock spends trading in a consolidation phase <strong>the</strong> more significant<br />
<strong>the</strong> breakout from that consolidation becomes. This is because <strong>the</strong> longer a stock<br />
consolidates <strong>the</strong> more traders will establish positions based on <strong>the</strong> support and<br />
resistance levels of <strong>the</strong> consolidation. As I have already discussed, it is <strong>the</strong> sentiment<br />
http://www.dataviewllc.com/ 20
of <strong>the</strong>se traders that is going to push <strong>the</strong> breakout to follow through. When a stock<br />
breaks below <strong>the</strong> support level it is also considered a breakout, although it is<br />
commonly referred to as a breakdown. A breakdown below support follows all <strong>the</strong><br />
same principles of support and resistance as a breakout does – prior support becomes<br />
resistance.<br />
<strong>The</strong> <strong>Opening</strong> <strong>Range</strong> approach to trading has many strategies that are based on<br />
following or fading breakouts and breakdowns. In <strong>the</strong> upcoming chapters I will<br />
describe in detail how to analyze <strong>the</strong> <strong>Opening</strong> <strong>Range</strong> as a breakout trade on an<br />
intraday chart, but <strong>the</strong> same concepts can be applied to daily charts.<br />
Don’t Over-Analyze <strong>the</strong> Charts<br />
<strong>The</strong> power of understanding technical analysis is not <strong>the</strong> ability to predict a stock’s<br />
every move. Good technical traders trade charts that make sense. <strong>The</strong>y don’t try to<br />
make sense out of every chart.<br />
If <strong>the</strong> chart does not have any obvious areas of support and/or resistance <strong>the</strong>n don’t<br />
try to find something that doesn’t exist! One of <strong>the</strong> biggest mistakes new technical<br />
traders make is that <strong>the</strong>y assume that every chart has some pattern that can be<br />
traded. <strong>The</strong> best approach to reading charts is to focus on <strong>the</strong> charts that have<br />
obvious patterns ra<strong>the</strong>r than trying to interpret patterns that are not clear.<br />
<strong>The</strong> best way to trade using charts is to become your own expert in analyzing a select<br />
few chart patterns and <strong>the</strong>n trade stocks that have your pattern. If you specialize and<br />
focus you will learn all <strong>the</strong> nuances of how stocks trade when <strong>the</strong>y are in <strong>the</strong> condition<br />
you have defined as your pattern. When you have mastered one pattern it will be easy<br />
to add ano<strong>the</strong>r pattern to your trading. You will find that mastering one type of<br />
pattern will make it easier to master o<strong>the</strong>rs. For example, if you focus on buying<br />
breakouts you will quickly discover lots of nuances in price and volume action that will<br />
help you determine whe<strong>the</strong>r or not <strong>the</strong> breakout is going to follow through. Once you<br />
have mastered how to trade breakouts from <strong>the</strong> long side you will also know what to<br />
look for to determine which breakouts will fail. At that point looking for breakouts that<br />
are likely to fail as short candidates will be a natural extension of your expertise.<br />
To trade effectively find an efficient method of identifying stocks that have <strong>the</strong> pattern<br />
you are looking for and focus on those stocks. <strong>The</strong> most efficient way of doing this<br />
usually involves <strong>the</strong> use of software that scans <strong>the</strong> market for stocks that meet your<br />
criteria. As a co-founder of DataView I naturally think DataView’s HotScans product at<br />
www.DataViewLLC.com is <strong>the</strong> best market scanning tool for identifying patterns based<br />
on intraday price and volume movements, but <strong>the</strong>re are many o<strong>the</strong>r good tools<br />
available for this purpose. Find one that enables you to focus on <strong>the</strong> patterns you want<br />
to trade.<br />
<strong>The</strong> rest of this book will be focused on helping you get started in becoming an expert<br />
in trading breakouts and o<strong>the</strong>r patterns based on <strong>the</strong> <strong>Opening</strong> <strong>Range</strong>. When you have<br />
mastered <strong>the</strong>se patterns <strong>the</strong> same knowledge and techniques can be applied to<br />
following and fading gaps, fading <strong>the</strong> retracements to moving averages and many<br />
more setups.<br />
http://www.dataviewllc.com/ 21
Chapter 4. Assessing <strong>the</strong> <strong>Opening</strong> <strong>Range</strong> (OR)<br />
• Getting Started with <strong>the</strong> OR<br />
• Three Questions for Analyzing <strong>the</strong> OR<br />
• Don’t Ignore <strong>the</strong> Stock’s Big Picture<br />
Traders are always looking for insight<br />
Getting Started with <strong>the</strong> OR<br />
As a trader you have probably had an experience where something that seemed fuzzy<br />
about <strong>the</strong> markets suddenly became clear. It may have been related to reading<br />
charts, or new insight into what was really going on behind <strong>the</strong> numbers jumping<br />
around on your Level 2 screen. Suddenly and sometimes for no specific reason, you<br />
see or hear something that pulls lots of loose ends toge<strong>the</strong>r and you experience a<br />
feeling of “Ahaa!” <strong>The</strong> concept becomes clear, obvious, and it makes you feel that you<br />
really understand. You believe you finally have insight.<br />
Your understanding of <strong>the</strong> <strong>Opening</strong> <strong>Range</strong> trading approach will most likely come to<br />
you in two “Ahaas” or phases. First, you will realize that you can look at an intraday<br />
bar chart and clearly see <strong>the</strong> <strong>Opening</strong> <strong>Range</strong>. I don’t mean that you will be able to<br />
simply point out <strong>the</strong> high and <strong>the</strong> low and <strong>the</strong>n do <strong>the</strong> math and recite <strong>the</strong> OR’s range.<br />
I mean you will be able to quickly identify <strong>the</strong> OR as bullish, bearish, tradable, not<br />
tradable, uninteresting, etc. You will have insight.<br />
<strong>The</strong> second “Ahaa” will occur when you experience <strong>the</strong> ability to explain and anticipate<br />
a stock’s price action based on <strong>the</strong> footprint of <strong>the</strong> OR. Sound crazy Do you think that<br />
you can use charts to explain and anticipate a stock’s price action If you do <strong>the</strong>n <strong>the</strong><br />
OR will absolutely provide you with insight into a stock’s next intraday move. If you<br />
don’t believe in <strong>the</strong> power of <strong>the</strong> charts, studying <strong>the</strong> OR may change your mind.<br />
Insight is usually a function of experience combined with study. In this chapter I will<br />
discuss <strong>the</strong> characteristics and qualities that you should focus on in evaluating <strong>the</strong> OR.<br />
<strong>The</strong> intent is to help you experience or solidify what I described as <strong>the</strong> first phase of<br />
your understanding of <strong>the</strong> OR. If you have experience looking at <strong>the</strong> OR in your<br />
trading you may already have this level of insight and this chapter will serve as a<br />
refresher. If you have never traded using <strong>the</strong> OR as a guide, welcome to <strong>the</strong> OR!<br />
It is no coincidence that <strong>the</strong> prior chapters discussed basic technical analysis and<br />
money management. <strong>The</strong> <strong>Opening</strong> <strong>Range</strong> trading approach is powerful because it<br />
provides technical insight and trading opportunities that are based on good money<br />
management. <strong>The</strong>refore, <strong>the</strong> <strong>Opening</strong> <strong>Range</strong> should be analyzed on two levels –<br />
technical setup and trade opportunity. <strong>The</strong> analysis of <strong>the</strong> stock’s technical condition<br />
answers <strong>the</strong> question of whe<strong>the</strong>r <strong>the</strong> stock is in a bullish, bearish or neutral condition.<br />
<strong>The</strong> analysis of a trading opportunity identifies whe<strong>the</strong>r or not <strong>the</strong> stock has a tradable<br />
OR setup. It is possible to have a bullish technical condition without having a good<br />
trading opportunity. In this case you should not try to trade! Sometimes <strong>the</strong> best<br />
trading decision you can make is to sit on your hands.<br />
Defining <strong>the</strong> OR<br />
<strong>The</strong> <strong>Opening</strong> <strong>Range</strong> is defined by both time and price. <strong>The</strong> time element is <strong>the</strong> first X<br />
number of minutes of <strong>the</strong> trading day. For example, if I am discussing <strong>the</strong> 30-minute<br />
OR <strong>the</strong>n I am referring to <strong>the</strong> price action of <strong>the</strong> first 30 minutes of <strong>the</strong> trading day<br />
(9:30 AM-10:00 AM EST). In my trading I use <strong>the</strong> first 30 minutes of <strong>the</strong> trading day<br />
http://www.dataviewllc.com/ 22
as my default for day trades. I also look at <strong>the</strong> first 5 minutes in some situations<br />
where I may want to be more aggressive. While different trading styles do lend<br />
<strong>the</strong>mselves to different OR time frames <strong>the</strong> analysis is <strong>the</strong> same. This book will focus<br />
on <strong>the</strong> 30 minute OR because I think it is <strong>the</strong> best place to start. As you will see,<br />
however, <strong>the</strong> time element is flexible.<br />
<strong>The</strong> price element of <strong>the</strong> OR<br />
definition is simply <strong>the</strong> range of<br />
<strong>the</strong> OR as defined by <strong>the</strong> high of<br />
<strong>the</strong> OR period and <strong>the</strong> low of <strong>the</strong><br />
OR period. For example, at<br />
10:00 AM <strong>the</strong> 30-minute OR can<br />
be defined, and it is <strong>the</strong> high for<br />
<strong>the</strong> day and <strong>the</strong> low for <strong>the</strong> day<br />
at 10:00 AM. In Figure 4-1 you<br />
will see a 1-minute chart of<br />
Amazon Inc. (AMZN) from <strong>the</strong><br />
beginning of <strong>the</strong> day until about<br />
11:00 AM. <strong>The</strong> first 30 minutes<br />
of <strong>the</strong> trading day are<br />
highlighted in yellow to illustrate<br />
<strong>the</strong> 30-minute OR. As you can<br />
see, on this day AMZN opened at<br />
$46.49 <strong>the</strong>n sold off to a low of<br />
$46.06 at 9:45 AM, and <strong>the</strong>n<br />
rallied to $46.63 by 9:52 AM<br />
where it consolidated and put in<br />
its 30-minute OR high of $46.66<br />
at 9:59 AM. <strong>The</strong>re are arrows<br />
indicating when <strong>the</strong> high<br />
($46.66) and low ($46.06) for<br />
Figure 4-1: 1-Minute Chart of Amazon, Inc.<br />
(AMZN)<br />
AMZN’s 30-minute <strong>Opening</strong> <strong>Range</strong> is highlighted in<br />
yellow. <strong>The</strong> red and blue horizontal lines mark <strong>the</strong> OR<br />
high and low for <strong>the</strong> rest of <strong>the</strong> day.<br />
<strong>the</strong> period occurred. On this day Amazon’s 30-minute OR was $46.06 – $46.66. <strong>The</strong><br />
actual range is $0.60, but what we are more concerned with are two levels: $46.06<br />
and $46.66. <strong>The</strong>se price levels define <strong>the</strong> OR. <strong>The</strong> red and blue horizontal lines on <strong>the</strong><br />
chart at <strong>the</strong> OR high and low are lines I put on my charts to mark <strong>the</strong> OR high and low<br />
for <strong>the</strong> remainder of <strong>the</strong> trading day. When I’m trading I often write down <strong>the</strong> OR high<br />
and low of <strong>the</strong> stocks that I am interested in trading. If I am watching <strong>the</strong> quote<br />
screen I can refer to my notes more quickly than requesting <strong>the</strong> charts to remind me<br />
of <strong>the</strong> OR levels.<br />
How can something so simple be so important<br />
As you can see, defining <strong>the</strong> OR is easy. <strong>The</strong> 30-minute OR is strictly <strong>the</strong> high and <strong>the</strong><br />
low of <strong>the</strong> first 30 minutes of trading. Now that you know how easy it is to define <strong>the</strong><br />
OR it’s a good time to review why this simple concept is so important.<br />
For emphasis, let’s restate some of <strong>the</strong> information from chapter 2. In <strong>the</strong> first 30<br />
minutes of <strong>the</strong> day’s trading traders and investors are reacting to any news <strong>the</strong>y have<br />
heard or analysis <strong>the</strong>y have done since <strong>the</strong> close of <strong>the</strong> prior day. This makes <strong>the</strong><br />
opening period emotionally charged and informationally rich. I call it informationally<br />
rich because traders have had time to analyze <strong>the</strong> prior day’s price action, any<br />
overnight news, <strong>the</strong> morning’s economic reports and even <strong>the</strong> opening price action. All<br />
this can represent a lot of new information for traders to act on. It is emotionally<br />
charged because it is <strong>the</strong> first chance traders have to trade based on <strong>the</strong>ir overnight<br />
conclusions. All this creates a lot of potential reasons why <strong>the</strong> traders may be in a<br />
hurry to get in or out of <strong>the</strong> stock. All <strong>the</strong>se reasons manifest <strong>the</strong>mselves in a flurry of<br />
http://www.dataviewllc.com/ 23
activity when <strong>the</strong> market opens. Sometimes this activity lasts a few seconds and<br />
sometimes it lasts all day. Generally, <strong>the</strong> initial flurry of activity will settle down by <strong>the</strong><br />
end of <strong>the</strong> 30-minute OR period. <strong>The</strong>refore, I like to think of <strong>the</strong> <strong>Opening</strong> <strong>Range</strong> as <strong>the</strong><br />
day’s “price discovery” period. <strong>The</strong> first 30 minutes is <strong>the</strong> period when <strong>the</strong> emotionally<br />
charged bulls and bears are battling for control of <strong>the</strong> stock for <strong>the</strong> day. Ideally, this<br />
battle between <strong>the</strong> bulls and bears in <strong>the</strong> morning will result in a demonstration of <strong>the</strong><br />
significant price levels for <strong>the</strong> day. In o<strong>the</strong>r words, <strong>the</strong> OR will define <strong>the</strong> critical price<br />
inflection points for <strong>the</strong> day.<br />
<strong>The</strong> fact that <strong>the</strong> OR is such an emotionally charged and informationally rich period is<br />
also why <strong>the</strong> OR can determine <strong>the</strong> bias for <strong>the</strong> day as being bullish, bearish, or<br />
neutral. <strong>The</strong> OR represents <strong>the</strong> bulls and bears establishing <strong>the</strong>ir initial positions for<br />
<strong>the</strong> day. A move away from <strong>the</strong> OR indicates that one side is stronger than <strong>the</strong> o<strong>the</strong>r.<br />
If we look back at <strong>the</strong> AMZN chart in Figure 4-1 we see that AMZN traded lower after<br />
its 9:30 AM opening price, <strong>the</strong>n traded higher than its opening price, all before 10:00<br />
AM. If I were to analyze AMZN’s trading at 10:00 AM on that day I would say that<br />
AMZN attempted to go lower but at $46.06 <strong>the</strong> bulls were stronger than <strong>the</strong> bears.<br />
<strong>The</strong> rally from its low to a high of $46.66 represented its best attempt to go higher<br />
before <strong>the</strong> bears overtook <strong>the</strong> bulls.<br />
You can see in <strong>the</strong> chart that after AMZN established its high during <strong>the</strong> OR it sold off.<br />
In fact, it continued to sell off until it reached <strong>the</strong> area of support at <strong>the</strong> low of <strong>the</strong> OR.<br />
And at <strong>the</strong> low of <strong>the</strong> OR it stopped! After bouncing off <strong>the</strong> support created by <strong>the</strong> OR<br />
low it rallied all <strong>the</strong> way back to <strong>the</strong> area of resistance created by <strong>the</strong> high of <strong>the</strong> OR,<br />
and stopped again! What next It started to sell off from <strong>the</strong> resistance created by <strong>the</strong><br />
high of <strong>the</strong> OR. By waiting until after 10:00 AM for <strong>the</strong> OR to define <strong>the</strong> day’s<br />
significant points of support and resistance you would have been able to anticipate<br />
AMZN’s support at <strong>the</strong> low of its OR and its resistance at <strong>the</strong> high of <strong>the</strong> OR.<br />
As a trader you know that trading is not as easy as <strong>the</strong> AMZN example paints it to be.<br />
<strong>The</strong> real question is how could you have been confident that this time AMZN would<br />
stop at <strong>the</strong> high or <strong>the</strong> low of <strong>the</strong> OR. As with all market patterns or conditions you<br />
can never be certain of <strong>the</strong> outcome. <strong>The</strong>re are, however, two principles of technical<br />
trading that apply to <strong>the</strong> OR trading approach, and that will improve your results.<br />
1. Understand <strong>the</strong> nuances of <strong>the</strong> patterns you are trading. This means you<br />
understand all <strong>the</strong> clues to look for to separate <strong>the</strong> good from <strong>the</strong> bad.<br />
2. Only trade <strong>the</strong> patterns you know!<br />
This means that your analysis of any OR should result in your conclusion that <strong>the</strong><br />
particular OR in question ei<strong>the</strong>r offers some insight into <strong>the</strong> day ahead or it does not.<br />
If it doesn’t <strong>the</strong>n you should not trade it! <strong>The</strong>re are lots of trading opportunities so<br />
don’t trade a market condition where you don’t feel you have some insight. By using<br />
market scanning software like DataView’s HotScans product you can easily find stocks<br />
that have <strong>the</strong> patterns you should be trading.<br />
Three Questions for Analyzing <strong>the</strong> OR<br />
I started this chapter by suggesting that your initial sense of understanding <strong>the</strong> OR<br />
would come in <strong>the</strong> form of being able to use <strong>the</strong> OR to gain insight into <strong>the</strong> condition<br />
of <strong>the</strong> stock. <strong>The</strong> analysis of <strong>the</strong> technical condition of <strong>the</strong> OR can be broken down<br />
into three questions. <strong>The</strong> answers to <strong>the</strong>se questions will give you insight into <strong>the</strong><br />
stock’s current condition. With a little practice <strong>the</strong> answers to <strong>the</strong>se questions can be<br />
figured out very quickly, making <strong>the</strong> analysis of <strong>the</strong> OR very efficient. <strong>The</strong> three<br />
questions and <strong>the</strong>ir explanations are as follows:<br />
http://www.dataviewllc.com/ 24
1. Does <strong>the</strong> OR have a well-defined area of support or resistance at its low or<br />
high<br />
2. Is <strong>the</strong>re a distinctly bullish or bearish bias to <strong>the</strong> OR<br />
3. Is <strong>the</strong> volume for <strong>the</strong> entire OR unusually high<br />
1. Does <strong>the</strong> OR have a well-defined area of support or resistance at its low or<br />
high<br />
If you only focus on one of <strong>the</strong>se three questions this should be <strong>the</strong> one. In fact, <strong>the</strong><br />
o<strong>the</strong>r two questions could be viewed as fur<strong>the</strong>r validation as to whe<strong>the</strong>r or not <strong>the</strong> OR<br />
low or high is a significant area of support or resistance.<br />
Why does it matter<br />
Why is it important to establish whe<strong>the</strong>r or not <strong>the</strong> low (high) represents significant<br />
support (resistance) When you are trading using <strong>the</strong> OR you will approach each day<br />
assuming that <strong>the</strong> OR high and low are likely to be important price levels. But as with<br />
any trading strategy you must let <strong>the</strong> market action confirm your assumptions before<br />
you act on <strong>the</strong>m. If <strong>the</strong> market action in a stock demonstrates that <strong>the</strong> high of its OR<br />
is an area of significant resistance <strong>the</strong>n you know that it will be an important price<br />
level during <strong>the</strong> day. This important price level may turn out to be <strong>the</strong> high for <strong>the</strong> day<br />
or <strong>the</strong> breakout point for <strong>the</strong> day’s bull run. If you knew that a particular price level<br />
was likely to be ei<strong>the</strong>r <strong>the</strong> high for <strong>the</strong> day or a significant breakout point, wouldn’t<br />
you want to focus on that stock and that price level You don’t need to know anything<br />
about <strong>the</strong> OR to understand that.<br />
As a trader you want to focus on a stock when it is likely to move. Watching a stock all<br />
day trying to anticipate when and if it is going to move is not only nerve-racking, it’s<br />
dangerous! It leads to careless trading and over-trading. By anticipating where <strong>the</strong><br />
important price levels will be (<strong>the</strong> OR high and low) you can more quickly identify<br />
<strong>the</strong>m. More importantly, if you see price action which demonstrates that a particular<br />
price area constitutes significant resistance, this is an important point to watch. If you<br />
add <strong>the</strong> fact that this area is also <strong>the</strong> high of <strong>the</strong> emotionally charged OR <strong>the</strong>n you<br />
have two reasons to focus on that price level.<br />
By identifying <strong>the</strong> important price levels as <strong>the</strong>y develop you will be better prepared to<br />
act on <strong>the</strong>m because you will spend your time focusing on how <strong>the</strong> market acts at <strong>the</strong><br />
critical points ra<strong>the</strong>r than analyzing whe<strong>the</strong>r or not <strong>the</strong> price level is important. If you<br />
have a trading plan based on <strong>the</strong> OR you will be able to easily justify sitting on your<br />
hands when that is exactly what you should do, and when <strong>the</strong> setup is right you will<br />
be able to initiate a trade with confidence, after only several seconds of analysis.<br />
When a high or low of <strong>the</strong> OR demonstrates by its price and volume action that it is a<br />
significant area of support or resistance <strong>the</strong> OR should be analyzed fur<strong>the</strong>r. If <strong>the</strong> OR<br />
is sloppy, that is, if <strong>the</strong>re isn’t any well-defined support or resistance, don’t waste your<br />
time watching it. Find an OR setup that is telling you where <strong>the</strong> day’s inflection point<br />
will be. Here’s how.<br />
Identifying Real Support and Resistance<br />
In chapter 3 I discussed <strong>the</strong> concept of support and resistance on daily charts. <strong>The</strong><br />
concept is <strong>the</strong> same when applied to <strong>the</strong> intraday charts of <strong>the</strong> OR. One of <strong>the</strong> major<br />
points in Chapter 3 was that it is important to keep your analysis of support and<br />
resistance levels simple. If you can’t see obvious levels of support and resistance <strong>the</strong>n<br />
don’t try to invent <strong>the</strong>m! <strong>The</strong> same is true for analyzing <strong>the</strong> OR. When you are looking<br />
at <strong>the</strong> price action within <strong>the</strong> OR you are looking for real areas of support and<br />
http://www.dataviewllc.com/ 25
esistance at <strong>the</strong> high and <strong>the</strong> low of <strong>the</strong> OR. Warning – <strong>the</strong>se levels will not always<br />
exist! Your objective is to assess <strong>the</strong> situation not make it up.<br />
In evaluating <strong>the</strong> trading activity within <strong>the</strong> OR you will need to look at a chart with a<br />
time interval that is significantly smaller than <strong>the</strong> time interval of your OR. For<br />
example, if you are evaluating <strong>the</strong> 30-minute OR <strong>the</strong>n a 30- or 15-minute chart will<br />
not tell you much. I prefer to look at a 5-minute chart, but often I will go to a 1-<br />
minute chart to see what <strong>the</strong> trading action was like at <strong>the</strong> OR high or low.<br />
Just as on <strong>the</strong> daily charts, support<br />
and resistance can be characterized<br />
by lots of trading at <strong>the</strong> price level, or<br />
big volume traded at <strong>the</strong> level, or a<br />
violent reversal from <strong>the</strong> price level.<br />
An example of lots of trading at a<br />
price level would be if <strong>the</strong> stock<br />
consolidated near its OR high for 10<br />
of <strong>the</strong> 30 opening minutes. Such price<br />
action would mean that <strong>the</strong> high<br />
should be considered significant<br />
resistance. If <strong>the</strong> stock created a<br />
pattern where it rallied to <strong>the</strong> same<br />
level several times over <strong>the</strong> course of<br />
<strong>the</strong> OR period only to sell off each<br />
time, <strong>the</strong>n its high would be<br />
considered significant resistance.<br />
Figure 4-2 illustrates an example of<br />
significant resistance formed at <strong>the</strong><br />
OR high. <strong>The</strong> concept is <strong>the</strong> same<br />
when looking for significant support at<br />
<strong>the</strong> OR low.<br />
Figure 4-2: 1-Minute Chart of Tech Data<br />
Corp. (TECD)<br />
TECD’s 30-minute OR is highlighted. Notice how<br />
This part of analyzing <strong>the</strong> OR is based<br />
TECD spent <strong>the</strong> majority of <strong>the</strong> first 30 minutes<br />
on reading bar charts. But <strong>the</strong><br />
trading near <strong>the</strong> high of <strong>the</strong> OR. This indicated<br />
objective is to identify basic support that <strong>the</strong> OR high would be a significant price<br />
and resistance patterns – point. Notice how quickly TECD rallied when it<br />
consolidation or big volume with price broke <strong>the</strong> OR high and how it served as support<br />
spikes rejecting a price level. <strong>The</strong> best after <strong>the</strong> initial breakout!<br />
way to improve your ability to identify<br />
support and resistance quickly is to practice. Look at hundreds of charts!<br />
It will become clearer in <strong>the</strong> next chapter that <strong>the</strong> insistence on well-defined price<br />
levels serves not only to shift <strong>the</strong> winning odds in your favor; it is also important from<br />
<strong>the</strong> money management side of <strong>the</strong> trade analysis. So be prepared to sit on your<br />
hands and watch a sloppy OR pattern explode into a big mover. It will happen.<br />
Remember one of <strong>the</strong> rules of technical trading I spoke about earlier – only trade <strong>the</strong><br />
patterns you know. If <strong>the</strong> OR does not demonstrate <strong>the</strong> pattern you are looking for<br />
<strong>the</strong>n don’t trade it. <strong>Trading</strong> is a business that seeks to make money through <strong>the</strong><br />
execution of a trading plan. For <strong>the</strong> purposes of this book, <strong>the</strong> plan is to trade stocks<br />
that demonstrate that <strong>the</strong>ir OR high and or low are significant levels before we initiate<br />
a position.<br />
http://www.dataviewllc.com/ 26
2. Is <strong>the</strong>re a distinctly bullish or bearish bias to <strong>the</strong> OR<br />
Answering this question also<br />
requires some chart-reading<br />
experience, but <strong>the</strong>re are<br />
some simple patterns to look<br />
for to get started. First, look to<br />
see if most of <strong>the</strong> trading is<br />
near one end of <strong>the</strong> range. Has<br />
<strong>the</strong> stock spent most of its OR<br />
period near <strong>the</strong> highs of <strong>the</strong><br />
OR If so, this is bullish. In <strong>the</strong><br />
AMZN example from Figure 4-<br />
3 you can see that AMZN<br />
spent a fair amount of time at<br />
both its high and its low after<br />
starting <strong>the</strong> day in <strong>the</strong> middle.<br />
This would not be an example<br />
of a decidedly bullish or<br />
bearish OR. However, it is a<br />
great example of an OR with<br />
both a well-defined low and<br />
high! So AMZN in Figure 4-3<br />
represents an OR which is<br />
nei<strong>the</strong>r bullish nor bearish but<br />
very tradable.<br />
Figure 4-3: 1-Minute Chart of Amazon (AMZN)<br />
AMZN’s 30-minute <strong>Opening</strong> <strong>Range</strong> is highlighted in<br />
yellow. <strong>The</strong> red and blue horizontal lines mark <strong>the</strong> OR<br />
high and low for <strong>the</strong> rest of <strong>the</strong> day. <strong>The</strong> numerous swing<br />
highs and lows at <strong>the</strong> OR high and low make this a very<br />
well-defined OR.<br />
An example of a bullish<br />
pattern would be one where<br />
<strong>the</strong> stock not only spent <strong>the</strong><br />
majority of <strong>the</strong> OR period near<br />
<strong>the</strong> high but also continued to<br />
form higher lows in its<br />
consolidation near <strong>the</strong> highs.<br />
Some market technicians call<br />
this formation a pennant,<br />
which is a bullish continuation<br />
pattern. Figure 4-4 illustrates<br />
an example of this. It is also<br />
bullish if <strong>the</strong> low of <strong>the</strong> OR<br />
happened early in <strong>the</strong> period<br />
so as to create <strong>the</strong> situation<br />
where <strong>the</strong> stock has only<br />
rallied today and <strong>the</strong> pennant<br />
represents its first pause in an<br />
up-trending day.<br />
Figure 4-4: 5-Min. Chart of Sohu.com (SOHU)<br />
SOHU’s pattern of successively higher lows while bumping<br />
up against <strong>the</strong> resistance of <strong>the</strong> OR high is very bullish.<br />
http://www.dataviewllc.com/ 27
3. Is <strong>the</strong> volume for <strong>the</strong> entire OR unusually high<br />
Every stock will have an <strong>Opening</strong> <strong>Range</strong> every day. So how do you know which day<br />
will be explosive Well-defined support and resistance won’t tell you. A bullish bias<br />
pattern in <strong>the</strong> OR may give you a hint, but your best clue is volume. Simply stated,<br />
volume indicates interest. Lots of interest usually brings out <strong>the</strong> fear and greed in<br />
traders and that is what makes for an explosive day. Big volume during <strong>the</strong> OR means<br />
<strong>the</strong>re is something unusual going on and that is exactly what you want if you are<br />
looking for a big breakout day. Big volume relative to <strong>the</strong> stock’s normal volume will<br />
not guarantee <strong>the</strong> direction <strong>the</strong> stock will trade, but it will usually indicate that <strong>the</strong><br />
stock will be volatile. If you are looking for a breakout of <strong>the</strong> OR you will want to see<br />
<strong>the</strong> volume increase as <strong>the</strong> stock breaks out above <strong>the</strong> OR. But, how many times have<br />
you watched a stock break out on light volume only to see <strong>the</strong> volume come pouring<br />
in after <strong>the</strong> price has risen too far above <strong>the</strong> breakout point for you to chase it How<br />
could you have known that would happen so that you would not have waited for <strong>the</strong><br />
volume that came in too late You can’t know for sure, but stocks that have big<br />
volume in <strong>the</strong> OR period will often see big volume return at various times during <strong>the</strong><br />
day, especially if <strong>the</strong> OR is broken.<br />
Big volume during <strong>the</strong> OR also increases <strong>the</strong> significance of <strong>the</strong> high and low OR levels<br />
simply because, as previously discussed, volume is a consideration in determining <strong>the</strong><br />
validity of support or resistance. So if volume begets volume and it increases <strong>the</strong><br />
significance of support and resistance <strong>the</strong>n <strong>the</strong>re are two good reasons to focus on<br />
stocks where <strong>the</strong> OR, or <strong>the</strong> whole day, has experienced unusually large volume.<br />
Scanning <strong>the</strong> market for stocks that are near <strong>the</strong>ir OR high with big volume for <strong>the</strong><br />
day (and in <strong>the</strong>ir OR) is an easy task with DataView’s HotScans product.<br />
Putting it all toge<strong>the</strong>r<br />
I’ve defined and discussed <strong>the</strong> OR<br />
in terms of both a specific price<br />
range and a defined time period.<br />
Most of <strong>the</strong> examples we’ve<br />
looked at thus far have illustrated<br />
all <strong>the</strong> requisite characteristics<br />
within <strong>the</strong> OR period (before<br />
10:00 AM). <strong>The</strong> markets are not<br />
always so pristine. As a result you<br />
must continue to evaluate <strong>the</strong><br />
importance of <strong>the</strong> OR as <strong>the</strong> day<br />
progresses past your OR time<br />
period. So how should you<br />
interpret <strong>the</strong> price action after <strong>the</strong><br />
<strong>Opening</strong> <strong>Range</strong> period<br />
<strong>The</strong> answer is simple. You are<br />
looking for all <strong>the</strong> same criteria –<br />
answering <strong>the</strong> same three<br />
questions. <strong>The</strong> <strong>Opening</strong> <strong>Range</strong>,<br />
after all, is a price range more<br />
than a time period. After <strong>the</strong> OR<br />
time period has passed, <strong>the</strong> stock<br />
Figure 4-5: 1-Minute Chart of Amazon, Inc.<br />
(AMZN)<br />
AMZN 30-minute OR high and low became more<br />
significant as <strong>the</strong> trading day developed.<br />
is still developing its patterns<br />
within its established price range.<br />
This means that a stock may build upon its OR for much longer than <strong>the</strong> first half hour<br />
of <strong>the</strong> day. Let’s return to <strong>the</strong> AMZN example (Figure 4-5).<br />
http://www.dataviewllc.com/ 28
This example shows <strong>the</strong> trading pattern until about 11:00 AM. As I described earlier<br />
AMZN continued to demonstrate that <strong>the</strong> price levels of $46.06 and $46.66 were<br />
critical levels for <strong>the</strong> day. In essence it was validating that AMZN had well-defined<br />
support and resistance. Often <strong>the</strong> significance of <strong>the</strong> OR levels is not clear until you<br />
see how <strong>the</strong> stock trades after <strong>the</strong> OR period. In <strong>the</strong> case of AMZN, it had a much<br />
better-looking <strong>Opening</strong> <strong>Range</strong> setup at 11:00 AM than it did at 10:00 AM because you<br />
could say with even greater certainty that <strong>the</strong> day’s inflection points would be <strong>the</strong> very<br />
well-defined OR levels of $46.06 and $46.66.<br />
As <strong>the</strong> day progresses you will evaluate <strong>the</strong> day’s price action by answering <strong>the</strong> same<br />
three questions in reference to <strong>the</strong> OR high and low:<br />
1. Is <strong>the</strong> day’s price action validating that <strong>the</strong> OR high and OR low are areas of<br />
support or resistance<br />
2. Is <strong>the</strong>re a distinctly bullish or bearish bias to <strong>the</strong> trading within or beyond <strong>the</strong><br />
OR (beyond <strong>the</strong> OR will be covered in <strong>the</strong> next chapter).<br />
3. Has <strong>the</strong>re been unusually high volume near <strong>the</strong> OR high or low<br />
Don’t Ignore <strong>the</strong> Stock’s Big Picture<br />
This book will focus on showing you how <strong>the</strong> OR can serve as a road map for reading<br />
intraday price action and how to translate this into trading strategies. It is just as<br />
important to understand how <strong>the</strong> stock is trading relative to its OR as it is to<br />
understand where <strong>the</strong> OR is relative to <strong>the</strong> stock’s big picture. For me <strong>the</strong> big picture<br />
is represented primarily by <strong>the</strong> daily chart. In short, you should look for bullish OR<br />
patterns in stocks that have bullish daily charts. Unfortunately, evaluating <strong>the</strong><br />
condition of a stock’s daily chart is beyond <strong>the</strong> scope of this book.<br />
<strong>The</strong> book’s focus leads to <strong>the</strong> suggestion of evaluating a stock’s <strong>Opening</strong> <strong>Range</strong> first<br />
and <strong>the</strong>n checking <strong>the</strong> stock’s longer-term condition. DataView’s HotScans product<br />
(www.dataviewllc.com) makes it very easy to find <strong>the</strong> most powerful OR setups every<br />
day as <strong>the</strong>y develop. This enables you to be more flexible in terms of <strong>the</strong> variety of<br />
longer-term patterns you will trade. However, <strong>the</strong> stock selection process is just as<br />
valid in <strong>the</strong> reverse order. First identify a list of candidates based on your swing trade<br />
criteria, and <strong>the</strong>n use <strong>the</strong> OR to time your entry. By using <strong>the</strong> OR to time your entry<br />
for a day trade or a swing trade you will find that you can avoid getting caught<br />
chasing strong openings that fail immediately.<br />
http://www.dataviewllc.com/ 29
Chapter 5. <strong>Trading</strong> Breakouts and Breakdowns<br />
• How to Define Your Risk, and Where to Place Your Stop<br />
• Three Tactical <strong>Trading</strong> Approaches for <strong>the</strong> OR Breakout<br />
• What to Look for in a Breakout<br />
• Don’t Chase <strong>the</strong> One that Got Away<br />
Now that I’ve analyzed how to identify a stock’s OR as being tradable, sloppy, bullish<br />
or bearish it’s time to discuss how to trade <strong>the</strong> good-looking <strong>Opening</strong> <strong>Range</strong>s. I will<br />
also be looking at <strong>the</strong> linkages between trading OR breakouts and previously discussed<br />
topics such as support and resistance.<br />
<strong>The</strong>re are a lot of different ways to trade <strong>the</strong> OR. In <strong>the</strong> next two chapters I’ll outline<br />
two basic OR setups: <strong>the</strong> OR breakout, and fading <strong>the</strong> OR low. <strong>The</strong>se represent <strong>the</strong><br />
foundation of OR trading and <strong>the</strong>y can easily be adapted to your own trading style.<br />
This chapter will show you how to trade with <strong>the</strong> stock’s momentum by buying<br />
breakouts. This discussion will be based on trading from <strong>the</strong> long side, but <strong>the</strong> same<br />
concepts can be applied to shorting.<br />
<strong>The</strong>re is no point in taking a trade that doesn’t make sense from a money<br />
management perspective. So I’ll start with <strong>the</strong> tactics of trading <strong>the</strong> OR breakout<br />
using smart money management.<br />
How to Define Your Risk, and Where to Place Your Stop<br />
<strong>Trading</strong> any breakout including <strong>the</strong> OR breakout is a simple concept, but <strong>the</strong>re are<br />
some nuances to <strong>the</strong> pattern, and a few tactical trading approaches to consider.<br />
Before you trade, know your risk<br />
Before you enter a trade you should know your stop loss point. This is <strong>the</strong> price at<br />
which you will exit <strong>the</strong> trade in <strong>the</strong> event that <strong>the</strong> stock moves against you before you<br />
are able to take your profits. <strong>The</strong> loss that you expect to incur if you exit at your stop<br />
loss point is your “risk”. As discussed in chapter 3, <strong>the</strong> risk/reward ratio is based on<br />
this risk calculation. It is best to use a combination of money management and <strong>the</strong><br />
stock’s price action to determine your risk.<br />
Recall <strong>the</strong> discussion about breakouts from chapter 3. <strong>The</strong> rationale behind buying <strong>the</strong><br />
breakout is that <strong>the</strong> pent-up demand from <strong>the</strong> consolidation period will propel <strong>the</strong><br />
stock higher once <strong>the</strong> resistance of <strong>the</strong> consolidation is broken. On <strong>the</strong> o<strong>the</strong>r hand, if<br />
<strong>the</strong> stock trades below <strong>the</strong> consolidation <strong>the</strong>n <strong>the</strong> support will become resistance and<br />
<strong>the</strong> stock will likely trade lower.<br />
When you are buying breakouts determining your risk based on <strong>the</strong> stock’s price<br />
action is straightforward. In <strong>the</strong> worst case, your risk is <strong>the</strong> low of <strong>the</strong> consolidation.<br />
This is because when you buy a breakout you are anticipating that <strong>the</strong> resistance<br />
which <strong>the</strong> stock just violated will become support. If <strong>the</strong> highest point of <strong>the</strong><br />
consolidation does not serve as support <strong>the</strong>n, at <strong>the</strong> very least, <strong>the</strong> rest of <strong>the</strong><br />
consolidation down to <strong>the</strong> low of <strong>the</strong> range should act as support. If <strong>the</strong> stock breaks<br />
out and subsequently trades below <strong>the</strong> low of <strong>the</strong> consolidation, <strong>the</strong>n your assumption<br />
about <strong>the</strong> breakout has been proven wrong by <strong>the</strong> market and your rationale for being<br />
in <strong>the</strong> trade no longer holds. This is why <strong>the</strong> low of <strong>the</strong> consolidation defines <strong>the</strong> most<br />
logical stop loss point and risk for a breakout trade.<br />
http://www.dataviewllc.com/ 30
As a general rule <strong>the</strong> OR defines <strong>the</strong> consolidation from which <strong>the</strong> stock is breaking<br />
out. This is why chapter 4 described “well-defined support and resistance” as <strong>the</strong> most<br />
important qualities of a good OR. If you apply this discussion of risk to <strong>the</strong> OR, your<br />
maximum risk point for an OR breakout is <strong>the</strong> low of <strong>the</strong> OR.<br />
Reduce your risk<br />
If <strong>the</strong> risk on an OR breakout is <strong>the</strong> low of <strong>the</strong> OR you will find that using <strong>the</strong> 30-<br />
minute OR will often define risk values of over $0.75 or even a dollar per share. This is<br />
not desirable if you are also looking for an adequate risk/reward ratio of at least 2:1.<br />
If your OR is $1 and you are looking for trades where you can anticipate a 2:1<br />
risk/reward ratio <strong>the</strong>n you would have to expect <strong>the</strong> stock to move $2 from <strong>the</strong> high of<br />
<strong>the</strong> OR in one day. For most stocks that is an unrealistic expectation. <strong>The</strong>re are,<br />
however, a few ways to raise your stop loss point or reduce <strong>the</strong> risk, and find trades<br />
with a 2:1 or higher risk/reward profile.<br />
<strong>The</strong> first way to reduce risk is to use a hard stop. This means you decide how much<br />
money you are willing to risk on <strong>the</strong> trade and figure out <strong>the</strong> stock’s stop loss point<br />
accordingly, regardless of where that stop loss point is on <strong>the</strong> stock’s chart. I,<br />
however, prefer to use trading tactics that enable me to set my stops based on levels<br />
<strong>the</strong> market has defined ra<strong>the</strong>r than using a hard stop. If I can’t find a good stop or<br />
risk point <strong>the</strong>n I generally pass on <strong>the</strong> trade.<br />
Three Tactical <strong>Trading</strong> Approaches for <strong>the</strong> OR Breakout<br />
In general, <strong>the</strong> way to reduce your risk while using market action to determine stops<br />
is to choose <strong>the</strong> right trading tactics for <strong>the</strong> given market condition. Finding a good<br />
risk point when trading <strong>the</strong> OR breakout is not rocket science. Like everything else<br />
I’ve described, it’s just a matter of knowing what to look for. Here are three<br />
approaches to trading <strong>the</strong> OR breakout designed to minimize risk:<br />
1. Buy <strong>the</strong> initial breakout when <strong>the</strong> conditions are right<br />
2. Buy <strong>the</strong> retracement to <strong>the</strong> breakout when you need confirmation<br />
3. Buy <strong>the</strong> second breakout when you need more confirmation<br />
1. Buy <strong>the</strong> initial breakout when <strong>the</strong> conditions are right<br />
Buying <strong>the</strong> initial breakout is as straightforward as it sounds. <strong>The</strong> objective is to buy<br />
<strong>the</strong> stock as soon as it breaks <strong>the</strong> OR high. This can be viewed as <strong>the</strong> most aggressive<br />
approach because it does not allow you to see any form of confirmation that <strong>the</strong><br />
stock’s break above <strong>the</strong> resistance level will follow through. Because this strategy does<br />
not allow for waiting for any confirmation of <strong>the</strong> breakout, it should be reserved for<br />
<strong>the</strong> most promising OR setups.<br />
Buying <strong>the</strong> initial breakout has <strong>the</strong> advantage of often providing <strong>the</strong> least expensive<br />
entry point for <strong>the</strong> strongest stocks. When using this approach your risk is defined by<br />
<strong>the</strong> low of <strong>the</strong> last swing prior to <strong>the</strong> breakout. Figure 5-1 is an example showing<br />
SOHU during its initial breakout.<br />
http://www.dataviewllc.com/ 31
Figure 5-1: 5-Minute Chart of Sohu.com (SOHU)<br />
SOHU experienced unusually<br />
large volume during its 30-<br />
minute OR (highlighted in<br />
yellow). It <strong>the</strong>n spent <strong>the</strong> next<br />
few hours consolidating in a<br />
bullish pattern near <strong>the</strong> OR high<br />
of $33.00. <strong>The</strong> initial breakout<br />
above $33.00 occurred at 12:50<br />
PM on big volume. When SOHU<br />
broke out its last swing low was<br />
at $32.55. This means <strong>the</strong> risk<br />
was about $0.50 on a stock that<br />
often moves well over $1.00<br />
quickly. As you can see, <strong>the</strong><br />
breakout was followed by a bigvolume<br />
rally of $1 over <strong>the</strong><br />
following 30 minutes. <strong>The</strong>n, after<br />
a low-volume consolidation<br />
period SOHU made ano<strong>the</strong>r surge<br />
to a high of $34.72<br />
2. Buy <strong>the</strong> retracement to <strong>the</strong> breakout when you need confirmation<br />
Even <strong>the</strong> best breakouts will often pull back to <strong>the</strong> support created by <strong>the</strong> former<br />
resistance level from which <strong>the</strong> stock initially broke out. By waiting for such a<br />
retracement you have <strong>the</strong> opportunity to evaluate how well <strong>the</strong> stock broke out. For<br />
example, did it break out with big volume You also have <strong>the</strong> luxury of seeing how <strong>the</strong><br />
stock trades above <strong>the</strong> OR. When using this approach you are looking for <strong>the</strong> market<br />
to create a swing low at or near <strong>the</strong> breakout price level. As soon as <strong>the</strong> market<br />
demonstrates that a swing low may be in place you can buy <strong>the</strong> stock with a stop<br />
below that swing low or, more conservatively, below <strong>the</strong> low of <strong>the</strong> breakout’s<br />
consolidation.<br />
<strong>The</strong> advantage of waiting for confirmation and a retracement is that you have more<br />
information before you enter <strong>the</strong> trade and you will not get caught buying a stock that<br />
fails immediately after it breaks out (which of course can happen when you buy <strong>the</strong><br />
initial breakout). <strong>The</strong> disadvantage is that not all breakouts retrace. So waiting for a<br />
retracement may cause you to miss <strong>the</strong> best opportunity that a particular stock has to<br />
offer that day. If you have software such as DataView’s HotScans that scans <strong>the</strong><br />
market for new breakout opportunities all day in real time, <strong>the</strong>n missing <strong>the</strong> one that<br />
got away is not a concern. <strong>The</strong>re are a lot of opportunities everyday. Be patient, and<br />
get in at <strong>the</strong> right time as determined by your risk. Don’t take trades late because you<br />
feel as though you are going to miss out.<br />
This approach is not only good for waiting for confirmation. It is also a way to<br />
participate in a stock that had a strong breakout that you missed earlier in <strong>the</strong> day.<br />
One way this pattern can present itself is when <strong>the</strong> overall market experiences a selloff<br />
during <strong>the</strong> day that pulls down stocks that had strong breakouts in <strong>the</strong> morning.<br />
But <strong>the</strong>se strong breakouts only sell off to <strong>the</strong> high of <strong>the</strong>ir OR. <strong>The</strong>n, if <strong>the</strong> market’s<br />
http://www.dataviewllc.com/ 32
sell-off reverses or just stops, <strong>the</strong> stocks that were strong in <strong>the</strong> morning but sold off<br />
to <strong>the</strong> support of <strong>the</strong> high of <strong>the</strong>ir OR become great candidates for an afternoon rally.<br />
Figure 5-2 is an example of how stocks may retrace right back to <strong>the</strong> OR high.<br />
Figure 5-2: 5-Minute Chart of Amkor Tech. (AMKR)<br />
AMKR’s 30-minute OR on<br />
this day was an unusually<br />
narrow one at only $0.14. It<br />
was also one of average<br />
volume. But on <strong>the</strong> daily<br />
chart AMKR was trading near<br />
a 52-week high. After it<br />
broke out of its 30-minute<br />
OR it drifted quietly higher<br />
before a big volume surge<br />
made it an interesting<br />
candidate for a retracement<br />
back to support at its OR<br />
high. In an orderly, very low<br />
volume retracement AMKR<br />
retraced back to bounce off<br />
its 30-minute OR before<br />
starting <strong>the</strong> day’s biggest<br />
rally.<br />
3. Buy <strong>the</strong> second breakout when you need more confirmation<br />
This is very similar to waiting for a retracement in that you have <strong>the</strong> luxury of waiting<br />
for confirming price and volume action.<br />
Figure 5-3: 5-Minute Chart of Lexar Media, Inc. (LEXR)<br />
It is not obvious in this chart<br />
but LEXR had big volume<br />
during <strong>the</strong> beginning of its 30-<br />
minute OR. <strong>The</strong> OR high was<br />
$10.00 which was $0.03 above<br />
a significant consolidation on<br />
<strong>the</strong> daily chart. When LEXR<br />
broke out of its 30-minute OR<br />
it did so on huge volume. It<br />
<strong>the</strong>n proceeded to form<br />
ano<strong>the</strong>r consolidation pattern<br />
with its low being supported by<br />
<strong>the</strong> high of <strong>the</strong> 30-minute OR.<br />
This second consolidation<br />
pattern served as confirmation<br />
of <strong>the</strong> initial breakout and a<br />
setup for trading <strong>the</strong> second<br />
breakout. Notice <strong>the</strong> second<br />
breakout (above $10.13) also<br />
occurred on big volume.<br />
http://www.dataviewllc.com/ 33
In this approach you wait for <strong>the</strong> stock to consolidate above <strong>the</strong> OR to confirm that it<br />
has <strong>the</strong> strength to hold its new high levels. After <strong>the</strong> stock has consolidated or<br />
flagged lower this strategy buys <strong>the</strong> next breakout to new highs. In this approach your<br />
risk is <strong>the</strong> low of <strong>the</strong> second consolidation area from which <strong>the</strong> stock broke out.<br />
This approach is ano<strong>the</strong>r way to participate in a stock that had a strong breakout that<br />
you missed earlier in <strong>the</strong> day. Figure 5-3 is an example of buying <strong>the</strong> second<br />
breakout. This, as with all of <strong>the</strong> examples in this book, were identified using<br />
DataView’s HotScans product. This particular one showed up at <strong>the</strong> initial breakout<br />
and <strong>the</strong>n again at <strong>the</strong> second breakout.<br />
What to Look for in a Breakout<br />
Now that you know three tactical approaches to trading <strong>the</strong> breakout, let’s look at how<br />
to recognize which OR breakouts are <strong>the</strong> best to trade. Again, I’ve created a quick<br />
checklist for evaluating a stock’s price and volume action. Remember <strong>the</strong>se criteria are<br />
used not only to find stocks that are likely to lead to a successful breakout, but also to<br />
define good risk points based on <strong>the</strong> stock’s price and volume action.<br />
1. Good consolidation before <strong>the</strong> breakout<br />
2. High relative volume at <strong>the</strong> breakout<br />
3. A clean breakout followed by bullish price action<br />
4. A bullish big picture<br />
As with any pattern analysis, you will not always find that all of <strong>the</strong> criteria are met.<br />
Your task as a trader is to be able to identify good trading opportunities based on <strong>the</strong><br />
criteria that are met in a quality way, and <strong>the</strong>n use <strong>the</strong> correct trading tactics to<br />
exploit <strong>the</strong> opportunity. For example, if a stock exhibits all four characteristics of a<br />
good breakout <strong>the</strong>n it may be a candidate for <strong>the</strong> more aggressive strategy of buying<br />
<strong>the</strong> initial breakout. If <strong>the</strong> stock only has a couple of <strong>the</strong> characteristics <strong>the</strong>n you<br />
should use a tactic that allows you to see some confirmation before you act.<br />
Remember you should also avoid stocks that don’t exhibit an easily identifiable trading<br />
opportunity. <strong>The</strong> best way to avoid such stocks is to use a scanning process involving<br />
software such as HotScans and practice reading charts to quickly find good<br />
candidates. This way you are less likely to settle for inferior candidates due to a lack<br />
of time or patience.<br />
1. Good consolidation before <strong>the</strong> breakout<br />
Good consolidation can come in two forms: a tight trading range with well-defined<br />
support and resistance, or an orderly flagging pattern which forms a well-defined<br />
swing low. By now <strong>the</strong> concept of a well-defined trading range should be familiar. It is<br />
<strong>the</strong> same concept that was discussed in chapter 3 and chapter 4. In some cases this<br />
may characterize <strong>the</strong> whole OR, but more often than not you will be looking for a<br />
tighter consolidation at <strong>the</strong> top end of <strong>the</strong> OR. Ideally, <strong>the</strong> top of this consolidation will<br />
be <strong>the</strong> same price as <strong>the</strong> OR high. It can, however, be slightly above or below <strong>the</strong> OR.<br />
When this occurs you will be buying a breakout through a point that represents <strong>the</strong><br />
inflection point of two time frames – <strong>the</strong> OR and <strong>the</strong> smaller consolidation at <strong>the</strong> top of<br />
<strong>the</strong> OR. A good consolidation pattern at <strong>the</strong> high of <strong>the</strong> OR is important because it<br />
demonstrates that traders view <strong>the</strong> OR high as a significant price level.<br />
As a side note, if this point also happens to be at or slightly above <strong>the</strong> prior day’s high<br />
<strong>the</strong> breakout becomes even more significant. <strong>The</strong> prior day’s high is always a potential<br />
area of resistance, so when <strong>the</strong> stock trades above this high it is a bullish signal.<br />
http://www.dataviewllc.com/ 34
An OR with good consolidation near its high and a bullish OR pattern is a situation<br />
where buying <strong>the</strong> initial breakout often makes sense. <strong>The</strong> SOHU example in Figure 5-1<br />
illustrates a tight, well-defined consolidation at <strong>the</strong> top of <strong>the</strong> OR.<br />
An orderly flagging pattern is ano<strong>the</strong>r way in which <strong>the</strong> market provides confirmation<br />
that <strong>the</strong> price point you are trading is significant, while at <strong>the</strong> same time providing a<br />
logical risk point. Figure 5-4 provides an example of a flagging pattern in QLGC.<br />
Figure 5-4: 5-Minute Chart of Qlogic Corp. (QLGC)<br />
QLGC broke out of its OR and <strong>the</strong>n spent 15 minutes flagging on light<br />
volume (highlighted in yellow). This created a consolidation pattern and a<br />
swing low to trade.<br />
In addition to <strong>the</strong> example of a flagging pattern, QLGC illustrates how <strong>the</strong> OR high,<br />
like all resistance levels, should be considered an area, not a point. This area should<br />
<strong>the</strong>n be validated by market action. QLGC experienced a significant rally to an OR high<br />
which did not have a very well-defined resistance level. <strong>The</strong> OR high was $49.60, but<br />
QLGC did not stop at that exact price. At 12:05 PM it traded through $49.60 and<br />
stopped at $49.70 before pausing and flagging (highlighted in yellow). By flagging,<br />
however, QLGC defined its new high for <strong>the</strong> day of $49.70 (labelled as “Breakout” and<br />
shown as a solid red line) as <strong>the</strong> significant price level for trading <strong>the</strong> OR breakout.<br />
Until <strong>the</strong> flagging action occurred you could not have known whe<strong>the</strong>r or not <strong>the</strong> OR<br />
high area would be significant. As soon as you see <strong>the</strong> flagging pattern you know that<br />
<strong>the</strong> real OR breakout will be at <strong>the</strong> high of <strong>the</strong> flag ($49.70). If <strong>the</strong> flag is orderly and<br />
shallow you also have a well-defined risk point. Note how $49.70 was a key price level<br />
for <strong>the</strong> remainder of <strong>the</strong> day. First, at 1:00 PM it was <strong>the</strong> point from which <strong>the</strong> stock<br />
broke out on big volume, <strong>the</strong>n it served as support around 1:20 PM, and it acted as<br />
support again around 2:25 PM.<br />
http://www.dataviewllc.com/ 35
<strong>The</strong>re was ano<strong>the</strong>r clue that QLGC’s break above <strong>the</strong> OR was setting up to be a good<br />
trade - big volume. In fact, if you were scanning <strong>the</strong> market for good OR breakouts<br />
this may have been <strong>the</strong> reason you were alerted to this stock at 12:05 PM.<br />
Example of an initial breakout trading opportunity<br />
As described above and shown in <strong>the</strong> chart, QLGC initially broke out of its OR of<br />
$49.60 at 12:05 PM. At this point it had rallied without interuption from about $49.30.<br />
As a result of its uninterrupted rally it did not offer a good swing low or consolidation<br />
area to be used as a risk point. If you were to buy <strong>the</strong> breakout of $49.60 your only<br />
logical stop based on <strong>the</strong> market would have been <strong>the</strong> low of <strong>the</strong> day, $49.10, which<br />
was $0.50 away and too big a risk. <strong>The</strong>refore, if QLGC had not stopped at $49.70 and<br />
had continued straight to $50 or higher I would have sat on my hands and looked for<br />
opportunities in o<strong>the</strong>r stocks.<br />
QLGC did stop, and by stopping it not only presented a trading opportunity, but also<br />
validated <strong>the</strong> OR high area as a significant level. <strong>The</strong> orderly three-bar flagging<br />
pattern on low volume provided a swing low around $49.55 to be used as your risk<br />
point (labelled as “<strong>Swing</strong> Low Stop” and shown as a solid green line). <strong>The</strong> trading<br />
opportunity was to buy a new high over $49.70 with a stop loss below <strong>the</strong> swing low<br />
of $49.55. You have now defined your risk as $0.15 plus slippage. Now ask yourself<br />
this question, “Based on QLGC’s normal level of volatility is it reasonable to expect<br />
that I could make at least twice <strong>the</strong> risk or at least $0.30” <strong>The</strong> answer is clearly yes,<br />
so <strong>the</strong>re is a good OR breakout trading opportunity here. This analysis of identifying<br />
your risk, trigger (entry point) and potential risk/reward is <strong>the</strong> process you should go<br />
through before entering any trade.<br />
2. High relative volume at <strong>the</strong> breakout<br />
As a stock consolidates following a rally it is undergoing a change in ownership.<br />
Consolidation is a period where <strong>the</strong> relative strength of supply and demand forces is<br />
unclear. New buyers (demand) are accumulating positions from ei<strong>the</strong>r longs taking<br />
profits or shorts establishing positions (supply). During <strong>the</strong> consolidation phase it is<br />
often very difficult to tell whe<strong>the</strong>r <strong>the</strong> new buyers of <strong>the</strong> stock are strong buyers<br />
intending to hold <strong>the</strong> stock for some time, or weak buyers who will sell at <strong>the</strong> first<br />
opportunity to take profits or at <strong>the</strong> first sign of trouble. As discussed in chapter 3<br />
volume is <strong>the</strong> most common form of confirmation in reading a stock’s chart.<br />
Confirmation means that <strong>the</strong> market has demonstrated in an additional way that a<br />
particular price point is significant or that <strong>the</strong> trend is likely to continue.<br />
When a stock breaks out above <strong>the</strong> consolidation high <strong>the</strong> supply and demand picture<br />
often becomes clear. If <strong>the</strong> breakout occurs with an increase in volume it is<br />
confirmation that <strong>the</strong> demand for <strong>the</strong> stock was not satisfied during <strong>the</strong> consolidation<br />
phase and bulls are willing not only to pay higher prices but also to buy an increasing<br />
amount of stock at higher prices. Put ano<strong>the</strong>r way, <strong>the</strong> new buyers are demonstrating<br />
that <strong>the</strong>y are strong holders looking for a bigger move than just a quick scalp.<br />
Ideally <strong>the</strong> breakout on an increase in volume will be <strong>the</strong> first leg up of a trend that<br />
will follow <strong>the</strong> healthy trend pattern described in chapter 3. In <strong>the</strong> case of a healthy<br />
breakout <strong>the</strong> first correction into <strong>the</strong> breakout level should happen on lower volume<br />
than for <strong>the</strong> breakout move up. <strong>The</strong> next advance should experience ano<strong>the</strong>r surge in<br />
volume. LEXR in Figure 5-5 is an example of a stock that had a huge volume<br />
breakout followed by a low-volume consolidation period above <strong>the</strong> OR high.<br />
http://www.dataviewllc.com/ 36
You can see in <strong>the</strong> chart in Figure 5-5<br />
that as LEXR moved to <strong>the</strong> high of its<br />
second consolidation phase ($10.13)<br />
at 1:00 PM <strong>the</strong> volume picked up. This<br />
was followed by a pause for about 10<br />
minutes on lower volume and <strong>the</strong>n a<br />
big-volume breakout of <strong>the</strong> $10.13<br />
level. LEXR did retrace from this<br />
second breakout but it only traded<br />
down to $10.09. <strong>The</strong> prior<br />
consolidation area served as support,<br />
as expected. That afternoon LEXR<br />
continued to demonstrate increasing<br />
volume whenever it traded higher. As<br />
you can see LEXR closed <strong>the</strong> day at<br />
$10.49.<br />
Often <strong>the</strong> breakout will occur on light<br />
volume but as <strong>the</strong> stock climbs <strong>the</strong><br />
volume will increase. This is also a<br />
positive sign. In <strong>the</strong> prior example of<br />
AMKR in Figure 5-2 <strong>the</strong> breakout<br />
occurred on average volume. <strong>The</strong><br />
stock climbed slowly and quietly for<br />
about 15 minutes before massive<br />
volume created <strong>the</strong> explosive<br />
confirmation that <strong>the</strong> breakout was<br />
real. By <strong>the</strong> time <strong>the</strong> volume was<br />
Figure 5-5: 5-Minute Chart of Lexar<br />
Media (LEXR)<br />
LEXR broke out of <strong>the</strong> OR on big volume and <strong>the</strong>n<br />
consolidated on lighter volume (highlighted in<br />
yellow) before breaking out a second time on big<br />
volume.<br />
evident AMKR had moved too far above <strong>the</strong> breakout point for a purchase based on<br />
<strong>the</strong> initial breakout, but it became a confirmed breakout and <strong>the</strong>refore a candidate to<br />
monitor for a trade on a retracement.<br />
<strong>The</strong> danger sign to watch for at <strong>the</strong> breakout is <strong>the</strong> opposite price pattern. If <strong>the</strong> stock<br />
breaks out on good volume but immediately reverses and trades below <strong>the</strong> breakout<br />
point on continued big volume it means that <strong>the</strong>re is too much supply at <strong>the</strong> new high<br />
price. This is a major warning sign. <strong>The</strong> big volume at <strong>the</strong> breakout will now represent<br />
significant resistance if <strong>the</strong> stock is below it. This pattern of a big-volume reversal at<br />
<strong>the</strong> top of <strong>the</strong> OR usually leads to a failed breakout and a selloff.<br />
3. A clean breakout followed by bullish price action<br />
In <strong>the</strong> previous sections I was looking for good consolidation before <strong>the</strong> breakout and<br />
volume during <strong>the</strong> breakout as indications, or confirmation, that <strong>the</strong> market would<br />
respect my anticipated important price point – <strong>the</strong> OR high. <strong>The</strong> concept of waiting for<br />
a clean breakout followed by bullish price action is a form of looking for confirmation<br />
that both <strong>the</strong> OR high is a significant point and <strong>the</strong> upward trend is going to continue.<br />
A clean breakout is quick and pronounced. It is when a stock takes out <strong>the</strong> OR high (it<br />
breaks out) and continues to move higher without spending much time waffling in a<br />
range above and below <strong>the</strong> breakout point. A clean breakout represents decisive<br />
action. <strong>The</strong> stock should move significantly higher in a short time frame.<br />
A clean breakout is important because it implies real demand, which you want in a<br />
range breakout trade. <strong>The</strong> increased demand condition is one in which <strong>the</strong> bears who<br />
were shorting against <strong>the</strong> high of <strong>the</strong> OR did not have a chance to cover through <strong>the</strong><br />
highs, so <strong>the</strong>y are now hoping to cover as <strong>the</strong> stock retraces. In addition, <strong>the</strong> bulls<br />
http://www.dataviewllc.com/ 37
who were accumulating <strong>the</strong>ir positions during <strong>the</strong> OR did not have time to buy all <strong>the</strong><br />
stock <strong>the</strong>y wanted. As a result, <strong>the</strong>y are also anxious to buy if <strong>the</strong> price retraces.<br />
If you’re wondering how to tell <strong>the</strong> difference between a clean breakout and <strong>the</strong><br />
market makers “running <strong>the</strong> stops”, <strong>the</strong> answer lies in <strong>the</strong> next phase of a clean<br />
breakout – bullish price action. Running <strong>the</strong> stops is a phrase that describes a<br />
situation where traders or market makers push <strong>the</strong> stock to trade above (or below) a<br />
certain price because <strong>the</strong>y expect that <strong>the</strong>re are a lot of resting orders to buy <strong>the</strong><br />
stock if it trades above that particular level. <strong>The</strong> motive for doing this is that if <strong>the</strong><br />
trader buys <strong>the</strong> stock to trigger an advance through <strong>the</strong> price <strong>the</strong>n <strong>the</strong> flurry of stop<br />
orders will push <strong>the</strong> price even higher, at which point <strong>the</strong> trader would sell <strong>the</strong> stock to<br />
<strong>the</strong> stop orders being executed. If a breakout is created by a large number of stop<br />
orders being executed, <strong>the</strong> subsequent price action will usually be an immediate<br />
reversal back into <strong>the</strong> range. An immediate reversal is <strong>the</strong>refore a warning sign that<br />
<strong>the</strong> breakout is not going to be clean!<br />
A clean breakout leaves both <strong>the</strong> bulls and <strong>the</strong> bears unsatisfied with its initial surge<br />
to a new high for <strong>the</strong> day. After this initial surge <strong>the</strong> stock should continue to trade<br />
above its breakout level. It may consolidate, it may flag down toward <strong>the</strong> support of<br />
<strong>the</strong> breakout level, or it may move steadily higher. <strong>The</strong> most important characteristic<br />
of <strong>the</strong> price action is that <strong>the</strong> price holds <strong>the</strong> support level that was previously<br />
resistance. <strong>The</strong> pattern it forms is less important than <strong>the</strong> fact that it should trade<br />
above <strong>the</strong> breakout level for a significant amount of time. A good rule of thumb is that<br />
it should trade above <strong>the</strong> OR for a period of time equal to half <strong>the</strong> time period of <strong>the</strong><br />
OR. For example, if you are using a 30-minute OR a clean breakout should spend <strong>the</strong><br />
next 15 minutes trading above <strong>the</strong> OR. By spending time trading above <strong>the</strong> breakout<br />
level <strong>the</strong> stock is demonstrating that <strong>the</strong>re is demand for it at <strong>the</strong> higher price.<br />
A clean breakout followed by bullish price action provides two forms of confirmation<br />
that <strong>the</strong> breakout will stay above <strong>the</strong> OR high. First, <strong>the</strong> quick and pronounced nature<br />
of <strong>the</strong> breakout demonstrates that <strong>the</strong> high of <strong>the</strong> range was a significant price point,<br />
and second, <strong>the</strong> stock’s ability to continue trading above <strong>the</strong> breakout point shows<br />
that <strong>the</strong> bulls have <strong>the</strong> upper hand.<br />
A stock that exhibits a clean breakout with bullish price action should be traded using<br />
ei<strong>the</strong>r of <strong>the</strong> tactics previously described: buying <strong>the</strong> retracement to <strong>the</strong> breakout, and<br />
buying <strong>the</strong> second breakout. Now that <strong>the</strong> clean breakout has been described let’s<br />
look at some examples of <strong>the</strong>se two tactics.<br />
Example of a retracement trading opportunity<br />
Figure 5-6 shows AVID as an example of a good retracement opportunity. <strong>The</strong>re are a<br />
couple of signs to look out for in a retracement. First notice that <strong>the</strong> breakout of <strong>the</strong><br />
OR occurred on big volume. Second notice <strong>the</strong> retracement (which is highlighted in<br />
yellow) basically held <strong>the</strong> high of <strong>the</strong> OR and it certainly held <strong>the</strong> low of <strong>the</strong><br />
consolidation before <strong>the</strong> OR breakout. As <strong>the</strong> retracement develops you should look<br />
for a swing low to form followed by a very short-term swing high or resistance level;<br />
this level is used to trigger an entry.<br />
<strong>The</strong> swing low was created when AVID broke below <strong>the</strong> short-term support it had<br />
formed at <strong>the</strong> OR high and <strong>the</strong>n immediately rallied back above that level on a pickup<br />
in volume. When this happened it was a clue that AVID did not want to go lower and<br />
<strong>the</strong> high of <strong>the</strong> OR would likely continue to hold as support.<br />
http://www.dataviewllc.com/ 38
As a result this retracement low<br />
became a potential swing low<br />
($38.20) and a stop for a trade if<br />
AVID demonstrated more strength<br />
by trading above a resistance level.<br />
AVID did demonstrate such<br />
strength about 25 minutes after<br />
creating <strong>the</strong> swing low when it<br />
moved above <strong>the</strong> price level that<br />
had been resistance ($38.56)<br />
before its swing low. Also notice<br />
<strong>the</strong> rally through this level with a<br />
pickup in volume. This level is<br />
labelled as <strong>the</strong> “Entry”. This is <strong>the</strong><br />
trigger entry point because at this<br />
point <strong>the</strong> price has put in a swing<br />
low and demonstrated strength by<br />
taking out a resistance level. If you<br />
waited for this retracement trade<br />
you would have been buying AVID<br />
at about <strong>the</strong> same price as if you<br />
had bought <strong>the</strong> initial breakout.<br />
Now you have a well-defined stop<br />
which is better than what you<br />
would have had if you had bought <strong>the</strong> initial breakout. You also have confirmation that<br />
<strong>the</strong> high of <strong>the</strong> OR will act as support.<br />
Example of a second breakout<br />
trading opportunity<br />
<strong>The</strong> chart of LEXR in Figure 5-7 shows<br />
how to trade a second breakout. <strong>The</strong><br />
second consolidation area is<br />
highlighted in yellow. This setup<br />
anticipates that after confirming an<br />
initial breakout of <strong>the</strong> OR (with tight,<br />
well-defined consolidation above <strong>the</strong><br />
OR high), a second breakout will lead<br />
to a significant advance. <strong>The</strong> setup<br />
also assumes that once <strong>the</strong> stock has<br />
broken out to <strong>the</strong> upside it should not<br />
trade below <strong>the</strong> low of <strong>the</strong><br />
consolidation level. <strong>The</strong>refore, <strong>the</strong><br />
entry point for this trade is a breakout<br />
above <strong>the</strong> high of <strong>the</strong> consolidation<br />
($10.13) with a stop below its low<br />
($10.00).<br />
Figure 5-6: 5-Minute Chart of Avid Tech.<br />
(AVID)<br />
Figure 5-7: 5-Minute Chart of Lexar<br />
Media (LEXR)<br />
This setup will not exist on all OR<br />
breakouts. <strong>The</strong> second consolidation<br />
must be easily defined and it must<br />
create an entry point and stop-loss<br />
point that make sense from a money management perspective! LEXR with a $0.13 risk<br />
made sense because it was not unusual for <strong>the</strong> stock to have daily ranges of more<br />
than $0.50 at <strong>the</strong> time of this trade.<br />
http://www.dataviewllc.com/ 39
4. A bullish big picture<br />
I must reiterate what has been said in <strong>the</strong> previous chapter regarding <strong>the</strong> importance<br />
of understanding <strong>the</strong> bigger picture condition of <strong>the</strong> stocks being traded. Even some<br />
very quick analysis of a daily chart can improve your results dramatically. Here are<br />
two simple conditions to consider in order to increase your success in buying<br />
breakouts with follow-through.<br />
1. <strong>The</strong> daily trend should be positive. Both <strong>the</strong> 20-day and <strong>the</strong> 50-day moving<br />
averages are positively sloped and <strong>the</strong> stock is trading above <strong>the</strong> 20-day<br />
moving average.<br />
2. <strong>The</strong> stock is trading above <strong>the</strong> prior day’s high.<br />
Figure 5-8 is a telling example of how <strong>the</strong>se two conditions can make a huge<br />
difference in <strong>the</strong> success of a breakout. NetEase.com (NTES) and Sohu.com (SOHU)<br />
are both in <strong>the</strong> business of running Internet portals in China. As you might expect,<br />
<strong>the</strong>se stocks have very similar daily trading patterns. <strong>The</strong>y tend to have good days<br />
and bad days toge<strong>the</strong>r.<br />
Figure 5-8: 1-Minute Charts of Netease.com (NTES) and Sohu.com (SOHU)<br />
<strong>The</strong> charts of NTES and SOHU are of <strong>the</strong> first hour and a half of Oct. 6, 2003. <strong>The</strong>se<br />
companies are in <strong>the</strong> same business and <strong>the</strong> stocks tend to trade toge<strong>the</strong>r on a daily basis.<br />
Notice where each stock’s 5-minute OR high (red dotted line) falls relative to <strong>the</strong> prior day’s<br />
high (red solid line). Now look at <strong>the</strong> difference in <strong>the</strong> stocks’ reaction to breaking <strong>the</strong>ir<br />
respective OR highs.<br />
<strong>The</strong> charts of NTES and SOHU in Figure 5-8 are 1-minute bar charts of <strong>the</strong> first hour<br />
and a half of Oct. 6, 2003. <strong>The</strong>se companies are in <strong>the</strong> same business and <strong>the</strong> stocks<br />
tend to trade toge<strong>the</strong>r so <strong>the</strong>y are a good example of how much <strong>the</strong> big picture can<br />
influence a day trade. Both stocks had experienced a significant sell-off in <strong>the</strong> 2 weeks<br />
prior to this day. <strong>The</strong> daily charts are not shown but <strong>the</strong>ir conditions were as follows:<br />
NTES was still trading above its positively sloped 20-day and 50-day moving averages.<br />
SOHU was trading below its 20-day moving average, and both <strong>the</strong> 20-day and 50-day<br />
moving averages were turning down.<br />
http://www.dataviewllc.com/ 40
On Oct. 6 th both stocks gapped higher. You can see <strong>the</strong> prior day’s close as <strong>the</strong> pink<br />
horizontal line on <strong>the</strong> charts.<br />
Notice where each stock’s 5-minute OR high (red dotted line) falls relative to <strong>the</strong> prior<br />
day’s high (red solid line). NTES’s OR is above its prior day high while SOHU’s OR high<br />
was below its prior day’s high. Now look at <strong>the</strong> difference in <strong>the</strong> stocks’ reaction to<br />
breaking <strong>the</strong>ir respective OR highs.<br />
When NTES took out its OR high of $63.33 it shot up $1 to a high of $64.35! When<br />
SOHU took out its OR high it ran into <strong>the</strong> prior day’s high and <strong>the</strong> breakout failed. <strong>The</strong><br />
fact that NTES had a stronger daily trend and it was trading above <strong>the</strong> prior day’s high<br />
made it a much stronger stock and a better candidate because it had more<br />
momentum and less resistance. NTES also demonstrated ano<strong>the</strong>r reason why knowing<br />
<strong>the</strong> prior day’s high was important. Look at how <strong>the</strong> sell-off in <strong>the</strong> afternoon ended<br />
right at <strong>the</strong> prior day’s high. After this swing low NTES rallied over $2 to a high of<br />
$65.65.<br />
Finally, SOHU did finish this day near its high for <strong>the</strong> day up 4.7%, but NTES closed on<br />
its high for <strong>the</strong> day up 6.9%! Don’t ignore <strong>the</strong> big picture.<br />
Don’t Chase <strong>the</strong> One that Got Away<br />
<strong>Trading</strong> breakouts requires great discipline. <strong>The</strong> nature of <strong>the</strong> pattern is such that you<br />
will be watching stocks as <strong>the</strong>y begin to accelerate. This makes it very easy to lose<br />
sight of money management. Greed creates <strong>the</strong> fear of missing <strong>the</strong> day’s great move,<br />
and <strong>the</strong>n greed overrides <strong>the</strong> rational business approach to trading using prudent<br />
risk/reward parameters. <strong>The</strong> result is you buy a stock that has already moved too far<br />
from your optimal entry point.<br />
<strong>The</strong> best defense against this problem is to be prepared. Understand <strong>the</strong> patterns you<br />
are looking for, and have a methodology for finding <strong>the</strong>m. If you feel comfortable that<br />
you will be able to find more great breakouts, <strong>the</strong>n you will be less likely to get burned<br />
chasing <strong>the</strong> ones that you miss. Real-time scanning software such as HotScans<br />
(developed at DataView, LLC; http://www.dataviewllc.com) lets you find great<br />
breakout opportunities all day, every day.<br />
http://www.dataviewllc.com/ 41
Chapter 6. <strong>Trading</strong> <strong>the</strong> <strong>Range</strong>—Buying <strong>the</strong> Lows<br />
• What is Fading <strong>the</strong> OR<br />
• Using <strong>the</strong> OR to Buy Against <strong>the</strong> Low of <strong>the</strong> Day<br />
• Using <strong>the</strong> OR to Measure Intraday Relative Strength<br />
What is Fading <strong>the</strong> OR<br />
“Fading” <strong>the</strong> OR is a great way to take advantage of choppy markets and find trades<br />
that do not involve buying or selling momentum. Fading a stock’s move means taking<br />
a position that is contrary to <strong>the</strong> stock’s current direction. <strong>The</strong> term “fading” is most<br />
commonly used in describing trading at <strong>the</strong> open. For example, if I said that I faded<br />
<strong>the</strong> gap up I would be saying that I sold into <strong>the</strong> higher opening.<br />
When you fade <strong>the</strong> OR your objective is to buy near <strong>the</strong> OR low and/or sell near <strong>the</strong><br />
OR high. This chapter will focus on <strong>the</strong> strategy of buying against <strong>the</strong> low of <strong>the</strong> OR,<br />
but <strong>the</strong> same techniques can be used in shorting against <strong>the</strong> high of <strong>the</strong> OR.<br />
In <strong>the</strong> same way that it doesn’t make sense to simply buy any stock that takes out its<br />
OR high, fading <strong>the</strong> OR is not as simple as just buying <strong>the</strong> stock when it gets close to<br />
<strong>the</strong> low of <strong>the</strong> OR. <strong>The</strong>re are two basic ways to fade <strong>the</strong> OR. One, anticipate that <strong>the</strong><br />
OR will not be broken and buy against <strong>the</strong> low. Two, recognize when a breakout is<br />
failing and fade it. In <strong>the</strong> previous chapter we focused on identifying <strong>the</strong> qualities of a<br />
stock likely to have a significant move if it breaks out. This analysis will be helpful in<br />
identifying <strong>the</strong> breakdowns that are likely to fail.<br />
Before you trade, know your risk, and stick to it<br />
Does this title sound familiar When you are buying momentum, identifying a logical<br />
risk point that fits within your money management plan can be somewhat subjective<br />
and finessed. When you are buying a stock against <strong>the</strong> low of <strong>the</strong> day <strong>the</strong> risk is easily<br />
defined. It is <strong>the</strong> low of <strong>the</strong> day.<br />
This is a good time to remind you of an important characteristic of most stocks:<br />
Stocks tend to fall faster than <strong>the</strong>y rally.<br />
Money management is critical to success in trading. It is extremely important that you<br />
know your risk points before you enter a trade and that you exit <strong>the</strong> trade when <strong>the</strong><br />
stock trades through your risk point. This is important when you are buying breakouts,<br />
but it is even more critical when you are trying to pick a bottom. Stocks will often drop<br />
very quickly when <strong>the</strong> support of <strong>the</strong> low of <strong>the</strong> day is broken. If you are not prepared<br />
and disciplined you will learn this lesson <strong>the</strong> hard way.<br />
Using <strong>the</strong> OR to Buy Against <strong>the</strong> Low of <strong>the</strong> Day<br />
<strong>The</strong> objective in fading <strong>the</strong> low of <strong>the</strong> OR is not to buy <strong>the</strong> low of <strong>the</strong> day. If you<br />
consider <strong>the</strong> trading methods discussed so far in this book this should not come as a<br />
surprise. In fact, you can probably figure out how to fade <strong>the</strong> OR based on what you<br />
already know. Everything that was discussed in chapter 4, Assessing <strong>the</strong> <strong>Opening</strong><br />
<strong>Range</strong>, applies to fading <strong>the</strong> OR.<br />
As you know, <strong>the</strong> 30-minute OR low has a high probability of being <strong>the</strong> low for <strong>the</strong><br />
day, but that does not mean you do not look for confirmation before you trade on<br />
such knowledge. <strong>The</strong>re are three conditions to look for in a good fade setup:<br />
http://www.dataviewllc.com/ 42
1. A second demonstration of support at <strong>the</strong> low of <strong>the</strong> day<br />
2. Evidence from <strong>the</strong> big picture that <strong>the</strong> OR low should be support<br />
3. Good intraday relative strength as compared to <strong>the</strong> market index<br />
1. A second demonstration of support at <strong>the</strong> low of <strong>the</strong> day<br />
As discussed in chapter 4, <strong>the</strong> best OR candidates are those that have well-defined<br />
support and resistance levels. When fading <strong>the</strong> low of <strong>the</strong> OR your concern is mostly<br />
with well-defined support. In an ideal setup <strong>the</strong> OR low would be formed with price<br />
and volume action that demonstrates strong support at <strong>the</strong> low. However, it is more<br />
likely that you will find stocks that have demonstrated some support at <strong>the</strong> low, but it<br />
will not be perfect. In ei<strong>the</strong>r case fading <strong>the</strong> OR low requires a second demonstration<br />
that <strong>the</strong> support level is going to be respected. This means that you are assessing how<br />
<strong>the</strong> market is acting as it trades around <strong>the</strong> OR low for <strong>the</strong> second or third time.<br />
Fading <strong>the</strong> OR low does not mean buying because it is 10:00 AM and <strong>the</strong> stock is<br />
acting well at its low of <strong>the</strong> day!<br />
In your assessment of <strong>the</strong> test of <strong>the</strong> OR low you should be looking for one of two<br />
scenarios:<br />
A clear rejection of <strong>the</strong> low: A clear rejection of <strong>the</strong> low could be any pattern<br />
described in chapter 3 as evidence of good support – a quick reversal, a big spike in<br />
volume at <strong>the</strong> low or both.<br />
A failed breakdown: A failed breakdown is basically <strong>the</strong> opposite of what was<br />
described as a good breakout. It is also a clear rejection of <strong>the</strong> new low created by <strong>the</strong><br />
breakdown. For example, if you were looking to short a stock breaking down through<br />
<strong>the</strong> OR low, you would be looking for all of <strong>the</strong>se qualities of a good breakdown:<br />
• Big relative volume<br />
• A clean break followed by bearish price action – price falls quickly<br />
• Old support becomes resistance<br />
On <strong>the</strong> o<strong>the</strong>r hand, if you were looking for a failure of <strong>the</strong> breakdown you would look<br />
for <strong>the</strong> breakdown to immediately reverse, preferably with big relative volume on <strong>the</strong><br />
way back up. In a failure <strong>the</strong> old support does not act as resistance and <strong>the</strong> stock<br />
immediately rises back above <strong>the</strong> old support. <strong>The</strong> best failures are quick and decisive.<br />
Ano<strong>the</strong>r way a stock can fail to break down is to take out <strong>the</strong> low but <strong>the</strong>n consolidate<br />
at <strong>the</strong> new low level, forming a base. <strong>The</strong> breakdown fails when <strong>the</strong> stock breaks out<br />
to <strong>the</strong> upside of this base.<br />
Let’s look at some examples.<br />
Example of a trading opportunity fading <strong>the</strong> OR low<br />
Figure 6-1 is an example of a 5-minute bar chart of GTK that opened with a gap above<br />
its prior day’s high. <strong>The</strong> green dashed line at $45.09 represents <strong>the</strong> prior day’s high.<br />
<strong>The</strong> 30-minute OR is highlighted in yellow on <strong>the</strong> left side of <strong>the</strong> chart. On this day,<br />
GTK established its 30-minute OR low ($45.13) in <strong>the</strong> first 10 minutes of trading and<br />
<strong>the</strong>n rallied to create a well-defined high of its 30-minute OR ($45.27).<br />
At about 10:20 AM GTK began to sell off from its high for <strong>the</strong> day down to <strong>the</strong> low of<br />
<strong>the</strong> OR. Without any consolidation it took out <strong>the</strong> low of <strong>the</strong> OR by $0.03 and stopped<br />
at $45.10. It <strong>the</strong>n spent <strong>the</strong> next 20 minutes consolidating between its new $45.10<br />
low and $45.14 (a penny higher than <strong>the</strong> low of <strong>the</strong> OR). This area is also highlighted<br />
in yellow. Notice <strong>the</strong> pickup in volume during this consolidation. Also note that <strong>the</strong><br />
high from <strong>the</strong> prior day was $49.09.<br />
http://www.dataviewllc.com/ 43
GTK is an example of a stock that broke<br />
<strong>the</strong> low of its OR but <strong>the</strong>n failed to move<br />
lower. Instead of moving lower <strong>the</strong> selloff<br />
met significant buying as evidenced<br />
by <strong>the</strong> increased volume and basing<br />
action. When GTK broke above this<br />
consolidation it was time to be a buyer<br />
with a stop below <strong>the</strong> low of <strong>the</strong> day, and<br />
in this case, <strong>the</strong> high of <strong>the</strong> prior day.<br />
With an entry price of $45.16 and a stop<br />
of $49.07 <strong>the</strong> risk on <strong>the</strong> trade was only<br />
$0.09. As you can see from <strong>the</strong> chart<br />
$0.09 was a small risk to take for <strong>the</strong><br />
volatility of GTK.<br />
Ano<strong>the</strong>r example of a trading<br />
opportunity fading <strong>the</strong> OR low<br />
Figure 6-2 is a 5-minute bar chart of<br />
SEBL with <strong>the</strong> OR highlighted in yellow at<br />
<strong>the</strong> left of <strong>the</strong> chart. SEBL opened near<br />
<strong>the</strong> high of its OR and <strong>the</strong>n traded lower,<br />
spending a significant amount of time<br />
forming <strong>the</strong> low of its OR ($11.12). <strong>The</strong><br />
low of <strong>the</strong> prior day was $11.13, <strong>the</strong><br />
same price level as <strong>the</strong> OR low.<br />
Figure 6-1: 5-Minute Chart of Gtech<br />
Holdings (GTK)<br />
GTK consolidated nicely at its low of <strong>the</strong> day<br />
after failing to break down though its OR low,<br />
and finding support at <strong>the</strong> prior day’s high.<br />
After trying to break above <strong>the</strong> OR<br />
SEBL returned to <strong>the</strong> low of its OR<br />
and took it out by $0.01. After<br />
making its new low for <strong>the</strong> day and<br />
taking out <strong>the</strong> prior day’s low SEBL<br />
consolidated between $11.12 and<br />
$11.14 for at least 20 minutes (this<br />
area is highlighted in yellow also).<br />
What is important to note is that<br />
<strong>the</strong>re was not any follow- through<br />
when <strong>the</strong> new low was made.<br />
When SEBL traded above this<br />
consolidation it was an indication that<br />
<strong>the</strong> low of <strong>the</strong> OR (and <strong>the</strong> prior<br />
day’s low) represented a good stop<br />
for a trade of fading <strong>the</strong> day’s low. If<br />
you had executed this trade you<br />
would have been a buyer around<br />
$11.16 with a stop at $11.09. At that<br />
time <strong>the</strong> high of <strong>the</strong> day was $11.29<br />
so a position at $11.16 with a $0.07<br />
risk represented a 2:1 risk/reward<br />
ratio even if SEBL only made it back<br />
to its high for <strong>the</strong> day.<br />
Figure 6-2: 5-Minute Chart of Siebel<br />
Systems (SEBL)<br />
SEBL’s OR low was right above <strong>the</strong> prior day’s low.<br />
<strong>The</strong> consolidation at this level created an<br />
opportunity to buy SEBL near its low for <strong>the</strong> day.<br />
http://www.dataviewllc.com/ 44
Why wait<br />
In both examples above, Figure 6-1: GTK and Figure 6-2: SEBL, <strong>the</strong> stocks spent time<br />
consolidating at <strong>the</strong>ir lows. <strong>The</strong>re was plenty of time for <strong>the</strong>m to be purchased closer<br />
to <strong>the</strong>ir lows of <strong>the</strong> day. So why should you wait for a stock to start to rally and pay<br />
up <strong>The</strong>re are two reasons. First, you want <strong>the</strong> stock to demonstrate that support is<br />
going to hold. <strong>The</strong> consolidation is an indication that <strong>the</strong> support exists, but by waiting<br />
for some positive price action you are getting a form of confirmation that <strong>the</strong> support<br />
will hold. <strong>The</strong> second reason is that good breakouts and breakdowns are preceded by<br />
consolidation at or around <strong>the</strong> OR high or low – remember chapter 5 (<strong>Trading</strong><br />
Breakouts and Breakdowns)! If ei<strong>the</strong>r SEBL or GTK had broken <strong>the</strong> low of <strong>the</strong>ir<br />
consolidations <strong>the</strong>y could have been considered good breakdowns to short. Even<br />
though <strong>the</strong>ir daily charts were both in a strong uptrend (making <strong>the</strong>m better<br />
candidates for buying on weakness <strong>the</strong>n shorting on weakness) breakdowns from <strong>the</strong>ir<br />
setups could have led to a significant decline.<br />
2. Evidence from <strong>the</strong> big picture that <strong>the</strong> OR low should be support<br />
Fading <strong>the</strong> OR low is a way to buy a stock on weakness, and who wouldn’t prefer to<br />
pay less for a stock Buying weakness, however, is best done in <strong>the</strong> context of a<br />
strong trend. In <strong>the</strong> last chapter I suggested using at least simple moving averages to<br />
measure a stock’s trend, and I also said traders should consider <strong>the</strong> OR’s position<br />
relative to <strong>the</strong> prior day’s trading. <strong>The</strong> same concepts hold when fading <strong>the</strong> OR. <strong>The</strong><br />
prior day’s high, low and close are all potentially important points. If <strong>the</strong> low of <strong>the</strong> OR<br />
happens to be close to any of <strong>the</strong>se points it adds to <strong>the</strong> significance of <strong>the</strong> support.<br />
You’ll notice that in all of <strong>the</strong> examples in this chapter <strong>the</strong>re was a prior day’s point<br />
close to <strong>the</strong> OR low.<br />
3. Good intraday relative strength as compared to <strong>the</strong> market index<br />
<strong>The</strong> intraday relative strength I’m referring to is an analysis of whe<strong>the</strong>r or not a<br />
particular stock is keeping up with <strong>the</strong> market on an intraday swing basis. For<br />
example, if <strong>the</strong> market makes a new swing high on its intraday chart <strong>the</strong>n any stock<br />
keeping pace with <strong>the</strong> market should also make a new swing high on its intraday<br />
chart. If a stock cannot keep pace with <strong>the</strong> market as it rises <strong>the</strong>n it is likely to sell off<br />
harder than <strong>the</strong> market when <strong>the</strong> market declines. This concept is covered in more<br />
detail in <strong>the</strong> following section.<br />
Using <strong>the</strong> OR to Measure Intraday Relative Strength<br />
Using intraday relative strength as ei<strong>the</strong>r a way to find trading ideas or confirm those<br />
ideas could form <strong>the</strong> basis of a separate book. It is extremely powerful and easy to<br />
recognize, but it is also difficult to scan for and it is loaded with nuances in its<br />
interpretation. I am covering it in this section only because it is such a great way to<br />
find and confirm trades based on fading <strong>the</strong> OR low. It is also easy to scan for using<br />
DataView’s HotScans product.<br />
<strong>The</strong> market will usually establish at least one intraday swing low within its OR period.<br />
When this happens <strong>the</strong> setup for using intraday relative strength as an indicator or<br />
trade finder is in place. When <strong>the</strong> market takes out its OR swing low most stocks will<br />
follow suit and take out <strong>the</strong>ir respective OR low. In this scenario <strong>the</strong> stocks that do not<br />
trade below <strong>the</strong>ir OR low are demonstrating bullish intraday relative strength. If <strong>the</strong><br />
market does not follow through in its breakdown <strong>the</strong> strong relative strength stocks<br />
are <strong>the</strong> best candidates for an immediate rise in price. Ano<strong>the</strong>r example of a stock<br />
with strong relative strength occurs when <strong>the</strong> market continues to trade lower through<br />
its OR low, but <strong>the</strong> stock fails to break down and trades back into its OR. Again, if <strong>the</strong><br />
http://www.dataviewllc.com/ 45
market subsequently stops going down, or better yet rallies, <strong>the</strong> stock that failed to<br />
break down will be a great long candidate as part of a strategy to fade <strong>the</strong> OR low.<br />
When you are analyzing stocks for possible trades against <strong>the</strong> low of <strong>the</strong>ir OR you<br />
should know what <strong>the</strong> market has done relative to its OR. <strong>The</strong> divergence between <strong>the</strong><br />
stock’s price action and <strong>the</strong> market should be obvious. If it is subtle <strong>the</strong>n it’s probably<br />
not worth analyzing. Keep it as simple as <strong>the</strong>se two questions: Is <strong>the</strong> market below its<br />
OR and looking like it may rally Did my stock fail to break down with <strong>the</strong> market If<br />
<strong>the</strong> answers are yes <strong>the</strong>n you have good intraday relative strength working for you.<br />
Use relative strength for confirmation<br />
Figure 6-3 is an example of XLNX clearly rejecting its OR low, and also showing<br />
confirmation of its strength with good intraday relative strength.<br />
Both charts are 5-minute bar charts. <strong>The</strong> top chart is XLNX and <strong>the</strong> bottom chart<br />
shows <strong>the</strong> Nasdaq 100 Trust (QQQ). In both charts <strong>the</strong> 30-min OR is highlighted in<br />
yellow on <strong>the</strong> left and <strong>the</strong> test of <strong>the</strong> OR low is highlighted in yellow around 11:45 AM.<br />
If you focus on <strong>the</strong> price action of<br />
XLNX you will see that XLNX sold off<br />
to test its OR low at 11:05 AM and<br />
rallied. <strong>The</strong> price action at this low<br />
was not as convincing as one would<br />
like to see because it nei<strong>the</strong>r<br />
consolidated nor bounced with<br />
conviction. At 11:45 AM (highlighted<br />
and labelled as point A) XLNX spiked<br />
down to within $0.03 of its OR Low<br />
and immediately reversed and <strong>the</strong>n<br />
continued to rally in <strong>the</strong> following<br />
bar. This price action represents a<br />
clear and decisive rejection of<br />
(respect for) <strong>the</strong> support area.<br />
In addition to its obvious respect for<br />
<strong>the</strong> support area, XLNX was<br />
demonstrating good intraday<br />
relative strength. If you focus on <strong>the</strong><br />
QQQ at 11:05 AM and at 11:45 AM<br />
(highlighted and labelled as point A)<br />
you will see that <strong>the</strong> QQQ not only<br />
traded below its OR but also made a<br />
new low for <strong>the</strong> day each time.<br />
XLNX, on <strong>the</strong> o<strong>the</strong>r hand, did not<br />
break its OR on ei<strong>the</strong>r occasion, and<br />
were it not for <strong>the</strong> spike down at<br />
11:45 AM it would have had<br />
successively higher lows at <strong>the</strong><br />
same time <strong>the</strong> QQQ was making<br />
successively lower lows. <strong>The</strong> green<br />
line on <strong>the</strong> chart indicates <strong>the</strong><br />
divergence created by <strong>the</strong> fact that<br />
while <strong>the</strong> QQQ was struggling to<br />
stay above its OR low, XLNX was<br />
Figure 6-3: 5-Minute Charts of Xilinx Inc.<br />
(XLNX) and <strong>The</strong> Nadaq 100 Trust (QQQ)<br />
Using <strong>the</strong> OR as a way to measure a stock’s relative<br />
strength versus <strong>the</strong> market is a powerful way of<br />
finding trades and confirming setups. At point A<br />
XLNX had demonstrated for <strong>the</strong> second time that it<br />
was stronger than <strong>the</strong> market.<br />
having no trouble holding above <strong>the</strong> support of its OR. This is a bullish divergence of<br />
intraday relative strength. It indicates strength on <strong>the</strong> part of XLNX because it means<br />
http://www.dataviewllc.com/ 46
that when <strong>the</strong> market was trading down XLNX was not being dragged down as much<br />
as <strong>the</strong> market; when <strong>the</strong> market rallied, XLNX was rallying more than <strong>the</strong> market. <strong>The</strong><br />
result was that at about 3:00 PM XLNX was trading at $30.40 or $0.10 from its high of<br />
<strong>the</strong> day while <strong>the</strong> QQQ was just bouncing off <strong>the</strong> low of its OR.<br />
Fading <strong>the</strong> OR: Summary<br />
When you are fading <strong>the</strong> OR it is likely that you will be betting against <strong>the</strong> stock’s<br />
trend since <strong>the</strong> open. Since you are anticipating that <strong>the</strong> trend from <strong>the</strong> open is going<br />
to reverse you should make sure to put <strong>the</strong> odds of a reversal in your favor. Two<br />
simple rules to improve your odds are: (a) trade in <strong>the</strong> direction of <strong>the</strong> bigger trend,<br />
and (b) buy against price levels where <strong>the</strong>re is both a good OR pattern to fade and<br />
support based on <strong>the</strong> bigger picture. <strong>The</strong> prior day’s high, low and close are important<br />
price points and should be considered significant big picture price levels to trade.<br />
Ano<strong>the</strong>r powerful confirmation indicator when fading <strong>the</strong> OR is relative strength. As<br />
discussed above, a stock exhibiting bullish intraday relative strength in conjunction<br />
with a good OR pattern is a great candidate for fading <strong>the</strong> OR low. Finally, use good<br />
money management. Don’t get lulled into a false sense of complacency because you<br />
bought <strong>the</strong> stock down on <strong>the</strong> day.<br />
http://www.dataviewllc.com/ 47
Chapter 7. How to Find OR <strong>Trading</strong> Opportunities<br />
• How to Use Market Scanning Tools Effectively<br />
• A Quick Explanation of HotScans’ Functionality<br />
• How to Find OR <strong>Trading</strong> Setups with HotScans<br />
• Three Strategies for Catching OR Breakouts<br />
• Finding Stocks Before <strong>The</strong>y Break Out<br />
• Finding Candidates for Fading <strong>the</strong> OR Low<br />
• Catching <strong>The</strong> OR Low<br />
<strong>The</strong> OR trading approach can be used in many ways. If you have read this book you<br />
have <strong>the</strong> ability to look at any of your positions or potential trades and analyze <strong>the</strong><br />
condition of <strong>the</strong> stock based on its OR and <strong>the</strong> day’s trading around it. This skill can<br />
improve your trade selection, entries, and exits for swing and/or day trades.<br />
One way to take advantage of your new knowledge of <strong>the</strong> OR is to use a tool that will<br />
scan <strong>the</strong> markets for stocks that are currently exhibiting your favorite OR setup. If you<br />
are a day trader you can focus on <strong>the</strong> stocks that have <strong>the</strong> best intraday risk/reward<br />
setup for your style of trading. As a swing trader you can scan for stocks with an OR<br />
pattern that suggest <strong>the</strong>y are in <strong>the</strong> midst of having a big day (i.e. a big volume OR<br />
breakout), and <strong>the</strong>n trade those that also meet your swing trade criteria.<br />
Of course you can also use <strong>the</strong> OR as your secondary scan or filter. If you have a<br />
methodology of generating a list of swing or day trade candidates each day, you can<br />
now use <strong>the</strong> OR patterns to determine <strong>the</strong> best opportunities within your list of<br />
candidates. For example, if you have a list of strong stocks that you would like to buy<br />
“cheap” you can look for opportunities to fade <strong>the</strong> OR low. As you spend more time<br />
looking at how stocks trade around <strong>the</strong>ir OR you will undoubtedly begin to see more<br />
patterns that you will be able to exploit. Using market scanning software enables you<br />
to find your favorite patterns much more efficiently than manually reviewing charts.<br />
Throughout this book <strong>the</strong>re have been many references to a web-based, marketscanning<br />
tool called HotScans by DataView, LLC (www.DataViewLLC.com). DataView<br />
provides real-time tools that find trading opportunities for day traders, swing traders,<br />
and investors. DataView’s tools scan <strong>the</strong> market for unusual price and volume activity,<br />
track industry group and sector rotation, and measure <strong>the</strong> overall health of <strong>the</strong><br />
markets with 37 indicators. HotScans is <strong>the</strong> DataView product that enables you to<br />
scan <strong>the</strong> market for intraday trading setups based on price and volume patterns such<br />
as <strong>the</strong> OR. HotScans does much more than scan for OR patterns, but this chapter will<br />
focus on how to use HotScans to find OR trading opportunities.<br />
How to Use Market Scanning Tools Effectively<br />
Your initial experience using any tool that scans <strong>the</strong> market for price and volume<br />
patterns may be frustrating. As a trader you know that <strong>the</strong> interpretation of price and<br />
volume patterns or charts is not an exact science. <strong>The</strong> definition of a chart pattern is<br />
rarely “black or white”. As a result, asking a computer to find stocks with a particular<br />
price and volume pattern is not as straightforward as o<strong>the</strong>r scanning techniques such<br />
as requesting stocks within a certain range of PE, market capitalization, earnings<br />
http://www.dataviewllc.com/ 48
growth, etc. For example, if you create a scan that requires a stock to be up at least<br />
$0.50 for <strong>the</strong> day it is likely that a stock trading at $100.00 per share will qualify, and<br />
when it does it could represent <strong>the</strong> beginning of a trend for <strong>the</strong> day. However, it is<br />
much more difficult for a stock trading at $2.00 per share to rise $0.50 in one day,<br />
and when it does it will most likely be <strong>the</strong> end of <strong>the</strong> stock’s advance for <strong>the</strong> day. If<br />
you try to solve this dilemma by setting your scan criteria in percentage terms you will<br />
improve your results, but you must still be aware that lower-priced stocks tend to be<br />
more volatile on a percentage basis than higher-priced stocks. <strong>The</strong>refore you are more<br />
likely to see a move of 5% in one day in a $2.00 stock than in a $100.00 stock. <strong>The</strong><br />
fact that volatility measures are affected by <strong>the</strong> price of a stock is straightforward and<br />
intuitive once you focus on it. O<strong>the</strong>r pattern recognition issues, however, are not as<br />
easily recognized or solved. For example, if you want to find stocks that have been<br />
strong all day but have recently retraced, how do you define “recently” – 5 minutes,<br />
10 minutes, etc. And at what point does a retracement become a reversal If you<br />
define a retracement as exactly 3% in 10 minutes you may not get stocks that have<br />
retraced 3% over 15 minutes yet when you look at <strong>the</strong> chart of such a stock you<br />
realize that 3% over 15 minutes is also a good pattern. You must keep in mind that<br />
setting criteria that are too strict will often yield too few stocks, but if your scan<br />
criteria are not specific enough you will spend too much time looking at stocks that do<br />
not have <strong>the</strong> characteristics you desire.<br />
How to find <strong>the</strong> stocks that you want to trade<br />
Determining <strong>the</strong> correct scan criteria requires a balance between being too specific<br />
and too general. <strong>The</strong> only way to find <strong>the</strong> chart patterns that you like is to know what<br />
you’re looking for! This may sound obvious but many traders start using scanning<br />
tools without first thinking about what <strong>the</strong>y want to scan for. This results in<br />
frustration. Here are some basic steps to getting started with any market scanning<br />
tool. I’ll use HotScans as an example.<br />
1. Clearly define your pattern. Write down your pattern as a list of criteria. Put<br />
<strong>the</strong> most important criteria at <strong>the</strong> top of <strong>the</strong> list. If you want to find low-priced<br />
stocks that have big volume today, and that are having a good day, <strong>the</strong>n define<br />
“low-priced”, “big volume” and “having a good day.” Let’s define <strong>the</strong>se criteria<br />
in order of importance and be more specific in our criteria descriptions:<br />
a. Big volume - current daily volume of at least 200% greater than<br />
average.<br />
b. Having a good day - up at least 3% for <strong>the</strong> day (keep in mind this<br />
means at least $.03 for a $1 stock and at least $.15 for a $5 stock).<br />
c. Low-priced - under $5.<br />
2. Enter your criteria one setting at a time. Do not try to enter all of <strong>the</strong><br />
criteria into <strong>the</strong> scan at once. If you do, and <strong>the</strong> results are not what you<br />
expected, it will be difficult to determine which setting is causing <strong>the</strong> problem.<br />
Enter your criteria one at a time, and run <strong>the</strong> scan after each change. This may<br />
take a little more time, but it will save time in <strong>the</strong> long run and lead to more<br />
successful scans. In <strong>the</strong> example above unusually large volume was <strong>the</strong> first<br />
priority, so with HotScans you would start by requesting a Big Volume Now<br />
scan and using <strong>the</strong> Advanced Filters to set Relative Volume for <strong>the</strong> day to<br />
“greater than” 200%. <strong>The</strong>n run <strong>the</strong> scan to make sure all <strong>the</strong> stocks that are<br />
returned meet your criteria. Again using <strong>the</strong> Advanced Filters, set <strong>the</strong> percent<br />
price change for <strong>the</strong> day to “greater than” 3% and run <strong>the</strong> scan again to make<br />
sure that only stocks with a 3% or greater move are qualifying. Finally, use <strong>the</strong><br />
Basic Filter section to set <strong>the</strong> minimum and maximum price criteria to $0 and<br />
$5 respectively.<br />
http://www.dataviewllc.com/ 49
A Quick Explanation of HotScans’ Functionality<br />
HotScans is an extremely flexible scanning tool. It enables you to scan four different<br />
intraday time frames simultaneously for price and volume action. This makes it<br />
possible to scan for breakouts, breakdowns, new intraday highs and lows, reversals,<br />
unusual volume, gaps, opening range patterns and much more. In addition to its<br />
flexibility in defining scan criteria, HotScans has a very powerful visual representation<br />
of price and volume action. Before describing <strong>the</strong> OR strategy settings let’s review<br />
some of <strong>the</strong> basic functionality of HotScans that makes <strong>the</strong> process of finding trading<br />
opportunities effortless.<br />
DataView’s price and volume gauges – simple and powerful<br />
<strong>The</strong> two rightmost columns in Figure<br />
7-1 show how DataView uses a unique<br />
dual gauge display to show a stock’s<br />
price and volume activity. In HotScans<br />
<strong>the</strong>se red and green gauges give you<br />
an instant analysis of a stock’s price<br />
and volume condition. <strong>The</strong> price gauge<br />
is a straightforward representation of<br />
<strong>the</strong> percent price change during <strong>the</strong><br />
time frame requested (30 minutes in<br />
this example). <strong>The</strong> volume gauge is a<br />
proprietary measure of a stock’s<br />
volume compared to its average<br />
Figure 7-1: <strong>The</strong> HotScans Price and<br />
Volume Gauges<br />
<strong>The</strong> HotScans price gauge represents <strong>the</strong> percent<br />
price change. <strong>The</strong> volume gauge shows <strong>the</strong><br />
percent difference between <strong>the</strong> current volume<br />
and <strong>the</strong> 30–day average volume for that period.<br />
volume for <strong>the</strong> requested time period. For example, Figure 7-1 shows <strong>the</strong> stock CERN<br />
with a big green gauge representing <strong>the</strong> fact that it has experienced 1,293% greater<br />
than average volume over <strong>the</strong> last 30 minutes. This means that CERN has traded<br />
1,293% more volume than <strong>the</strong> 30-day average volume for <strong>the</strong> current 30-minute<br />
period. In contrast, Figure 7-1 shows SPRT with a red volume gauge because it has<br />
traded 47% less than average volume for <strong>the</strong> same 30-minute period. <strong>The</strong> importance<br />
of volume as a component of any trade setup cannot be overemphasized. <strong>The</strong><br />
HotScans’ Volume versus Average Volume (“Vol. vs. Avg.”) gauge makes identifying<br />
and interpreting volume patterns effortless.<br />
How to set your basic criteria to define your universe of stocks<br />
Efficient scanning of <strong>the</strong> market requires an understanding of what type of stocks you<br />
want to find. All stocks do not have <strong>the</strong> same trading characteristics. For example,<br />
low-priced stocks are often more volatile in terms of daily percent price change, and<br />
<strong>the</strong>ir trading personality differs from that of higher-priced stocks. <strong>The</strong> analysis of<br />
volume has similar issues. Stocks with higher average volume should have a lower<br />
threshold for “unusual” volume than stocks with low average volume. For example, a<br />
300% greater-than-average volume reading in a stock that trades 3 million shares per<br />
day could be as significant as a 1,000% greater-than-average volume reading in a<br />
stock that only trades 100,000 shares per day. It is important to consider <strong>the</strong>se basic<br />
characteristics of <strong>the</strong> stocks that you are trading when defining your setup.<br />
Figure 7-2 shows how HotScans enables you to define <strong>the</strong> following basic<br />
characteristics of <strong>the</strong> stocks to be scanned. This list defines <strong>the</strong> HotScans filters shown<br />
in Figure 7-2.<br />
• Minimum price (Min)<br />
• Maximum price (Max)<br />
• Today’s current volume (Vol.)<br />
http://www.dataviewllc.com/ 50
• 30-day average daily volume (Avg. Vol.)<br />
• Average daily range over <strong>the</strong> last 30 trading days (Avg. Rng.)<br />
• Market capitalization (Market Cap.)<br />
• Stock Exchanges (Exchange)<br />
• A specific industry group or sector (Sectors & Groups)<br />
• Frequency at which <strong>the</strong> scan will automatically rerun (Refresh)<br />
Figure 7-2: <strong>The</strong> HotScans Basic Filter Settings<br />
<strong>The</strong> HotScans Basic Filter section allows you to define <strong>the</strong> type of stocks you are<br />
interested in trading.<br />
Define up to four time frames of price and volume action<br />
It is not necessary to define a scan using all four time frames, but HotScans gives you<br />
this flexibility in an easy to use format. <strong>The</strong> four time frames are defined as follows:<br />
1. Scan Period: <strong>The</strong> Scan Period is <strong>the</strong> current time frame. It is <strong>the</strong> most recent<br />
“X” number of minutes of trading. For example, if you set <strong>the</strong> Scan Period to 5<br />
minutes on a Big Volume Now scan, HotScans will display <strong>the</strong> stocks with <strong>the</strong><br />
greatest volume relative to <strong>the</strong>ir average volume in <strong>the</strong> last five minutes.<br />
2. <strong>The</strong> Previous Period: <strong>The</strong> Previous Period is <strong>the</strong> time frame that occurred<br />
prior to <strong>the</strong> Scan Period. This enables you to define <strong>the</strong> price and volume action<br />
leading up to <strong>the</strong> Scan Period. Let’s build on <strong>the</strong> example from <strong>the</strong> Scan Period<br />
description above. If you set your Previous Period to 15 minutes, HotScans will<br />
display <strong>the</strong> price and volume action of <strong>the</strong> 15 minutes prior to <strong>the</strong> 5-minute<br />
Scan Period of <strong>the</strong> Big Volume Now scan. This enables you to see which stocks<br />
are continuing an existing move and which stocks may be starting a new big<br />
volume move.<br />
3. <strong>The</strong> Current Day: This period represents <strong>the</strong> whole trading day. It measures<br />
<strong>the</strong> price change versus <strong>the</strong> close of <strong>the</strong> prior day and relative volume for <strong>the</strong><br />
day.<br />
4. <strong>The</strong> <strong>Opening</strong> <strong>Range</strong>: <strong>The</strong> <strong>Opening</strong> <strong>Range</strong> is <strong>the</strong> first “X” minutes of <strong>the</strong><br />
trading day. With HotScans you can filter based on <strong>the</strong> price and volume action<br />
within a stock’s OR as well as where <strong>the</strong> stock has traded, and is currently<br />
trading, relative to its OR. For example, you may want to filter for stocks that<br />
traded unusually large volume during <strong>the</strong> OR period and are now continuing to<br />
move higher!<br />
http://www.dataviewllc.com/ 51
Figure 7-3 shows how you can set HotScans to display <strong>the</strong> price and volume action in<br />
any one or all of <strong>the</strong>se time frames. In addition, you can set specific price and volume<br />
filters for each time frame using <strong>the</strong> Advanced Filters section.<br />
Figure 7-3: <strong>The</strong> HotScans Time Frame Display Control<br />
<strong>The</strong> drop-down boxes enable you to select different time frames for <strong>the</strong> Scan, Previous,<br />
and <strong>Opening</strong> <strong>Range</strong> Periods. <strong>The</strong> check boxes allow you to determine whe<strong>the</strong>r or not<br />
HotScans should display price and volume gauges for <strong>the</strong> <strong>Opening</strong> <strong>Range</strong> and/or <strong>the</strong><br />
whole day’s activity.<br />
How <strong>the</strong> HotScans display identifies <strong>the</strong> best candidates to trade<br />
Let’s review a screen shot of a typical OR scan in order to demonstrate a few ways in<br />
which <strong>the</strong> HotScans display helps you visually filter <strong>the</strong> results of a scan. <strong>The</strong> first<br />
three columns are straightforward. <strong>The</strong>y are <strong>the</strong> ticker symbol, <strong>the</strong> current price, and<br />
<strong>the</strong> change for <strong>the</strong> day. <strong>The</strong> fourth column, “% Off High”, is not common in quote<br />
displays. This column shows you where <strong>the</strong> stock is trading relative to its high of <strong>the</strong><br />
day as a percentage of <strong>the</strong> day’s range (a stock’s range is equal to <strong>the</strong> day’s high<br />
minus <strong>the</strong> low). For example, if <strong>the</strong> stock has a range of $1 and it is trading $0.05<br />
from <strong>the</strong> high, it would be 5% of <strong>the</strong> day’s range from <strong>the</strong> high, and <strong>the</strong> “% Off High”<br />
would show “-5%”. This makes it very easy to see if a stock is trading near <strong>the</strong> high or<br />
low for <strong>the</strong> day. In Figure 7-4 you can see that MCK is currently at its high for <strong>the</strong> day<br />
because it has a “% Off High” value of “0%”.<br />
Figure 7-4: <strong>The</strong> HotScans Basic Bullish OR Breakout Strategy<br />
In this HotScans table MCK stands out as having huge volume in <strong>the</strong> last 5 minutes (999%),<br />
and ENCY stands out because it had very big volume in <strong>the</strong> <strong>Opening</strong> <strong>Range</strong> (369%). You can<br />
also tell that both are trading at <strong>the</strong>ir high for <strong>the</strong> day based on <strong>the</strong> “% Off High” column (0%<br />
and –2% respectively).<br />
<strong>The</strong> next column, “OR Patt.”, is a graphic that is proprietary to DataView. <strong>The</strong>re is an<br />
extensive description of this column in <strong>the</strong> HotScans help section of<br />
www.DataViewLLC.com, but it can be quickly described as follows.<br />
http://www.dataviewllc.com/ 52
<strong>The</strong> “OR Patt.” (OR Pattern) is a small graphic that<br />
illustrates where a stock has traded and where it is<br />
currently trading relative to its OR. <strong>The</strong> easiest way<br />
to read <strong>the</strong> OR Pattern is to view it as having two<br />
sides (Figure 7-5). <strong>The</strong> left side of <strong>the</strong> OR Pattern<br />
represents how <strong>the</strong> stock has traded relative to <strong>the</strong><br />
OR. <strong>The</strong> right side represents where <strong>the</strong> stock is<br />
currently trading relative to <strong>the</strong> OR.<br />
Focus on <strong>the</strong> left side of <strong>the</strong> OR Pattern first. Every<br />
OR Pattern has a black dot on <strong>the</strong> left indicating <strong>the</strong><br />
OR. If <strong>the</strong> stock has traded above <strong>the</strong> OR, a green<br />
dot will be displayed above <strong>the</strong> OR black dot. If <strong>the</strong><br />
stock has traded below <strong>the</strong> OR, a red dot will be<br />
displayed below <strong>the</strong> OR black dot. Thus, <strong>the</strong> three<br />
Figure 7-5: <strong>The</strong> OR Pattern<br />
<strong>The</strong> left side of <strong>the</strong> OR Pattern<br />
shows how <strong>the</strong> stock has traded.<br />
<strong>The</strong> right side shows how <strong>the</strong><br />
stock is currently trading.<br />
dots (or lack <strong>the</strong>reof), on <strong>the</strong> left side of <strong>the</strong> OR Pattern show you how <strong>the</strong> stock has<br />
traded relative to its OR.<br />
Now look at <strong>the</strong> right side of <strong>the</strong> OR Pattern. If <strong>the</strong>re is a black dot on <strong>the</strong> right side of<br />
<strong>the</strong> OR Pattern, <strong>the</strong> stock is currently trading inside <strong>the</strong> OR. If <strong>the</strong>re is a green up<br />
arrow on <strong>the</strong> right side of <strong>the</strong> OR Pattern, <strong>the</strong> stock is currently trading above <strong>the</strong> OR.<br />
If <strong>the</strong>re is a red down arrow on <strong>the</strong> right side of <strong>the</strong> OR Pattern, <strong>the</strong> stock is currently<br />
trading below <strong>the</strong> OR. A yellow arrow (not shown in Figure 7-5) alerts you to <strong>the</strong> fact<br />
that <strong>the</strong> stock is currently breaking out of its OR for <strong>the</strong> first time today. <strong>The</strong> yellow<br />
arrow is very easy to see because it is highlighted in green when it is a bullish<br />
breakout or red when it is a bearish break out.<br />
<strong>The</strong> column following <strong>the</strong> OR Pattern is <strong>the</strong> “<strong>Opening</strong> <strong>Range</strong> Vol. vs. Avg.” column.<br />
This is a volume gauge for <strong>the</strong> OR. If a stock has light volume during <strong>the</strong> OR it should<br />
not be considered to be a negative factor in selecting a trade. But, it is good to know<br />
when a stock has big volume during its OR because it can lead to more powerful<br />
breakouts and stronger support when a stock retraces from above <strong>the</strong> OR. In<br />
HotScans you can decide whe<strong>the</strong>r or not you want this column to be displayed.<br />
<strong>The</strong>se three columns, “% Off High”, “OR Patt.”, and “OR Vol. vs. Avg.”, provide a<br />
quick and powerful way to compare and contrast <strong>the</strong> performance of all <strong>the</strong> stocks in a<br />
HotScans table as well as <strong>the</strong> market indexes. Let’s look at <strong>the</strong> examples in Figure 7-<br />
4. <strong>The</strong> top two rows of <strong>the</strong> table show you <strong>the</strong> Dow Jones Industrial Index (DJI), and<br />
<strong>the</strong> Nasdaq Composite Index (COMPX). On this day <strong>the</strong> Dow traded above its OR (it<br />
has a green dot above <strong>the</strong> OR black dot), but it is now trading below its OR (it has a<br />
red down arrow). <strong>The</strong> COMPX, on <strong>the</strong> o<strong>the</strong>r hand, never traded above its OR, and it is<br />
also trading below its OR. Both indexes are trading in <strong>the</strong> bottom half of <strong>the</strong>ir daily<br />
range as evidenced by <strong>the</strong>ir “% Off High” readings of –61% and –81% respectively.<br />
Now contrast <strong>the</strong> price action in <strong>the</strong> indexes with <strong>the</strong> three stocks shown. All three are<br />
trading above <strong>the</strong>ir OR (<strong>the</strong>y all have green up arrows), but <strong>the</strong>y have all had slightly<br />
different trading patterns thus far today. MCK traded below its OR, but it is now<br />
trading above its OR. This shows that it was initially pulled down with <strong>the</strong> market but<br />
it has demonstrated real strength by rallying above its OR on huge volume (999%).<br />
<strong>The</strong> o<strong>the</strong>r two stocks (BUD and ENCY) have not been pulled down by <strong>the</strong> day’s weak<br />
market. You can tell that BUD and ENCY have not traded below <strong>the</strong>ir OR because <strong>the</strong>y<br />
do not have a red dot. All three stocks are strong because <strong>the</strong>y are at <strong>the</strong> top of <strong>the</strong><br />
Basic Bullish Breakout Strategy.<br />
If you want to be more selective about which stocks to analyze you can dig fur<strong>the</strong>r<br />
into <strong>the</strong> HotScans data. For example, if you only want to trade stocks with big OR<br />
volume, or at least bigger OR volume than <strong>the</strong> market, <strong>the</strong>n ENCY is clearly <strong>the</strong> stock<br />
to analyze fur<strong>the</strong>r with its OR volume of 369%. If you favor stocks hitting new highs<br />
http://www.dataviewllc.com/ 53
<strong>the</strong>n you will look for stocks with a “% Off High” value close to zero as demonstrated<br />
by MCK (0%) and ENCY (-2%). If you prefer <strong>the</strong> stock to have corrected from its high<br />
<strong>the</strong>n BUD, which has a “% Off High” reading of –18%, is where you should focus. Of<br />
course if you are looking for big volume to be trading now <strong>the</strong>n MCK and BUD should<br />
be your first choices with relative volume in <strong>the</strong> last five minutes of 999% and 417%<br />
respectively.<br />
In addition to all <strong>the</strong> data you can see<br />
in <strong>the</strong> HotScans table, <strong>the</strong>re is a popup<br />
data window behind every OR Pattern.<br />
When you place your mouse over a<br />
stock’s OR Pattern a window will pop<br />
up with over 15 data points of interest<br />
such as <strong>the</strong> actual price of <strong>the</strong> OR high<br />
and low, <strong>the</strong> day’s high and low, <strong>the</strong><br />
prior day’s high and low, volume and<br />
average range data and more. This<br />
enables a quick check of conditions<br />
such as whe<strong>the</strong>r or not today’s OR<br />
breakout is occurring above<br />
yesterday’s high, which is a more<br />
bullish condition than when <strong>the</strong><br />
breakout occurs below <strong>the</strong> resistance of<br />
<strong>the</strong> prior day’s high.<br />
Figure 7-6: <strong>The</strong> HotScans Data Window<br />
This popup data window opens when you<br />
put <strong>the</strong> mouse over <strong>the</strong> OR Pattern. This<br />
window offers a quick display of key<br />
statistics and potential support and<br />
resistance levels for <strong>the</strong> selected stock.<br />
How to Find OR <strong>Trading</strong> Setups with HotScans<br />
If all of <strong>the</strong> flexibility and filter settings sound intimidating, don’t worry. You can start<br />
using HotScans without knowing how to change any setting by using a predefined<br />
HotScans Strategy. A HotScans Strategy is a scan that has been predefined by traders<br />
at DataView. <strong>The</strong> DataView website has a large section called “Strategies” dedicated to<br />
making it easy to find trading candidates using predefined Strategies. A HotScans<br />
Strategy enables you to simply click on a link and have a scan run with all <strong>the</strong> Basic<br />
Filters, Advanced Filters, and Time Frames set for you. This will enable you to quickly<br />
find potential trading candidates.<br />
<strong>The</strong> best way to start trading with <strong>the</strong> OR approach is to use <strong>the</strong> Basic OR Strategies<br />
found in HotScans. You can get started by simply running <strong>the</strong>m as <strong>the</strong>y are<br />
configured. You should also make an effort to understand <strong>the</strong> settings that DataView<br />
has used to create <strong>the</strong>se Strategies so you can modify <strong>the</strong> settings to suit your specific<br />
trading style. <strong>The</strong>se basic OR Strategies are set up to find a wide range of OR<br />
conditions. I’ll review four Strategies in detail to give you a framework with which to<br />
use HotScans to find good candidates for buying <strong>the</strong> OR breakout and fading <strong>the</strong> OR<br />
lows.<br />
Before you scan, know what you are looking for - have a check list<br />
Now that you’ve reached <strong>the</strong> point of letting HotScans find <strong>the</strong> candidates don’t<br />
disregard everything that was discussed in chapters 3,4,5 and 6! Remember HotScans<br />
will give you focused ideas, which you must <strong>the</strong>n analyze based on <strong>the</strong> characteristics<br />
you want to see in a good OR setup.<br />
It is a good practice to create a checklist of all <strong>the</strong> criteria you are looking for in a<br />
trade setup. This checklist should include all criteria, not just <strong>the</strong> criteria that<br />
http://www.dataviewllc.com/ 54
HotScans is filtering. When you run <strong>the</strong> HotScans Strategy you can quickly review <strong>the</strong><br />
stocks based on your checklist. Below is a sample checklist for a “fresh breakout”<br />
based on <strong>the</strong> concepts discussed in this book. If <strong>the</strong> answer to a checklist question is<br />
“yes” <strong>the</strong>n it should be viewed as a positive condition for buying <strong>the</strong> breakout. As a<br />
trader you want to find trades that meet as many of your criteria as possible. With a<br />
little practice you will be able to answer all <strong>the</strong>se questions in a matter of seconds as<br />
you review a stock’s chart.<br />
Trade Setup for a Fresh Breakout:<br />
1. OR characteristics (see chapter 4 for details)<br />
a. Is <strong>the</strong>re well-defined resistance near <strong>the</strong> OR high<br />
b. Is <strong>the</strong>re a bullish chart pattern near <strong>the</strong> OR high<br />
c. Was <strong>the</strong>re unusually high volume in <strong>the</strong> OR period<br />
2. <strong>The</strong> big picture (use daily chart)<br />
a. Is <strong>the</strong> OR high greater than or equal to yesterday’s high<br />
Note: If <strong>the</strong> stock is above <strong>the</strong> prior day’s high it is bullish because <strong>the</strong><br />
prior day’s high would o<strong>the</strong>rwise be resistance. When <strong>the</strong> stock is above<br />
<strong>the</strong> prior day’s high, that high becomes potential support. When <strong>the</strong> OR<br />
high is in <strong>the</strong> same area as <strong>the</strong> prior day’s high that level is more<br />
significant, and <strong>the</strong> breakout is often more substantial.<br />
b. Is <strong>the</strong> OR high above all major resistance levels<br />
Note: This follows <strong>the</strong> same reasoning as explained above with respect<br />
to <strong>the</strong> prior day’s high. If <strong>the</strong> stock is above or lines up with a major<br />
resistance level <strong>the</strong> breakout is more compelling. Beware of an OR<br />
breakout right below a major resistance level on <strong>the</strong> daily chart.<br />
c. Is <strong>the</strong> daily trend up<br />
Note: Here is an easy way to measure <strong>the</strong> strength of <strong>the</strong> trend using<br />
simple moving averages. In a strongly-trending stock <strong>the</strong> 10-day<br />
moving average is above <strong>the</strong> 20-day, which is above <strong>the</strong> 50-day moving<br />
average, and <strong>the</strong>y are all positively sloped.<br />
d. Did <strong>the</strong> stock gap higher<br />
Note: Gaps are bullish when <strong>the</strong>y follow through (breakout of <strong>the</strong> OR).<br />
If <strong>the</strong> gap is above <strong>the</strong> prior day’s high it is even more bullish.<br />
3. <strong>The</strong> OR Breakout (see chapter 5 for details)<br />
a. Is <strong>the</strong>re big volume at <strong>the</strong> breakout point<br />
b. Is <strong>the</strong>re a logical stop based on an intraday swing<br />
c. After <strong>the</strong> breakout does <strong>the</strong> stock exhibit bullish price action<br />
Note: Unless you are waiting for this confirmation, this assessment is<br />
made once you are in <strong>the</strong> trade.<br />
You may want to replace some of <strong>the</strong>se questions with your own criteria. If you are<br />
buying a retracement or a second breakout above <strong>the</strong> OR you will have additional<br />
criteria for <strong>the</strong> retracement and <strong>the</strong> second breakout.<br />
http://www.dataviewllc.com/ 55
Three Strategies for Catching OR Breakouts<br />
HotScans has at least three Strategies that will help you find OR breakout patterns.<br />
<strong>The</strong>se predefined scans will make finding stocks that meet your criteria extremely<br />
easy. Let’s review <strong>the</strong>se three Strategies.<br />
• <strong>The</strong> 10 O’clock Bulls Strategy<br />
• <strong>The</strong> Basic Bullish OR Breakout Strategy<br />
• Stocks Looking Up Strategy<br />
<strong>The</strong> 10 O’clock Bulls Strategy is <strong>the</strong> best place to start. In fact, it may be <strong>the</strong> only<br />
Strategy you need! This Strategy identifies <strong>the</strong> stocks that are up in price with <strong>the</strong><br />
biggest relative volume since <strong>the</strong> open. At 10:00 AM this list of stocks shows<br />
candidates with great potential for a big intraday move. <strong>The</strong> Basic Bullish OR Breakout<br />
Strategy identifies stocks with big volume that are currently breaking out or that are<br />
already trading above <strong>the</strong>ir OR. <strong>The</strong> Stocks Looking Up Strategy finds stocks that are<br />
trading on big volume near <strong>the</strong> OR high. This scan enables you to focus on stocks that<br />
have ei<strong>the</strong>r not yet broken out or have retraced to a point slightly below <strong>the</strong> OR high.<br />
Let’s start with <strong>the</strong> 10 O’clock Bulls Strategy.<br />
<strong>The</strong> 10 O’clock Bulls Strategy<br />
It may be too easy to get started with any HotScans Strategy. All you have to do is<br />
click on <strong>the</strong> Strategy link and you will get results. <strong>The</strong> first step in using any HotScans<br />
Strategy, however, is to become familiar with <strong>the</strong> criteria that make up <strong>the</strong> scan. It is<br />
important to understand <strong>the</strong> scan’s criteria so that you know why <strong>the</strong> stocks qualify as<br />
trading candidates. HotScans provides a brief description of <strong>the</strong> price and volume<br />
pattern that a Strategy finds, but a more thorough approach is to run <strong>the</strong> scan and<br />
<strong>the</strong>n click on <strong>the</strong> Advanced Filters link to see <strong>the</strong> actual criteria.<br />
<strong>The</strong> 10 O’clock Bulls Strategy is DataView’s “keep it simple” approach to trading <strong>the</strong><br />
OR. It is <strong>the</strong> best way to start trading <strong>the</strong> OR, and I am not going to complicate<br />
matters with suggested refinements to <strong>the</strong> Strategy’s criteria. In <strong>the</strong> description of <strong>the</strong><br />
o<strong>the</strong>r Strategies I go into more detail about how you can refine <strong>the</strong> criteria to get<br />
more specific results. You can also refine <strong>the</strong> 10 O’clock Bulls Strategy, but I’m not<br />
going to do that here in order to keep <strong>the</strong> discussion straightforward.<br />
This Strategy is a great place to start because it will not overwhelm you with trading<br />
ideas. This scan has two criteria. First, <strong>the</strong> stock must be trading higher than <strong>the</strong> prior<br />
day’s close. Second, <strong>the</strong> stock must have had at least 100% greater-than-average<br />
volume during <strong>the</strong> 30-minute OR. <strong>The</strong> Strategy sorts <strong>the</strong> results based on relative<br />
volume for <strong>the</strong> whole day (<strong>the</strong> Scan Period is “Big Vol. Since Open”). <strong>The</strong> result is a<br />
list of <strong>the</strong> stocks that are up in price for <strong>the</strong> day, have traded big volume on <strong>the</strong> open,<br />
and have continued to trade unusually large volume for <strong>the</strong> day.<br />
<strong>The</strong> simplest implementation of this Strategy as a trading approach is to follow <strong>the</strong>se<br />
steps:<br />
1. Run this scan at 10:00 AM (or shortly <strong>the</strong>reafter) and save <strong>the</strong> resulting list of<br />
stocks. You can save <strong>the</strong> list by printing it, or you can set <strong>the</strong> “Refresh” Basic<br />
Filter Criteria to “never” and <strong>the</strong>n pop out <strong>the</strong> scan. When you set <strong>the</strong> Refresh<br />
filter to “never” HotScans will not automatically refresh <strong>the</strong> scan. Setting a scan<br />
to “never” refresh and clicking <strong>the</strong> PopOut option will put <strong>the</strong> Strategy’s list of<br />
stocks in its own window, which you can refer to for <strong>the</strong> remainder of <strong>the</strong> day.<br />
2. Review this list of 25 stocks. Focus on <strong>the</strong> stocks with big volume in <strong>the</strong> OR. It<br />
is best to look at stocks with relative volume over 200%. Review <strong>the</strong> charts of<br />
<strong>the</strong>se stocks, and identify <strong>the</strong> ones that have a bullish big picture as described<br />
http://www.dataviewllc.com/ 56
in chapter 5 as well as in <strong>the</strong> checklist in this chapter. At a minimum look for a<br />
strong daily trend and trading above yesterday’s high. This review should<br />
narrow <strong>the</strong> list to fewer than 10 stocks. This reduced list is a great list of<br />
candidates to trade from <strong>the</strong> long side when <strong>the</strong>y trade above <strong>the</strong> OR!<br />
3. Enter <strong>the</strong> reduced list of fewer than 10 stocks into <strong>the</strong> program you use to<br />
track stocks and monitor <strong>the</strong>m for a breakout above <strong>the</strong> OR high. You simply<br />
wait for <strong>the</strong> stocks to break out and <strong>the</strong>n trade <strong>the</strong>m accordingly. Do not<br />
trade <strong>the</strong>m until <strong>the</strong>y break out. Use <strong>the</strong> tactics described in chapter 5. You<br />
will find that this list will yield great trading opportunities almost every day.<br />
Once you feel comfortable with <strong>the</strong> OR trading approach, you can let this scan refresh<br />
all day long to find additional candidates as <strong>the</strong> day progresses. This Strategy will not<br />
overwhelm you with new ideas all day long because <strong>the</strong> Scan Period is set to “Since<br />
Open” which means that <strong>the</strong> stocks in this table are <strong>the</strong> volume leaders for <strong>the</strong> whole<br />
day. A stock must trade unusually large volume to qualify for this list, so <strong>the</strong> turnover<br />
in <strong>the</strong> list is much slower than you will find with many of <strong>the</strong> o<strong>the</strong>r HotScans<br />
Strategies. This is why it is a good Strategy for first time HotScans users.<br />
<strong>The</strong> Basic Bullish OR Breakout Strategy<br />
<strong>The</strong> premise of <strong>the</strong> Basic Bullish OR<br />
Breakout Strategy is to alert traders to big<br />
volume during <strong>the</strong> breakout (within <strong>the</strong><br />
Scan Period) or when <strong>the</strong> stock is above<br />
<strong>the</strong> OR. This Strategy is based on a Big<br />
Volume Now scan. <strong>The</strong>refore, it is filtering<br />
for stocks with <strong>the</strong> highest relative volume<br />
in <strong>the</strong> Scan Period (5 minutes). <strong>The</strong> scan<br />
has two basic criteria: <strong>the</strong> stock must be<br />
trading above <strong>the</strong> 30-minute OR, and it<br />
must have had greater-than-average<br />
volume during <strong>the</strong> OR. As you know from<br />
reading this book a good OR breakout<br />
requires more than <strong>the</strong>se two simple<br />
criteria. Remember however, that <strong>the</strong>re<br />
are three ways to play <strong>the</strong> OR breakout –<br />
buy <strong>the</strong> breakout, buy <strong>the</strong> retracement,<br />
and buy <strong>the</strong> second breakout. This<br />
Strategy is based on a good general scan<br />
for finding many candidates for any one of<br />
<strong>the</strong>se three ways to trade a breakout.<br />
Figure 7-7 is an example of why it can be<br />
very helpful to find stocks that are trading<br />
big volume above <strong>the</strong>ir OR.<br />
Once you have a feel for <strong>the</strong> range of chart<br />
patterns that are identified by this scan<br />
you can determine if you need to refine<br />
Figure 7-7: 5-Minute Chart of GTech<br />
Holdings (GTK)<br />
<strong>The</strong> highlighted areas show volume surges<br />
that are <strong>the</strong> type of volume activity that <strong>the</strong><br />
Basic OR Breakout Strategy will identify.<br />
Notice how <strong>the</strong> volume swelled in <strong>the</strong> OR<br />
and as <strong>the</strong> stock exploded through <strong>the</strong> OR<br />
high. Each subsequent advance began with<br />
an increase in volume.<br />
<strong>the</strong> scan criteria. Some traders make <strong>the</strong> criteria more specific, while o<strong>the</strong>rs simply<br />
use <strong>the</strong> gauges and additional data in <strong>the</strong> table to visually narrow <strong>the</strong> list down to<br />
<strong>the</strong>ir favorite candidates. If you do decide to experiment with <strong>the</strong> settings you will be<br />
impressed with <strong>the</strong> ease with which you can refine this scan to get <strong>the</strong> most<br />
compelling candidates for your favorite setups.<br />
Before discussing how to refine <strong>the</strong> strategy let’s look at <strong>the</strong> chart of one of <strong>the</strong> three<br />
stocks from Figure 7-4. Figure 7-8 is <strong>the</strong> chart of ENCY when it appeared in <strong>the</strong> Basic<br />
http://www.dataviewllc.com/ 57
Bullish OR Breakout scan displayed in Figure 7-4. Figure 7-8 illustrates that this<br />
Strategy will find stocks with a bullish intraday chart pattern! ENCY had been<br />
consolidating in a tight range ($8.85-$8.99) for about two hours before <strong>the</strong> last 15<br />
minutes of increased volume led to a move to new highs. ENCY qualified as a<br />
candidate for a Bullish OR Breakout because it moved above its OR high. It is at <strong>the</strong><br />
top of <strong>the</strong> HotScans table because of <strong>the</strong> increase in volume. This is a bullish chart<br />
pattern because of <strong>the</strong> well-defined consolidation at <strong>the</strong> top of <strong>the</strong> OR. If <strong>the</strong> “big<br />
picture” criteria are also bullish, this would be a good candidate for a fresh breakout<br />
trade with a protective sell stop below <strong>the</strong> consolidation low of $8.85.<br />
Every stock that shows up in <strong>the</strong> Basic<br />
Bullish OR Breakout Strategy is not going to<br />
look exactly like <strong>the</strong> chart of ENCY in Figure<br />
7-8. This scan does not require that <strong>the</strong> stock<br />
consolidate or be near <strong>the</strong> OR high, but<br />
scanning for big volume at or above <strong>the</strong><br />
breakout will find stocks with patterns that<br />
look this good and better.<br />
Refining <strong>the</strong> Basic Bullish OR Breakout<br />
Strategy<br />
<strong>The</strong> default settings do not need to be<br />
changed. <strong>The</strong>y do a very good job of<br />
capturing <strong>the</strong> trading opportunities discussed<br />
in this book.<br />
For <strong>the</strong> advanced HotScans user, however,<br />
<strong>the</strong>re is additional flexibility to be exploited.<br />
<strong>The</strong>re isn’t one particular “correct” set of<br />
criteria for a HotScans Strategy or a trade<br />
setup. Various trading styles favor different<br />
nuances in a trade setup’s chart pattern.<br />
HotScans enables you to make any Strategy<br />
more sensitive to <strong>the</strong> chart pattern<br />
characteristics considered most important by<br />
you. Changing market conditions may also<br />
create a need to refine a Strategy’s settings.<br />
For example, in a strong bull market <strong>the</strong> best<br />
Figure 7-8: 5-Minute Chart of<br />
Encysive Pharmaceuticals (ENCY)<br />
This is what ENCY’s chart looked like<br />
when it appeared in <strong>the</strong> Basic Bullish OR<br />
Strategy displayed in Figure 7-4. It was<br />
on <strong>the</strong> verge of breaking out with<br />
increasing volume.<br />
trading approach may be to catch <strong>the</strong> first stocks that break out each day. Conversely,<br />
if <strong>the</strong> general market is in a consolidation phase and breakouts are not following<br />
through, <strong>the</strong>n you will want to be more selective. You can be more selective by<br />
adopting some or all of <strong>the</strong> refinements listed below. This is by no means <strong>the</strong> extent to<br />
which this Strategy can be customized, but it will give you some ideas about how<br />
refinements can change your results.<br />
Adjust <strong>the</strong> OR Volume vs. Average Volume setting. <strong>The</strong> default setting for OR<br />
volume requires that it be greater than average (greater than zero percent). Unusually<br />
large volume in <strong>the</strong> OR is a good indication that <strong>the</strong> stock may continue higher after a<br />
breakout, and that <strong>the</strong> OR will be good support if <strong>the</strong> stock retraces after <strong>the</strong><br />
breakout. This does not mean that a stock with average volume will not experience big<br />
breakout moves. It is not uncommon for <strong>the</strong> day’s biggest volume to occur during or<br />
after <strong>the</strong> breakout. This is why this Strategy is sorted by <strong>the</strong> Scan Period’s relative<br />
volume.<br />
http://www.dataviewllc.com/ 58
Under normal market conditions<br />
300% is a high threshold for <strong>the</strong><br />
30-minute OR volume setting.<br />
Keep in mind that stocks with high<br />
average daily volume will have a<br />
more difficult time trading such<br />
unusually high volume in <strong>the</strong>ir OR<br />
than stocks that have low average<br />
daily volume. One way to use this<br />
setting is to start at 300% as<br />
shown in Figure 7-9, and <strong>the</strong>n<br />
reduce in increments of 100% if<br />
you want to expand <strong>the</strong> list of<br />
candidates.<br />
Figure 7-9 HotScans’ Settings for OR<br />
Relative Volume<br />
Using <strong>the</strong> Advanced Filters to increase <strong>the</strong> <strong>Opening</strong><br />
<strong>Range</strong> volume filter to “Greater than 300%” will<br />
require that <strong>the</strong> stock’s volume in <strong>the</strong> OR period be<br />
300% greater than its average for <strong>the</strong> OR period (30<br />
minutes is <strong>the</strong> default OR Period).<br />
Increase <strong>the</strong> Scan Period. <strong>The</strong> default Scan Period is 5 minutes. <strong>The</strong> Scan Period<br />
determines <strong>the</strong> time period that is considered for a fresh breakout by <strong>the</strong> OR Pattern<br />
(a yellow up arrow). By increasing <strong>the</strong> Scan Period to 15 minutes <strong>the</strong> yellow up arrow<br />
in <strong>the</strong> OR Pattern will clearly identify stocks that have broken out in <strong>the</strong> last 15<br />
minutes. Figure 7-10 illustrates how to change <strong>the</strong> Scan Period. This refinement gives<br />
you more time to identify fresh OR breakouts because it is not unusual for a stock to<br />
spend 10 or 15 minutes right above it’s OR consolidating or flagging before it makes a<br />
significant advance.<br />
Increasing <strong>the</strong> Scan Period will not<br />
delay <strong>the</strong> point at which HotScans will<br />
generate <strong>the</strong> fresh breakout alert. It will<br />
only extend <strong>the</strong> time for which <strong>the</strong> OR<br />
Pattern will display <strong>the</strong> yellow up arrow<br />
alert.<br />
One side effect of increasing <strong>the</strong> Scan<br />
Period is that a stock’s inclusion will be<br />
based on its relative volume over <strong>the</strong><br />
longer period. In <strong>the</strong> example of<br />
increasing <strong>the</strong> Scan Period to 15<br />
minutes, <strong>the</strong> Strategy results will be<br />
sorted based on <strong>the</strong> relative volume<br />
over <strong>the</strong> last 15 minutes. This means<br />
<strong>the</strong> Strategy will favor <strong>the</strong> stocks that<br />
have ei<strong>the</strong>r (a) demonstrated high<br />
volume during <strong>the</strong> last 15 minutes or,<br />
(b) experienced an extremely large<br />
volume spike in <strong>the</strong> last 15 minutes, as<br />
Figure 7-10: Setting <strong>the</strong> Scan Period in<br />
HotScans<br />
<strong>The</strong>re is a drop-down menu at <strong>the</strong> top of every<br />
HotScans table to change <strong>the</strong> Scan Period.<br />
compared to <strong>the</strong> stocks that have just begun to show increased volume in <strong>the</strong> last 5<br />
minutes. In effect, increasing <strong>the</strong> Scan Period increases <strong>the</strong> volume criteria.<br />
Filter for fresh breakouts only. If you would like to focus strictly on fresh breakouts<br />
HotScans can do it. <strong>The</strong>re are 12 potential conditions a stock can be in with respect to<br />
how it is trading relative to its OR. <strong>The</strong> Advanced Filters page lists each one with <strong>the</strong><br />
option to include it in <strong>the</strong> scan. <strong>The</strong> Strategy’s default settings filter for any stock<br />
above <strong>the</strong> OR. Figure 7-11 shows <strong>the</strong> four OR Patterns that are included in this<br />
Strategy by default. You can set HotScans to only show stocks that have broken out<br />
during <strong>the</strong> Scan Period (i.e. have a yellow up arrow in <strong>the</strong> OR Pattern).<br />
http://www.dataviewllc.com/ 59
Filtering solely for fresh breakouts will<br />
focus your attention on <strong>the</strong> breakouts<br />
as <strong>the</strong>y occur. It is possible to see<br />
more fresh breakouts with this<br />
refinement because HotScans displays<br />
<strong>the</strong> top 25 stocks that qualify at <strong>the</strong><br />
time a scan is run. When you exclude<br />
stocks with big volume that broke out<br />
earlier in <strong>the</strong> day <strong>the</strong>re is a greater<br />
chance that a low volume breakout<br />
will qualify as one of <strong>the</strong> top 25<br />
stocks.<br />
A good method for focusing on fresh<br />
breakouts is to use this refinement in<br />
conjunction with leng<strong>the</strong>ning <strong>the</strong> Scan<br />
period to 10 or 15 minutes.<br />
Require a gap. <strong>The</strong> default settings<br />
for this Strategy do not filter for gaps<br />
but HotScans can do it. By filtering for<br />
stocks that gapped higher you can find<br />
Figure 7-11: Filtering for Bullish OR<br />
Patterns in HotScans<br />
<strong>The</strong>re are four bullish OR Patterns. <strong>The</strong> Advanced<br />
Filters section provides a check box to select <strong>the</strong><br />
patterns HotScans will find. If you only want to<br />
see stocks that are currently breaking out, <strong>the</strong>n<br />
only check <strong>the</strong> OR Patterns circled in this<br />
diagram.<br />
some of <strong>the</strong> most powerful follow-through breakouts. Since this Strategy has a 30-<br />
minute OR default setting, you should look for a gap up to follow higher ra<strong>the</strong>r than a<br />
gap down to buy (fade). Fading gaps should generally be done using a shorter interval<br />
than a 30-minute OR.<br />
A gap higher that is not filled before<br />
breaking out can be particularly<br />
explosive, especially if <strong>the</strong> gap is<br />
above <strong>the</strong> prior day’s high.<br />
HotScans enables you to filter for<br />
stocks that have gapped relative to<br />
<strong>the</strong>ir prior day’s closing price and/or<br />
relative to <strong>the</strong> prior day’s high.<br />
Figure 7-12 shows how to look for<br />
stocks that gapped above <strong>the</strong> prior<br />
day’s high.<br />
Require a retracement. If you do<br />
not want to buy <strong>the</strong> initial breakout<br />
<strong>the</strong>re are at least two ways to refine<br />
<strong>the</strong> HotScans filters to identify<br />
stocks that are above <strong>the</strong>ir OR and<br />
Figure 7-12: HotScans’ Filters for Gaps<br />
Here is an example of setting HotScans to filter for<br />
stocks where <strong>the</strong> current day’s low is $0.05 higher<br />
than <strong>the</strong> prior day’s high. This is a result of a gap<br />
higher open.<br />
have retraced from <strong>the</strong>ir day’s high. This technique could be used to buy a<br />
retracement to support, or to get a head start in analyzing candidates for buying <strong>the</strong><br />
second breakout.<br />
<strong>The</strong> first method of scanning for a retracement is to enter a minimum size<br />
retracement in <strong>the</strong> “% Off High” Advanced Filter box. <strong>The</strong> default settings for this<br />
Strategy do not filter for a retracement. If you want to filter for a minimum<br />
retracement from <strong>the</strong> high, select “retraced more than” from <strong>the</strong> filter’s drop down<br />
menu and <strong>the</strong>n enter a value in <strong>the</strong> filter’s input box. As noted in <strong>the</strong> earlier discussion<br />
of <strong>the</strong> “% Off High” column in <strong>the</strong> HotScans display, this value represents a<br />
percentage of <strong>the</strong> day’s range.<br />
http://www.dataviewllc.com/ 60
For example, to find stocks that have<br />
retraced more than 20% of <strong>the</strong> day’s range,<br />
select “retraced more than” and enter <strong>the</strong><br />
value “-20” as <strong>the</strong> “% Off High” filter<br />
criteria as shown in Figure 7-13. This will<br />
require that <strong>the</strong> stock cannot be in <strong>the</strong> top<br />
20% of <strong>the</strong> day’s range. Since you will be<br />
using this setting in conjunction with a<br />
Strategy that requires <strong>the</strong> stock to be above<br />
its OR, you will find stocks that are strong<br />
for <strong>the</strong> day, but have experienced a<br />
significant retracement.<br />
Figure 7-13: Filtering for<br />
Retracements with HotScans<br />
This setting requires that <strong>the</strong> stock has<br />
retraced at least 20% of its daily range<br />
from <strong>the</strong> day’s high.<br />
<strong>The</strong> second method for finding strong stocks that have retraced from <strong>the</strong>ir day’s high<br />
is to use <strong>the</strong> Previous Period filter.<br />
As described earlier, <strong>the</strong> Previous<br />
Period is <strong>the</strong> HotScans’ time frame<br />
that occurs prior to <strong>the</strong> Scan Period.<br />
<strong>The</strong> default settings for <strong>the</strong> Basic<br />
Bullish OR Breakout Strategy set <strong>the</strong><br />
Scan Period to 5 minutes, but <strong>the</strong><br />
Previous Period is not filtered. <strong>The</strong><br />
Percent Price Change setting in <strong>the</strong><br />
Previous Period filter allows you to<br />
specify a required percent price<br />
change for this time frame. For<br />
example, it is easy to filter for stocks<br />
that have declined at least .5% (half<br />
of a percent) during <strong>the</strong> 15 minutes<br />
prior to <strong>the</strong> Scan Period. Figure 7-14<br />
illustrates this two-step process. First<br />
set <strong>the</strong> Previous Period time frame to<br />
15 minutes. <strong>The</strong>n use <strong>the</strong> Advanced<br />
Filters to set <strong>the</strong> Previous Period<br />
Percent Price Change to “Less than”<br />
with a value of “-.5%”. When filters<br />
are set on <strong>the</strong> Previous Period time<br />
frame HotScans will display price and<br />
volume gauges for <strong>the</strong> period as well<br />
as <strong>the</strong> price change in dollar terms.<br />
This makes it very easy to identify <strong>the</strong><br />
most interesting retracements because<br />
<strong>the</strong> price gauge illustrates <strong>the</strong> size of<br />
<strong>the</strong> retracement and <strong>the</strong> volume gauge<br />
shows whe<strong>the</strong>r or not <strong>the</strong> decline<br />
occurred on light volume. <strong>The</strong> Scan<br />
Period filters could be used in <strong>the</strong><br />
same manner, but since this Strategy<br />
Figure 7-14: Example settings for <strong>the</strong><br />
Previous Period<br />
Select <strong>the</strong> Previous Period Time Frame:<br />
Set Previous Period Filter Criteria:<br />
<strong>The</strong> Previous Period Settings enable you to<br />
define a stock’s price and volume action<br />
prior to <strong>the</strong> Scan Period. Here is an example<br />
that requires <strong>the</strong> stock to have declined<br />
more than .5% in a 15-minute time frame.<br />
is focused on finding stocks with <strong>the</strong> strongest volume in <strong>the</strong> Scan Period it may not<br />
be desirable to require that <strong>the</strong> stock be trading lower during this period of big<br />
volume.<br />
In conclusion, <strong>the</strong> Basic Bullish OR Breakout Strategy is extremely powerful without<br />
making any refinements to its criteria. <strong>The</strong> five ways of refining <strong>the</strong> scan’s criteria that<br />
I have just discussed are intended to show you how you can use HotScans to find<br />
http://www.dataviewllc.com/ 61
stocks that are even more specifically suited to your OR trading style or to changing<br />
market conditions.<br />
Finding Stocks Before <strong>The</strong>y Break Out<br />
<strong>The</strong> Basic Bullish OR Breakout Strategy that was discussed above will not display a<br />
stock unless it is trading above its OR. However, HotScans has ano<strong>the</strong>r Strategy that<br />
will alert you to stocks before <strong>the</strong>y trade above <strong>the</strong>ir OR. This is accomplished by<br />
filtering for stocks trading close to <strong>the</strong>ir OR high. <strong>The</strong> advantage that this Strategy<br />
provides is that it can alert you to stocks in time for you to anticipate <strong>the</strong> breakout<br />
before it occurs. This Strategy is called “Stocks Looking Up”.<br />
<strong>The</strong> Stocks Looking Up Strategy<br />
<strong>The</strong> Stocks Looking Up Strategy is set up as a general scan. Its main objective is to<br />
identify stocks trading near and below <strong>the</strong>ir OR high. <strong>The</strong> results are sorted based on<br />
5-minute relative volume. It includes stocks that have traded slightly above <strong>the</strong>ir OR,<br />
but are currently below it. <strong>The</strong> scan will find stocks trading near <strong>the</strong>ir OR highs before<br />
<strong>the</strong>y move.<br />
Let’s review <strong>the</strong> scan’s criteria. <strong>The</strong>re are two main filters. First, <strong>the</strong> “% Off High” is<br />
set to “Retraced less than -20%”. This filter mandates that <strong>the</strong> stock be in <strong>the</strong> top<br />
20% of its daily range, or near <strong>the</strong> day’s high. <strong>The</strong> second filter is based on <strong>the</strong> OR<br />
Pattern. <strong>The</strong> stock is required to be inside its OR. <strong>The</strong>re are four possible scenarios in<br />
which this can occur and all four are included in <strong>the</strong> scan. <strong>The</strong> combination of <strong>the</strong>se<br />
two filters results in a scan that identifies stocks that are below <strong>the</strong>ir OR high and near<br />
<strong>the</strong>ir high for <strong>the</strong> day. While <strong>the</strong> OR high does not necessarily have to be equal to <strong>the</strong><br />
high of <strong>the</strong> day, it must be close to qualify.<br />
Keep in mind that once a stock trades above <strong>the</strong> OR high it will no longer qualify for<br />
this scan. Once above <strong>the</strong> OR, <strong>the</strong> stock will be a candidate for <strong>the</strong> Basic Bullish OR<br />
Breakout Strategy. <strong>The</strong> best way to use this Strategy to find breakout candidates is to<br />
analyze <strong>the</strong> charts of <strong>the</strong> stocks that appear in this scan from <strong>the</strong> perspective of<br />
whe<strong>the</strong>r or not you would be interested in <strong>the</strong> stock if it advances through <strong>the</strong> OR<br />
high. When you find a stock that you would like to trade when it breaks its OR high,<br />
add it to a watch list in your trading software where you can monitor it closely for a<br />
breakout and/or keep an eye out for it in <strong>the</strong> Basic Bullish OR Breakout scan.<br />
Identifying <strong>the</strong> explosive stocks before <strong>the</strong>y breakout is not easy. But a big part of<br />
being successful in day trading is being prepared and acting quickly. By looking at <strong>the</strong><br />
stocks in this Strategy you will find OR patterns as <strong>the</strong>y are developing ra<strong>the</strong>r than<br />
after <strong>the</strong>y have advanced through <strong>the</strong> OR high. <strong>The</strong> objective of this Strategy is to<br />
give you time to analyze breakout candidates before <strong>the</strong>y move above <strong>the</strong> OR.<br />
Refining <strong>the</strong> Stocks Looking Up Strategy<br />
<strong>The</strong> objective in implementing this Strategy is to find stocks with big volume near <strong>the</strong><br />
high of <strong>the</strong> day when <strong>the</strong> high of <strong>the</strong> OR is close or equal to <strong>the</strong> high of <strong>the</strong> day. <strong>The</strong><br />
default settings do a great job of identifying <strong>the</strong>se candidates but <strong>the</strong> flexibility of<br />
HotScans enables you to be more specific about <strong>the</strong> patterns <strong>the</strong> Strategy will return.<br />
Here are some suggested ways of refining <strong>the</strong> scan criteria for advanced users.<br />
Reduce <strong>the</strong> retracement from <strong>the</strong> high. <strong>The</strong> default settings for this Strategy<br />
require that <strong>the</strong> stocks’ last price and OR high are within <strong>the</strong> top 20% of <strong>the</strong> day’s<br />
range. When you are reviewing <strong>the</strong> charts of <strong>the</strong> stocks returned by this Strategy you<br />
might find that <strong>the</strong> stocks are not close enough to <strong>the</strong>ir OR high.<br />
http://www.dataviewllc.com/ 62
If you would like to require that a stock Figure 7-15: Percent Off High Filter<br />
be trading closer to <strong>the</strong> OR high to<br />
qualify <strong>the</strong>n decrease <strong>the</strong> allowable<br />
retracement in <strong>the</strong> “% Off High” filter.<br />
For example, a “% Off High” value of<br />
“-10” would be considered a very small<br />
retracement from <strong>the</strong> high, and would<br />
only show stocks that are trading very<br />
close to <strong>the</strong>ir OR high. This refinement<br />
will enable you to focus on stocks that<br />
This filter determines how close to <strong>the</strong> day’s<br />
high <strong>the</strong> stock must be.<br />
are closer to <strong>the</strong>ir breakout points, but it<br />
may also give you less time to analyze <strong>the</strong> candidates and take appropriate action.<br />
Filter for a consolidation pattern. <strong>The</strong> default settings for this Strategy are focused<br />
on <strong>the</strong> fact that <strong>the</strong> stock must be close to its OR high as well as <strong>the</strong> day’s high. <strong>The</strong>y<br />
do not filter specifically for consolidation near <strong>the</strong> high. If a stock advances quickly<br />
from <strong>the</strong> low of <strong>the</strong> OR up to <strong>the</strong> high of <strong>the</strong> OR in a 5-minute time frame <strong>the</strong> stock<br />
may qualify based on <strong>the</strong> default settings.<br />
This pattern may be one that you would<br />
like to see, but if you prefer to find<br />
stocks that have a tight consolidation<br />
pattern at <strong>the</strong> top of <strong>the</strong> OR you can set<br />
filters to require that <strong>the</strong> stock has<br />
traded near its high for a period of time.<br />
<strong>The</strong> method of defining this pattern in<br />
HotScans is not very intuitive, but <strong>the</strong><br />
settings are easy so I’ll begin with an<br />
example. To define <strong>the</strong> “consolidation”<br />
set <strong>the</strong> previous period to 30 minutes,<br />
and <strong>the</strong> Percent Price Change filter in<br />
both <strong>the</strong> Scan Period and <strong>the</strong> Previous<br />
Period to “Less than .2”. Figure 7-16<br />
shows how <strong>the</strong>se settings should be<br />
entered on <strong>the</strong> Advanced Filters page.<br />
Here is why <strong>the</strong>se settings work. <strong>The</strong><br />
duration of <strong>the</strong> consolidation period is<br />
Figure 7-16: Scan Period settings for<br />
identifying intraday consolidation<br />
<strong>The</strong> circles show <strong>the</strong> nuance of this refinement.<br />
<strong>The</strong> % Price Change is set to “Less than” and<br />
with positive values in both periods.<br />
defined by <strong>the</strong> sum of <strong>the</strong> time frame of <strong>the</strong> Scan Period (5 minutes) plus <strong>the</strong> Previous<br />
Period (30 minutes). <strong>The</strong> criteria set in <strong>the</strong> Percent Price Change in <strong>the</strong> Scan Period<br />
and <strong>the</strong> Previous Period, combined with <strong>the</strong> “% Off High” setting, defines <strong>the</strong> volatility<br />
of <strong>the</strong> consolidation period. A critical nuance in <strong>the</strong>se settings is that <strong>the</strong> Percent Price<br />
Change settings are set to “Less than” followed by a positive value (.2) as opposed to<br />
<strong>the</strong> normal HotScans setting combination of “Less than” followed by a negative value.<br />
<strong>The</strong>se settings limited <strong>the</strong> advance that a qualifying stock can experience during <strong>the</strong><br />
Scan Period or <strong>the</strong> Previous Period, and <strong>the</strong> “% Off High” criteria limit <strong>the</strong> decline that<br />
a qualifying stock can experience. Combined <strong>the</strong>se settings define a condition of<br />
consolidation.<br />
Defining consolidation requires a definition of volatility within a certain time frame.<br />
Using this technique in HotScans, <strong>the</strong> volatility is determined by Percent Price Change<br />
settings in <strong>the</strong> Scan and Previous Periods, and <strong>the</strong> time frame is determined by <strong>the</strong><br />
duration selected for <strong>the</strong> Scan and Previous Periods.<br />
http://www.dataviewllc.com/ 63
<strong>The</strong> chart of QSFT in Figure 7-17 is an<br />
example of a stock that qualified under <strong>the</strong><br />
settings in <strong>the</strong> discussion above. <strong>The</strong> yellow<br />
highlighted area of <strong>the</strong> chart is <strong>the</strong><br />
consolidation that <strong>the</strong> Strategy identified.<br />
Every stock that this Strategy identifies will<br />
not have a chart that looks exactly like<br />
QSFT, but this is an example of how<br />
HotScans will find great consolidation<br />
patterns near <strong>the</strong> OR high.<br />
<strong>The</strong> settings of 30 minutes and .2% were<br />
used as an example so that you can use<br />
this Strategy in <strong>the</strong> morning shortly after<br />
<strong>the</strong> 30-minute OR has been established.<br />
Early in <strong>the</strong> trading day <strong>the</strong> potential<br />
duration of <strong>the</strong> consolidation period is<br />
limited because <strong>the</strong> scan requires that <strong>the</strong><br />
consolidation period be shorter than <strong>the</strong><br />
time in which <strong>the</strong> market has been open.<br />
Figure 7-17: 5-Minute Chart of<br />
Quest Software (QSFT)<br />
This concept also works very well for<br />
<strong>The</strong> highlighted area in <strong>the</strong> QSFT chart<br />
finding late afternoon trades by identifying<br />
represents <strong>the</strong> consolidation pattern<br />
stocks that are about to break out from a<br />
identified by refining <strong>the</strong> settings in <strong>the</strong><br />
lunch hour consolidation period. For <strong>the</strong>se Stocks Looking Up Strategy.<br />
patterns try setting <strong>the</strong> Previous Period to<br />
60 minutes with <strong>the</strong> Percent Price Change values set to “Less Than .5%”.<br />
If you find that <strong>the</strong> consolidation is not close enough to <strong>the</strong> OR high you can reduce<br />
<strong>the</strong> “% Off High” setting as discussed in <strong>the</strong> previous refinement suggestion (“Reduce<br />
<strong>the</strong> retracement from <strong>the</strong> high”). You may also find that as you reduce <strong>the</strong> duration of<br />
your consolidation period you will want to reduce <strong>the</strong> Percent Price Change value.<br />
Adjust <strong>the</strong> OR Volume vs. Average Volume Setting.<br />
This is <strong>the</strong> same technique discussed as a refinement for <strong>the</strong> Basic Bullish OR<br />
Breakout Strategy.<br />
Require a gap.<br />
This is <strong>the</strong> same technique discussed as a refinement for <strong>the</strong> Basic Bullish OR<br />
Breakout Strategy.<br />
This Strategy is a way to identify breakout trades early. This Strategy should be used<br />
as a tool to find stocks that are worth monitoring closely for a potential breakout.<br />
Finding Candidates for Fading <strong>the</strong> OR Low<br />
Buying stocks that are near a low is a very different trading style than buying stocks<br />
that are breaking out to new highs. <strong>The</strong> obvious difference is that it requires taking a<br />
position that is likely to be contrary to <strong>the</strong> current momentum of <strong>the</strong> stock. <strong>The</strong>re are<br />
also some subtle differences in <strong>the</strong> way stocks trade when <strong>the</strong>y are falling versus<br />
when <strong>the</strong>y are rising. And don’t forget <strong>the</strong> fact that stocks generally fall faster than<br />
<strong>the</strong>y rally.<br />
In chapter 6 I discussed <strong>the</strong> tactics of fading <strong>the</strong> OR low, or buying a stock using <strong>the</strong><br />
OR low as <strong>the</strong> reference point. One of <strong>the</strong> most important points in chapter 6 was that<br />
fading <strong>the</strong> 30-minute OR low does not mean buying stocks because it is 10:00 AM.<br />
<strong>The</strong>re isn’t anything magical about 10:00 AM. <strong>The</strong> market does often reverse its initial<br />
http://www.dataviewllc.com/ 64
morning direction around this time, but this tendency is not reliable enough to be <strong>the</strong><br />
sole requirement for initiating a trade. It is important to let <strong>the</strong> market demonstrate<br />
that <strong>the</strong> OR low is a significant price point. This book has emphasized <strong>the</strong> importance<br />
of letting <strong>the</strong> market define <strong>the</strong> critical price levels at or near <strong>the</strong> OR high; fading <strong>the</strong><br />
OR low requires <strong>the</strong> same type of market analysis.<br />
Let’s create a basic trade setup checklist for a trading approach based on buying<br />
stocks near <strong>the</strong> low of <strong>the</strong>ir OR. You may want to replace some of <strong>the</strong>se questions with<br />
your own criteria.<br />
Trade Setup for fading <strong>the</strong> OR low:<br />
1. OR characteristics (see chapter 4 for details)<br />
a. Is <strong>the</strong>re well-defined support near <strong>the</strong> OR low<br />
b. Was <strong>the</strong> OR low formed with big volume<br />
c. Is <strong>the</strong>re a bullish reversal pattern at <strong>the</strong> OR low<br />
2. <strong>The</strong> big picture (use daily chart)<br />
a. Is <strong>the</strong> OR low above or equal to yesterday’s low<br />
Note: <strong>The</strong> prior day’s low represents a level of support or resistance. If<br />
<strong>the</strong> stock is trading below <strong>the</strong> prior low <strong>the</strong>re is an increased level of risk<br />
when establishing a long position.<br />
b. Is <strong>the</strong> daily trend up<br />
Note: Here is an easy way to measure <strong>the</strong> strength of <strong>the</strong> trend using<br />
simple moving averages. In a strongly trending stock <strong>the</strong> 10-day<br />
moving average is above <strong>the</strong> 20-day, which is above <strong>the</strong> 50-day moving<br />
average, and <strong>the</strong>y are all positively sloped.<br />
c. Did <strong>the</strong> stock gap higher, and if so, did it gap over <strong>the</strong> prior day’s high<br />
Note: Gaps that are not excessive are bullish. But gaps that trade below<br />
<strong>the</strong> low of <strong>the</strong> OR are very dangerous! Avoid being long a stock that has<br />
gapped higher and is currently trading below <strong>the</strong> OR.<br />
3. Price and volume action that supports buying <strong>the</strong> OR low (see chapter 6 for<br />
details).<br />
a. Is this a second test of <strong>the</strong> lows<br />
Note: Look for double bottoms. If it is <strong>the</strong> third or fourth swing down to<br />
<strong>the</strong> lows approach <strong>the</strong> stock more cautiously.<br />
b. Was <strong>the</strong>re a clear rejection (strong bounce) off <strong>the</strong> OR low area<br />
Note: This can include trading below <strong>the</strong> OR followed by a sharp quick<br />
rally.<br />
c. Has <strong>the</strong> stock consolidated and formed a base from which it can rally<br />
Note: This pattern was discussed in chapter 6. See Figures 6-1 and 6-2<br />
for examples.<br />
d. Is <strong>the</strong>re a positive intraday relative strength pattern<br />
Note: This pattern was discussed in chapter 6. See Figure 6-3 for an<br />
explanation.<br />
This list clearly emphasizes that <strong>the</strong> big picture should be bullish. It could also be<br />
argued that if <strong>the</strong> stock’s big picture is extremely oversold, an opportunity could exist<br />
http://www.dataviewllc.com/ 65
to trade from <strong>the</strong> long side. I, however, would prefer to have <strong>the</strong> big picture trend<br />
going in <strong>the</strong> same direction as my potential trade.<br />
<strong>The</strong> Long Side of <strong>the</strong> OR Strategy<br />
Catching <strong>the</strong> OR Low<br />
HotScans has a Strategy that identifies candidates for fading <strong>the</strong> OR low, called “<strong>The</strong><br />
Long Side of <strong>the</strong> OR Low.” <strong>The</strong> objective of this scan is to find stocks that are trading<br />
near <strong>the</strong>ir 30-minute OR low when <strong>the</strong> OR low is close or equal to <strong>the</strong> low for <strong>the</strong> day.<br />
<strong>The</strong> Strategy also sorts <strong>the</strong> results by relative volume. Identifying stocks trading<br />
unusually large volume near <strong>the</strong> day’s low and <strong>the</strong> OR low enables you to find long<br />
candidates that are down from <strong>the</strong>ir open, but at a significant price point. As you know<br />
from <strong>the</strong> list above, a potential long candidate has many more criteria than simply its<br />
position relative to <strong>the</strong> OR and daily low, but <strong>the</strong>se are significant price levels so this<br />
Strategy will give you <strong>the</strong> ability to analyze stocks before <strong>the</strong>y move higher.<br />
Let’s review <strong>the</strong> Strategy’s criteria. <strong>The</strong>re are two main filters. First, <strong>the</strong> “% Off High”<br />
is set to “Retraced more that -80%”. This filter mandates that <strong>the</strong> stock be in <strong>the</strong><br />
bottom 20% of <strong>the</strong> day’s range, or near <strong>the</strong> day’s low. Second, <strong>the</strong> OR Pattern is<br />
filtered for stocks that are within <strong>the</strong> OR. This means that a stock trading below <strong>the</strong><br />
OR will not show up as a candidate. HotScans has four OR Patterns that include <strong>the</strong><br />
condition of <strong>the</strong> stock trading within its OR. All four of <strong>the</strong>se OR Patterns are included<br />
in this scan.<br />
As with every HotScans Strategy <strong>the</strong> best way to get started is to simply let <strong>the</strong> scan<br />
run all day and review <strong>the</strong> chart patterns of <strong>the</strong> stocks that it identifies. Use <strong>the</strong><br />
checklist created above as a quick reference for <strong>the</strong> characteristics of a good setup.<br />
Remember that ultimately you are looking for evidence of good support near <strong>the</strong> low<br />
as <strong>the</strong> basis for your trade setup. As I have said previously about identifying support<br />
in <strong>the</strong> charts – if it isn’t obvious move on to <strong>the</strong> next chart. <strong>The</strong>re are quite a few<br />
reversal patterns that can be helpful in quickly identifying market lows, but that topic<br />
is beyond <strong>the</strong> scope of this book. You will find more on this topic in <strong>the</strong> Newsletters<br />
and Education section of <strong>the</strong> DataView website (http://www.DataViewLLC.com).<br />
One of <strong>the</strong> easiest aspects of implementing this trading approach is identifying <strong>the</strong><br />
correct stop loss price point. If you buy a stock with <strong>the</strong> expectation that <strong>the</strong> low for<br />
<strong>the</strong> day has been established <strong>the</strong>n <strong>the</strong> best stop is <strong>the</strong> low of <strong>the</strong> day. If you find a<br />
candidate from this scan you should always consider <strong>the</strong> low of <strong>the</strong> day to be your<br />
stop of last resort!<br />
In summary, when using this Strategy you are looking for stocks that are testing <strong>the</strong><br />
OR low when it is also <strong>the</strong> low of <strong>the</strong> day. <strong>The</strong> fact that <strong>the</strong> OR low is also <strong>the</strong> low of<br />
<strong>the</strong> day is an important point. If <strong>the</strong> stock establishes a new low below <strong>the</strong> OR <strong>the</strong>n<br />
that low (<strong>the</strong> low of <strong>the</strong> day) is <strong>the</strong> important low. When analyzing a candidate from<br />
this Strategy you should consider whe<strong>the</strong>r or not <strong>the</strong> stock is in a bullish condition on<br />
a daily basis, <strong>the</strong>n assess <strong>the</strong> OR low (or low for <strong>the</strong> day) for <strong>the</strong> potential that it will<br />
offer support, and finally look for a bullish intraday pattern that creates an entry point<br />
for a trade. <strong>The</strong> checklist outlined above describes <strong>the</strong>se steps in more detail. This<br />
Strategy is a good scan for finding big volume reversals at key price levels.<br />
Refining <strong>the</strong> Stocks in <strong>the</strong> Long Side of <strong>the</strong> OR Strategy<br />
<strong>The</strong> objective in implementing this Strategy is to find stocks with big volume near <strong>the</strong><br />
low of <strong>the</strong> day when <strong>the</strong> low of <strong>the</strong> OR is close or equal to <strong>the</strong> low of <strong>the</strong> day. <strong>The</strong><br />
default settings will find <strong>the</strong>se candidates. It is not necessary to change <strong>the</strong> default<br />
settings. For <strong>the</strong> advanced HotScans user <strong>the</strong>re is a lot of flexibility in HotScans that<br />
http://www.dataviewllc.com/ 66
enables you to be more specific about <strong>the</strong> patterns that <strong>the</strong> Strategy will return. Here<br />
are some suggested ways of refining <strong>the</strong> scan criteria for advanced users.<br />
Increase <strong>the</strong> retracement from <strong>the</strong> high (reduce <strong>the</strong> distance from <strong>the</strong> low).<br />
<strong>The</strong> default settings for this Strategy<br />
require that a stock’s last price and OR<br />
low are within <strong>the</strong> bottom 20% of <strong>the</strong><br />
day’s range as shown in Figure 7-18.<br />
When you are reviewing <strong>the</strong> charts of<br />
<strong>the</strong> stocks returned by this Strategy<br />
you might find that <strong>the</strong> stocks are not<br />
as close to <strong>the</strong>ir OR low as you would<br />
like.<br />
If you would like to require <strong>the</strong> stock<br />
to be trading closer to <strong>the</strong> OR low to<br />
qualify, decrease <strong>the</strong> required<br />
retracement from <strong>the</strong> low in <strong>the</strong> “% Off<br />
Figure 7-18: Percent Off High Filter<br />
This filter determines how close to <strong>the</strong> day’s low<br />
<strong>the</strong> stock must be. A value of –100% represents<br />
a new low for <strong>the</strong> day. This setting requires that<br />
<strong>the</strong> stock be trading in <strong>the</strong> bottom 20% of <strong>the</strong><br />
day’s range.<br />
High” filter. For example, a “% Off High” value of “-90” would be considered a very<br />
small retracement from <strong>the</strong> low, and would only show stocks that are trading very<br />
close to <strong>the</strong>ir OR low. This refinement will enable you to focus on stocks that are<br />
closer to <strong>the</strong>ir lows, but it may also give you less time to analyze <strong>the</strong> candidates<br />
before <strong>the</strong>y rally.<br />
Filter for a consolidation pattern. <strong>The</strong> default settings for this Strategy mandate<br />
that <strong>the</strong> stock be close to its OR low and <strong>the</strong> day’s low, but <strong>the</strong>y do not filter<br />
specifically for consolidation near <strong>the</strong> low. If a stock declines quickly from <strong>the</strong> high of<br />
<strong>the</strong> OR to <strong>the</strong> low of <strong>the</strong> OR in a 5-minute time frame, <strong>the</strong> stock may qualify based on<br />
<strong>the</strong> default settings. This pattern may be one that you would like to see, but if you<br />
prefer to limit your results to stocks that have a tight consolidation pattern at <strong>the</strong><br />
bottom of <strong>the</strong> OR, you can.<br />
This method of defining consolidation<br />
with HotScans is <strong>the</strong> same method that<br />
was described in <strong>the</strong> discussion of <strong>the</strong><br />
“Stocks Looking Up” Strategy. To define<br />
consolidation near <strong>the</strong> low of <strong>the</strong> day set<br />
<strong>the</strong> previous period to 30 minutes, and<br />
<strong>the</strong> Percent Price Change filter in both<br />
<strong>the</strong> Scan Period and <strong>the</strong> Previous Period<br />
to “Greater than -.2”. Figure 7-19 shows<br />
how <strong>the</strong>se settings should be entered on<br />
<strong>the</strong> Advanced Filters page.<br />
Here is why <strong>the</strong>se settings work in this<br />
case. <strong>The</strong> duration of <strong>the</strong> consolidation<br />
period is defined by <strong>the</strong> sum of <strong>the</strong> time<br />
frames of <strong>the</strong> Scan Period (5 minutes)<br />
plus <strong>the</strong> Previous Period (30 minutes).<br />
<strong>The</strong> Percent Price Change in <strong>the</strong> Scan<br />
Period and <strong>the</strong> Previous Period combined<br />
with <strong>the</strong> “% Off High” setting defines <strong>the</strong><br />
volatility of <strong>the</strong> consolidation period. A<br />
critical nuance in <strong>the</strong>se settings is that<br />
Figure 7-19: Scan Period settings for<br />
identifying intraday consolidation<br />
<strong>The</strong> circles show <strong>the</strong> nuance of this<br />
refinement’s settings. <strong>The</strong> “% Price Change” is<br />
set to “Greater than” and with negative values<br />
in both periods.<br />
<strong>the</strong> Percent Price Change settings are set to “Greater than” followed by a negative<br />
value (-.2) as opposed to <strong>the</strong> normal HotScans setting combination of “Greater than”<br />
http://www.dataviewllc.com/ 67
followed by a positive value. <strong>The</strong>se settings limit <strong>the</strong> decline that a qualifying stock<br />
can experience during <strong>the</strong> Scan Period or Previous Period, and <strong>the</strong> “% Off High”<br />
criteria limit <strong>the</strong> advance that a qualifying stock can experience. Combined <strong>the</strong>se<br />
settings define a condition of consolidation.<br />
Remember, all <strong>the</strong> suggestions for refining <strong>the</strong> HotScans Strategies are for advanced<br />
users. <strong>The</strong>y are not required to find great trade setups. In addition, if you have a<br />
pattern that you would like HotScans to find, and require help with <strong>the</strong> filtering criteria<br />
you can send an email to info@DataViewLLC.com or call 1-888-241-3060.<br />
http://www.dataviewllc.com/ 68
Conclusion<br />
Successful traders have an edge! While it has long been argued that professional<br />
money managers have an advantage or edge because <strong>the</strong>y have more and/or better<br />
information than <strong>the</strong> individual trader, I know many very successful traders who do<br />
not have access to privileged professional-level sources of information. <strong>The</strong>y do<br />
however have an edge in <strong>the</strong> form of a winning strategy. Such a strategy provides an<br />
edge when it enables you to understand a market condition or pattern so well that you<br />
can quickly and consistently anticipate <strong>the</strong> market’s next move. This book provides<br />
you with a strategic approach to <strong>the</strong> markets that will give you this kind of an edge in<br />
your trading.<br />
Your edge consists of understanding that <strong>the</strong> <strong>Opening</strong> <strong>Range</strong> provides a real-time road<br />
map to <strong>the</strong> day’s market sentiment. Use of <strong>the</strong> OR will give you an edge because it<br />
enables you to trade with <strong>the</strong> prevailing forces of market sentiment. Now that you<br />
know that <strong>the</strong> high and <strong>the</strong> low of <strong>the</strong> OR are important reference points, study how<br />
<strong>the</strong> market reacts to <strong>the</strong>se OR price levels. This will not enable you to predict every<br />
price move, but that is not your goal as a trader. Your trading strategy should be<br />
based on being able to recognize when an OR pattern is developing, and <strong>the</strong>n trading<br />
<strong>the</strong> market move that follows.<br />
<strong>The</strong> best way to develop your edge is to focus on one or two patterns or conditions in<br />
<strong>the</strong> market. In this book I recommend <strong>the</strong> HotScans Strategy of “<strong>The</strong> 10 O’clock Bulls”<br />
as a good starting point for trading <strong>the</strong> OR. <strong>The</strong>re are two reasons for starting with<br />
this market condition. First, <strong>the</strong> basic criteria are very straightforward. This is<br />
important because it enables you to identify <strong>the</strong> best potential trading patterns quickly<br />
and easily. Also, this HotScans Strategy generates a relatively small number of trading<br />
ideas each day so that <strong>the</strong> number of stocks to be analyzed is manageable. <strong>The</strong><br />
second reason to begin with <strong>the</strong> 10 O’clock Bulls Strategy is that it focuses your<br />
attention on stocks whose OR volume (as well as <strong>the</strong> volume for <strong>the</strong> whole day) is<br />
significantly greater than <strong>the</strong> stocks’ average volume. <strong>The</strong> <strong>Opening</strong> <strong>Range</strong> approach<br />
excels in an emotionally charged environment where <strong>the</strong>re is strong bullish or bearish<br />
sentiment, and high relative volume is <strong>the</strong> best indicator that such an environment<br />
exists. Follow <strong>the</strong> volume.<br />
In <strong>the</strong> Introduction I stated that this book was written in response to <strong>the</strong> many<br />
questions I’ve received from traders looking to find winning trades. <strong>The</strong> average trader<br />
is always searching for something or someone to tell him/her which stock to buy next.<br />
This is a mistake. A more important, but rarely asked, question is, “How can I develop<br />
a winning approach to trading” If you wish to be a consistently profitable trader you<br />
must develop a winning approach to trading and your approach must have three<br />
elements: a sound trading strategy, discipline to execute your strategy, and good<br />
money management. <strong>The</strong> <strong>Opening</strong> <strong>Range</strong> trading approach discussed in this book<br />
provides you with <strong>the</strong> basis for all three elements. If you embrace <strong>the</strong> <strong>Opening</strong> <strong>Range</strong><br />
and apply <strong>the</strong>se three elements you will become a more successful trader.<br />
http://www.dataviewllc.com/ 69