Trading the Opening Range - The Swing Trading Guide
Trading the Opening Range - The Swing Trading Guide
Trading the Opening Range - The Swing Trading Guide

Create successful ePaper yourself
Turn your PDF publications into a flip-book with our unique Google optimized e-Paper software.
esistance at <strong>the</strong> high and <strong>the</strong> low of <strong>the</strong> OR. Warning – <strong>the</strong>se levels will not always<br />
exist! Your objective is to assess <strong>the</strong> situation not make it up.<br />
In evaluating <strong>the</strong> trading activity within <strong>the</strong> OR you will need to look at a chart with a<br />
time interval that is significantly smaller than <strong>the</strong> time interval of your OR. For<br />
example, if you are evaluating <strong>the</strong> 30-minute OR <strong>the</strong>n a 30- or 15-minute chart will<br />
not tell you much. I prefer to look at a 5-minute chart, but often I will go to a 1-<br />
minute chart to see what <strong>the</strong> trading action was like at <strong>the</strong> OR high or low.<br />
Just as on <strong>the</strong> daily charts, support<br />
and resistance can be characterized<br />
by lots of trading at <strong>the</strong> price level, or<br />
big volume traded at <strong>the</strong> level, or a<br />
violent reversal from <strong>the</strong> price level.<br />
An example of lots of trading at a<br />
price level would be if <strong>the</strong> stock<br />
consolidated near its OR high for 10<br />
of <strong>the</strong> 30 opening minutes. Such price<br />
action would mean that <strong>the</strong> high<br />
should be considered significant<br />
resistance. If <strong>the</strong> stock created a<br />
pattern where it rallied to <strong>the</strong> same<br />
level several times over <strong>the</strong> course of<br />
<strong>the</strong> OR period only to sell off each<br />
time, <strong>the</strong>n its high would be<br />
considered significant resistance.<br />
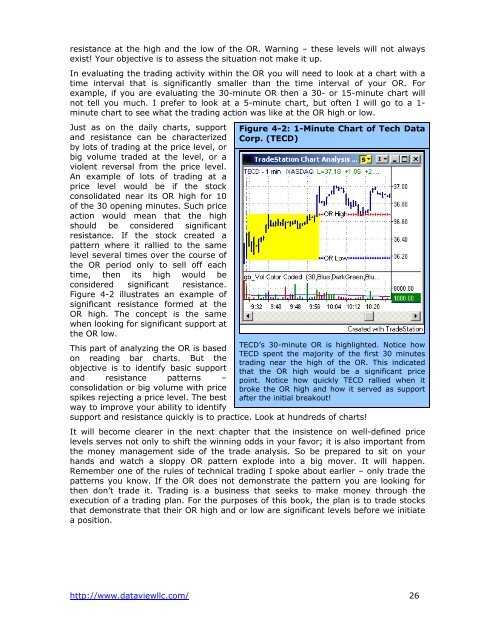
Figure 4-2 illustrates an example of<br />
significant resistance formed at <strong>the</strong><br />
OR high. <strong>The</strong> concept is <strong>the</strong> same<br />
when looking for significant support at<br />
<strong>the</strong> OR low.<br />
Figure 4-2: 1-Minute Chart of Tech Data<br />
Corp. (TECD)<br />
TECD’s 30-minute OR is highlighted. Notice how<br />
This part of analyzing <strong>the</strong> OR is based<br />
TECD spent <strong>the</strong> majority of <strong>the</strong> first 30 minutes<br />
on reading bar charts. But <strong>the</strong><br />
trading near <strong>the</strong> high of <strong>the</strong> OR. This indicated<br />
objective is to identify basic support that <strong>the</strong> OR high would be a significant price<br />
and resistance patterns – point. Notice how quickly TECD rallied when it<br />
consolidation or big volume with price broke <strong>the</strong> OR high and how it served as support<br />
spikes rejecting a price level. <strong>The</strong> best after <strong>the</strong> initial breakout!<br />
way to improve your ability to identify<br />
support and resistance quickly is to practice. Look at hundreds of charts!<br />
It will become clearer in <strong>the</strong> next chapter that <strong>the</strong> insistence on well-defined price<br />
levels serves not only to shift <strong>the</strong> winning odds in your favor; it is also important from<br />
<strong>the</strong> money management side of <strong>the</strong> trade analysis. So be prepared to sit on your<br />
hands and watch a sloppy OR pattern explode into a big mover. It will happen.<br />
Remember one of <strong>the</strong> rules of technical trading I spoke about earlier – only trade <strong>the</strong><br />
patterns you know. If <strong>the</strong> OR does not demonstrate <strong>the</strong> pattern you are looking for<br />
<strong>the</strong>n don’t trade it. <strong>Trading</strong> is a business that seeks to make money through <strong>the</strong><br />
execution of a trading plan. For <strong>the</strong> purposes of this book, <strong>the</strong> plan is to trade stocks<br />
that demonstrate that <strong>the</strong>ir OR high and or low are significant levels before we initiate<br />
a position.<br />
http://www.dataviewllc.com/ 26