GIS Worksheet 3 - Pearson Australia Media Resources
GIS Worksheet 3 - Pearson Australia Media Resources
GIS Worksheet 3 - Pearson Australia Media Resources

You also want an ePaper? Increase the reach of your titles
YUMPU automatically turns print PDFs into web optimized ePapers that Google loves.
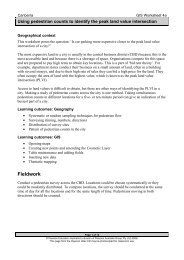
Perth <strong>GIS</strong> <strong>Worksheet</strong> 3<br />
Busking<br />
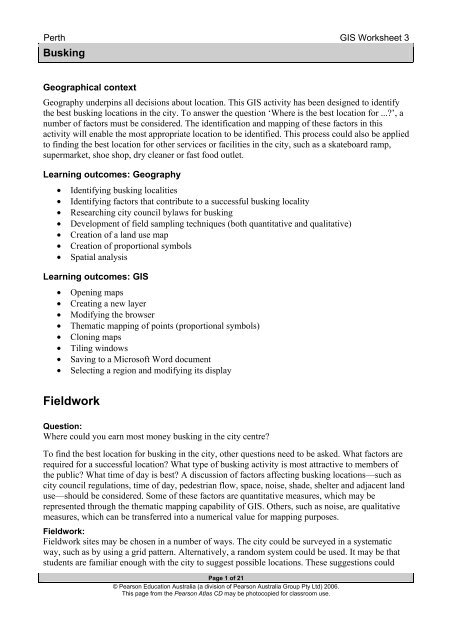
Geographical context<br />
Geography underpins all decisions about location. This <strong>GIS</strong> activity has been designed to identify<br />
the best busking locations in the city. To answer the question ‘Where is the best location for ...’, a<br />
number of factors must be considered. The identification and mapping of these factors in this<br />
activity will enable the most appropriate location to be identified. This process could also be applied<br />
to finding the best location for other services or facilities in the city, such as a skateboard ramp,<br />
supermarket, shoe shop, dry cleaner or fast food outlet.<br />
Learning outcomes: Geography<br />
• Identifying busking localities<br />
• Identifying factors that contribute to a successful busking locality<br />
• Researching city council bylaws for busking<br />
• Development of field sampling techniques (both quantitative and qualitative)<br />
• Creation of a land use map<br />
• Creation of proportional symbols<br />
• Spatial analysis<br />
Learning outcomes: <strong>GIS</strong><br />
• Opening maps<br />
• Creating a new layer<br />
• Modifying the browser<br />
• Thematic mapping of points (proportional symbols)<br />
• Cloning maps<br />
• Tiling windows<br />
• Saving to a Microsoft Word document<br />
• Selecting a region and modifying its display<br />
Fieldwork<br />
Question:<br />
Where could you earn most money busking in the city centre<br />
To find the best location for busking in the city, other questions need to be asked. What factors are<br />
required for a successful location What type of busking activity is most attractive to members of<br />
the public What time of day is best A discussion of factors affecting busking locations—such as<br />
city council regulations, time of day, pedestrian flow, space, noise, shade, shelter and adjacent land<br />
use—should be considered. Some of these factors are quantitative measures, which may be<br />
represented through the thematic mapping capability of <strong>GIS</strong>. Others, such as noise, are qualitative<br />
measures, which can be transferred into a numerical value for mapping purposes.<br />
Fieldwork:<br />
Fieldwork sites may be chosen in a number of ways. The city could be surveyed in a systematic<br />
way, such as by using a grid pattern. Alternatively, a random system could be used. It may be that<br />
students are familiar enough with the city to suggest possible locations. These suggestions could<br />
Page 1 of 21<br />
© <strong>Pearson</strong> Education <strong>Australia</strong> (a division of <strong>Pearson</strong> <strong>Australia</strong> Group Pty Ltd) 2006.<br />
This page from the <strong>Pearson</strong> Atlas CD may be photocopied for classroom use.
Perth <strong>GIS</strong> <strong>Worksheet</strong> 3<br />
Busking<br />
form the basis of a sampling program that would aim to determine which busking site is the most<br />
profitable. Through discussion, the requirements for successful busking should be established.<br />
Whatever the approach, the purpose of the activity is to visit each site and evaluate it against the<br />
established criteria.<br />
Data collection<br />
Discussion of fieldwork techniques should be undertaken. Tables are provided below to show how<br />
surrounding noise and land use could be measured. The difficulties of conducting pedestrian counts<br />
should be considered and agreement should be reached as to the length of time of each count, how<br />
to do deal with pedestrians moving in different directions and what to do about pedestrians who are<br />
stationary. For mapping purposes, a numerical value is best because it will enable the data to be<br />
thematically mapped.<br />
• Pedestrian count (per 5 minutes)<br />
• Noise level (see below)<br />
• Pavement width (metres)<br />
• Shade or sun (0 = sunshine, 1 = shade)<br />
• Seating (number of bench spaces within a 20 m radius of site)<br />
• Shelter from rain (0 = no shelter, 1 = provides shelter)<br />
• Land use (note the neighbouring land use, e.g. retail, office; see also p. 3)<br />
It may be that busking is taking place at the chosen locality while the fieldwork is taking place. In<br />
this case, the following information could be collected:<br />
• Music style (1 = Rock, 2 = Country and Western, 3 = Latin, 4 = Solo classical, 5 =<br />
Musical theatre etc. 0 = no busking taking place)<br />
• Audience size<br />
• Monies collected<br />
Measuring noise levels<br />
Score Decibels (dB) Description<br />
7 140 Deafeningly loud, e.g. jumbo jet taking off<br />
6 120 Very loud, e.g. a live pop band<br />
5 100 Loud, e.g. a heavy truck passing by<br />
4 80 Noisy, e.g. a main traffic route at a busy time<br />
3 60 Quiet, e.g. a normal conversation<br />
2 40 Very quiet, e.g. in a library<br />
1 20 Barely audible, e.g. a ticking watch<br />
Source: Holmes, D. and Warn, S. 2003, Fieldwork investigations: A Self Study Guide, Hodder Education, London.<br />
Figure 1. Measuring noise levels<br />
Page 2 of 21<br />
© <strong>Pearson</strong> Education <strong>Australia</strong> (a division of <strong>Pearson</strong> <strong>Australia</strong> Group Pty Ltd) 2006.<br />
This page from the <strong>Pearson</strong> Atlas CD may be photocopied for classroom use.
Perth <strong>GIS</strong> <strong>Worksheet</strong> 3<br />
Busking<br />
Land use classification for a central business district (CBD)<br />
Cities are complex areas. The following is a guide for central or suburban land use surveys. Land<br />
use surveys in the CBD should be for ground level use.<br />
Field<br />
map<br />
symbol<br />
Description<br />
Field<br />
map<br />
symbol<br />
Description<br />
A<br />
Major shopping units, e.g. department stores,<br />
variety stores<br />
H<br />
Car sales, e.g. saleyards, showrooms<br />
B Clothing and shoe shops J Professional services, e.g. banks, solicitors,<br />
architects, doctors, estate agents, opticians,<br />
chemists, accountants<br />
C<br />
Convenience stores, e.g. newsagent,<br />
greengrocers, food shops<br />
K<br />
Public buildings and offices, e.g. post offices,<br />
town halls, libraries, government offices,<br />
schools, police stations, churches<br />
D Furniture and carpet stores L Transport uses, e.g. car parks, bus terminals<br />
E<br />
Specialist shops, e.g. jewellers, florists, and<br />
electrical, hardware, book and sports stores<br />
M<br />
Changing uses, e.g. vacant, derelict, under<br />
construction<br />
F<br />
Personal services, e.g. hairdressers, shoe<br />
repairs, dry cleaners, travel agents<br />
N<br />
Residential uses<br />
G<br />
Catering and entertainment venues,<br />
e.g. cafes, restaurants, cinemas, hotels<br />
P<br />
Industrial uses<br />
Source: Holmes, D. and Warn, S. 2003, Fieldwork investigations: A Self Study Guide, Hodder Education, London.<br />
Figure 2. Land use classification for a CBD<br />
Sample data collected<br />
For the purposes of this activity, five sites have been identified across the city. At each site, data has<br />
been collected for pedestrian flow, noise level, space, shade, shelter and available seating. Where<br />
busking was actually taking place, the style of music, audience size and monies collected were<br />
observed and recorded. This data is shown in the following table.<br />
Site<br />
Location<br />
Pedestrian count<br />
(per 5 minutes)<br />
Noise levels<br />
(1–7; see p. 2)<br />
Pavement width<br />
(metres)<br />
Shade or sun<br />
(0 = sun, 1 = shade)<br />
Seating (no. of<br />
bench spaces)<br />
Shelter (0 = no<br />
shelter, 1 = shelter)<br />
Music style<br />
(see p. 2)<br />
Audience size<br />
(no. of people)<br />
Monies collected<br />
($)<br />
1 Hay St Mall (E) 205 3.5 8 1 4 0 2 8 5<br />
2 Hay St Mall (W) 55 3 3 1 0 1 0 0 0<br />
3 Murray St Mall (E) 225 4 10 1 28 0 3 60 20<br />
4 Murray St Mall (W) 265 5 6 0 2 0 4 4 1<br />
5 Forrest Pl (N) 140 3 2 1 0 1 1 0 3<br />
Figure 3. Sample data collection<br />
Page 3 of 21<br />
© <strong>Pearson</strong> Education <strong>Australia</strong> (a division of <strong>Pearson</strong> <strong>Australia</strong> Group Pty Ltd) 2006.<br />
This page from the <strong>Pearson</strong> Atlas CD may be photocopied for classroom use.
Perth <strong>GIS</strong> <strong>Worksheet</strong> 3<br />
Busking<br />
The data collected will be mapped at each of the chosen locations using proportional symbols. One layer will be<br />
created for each of the features. This activity will demonstrate how to map point data.<br />
Step 1: Opening a map of roads and property maps<br />
Opening the program<br />
Open MapInfo to create a new workspace. Cancel the Quick Start box if it appears.<br />
Opening the roads layer<br />
Go to File\Open, navigate to the<br />
<strong>Pearson</strong>_Atlas_<strong>GIS</strong>\WA\Data folder and open<br />
the Roads_Perth.TAB file to view a map<br />
showing roads.<br />
Using the Zoom in or Zoom out tool, change<br />
your view of the map to show the main city area.<br />
Page 4 of 21<br />
© <strong>Pearson</strong> Education <strong>Australia</strong> (a division of <strong>Pearson</strong> <strong>Australia</strong> Group Pty Ltd) 2006.<br />
This page from the <strong>Pearson</strong> Atlas CD may be photocopied for classroom use.
Perth <strong>GIS</strong> <strong>Worksheet</strong> 3<br />
Busking<br />
Open the property layer<br />
Go to File\Open and choose<br />
Property_Perth.TAB from the<br />
<strong>Pearson</strong>_Atlas_<strong>GIS</strong>\WA\Data folder.<br />
Step 2: Choosing busking locations (drawing to the Cosmetic Layer)<br />
Five places have been selected (see Figure 3). They represent the locations that students thought<br />
would be good busking locations.<br />
Activating the Drawing toolbar<br />
Go to Map\Layer Control and tick the box<br />
beneath the pencil beside the Cosmetic Layer.<br />
Press OK.<br />
The Drawing toolbar is now activated.<br />
Choosing a symbol<br />
Choose a symbol to represent busking locations<br />
using the Symbol Style tool from the Drawing<br />
toolbar.<br />
Page 5 of 21<br />
© <strong>Pearson</strong> Education <strong>Australia</strong> (a division of <strong>Pearson</strong> <strong>Australia</strong> Group Pty Ltd) 2006.<br />
This page from the <strong>Pearson</strong> Atlas CD may be photocopied for classroom use.
Perth <strong>GIS</strong> <strong>Worksheet</strong> 3<br />
Busking<br />
Choose a suitable symbol by changing font, size,<br />
and colour. A symbol at 18 point and blue has<br />
been chosen here.<br />
Press OK to return to the map.<br />
Select the Symbol tool on the Drawing toolbar<br />
and left-click the mouse on each of the chosen<br />
locations from Figure 3.<br />
Saving the Cosmetic Layer<br />
Go to Map\Save Cosmetic Objects and press<br />
Save.<br />
Name the layer Busking_sites and save into the <strong>Pearson</strong>_Atlas_<strong>GIS</strong>\WA\Workspaces folder.<br />
Step 3: Modifying the structure of the table<br />
Go to Table\Maintenance\Table Structure and<br />
choose the Busking_sites layer.<br />
Press OK.<br />
Page 6 of 21<br />
© <strong>Pearson</strong> Education <strong>Australia</strong> (a division of <strong>Pearson</strong> <strong>Australia</strong> Group Pty Ltd) 2006.<br />
This page from the <strong>Pearson</strong> Atlas CD may be photocopied for classroom use.
Perth <strong>GIS</strong> <strong>Worksheet</strong> 3<br />
Busking<br />
Click Add Field.<br />
In Name type Pedestrian_numbers and in<br />
Type select Integer.<br />
Add all fields for the information collected, i.e.<br />
noise, pavement, shade, seating, shelter, style,<br />
audience and monies.<br />
Except for noise and monies, which could be<br />
entered as Decimal fields, all fields should be<br />
Integer fields.<br />
Note: The fields for noise and monies could be decimal fields. A width of 4 would be sufficient.<br />
The final table should look like this.<br />
Press OK.<br />
Adding the busking layer to the map<br />
The map will appear but the busking sites layer<br />
has disappeared.<br />
Go to Map\Layer Control and press Add.<br />
Select the Busking_sites layer and press Add<br />
and OK.<br />
Step 4: Entering data collected into the browser table<br />
Select the Info Tool and click on a busking<br />
location to activate the Info Tool box.<br />
Page 7 of 21<br />
© <strong>Pearson</strong> Education <strong>Australia</strong> (a division of <strong>Pearson</strong> <strong>Australia</strong> Group Pty Ltd) 2006.<br />
This page from the <strong>Pearson</strong> Atlas CD may be photocopied for classroom use.
Perth <strong>GIS</strong> <strong>Worksheet</strong> 3<br />
Busking<br />
If a window similar to the one shown here<br />
appears, click on the field named Busking_sites<br />
in the Info Tool window.<br />
Enter the data for each field for Site 1 and for<br />
the rest of the sites visited. The ID field value<br />
should be the site number.<br />
Note: If the decimal data does not fit in the box, perhaps you did not create a decimal field. Go back to<br />
Table\Maintenance\Table Structure and make the adjustment.<br />
When all data has been entered go to File\Save<br />
table and select the Busking_sites layer. Press<br />
Save.<br />
Step 5: Thematically mapping the data collected (mapping point data)<br />
Using graduated symbols<br />
The data can be mapped using symbols that change in size according to the data collected, e.g.<br />
pedestrian numbers, pavement width etc. There are several different ways of doing this.<br />
Page 8 of 21<br />
© <strong>Pearson</strong> Education <strong>Australia</strong> (a division of <strong>Pearson</strong> <strong>Australia</strong> Group Pty Ltd) 2006.<br />
This page from the <strong>Pearson</strong> Atlas CD may be photocopied for classroom use.
Perth <strong>GIS</strong> <strong>Worksheet</strong> 3<br />
Busking<br />
Create Thematic Map—Step 1 of 3<br />
Go to Map\Create Thematic Map.<br />
Click on the Graduated symbol type and<br />
choose the Population template to represent the<br />
number of pedestrians.<br />
Press Next.<br />
Create Thematic Map—Step 2 of 3<br />
Select the Busking_sites table and<br />
Pedestrian_numbers field.<br />
Tick Ignore Zeroes or Blanks. Press Next.<br />
Create Thematic Map—Step 3 of 3<br />
Press OK at Step 3 of 3.<br />
Page 9 of 21<br />
© <strong>Pearson</strong> Education <strong>Australia</strong> (a division of <strong>Pearson</strong> <strong>Australia</strong> Group Pty Ltd) 2006.<br />
This page from the <strong>Pearson</strong> Atlas CD may be photocopied for classroom use.
Perth <strong>GIS</strong> <strong>Worksheet</strong> 3<br />
Busking<br />
The map appears with the legend.<br />
The legend box may be resized to<br />
avoid empty space. Use the arrow<br />
(Select) tool and adjust the size of the<br />
legend box.<br />
Modifying the legend<br />
The legend may be customised. Double-click inside the legend frame, to the right of the symbol.<br />
In the Modify Thematic Map box that appears,<br />
click on the Legend... button.<br />
Page 10 of 21<br />
© <strong>Pearson</strong> Education <strong>Australia</strong> (a division of <strong>Pearson</strong> <strong>Australia</strong> Group Pty Ltd) 2006.<br />
This page from the <strong>Pearson</strong> Atlas CD may be photocopied for classroom use.
Perth <strong>GIS</strong> <strong>Worksheet</strong> 3<br />
Busking<br />
Modify the legend as shown.<br />
The legend title may be customised to read<br />
‘Number of pedestrians’.<br />
Press OK twice to return to the map.<br />
The legend may have red dots over it, indicating<br />
that it has been selected. Click once on the white<br />
space in the legend to unselect it.<br />
The map should now look like this.<br />
Step 6: Creating more thematic maps using the Ranges box options<br />
Create Thematic Map—Step 1 of 3<br />
Make sure the map window is active by clicking<br />
on the bar at the top of the map.<br />
Go to Map\Create Thematic map and click on<br />
the type Ranges in the top left-hand corner.<br />
Choose Point Ranges Default from the<br />
Template Name list. Click Next.<br />
Page 11 of 21<br />
© <strong>Pearson</strong> Education <strong>Australia</strong> (a division of <strong>Pearson</strong> <strong>Australia</strong> Group Pty Ltd) 2006.<br />
This page from the <strong>Pearson</strong> Atlas CD may be photocopied for classroom use.
Perth <strong>GIS</strong> <strong>Worksheet</strong> 3<br />
Busking<br />
Create Thematic Map—Step 2 of 3<br />
Choose the Busking_sites table and change the<br />
field to Pavement.<br />
Tick Ignore Zeroes or Blanks and press Next.<br />
Create Thematic Map—Step 3 of 3<br />
The stars may be changed to an appropriate<br />
symbol by clicking on the Styles box. Then<br />
choose the symbol, its colour and size.<br />
By clicking on the Size button at the top of<br />
Customise Range Styles the size of each<br />
symbol will change.<br />
Then by clicking on a symbol underneath Styles,<br />
a new symbol style may be chosen.<br />
Page 12 of 21<br />
© <strong>Pearson</strong> Education <strong>Australia</strong> (a division of <strong>Pearson</strong> <strong>Australia</strong> Group Pty Ltd) 2006.<br />
This page from the <strong>Pearson</strong> Atlas CD may be photocopied for classroom use.
Perth <strong>GIS</strong> <strong>Worksheet</strong> 3<br />
Busking<br />
Change the symbol style properties to match<br />
those shown here.<br />
Press OK.<br />
Press OK again in the Customise Range Styles<br />
box to confirm the new symbol.<br />
Page 13 of 21<br />
© <strong>Pearson</strong> Education <strong>Australia</strong> (a division of <strong>Pearson</strong> <strong>Australia</strong> Group Pty Ltd) 2006.<br />
This page from the <strong>Pearson</strong> Atlas CD may be photocopied for classroom use.
Perth <strong>GIS</strong> <strong>Worksheet</strong> 3<br />
Busking<br />
After Create Thematic Map—Step 3 of 3, the<br />
legend will look like this. Press OK.<br />
The two layers are now shown on the<br />
map. Both of these layers are visible<br />
in<br />
the legend.<br />
Page 14 of 21<br />
© <strong>Pearson</strong> Education <strong>Australia</strong> (a division of <strong>Pearson</strong> <strong>Australia</strong> Group Pty Ltd) 2006.<br />
This page from the <strong>Pearson</strong> Atlas CD may be photocopied for classroom use.
Perth <strong>GIS</strong> <strong>Worksheet</strong> 3<br />
Busking<br />
Other layers may be created.<br />
For example, this map also shows the<br />
noise levels at each location. This<br />
extra layer was created by following<br />
the steps outlined above.<br />
The map should now contain several layers that show the values for each of the mapped criteria.<br />
Since the different categories of point data sit directly on top of each other, however, this is too<br />
confusing. There are several ways of simplifying the view so that it is easier to interpret the map.<br />
Map layers may be turned on or off using Map\Layer Control or maps may be cloned to produce<br />
several maps on which layers may be turned on or off.<br />
Step 7: Cloning maps<br />
Go to Map\Clone View.<br />
A new window containing a clone of the map<br />
will appear.<br />
Page 15 of 21<br />
© <strong>Pearson</strong> Education <strong>Australia</strong> (a division of <strong>Pearson</strong> <strong>Australia</strong> Group Pty Ltd) 2006.<br />
This page from the <strong>Pearson</strong> Atlas CD may be photocopied for classroom use.
Perth <strong>GIS</strong> <strong>Worksheet</strong> 3<br />
Busking<br />
With the Map:2 window active, in Map\Layer<br />
Control remove some layers by un-ticking the<br />
Visibility (eye) boxes. Press OK.<br />
For example, the first map could show<br />
pedestrian numbers, the second, pavement<br />
width, the third, noise levels, etc.<br />
Step 8: Tiling windows<br />
To view all of the maps at one time,<br />
go to Windows\Tile Windows.<br />
Step 9: Saving the Workspace<br />
Go to File\Save Workspace and save into the<br />
<strong>Pearson</strong>_Atlas_<strong>GIS</strong>\WA\Workspaces folder.<br />
Page 16 of 21<br />
© <strong>Pearson</strong> Education <strong>Australia</strong> (a division of <strong>Pearson</strong> <strong>Australia</strong> Group Pty Ltd) 2006.<br />
This page from the <strong>Pearson</strong> Atlas CD may be photocopied for classroom use.
Perth <strong>GIS</strong> <strong>Worksheet</strong> 3<br />
Busking<br />
Step 10: Saving a map window for a Microsoft Word document<br />
It may be that you prefer to save individual maps into a Word document to incorporate into a<br />
report. The following instructions will explain how to do this.<br />
Go to File\Save Window as and type in a<br />
suitable name. In the Save as type box choose<br />
JPEG File Interchange Format (*.jpg) from<br />
the drop-down box and then save this in the<br />
<strong>Pearson</strong>_Atlas_<strong>GIS</strong>\WA\Images folder.<br />
The image size may be adjusted before saving.<br />
Press Save.<br />
Step 11: Creating a land use map<br />
Land use may be a factor in explaining pedestrian flows and hence in the choice of the best busking<br />
locality. Using the property layer, the land use close to each sample site could be observed and then<br />
mapped.<br />
Making a selection from the property layer<br />
Zoom in on each site using the Zoom in tool<br />
from the Main toolbar.<br />
Use the arrow (Select) tool from the Main<br />
toolbar.<br />
With the shift key depressed to enable selection of multiple blocks, click on each of the individual<br />
property blocks of the same type of land use (observed during the excursion). This selection can<br />
now be saved and coloured to identify its land use type.<br />
Page 17 of 21<br />
© <strong>Pearson</strong> Education <strong>Australia</strong> (a division of <strong>Pearson</strong> <strong>Australia</strong> Group Pty Ltd) 2006.<br />
This page from the <strong>Pearson</strong> Atlas CD may be photocopied for classroom use.
Perth <strong>GIS</strong> <strong>Worksheet</strong> 3<br />
Busking<br />
The example here recognises that the land use in<br />
the adjacent blocks belongs to category ‘A’ in<br />
Figure 2, e.g. department stores.<br />
Saving a copy of the selection<br />
Go to File\Save Copy As and choose Selection.<br />
Press Save As.<br />
Name the new layer Department_stores and<br />
save it into the Workspaces folder.<br />
Page 18 of 21<br />
© <strong>Pearson</strong> Education <strong>Australia</strong> (a division of <strong>Pearson</strong> <strong>Australia</strong> Group Pty Ltd) 2006.<br />
This page from the <strong>Pearson</strong> Atlas CD may be photocopied for classroom use.
Perth <strong>GIS</strong> <strong>Worksheet</strong> 3<br />
Busking<br />
Adding a new layer to the map<br />
Go to File\Open and open the<br />
Department_stores.TAB file that was just<br />
saved into the Workspaces folder.<br />
The Department_stores layer has now been<br />
added to the map.<br />
Adjusting the display<br />
To change the colour for the Department_store<br />
layer, go to Map\Layer Control, and doubleclick<br />
on Department_stores to get the<br />
Department_stores Display Options box.<br />
Tick Style Override and then click on the box<br />
beneath the tick.<br />
Page 19 of 21<br />
© <strong>Pearson</strong> Education <strong>Australia</strong> (a division of <strong>Pearson</strong> <strong>Australia</strong> Group Pty Ltd) 2006.<br />
This page from the <strong>Pearson</strong> Atlas CD may be photocopied for classroom use.
Perth <strong>GIS</strong> <strong>Worksheet</strong> 3<br />
Busking<br />
In the Region Style box, select a Pattern and<br />
Colour.<br />
Once these have been selected, press OK in this<br />
and the next two boxes to return to the map.<br />
The map now shows area data (land use) with<br />
point data (pedestrian numbers) sitting above it.<br />
Always place point data above area data.<br />
Repeat these steps to apply different colours for<br />
each of the other land use types.<br />
Additional Tasks<br />
Geographical Task 1<br />
Describe and explain which parts of the city have the highest pedestrian flow.<br />
Geographical Task 2<br />
• Research the regulations for busking published by the city council.<br />
• Select the three most important guidelines. Justify your choice.<br />
• Has the council established areas where no busking is allowed<br />
• Explain why the council has chosen these areas.<br />
Page 20 of 21<br />
© <strong>Pearson</strong> Education <strong>Australia</strong> (a division of <strong>Pearson</strong> <strong>Australia</strong> Group Pty Ltd) 2006.<br />
This page from the <strong>Pearson</strong> Atlas CD may be photocopied for classroom use.
Perth <strong>GIS</strong> <strong>Worksheet</strong> 3<br />
Busking<br />
Geographical Task 3<br />
• Select the three most important criteria for a busking location.<br />
• Rank the sampled sites against these three criteria.<br />
• Using a map for each criterion and your ranking, identify the best busking location.<br />
• Write a short justification of your choice.<br />
Geographical Task 4<br />
Write a short report describing how land use influences the quality of a busking location.<br />
Geographical Task 5<br />
Look at each map to help answer this question: ‘Which site makes the best busking location’ Write<br />
a report once you have conducted the fieldwork. Include the following sections:<br />
• Research question<br />
• Methods of data collection<br />
• Data presentation<br />
• Data analysis<br />
• Conclusion<br />
• Evaluation<br />
Creative Task 6<br />
Create a piece of music or theatre that would attract members of the public.<br />
Page 21 of 21<br />
© <strong>Pearson</strong> Education <strong>Australia</strong> (a division of <strong>Pearson</strong> <strong>Australia</strong> Group Pty Ltd) 2006.<br />
This page from the <strong>Pearson</strong> Atlas CD may be photocopied for classroom use.