

Deep_Water
Deep_Water
Deep_Water

You also want an ePaper? Increase the reach of your titles
YUMPU automatically turns print PDFs into web optimized ePapers that Google loves.
1.1 Offshore wind<br />
market - 2012<br />
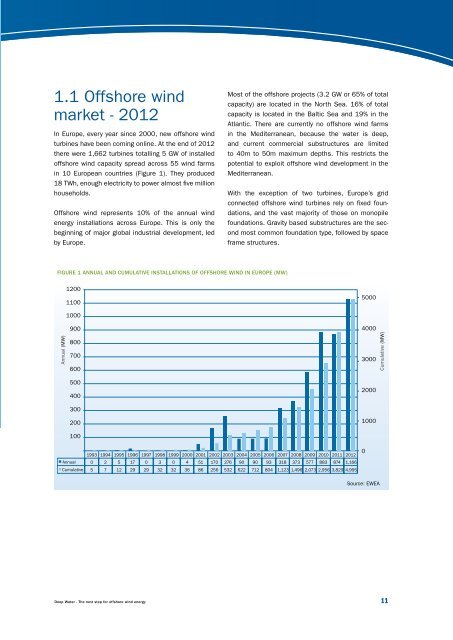
In Europe, every year since 2000, new offshore wind<br />
turbines have been coming online. At the end of 2012<br />
there were 1,662 turbines totalling 5 GW of installed<br />
offshore wind capacity spread across 55 wind farms<br />
in 10 European countries (Figure 1). They produced<br />
18 TWh, enough electricity to power almost five million<br />
households.<br />
Offshore wind represents 10% of the annual wind<br />
energy installations across Europe. This is only the<br />
beginning of major global industrial development, led<br />
by Europe.<br />
Most of the offshore projects (3.2 GW or 65% of total<br />
capacity) are located in the North Sea. 16% of total<br />
capacity is located in the Baltic Sea and 19% in the<br />
Atlantic. There are currently no offshore wind farms<br />
in the Mediterranean, because the water is deep,<br />
and current commercial substructures are limited<br />
to 40m to 50m maximum depths. This restricts the<br />
potential to exploit offshore wind development in the<br />
Mediterranean.<br />
With the exception of two turbines, Europe’s grid<br />
connected offshore wind turbines rely on fixed foundations,<br />
and the vast majority of those on monopile<br />
foundations. Gravity based substructures are the second<br />
most common foundation type, followed by space<br />
frame structures.<br />
Figure 1 Annual and cumulative installations of offshore wind in Europe (MW)<br />
1200<br />
1100<br />
5000<br />
1000<br />
Annual (MW)<br />
900<br />
800<br />
700<br />
600<br />
500<br />
400<br />
300<br />
200<br />
100<br />
4000<br />
3000<br />
2000<br />
1000<br />
Cumulative (MW)<br />
<br />
1993 1994 1995 1996 1997 1998 1999 2000 2001 2002 2003 2004 2005 2006 2007 2008 2009 2010 2011 2012<br />
0<br />
Annual 0 2 5 17 0 3 0 4 51 170 276 90 90 93 318 373 577 883 874 1,166<br />
Cumulative 5 7 12 29 29 32 32 36 86 256 532 622 712 804 1,123 1,496 2,073 2,956 3,829 4,995<br />
Source: EWEA<br />
<strong>Deep</strong> <strong>Water</strong> - The next step for offshore wind energy 11