UCCE Statewide Processing Tomato Variety ... - Merced County
UCCE Statewide Processing Tomato Variety ... - Merced County
UCCE Statewide Processing Tomato Variety ... - Merced County

You also want an ePaper? Increase the reach of your titles
YUMPU automatically turns print PDFs into web optimized ePapers that Google loves.
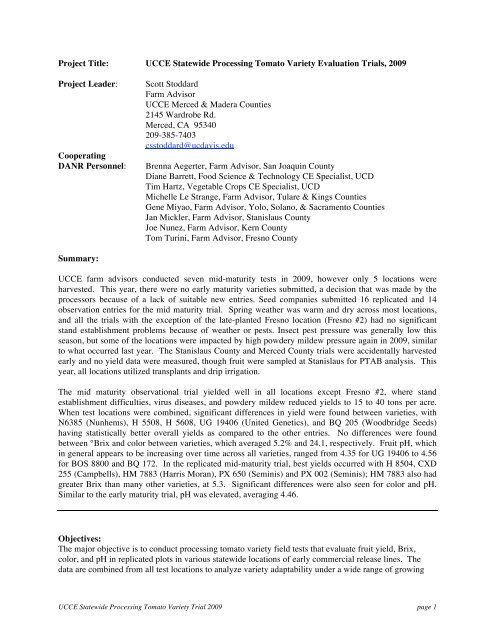
Project Title: <strong>UCCE</strong> <strong>Statewide</strong> <strong>Processing</strong> <strong>Tomato</strong> <strong>Variety</strong> Evaluation Trials, 2009<br />
Project Leader:<br />
Cooperating<br />
DANR Personnel:<br />
Scott Stoddard<br />
Farm Advisor<br />
<strong>UCCE</strong> <strong>Merced</strong> & Madera Counties<br />
2145 Wardrobe Rd.<br />
<strong>Merced</strong>, CA 95340<br />
209-385-7403<br />
csstoddard@ucdavis.edu<br />
Brenna Aegerter, Farm Advisor, San Joaquin <strong>County</strong><br />
Diane Barrett, Food Science & Technology CE Specialist, UCD<br />
Tim Hartz, Vegetable Crops CE Specialist, UCD<br />
Michelle Le Strange, Farm Advisor, Tulare & Kings Counties<br />
Gene Miyao, Farm Advisor, Yolo, Solano, & Sacramento Counties<br />
Jan Mickler, Farm Advisor, Stanislaus <strong>County</strong><br />
Joe Nunez, Farm Advisor, Kern <strong>County</strong><br />
Tom Turini, Farm Advisor, Fresno <strong>County</strong><br />
Summary:<br />
<strong>UCCE</strong> farm advisors conducted seven mid-maturity tests in 2009, however only 5 locations were<br />
harvested. This year, there were no early maturity varieties submitted, a decision that was made by the<br />
processors because of a lack of suitable new entries. Seed companies submitted 16 replicated and 14<br />
observation entries for the mid maturity trial. Spring weather was warm and dry across most locations,<br />
and all the trials with the exception of the late-planted Fresno location (Fresno #2) had no significant<br />
stand establishment problems because of weather or pests. Insect pest pressure was generally low this<br />
season, but some of the locations were impacted by high powdery mildew pressure again in 2009, similar<br />
to what occurred last year. The Stanislaus <strong>County</strong> and <strong>Merced</strong> <strong>County</strong> trials were accidentally harvested<br />
early and no yield data were measured, though fruit were sampled at Stanislaus for PTAB analysis. This<br />
year, all locations utilized transplants and drip irrigation.<br />
The mid maturity observational trial yielded well in all locations except Fresno #2, where stand<br />
establishment difficulties, virus diseases, and powdery mildew reduced yields to 15 to 40 tons per acre.<br />
When test locations were combined, significant differences in yield were found between varieties, with<br />
N6385 (Nunhems), H 5508, H 5608, UG 19406 (United Genetics), and BQ 205 (Woodbridge Seeds)<br />
having statistically better overall yields as compared to the other entries. No differences were found<br />
between °Brix and color between varieties, which averaged 5.2% and 24.1, respectively. Fruit pH, which<br />
in general appears to be increasing over time across all varieties, ranged from 4.35 for UG 19406 to 4.56<br />
for BOS 8800 and BQ 172. In the replicated mid-maturity trial, best yields occurred with H 8504, CXD<br />
255 (Campbells), HM 7883 (Harris Moran), PX 650 (Seminis) and PX 002 (Seminis); HM 7883 also had<br />
greater Brix than many other varieties, at 5.3. Significant differences were also seen for color and pH.<br />
Similar to the early maturity trial, pH was elevated, averaging 4.46.<br />
Objectives:<br />
The major objective is to conduct processing tomato variety field tests that evaluate fruit yield, Brix,<br />
color, and pH in replicated plots in various statewide locations of early commercial release lines. The<br />
data are combined from all test locations to analyze variety adaptability under a wide range of growing<br />
<strong>UCCE</strong> <strong>Statewide</strong> <strong>Processing</strong> <strong>Tomato</strong> <strong>Variety</strong> Trial 2009 page 1
conditions. These tests are designed and conducted with input from seed companies, processors, and<br />
other allied industry and are intended to generate unbiased, third-party information to assist in making<br />
variety choice decisions.<br />
Procedures:<br />
Seven (7) mid-maturity tests were conducted in 2009. Participating counties and Farm Advisors are<br />
shown in Table 1. <strong>Variety</strong> entries and their disease resistances are listed in Table 2. No early-maturity<br />
trial was conducted this year because of a lack of entries. <strong>Variety</strong> selections were made in the fall of 2008<br />
based on input from tomato processors. Changes and/or additions were made by the seed companies<br />
based on seed availability.<br />
Test locations were transplanted from late March (Kern Co) through May 22 (Fresno #2). New varieties<br />
were usually screened one of more years in non-replicated observational trials before being selected for<br />
testing in the replicated trials. Tests were primarily conducted in commercial production fields with<br />
grower cooperators (the Fresno trials were located at the UC West Side Research and Extension Center<br />
(WSREC) near Five Points).<br />
Each variety was planted in a one-bed by 100-foot long plot. Plot design was a randomized complete<br />
block with four replications for the replicated trial. The observational trial consisted of one nonreplicated<br />
plot directly adjacent to the replicated trial. The Farm Advisor organized transplanting at the<br />
same time that the rest of the field was planted. All cultural operations, with the exception of planting<br />
and harvest, were done by the grower cooperator using the same equipment and techniques as the rest of<br />
the field. All test locations used transplants, and five locations this year were drip irrigated (<strong>Merced</strong>,<br />
Stanislaus, San Joaquin, Kern, and Yolo). A field day or arrangements for interested persons to visit the<br />
plots occurred at most locations. Farm Advisors were also responsible for taking soil samples and<br />
documenting growth and development.<br />
Shortly before or during harvest, fruit samples were collected from all plots and submitted to an area<br />
PTAB station for soluble solids (reported as °Brix, an estimate of the soluble solids percentage using a<br />
refractometer), color (LED color), and pH determinations. These samples were hand picked ripe fruit<br />
directly off the plants or the harvester. The tomatoes in each plot were harvested with commercial harvest<br />
equipment, conveyed to a GT wagon equipped with weigh cells, and weighed before going to the trailers<br />
for processing.<br />
Data were analyzed using analysis of variance procedures with SAS, both for each individual location and<br />
combining locations. In the combined analysis, the block effect was nested within each county.<br />
Significant difference tests were performed using Fisher’s protected LSD at the 5% level. Stanislaus<br />
<strong>County</strong> had no yield data for the over-location analysis, however, PTAB data were included. <strong>Merced</strong><br />
yield and PTAB results were not available. Occasional missing plots occurred in the other trial locations,<br />
resulting in an unbalanced design and variable LSD values depending on what was being compared.<br />
Results:<br />
Results are presented in the following order and include combined county, yield, °Brix, color, and pH for<br />
each trial: mid-maturity observational (Table 3 a – f), and mid-maturity replicated (Table 4 a – e).<br />
Mid observational. Mid-maturity observational results combining all locations are shown in Table 3a,<br />
and individual counties in Tables 3 b – e. Stanislaus <strong>County</strong> PTAB data are shown, but not yields.<br />
Because of missing plots at some locations, multiple LSD values were calculated to compare varieties and<br />
are shown below each table as appropriate. When all counties were combined, significant differences<br />
were found among varieties only for yield and pH (Table 3a). Even with relatively high variability (CV<br />
<strong>UCCE</strong> <strong>Statewide</strong> <strong>Processing</strong> <strong>Tomato</strong> <strong>Variety</strong> Trial 2009 page 2
14.0%), significantly best yields occurred with Nunhems N 6385, Heinz H 5508, H 5608, United<br />
Genetics UG 19406, and Woodbridge Seeds BQ 205, which all yielded more than 50 tons per acre. °Brix<br />
and color were slightly better this year than 2008, at 5.2 and 24.1, but there were no significant<br />
differences between varieties when location data were combined. Fruit pH was again elevated, and<br />
ranged from 4.35 to 4.56 (Table 4e). Because there was no replication in this test, variety by location<br />
interactions could not be performed.<br />
A significant negative relationship was observed this year between Brix and yield for the observation<br />
lines (Figure 1): soluble solids decreased as yield increased, as would be expected.<br />
Mid replicated. Mid-maturity replicated variety results combining all locations are shown in Table 4a,<br />
and individual counties in Tables 4 b – e. Stanislaus PTAB data were collected, but not yields.<br />
Using combined data, significant differences were found for all parameters measured, though Fresno #1<br />
trial did not have significant differences for Brix or pH. Averaged across all locations, significantly best<br />
yields occurred with H8504, CXD 255, HM 7883, PX 650, and PX 002 at ≥ 50 tons per acre. Yields were<br />
much better in the Yolo trial than the other locations, averaging 64 tons/A.<br />
Significant differences were observed for Brix in the combined data and individual location data with the<br />
exception of Fresno #1, but overall there was little spread between the variety with the best average<br />
soluble solids (HM 6898, 5.5) and the least (CXD 282, 4.9). HM 7883 had both yield and °Brix that were<br />
in the top 5. Unlike for the observation trial, there was very little relationship between average yield and<br />
fruit soluble solids (Figure 2).<br />
H4007 and PX 002 had the best fruit color with LED ratings of 22.5 and 23.3, respectively (Table 4 d).<br />
Fruit pH ranged from 4.38 to 4.56 (Table 4e), with HM 6898, H8504, H9780, and AB2 and having<br />
significantly lowest pH. These varieties also had better pH results in 2008.<br />
Significant variety by location interactions occurred for yield, °Brix, color, and pH. This indicates that<br />
certain varieties performed differently at different locations. AB2, for example, yielded much better in<br />
Yolo compared to the other locations.<br />
Acknowledgements:<br />
Many thanks to CTRI and participating processors and seed companies for their continued support for this<br />
project. The cooperation from PTAB and support of the processors is also greatly appreciated. Many<br />
thanks to Gail Nishimoto for her help with the statistical analyses. And lastly, this project would not be<br />
possible without the many excellent grower cooperators who were involved with this project.<br />
<strong>UCCE</strong> <strong>Statewide</strong> <strong>Processing</strong> <strong>Tomato</strong> <strong>Variety</strong> Trial 2009 page 3
Table 1. 2009 <strong>UCCE</strong> mid-maturity processing tomato variety trial locations.<br />
Advisor<br />
Trial<br />
Gene Miyao, Yolo Co. Transplant April 24, drip irrigation. Good stand, good vine<br />
growth, Verticillium wilt pressure, double row. Cooperator: JH<br />
Meek and Sons. Harvest Aug 28.<br />
Brenna Aegerter, San<br />
Joaquin <strong>County</strong><br />
Transplant May 8, drip irrigation. No stand problems this year.<br />
Cooperator: Hal Robertson. Harvest Sept 30.<br />
Jan Mickler, Stanislaus<br />
<strong>County</strong><br />
Transplant May 15, drip irrigation. Single row. Cooperator:<br />
Leroy Deldon. Fruit samples September 20, no harvest.<br />
Scott Stoddard, <strong>Merced</strong><br />
<strong>County</strong><br />
Michelle Le Strange, Tom<br />
Turini Fresno <strong>County</strong> 1<br />
Michelle Le Strange, Tom<br />
Turini Fresno <strong>County</strong> 2<br />
Joe Nunez, Kern <strong>County</strong><br />
Transplant May 11, drip irrigation. Single row. Good stand,<br />
good vine growth. Cooperator: A-Bar Ranch. No harvest, no<br />
PTAB samples.<br />
Transplant May 1, sprinkler irrigation to set plants, drip<br />
thereafter. Single row, 66” beds. Powdery mildew pressure in<br />
August. WSREC. Harvest Sept 1.<br />
Transplant May 22, sprinkler irrigation to set plants, drip<br />
thereafter. Establishment and disease and insect problems,<br />
especially powdery mildew. Single row 66” beds. WSREC.<br />
Harvest Sept 22.<br />
Transplant March 31, single row, drip irrigation. Cooperator:<br />
Stenderup Farms. Harvest Aug 10. Not all observation lines<br />
planted because of lack of space.<br />
<strong>UCCE</strong> <strong>Statewide</strong> <strong>Processing</strong> <strong>Tomato</strong> <strong>Variety</strong> Trial 2009 page 4
<strong>UCCE</strong> <strong>Statewide</strong> <strong>Processing</strong> <strong>Tomato</strong> <strong>Variety</strong> Trial 2009 page 5
Figure 1. Relationship between tomato fruit yield and soluble solids for the varieties in the<br />
observation trial. Each point is the mean of 5 or 6 locations.<br />
Figure 2. Relationship between tomato fruit yield and soluble solids for the varieties in the<br />
replicated trial. Each point is the mean of 20 – 24 data points.<br />
<strong>UCCE</strong> <strong>Statewide</strong> <strong>Processing</strong> <strong>Tomato</strong> <strong>Variety</strong> Trial 2009 page 6
Numbers in parentheses ( x ) represent relative ranking within a column.<br />
LSD = Least significant difference at the 95% confidence level. Means followed by the same letter are not<br />
significantly different. NS = not significant.<br />
CV = coefficient of variation (%), a measure of the variability in the experiment.<br />
<strong>Variety</strong> x location LSD = LSD when comparing varieties across locations.<br />
<strong>UCCE</strong> <strong>Statewide</strong> <strong>Processing</strong> <strong>Tomato</strong> <strong>Variety</strong> Trial 2009 page 7
Observation varieties were not replicated so the statistical analysis could be performed on the combined data only.<br />
<strong>UCCE</strong> <strong>Statewide</strong> <strong>Processing</strong> <strong>Tomato</strong> <strong>Variety</strong> Trial 2009 page 8
Observation varieties were not replicated so the statistical analysis could be performed on the combined data only.<br />
<strong>UCCE</strong> <strong>Statewide</strong> <strong>Processing</strong> <strong>Tomato</strong> <strong>Variety</strong> Trial 2009 page 9
Observation varieties were not replicated so the statistical analysis could be performed on the combined data only.<br />
<strong>UCCE</strong> <strong>Statewide</strong> <strong>Processing</strong> <strong>Tomato</strong> <strong>Variety</strong> Trial 2009 page 10
LSD = Least significant difference at the 95% confidence level. Means followed by the same letter are not<br />
significantly different.<br />
NS = not significant.<br />
CV = coefficient of variation (%), a measure of the variability in the experiment.<br />
<strong>Variety</strong> x location LSD = LSD when comparing varieties across locations.<br />
<strong>UCCE</strong> <strong>Statewide</strong> <strong>Processing</strong> <strong>Tomato</strong> <strong>Variety</strong> Trial 2009 page 11
<strong>UCCE</strong> <strong>Statewide</strong> <strong>Processing</strong> <strong>Tomato</strong> <strong>Variety</strong> Trial 2009 page 12
<strong>UCCE</strong> <strong>Statewide</strong> <strong>Processing</strong> <strong>Tomato</strong> <strong>Variety</strong> Trial 2009 page 13
<strong>UCCE</strong> <strong>Statewide</strong> <strong>Processing</strong> <strong>Tomato</strong> <strong>Variety</strong> Trial 2009 page 14
<strong>UCCE</strong> <strong>Statewide</strong> <strong>Processing</strong> <strong>Tomato</strong> <strong>Variety</strong> Trial 2009 page 15