Detection of Extra Virgin Olive Oil Adulteration with - Department of ...
Detection of Extra Virgin Olive Oil Adulteration with - Department of ...
Detection of Extra Virgin Olive Oil Adulteration with - Department of ...

You also want an ePaper? Increase the reach of your titles
YUMPU automatically turns print PDFs into web optimized ePapers that Google loves.
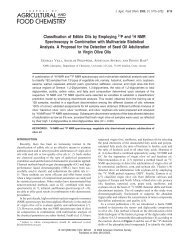
<strong>Detection</strong> <strong>of</strong> <strong>Extra</strong> <strong>Virgin</strong> <strong>Olive</strong> <strong>Oil</strong> <strong>Adulteration</strong> J. Agric. Food Chem., Vol. 53, No. 8, 2005 2815<br />
Table 4. Discriminant Analysis: Raw Coefficients, Wilk’s λ Values,<br />
and Tolerance Levels for Each Variable Used for the Classification <strong>of</strong><br />
Four Grades <strong>of</strong> <strong>Olive</strong> <strong>Oil</strong>s<br />
variable root 1 root 2 Wilk’s λ<br />
tolerance<br />
level<br />
1,3-DGs 3.727 −0.026 0.000446 0.0474<br />
TDGs −2.605 −0.511 0.000459 0.0506<br />
D 48.509 −2.765 0.000638 0.4588<br />
log <strong>of</strong> acidity 1.907 5.638 0.001134 0.5598<br />
TDGs−FFA −0.335 −0.069 0.000344 0.6429<br />
constants −29.471 6.70<br />
eigenvalues 152.923 19.01<br />
Table 5. Squared Mahalanobis Distances <strong>of</strong> Adulterated EVOO<br />
Samples from <strong>Olive</strong> <strong>Oil</strong> Centroid<br />
adulterant<br />
1% 3% 5% 10% 15% 20% 35% 50% 65% 80%<br />
ROO a 0.6 3.7 12.3 61.3 102.2 128.0 304.8 394.5<br />
ROO b 3.7 5.2 14.2 38.6 64.24 99.5 217.1 349.9 452.0 576.6<br />
LOO c 3.6 5.5 9.7 26.2 57.61 99.4<br />
a First set <strong>of</strong> mixtures (1−50%) <strong>of</strong> EVOO <strong>with</strong> ROO. b Second set <strong>of</strong> mixtures<br />
(1−80%) <strong>of</strong> EVOO <strong>with</strong> ROO. c Set <strong>of</strong> mixtures (1−20%) <strong>of</strong> EVOO <strong>with</strong> LOO.<br />
respective group <strong>of</strong> ROO and LOO depending on the amount<br />
<strong>of</strong> the latter oils in the mixtures. The first set <strong>of</strong> mixtures<br />
containing the lowest amount <strong>of</strong> adulterant ROO in EVOO (1%)<br />
falls inside the 95% ellipse <strong>of</strong> EVOO, whereas the second set<br />
<strong>of</strong> mixtures <strong>with</strong> the same concentration <strong>of</strong> adulterant lies in<br />
the border <strong>of</strong> the ellipse <strong>of</strong> EVOO (Figure 3). The adulterated<br />
EVOO <strong>with</strong> LOO show higher detection limits, because only<br />
the 5% mixture is outside the 95% ellipse <strong>of</strong> EVOO group,<br />
A more accurate means to detect adulteration is the Mahalanobis<br />
distance, which measures the distances between each<br />
point and the group centroid. The calculated Mahalanobis<br />
distances for mixtures (Table 5) are to be compared <strong>with</strong> the<br />
Mahalanobis distance <strong>of</strong> EVOO samples from the centroid <strong>of</strong><br />
their own group. Apart from 2 EVOO samples <strong>of</strong> 34 <strong>with</strong><br />
Mahalanobis distances 6.7 and 5.3, all other EVOO samples<br />
are characterized by distances lower than those calculated for<br />
the EVOO <strong>with</strong> 5% <strong>of</strong> ROO and EVOO adulterated <strong>with</strong> 5%<br />
LOO. These data clearly show that the minimum amounts <strong>of</strong><br />
ROO and LOO that can be detected by using the present<br />
methodology are 5%.<br />
Although application <strong>of</strong> DA to adulteration studies does not<br />
lead to precise quantitative conclusions, the almost linear array<br />
<strong>of</strong> the adulterated EVOO samples in the plot <strong>of</strong> Figure 3 may<br />
allow a semiquantitative estimation <strong>of</strong> the proportion <strong>of</strong> added<br />
foreign oil. First, we prepared mixtures <strong>of</strong> EVOO <strong>with</strong> ROO<br />
<strong>of</strong> known composition (60, 65, 70, 75, and 80%) using different<br />
EVOO samples not included in the previous statistical treatment<br />
(see Table 3 and footnote). These samples, used as blank tests,<br />
were treated as unknowns using the model obtained by the<br />
training set <strong>of</strong> 59 oils. As shown in Figure 3, these mixtures<br />
indicated by arrows are lying close to the array <strong>of</strong> the adulterated<br />
EVOO <strong>with</strong> ROO used in the statistical analysis at positions<br />
depending on the amount <strong>of</strong> the added ROO. The Mahalanobis<br />
distances for 65% (436.4) and 80% (586.4) adulteration agree<br />
closely <strong>with</strong> those reported for the corresponding values <strong>of</strong> the<br />
mixtures in the array <strong>with</strong> the same composition (Table 5). Next,<br />
we consider real oils represented by six blended olive oils (BOO)<br />
consisting <strong>of</strong> refined olive oil and virgin olive oil and purchased<br />
from supermarkets in an attempt to estimate the percent<br />
concentration <strong>of</strong> ROO in these commercial products. These<br />
samples were treated again as unknowns using the model<br />
obtained by the training set <strong>of</strong> the 59 oil samples (Figure 3).<br />
The observed deviations <strong>of</strong> the commercial oils from the arrays<br />
is justified by the fact that the EVOO and ROO samples used<br />
to prepare these oils are characterized by different compositions<br />
<strong>of</strong> diglycerides and acidity. However, their compositions can<br />
be estimated on the basis <strong>of</strong> the calculated Mahalanobis distances<br />
from the centroid <strong>of</strong> the group <strong>of</strong> EVOO samples, which are to<br />
be compared <strong>with</strong> the corresponding distances <strong>of</strong> all the artificial<br />
mixtures in Figure 3. Two <strong>of</strong> the six BOO samples (1 and 5)<br />
show Mahalanobis distances <strong>of</strong> 286.03 and 323.45, respectively,<br />
which are <strong>with</strong>in the respective distances <strong>of</strong> the adulterated<br />
EVOO samples <strong>with</strong> 35 and 50% ROO (Table 5) and lower<br />
than the Mahalanobis distance <strong>of</strong> 405.5 for the 60% blank<br />
sample. The Mahalanobis distances <strong>of</strong> BOO samples 3 (477.8)<br />
and 6 (488.0) are close to the corresponding value (501.1) <strong>of</strong><br />
the blank mixture <strong>with</strong> 70% ROO, whereas the final commercial<br />
products 2 and 4 contain ∼80% ROO as indicated by their<br />
Mahalanobis distances <strong>of</strong> 606.4 and 560.0, respectively, which<br />
agrees closely <strong>with</strong> those <strong>of</strong> the oils in the array (Table 5) and<br />
the blank sample (586.4) <strong>of</strong> the same concentration.<br />
LITERATURE CITED<br />
(1) Owen, R. W.; Giacosa, A.; Hull, W. E.; Haubner, R.; Wurtele,<br />
G.; Spiegelhalder, B.; Bartsch, H. <strong>Olive</strong>-oil consumption and<br />
health: the possible role <strong>of</strong> antioxidants. Lancet Oncol. 2000,<br />
1, 107-112.<br />
(2) Owen, R. W.; Mier, W.; Giacosa, A.; Hull, W. E.; Spiegelhalder,<br />
B.; Bartsch, H. Identification <strong>of</strong> lignans as major components<br />
in phenolic fraction <strong>of</strong> olive oil. Clin. Chem. 2000, 976-988.<br />
(3) Owen, R. W.; Mier, W.; Giacosa, A.; Hull, W. E.; Spiegelhalder,<br />
B.; Bartsch, H. Phenolic compounds and squalene in olive oils:<br />
the concentration and antioxidant potential <strong>of</strong> total phenols,<br />
simple phenols, secoiridoids, lignans and squalene. Food Chem.<br />
Toxicol. 2000, 38, 647-659.<br />
(4) EC. Off. J. Eur. Communities 2003, Nov 6, Regulation 1989/<br />
2003.<br />
(5) Aparicio, R.; Aparicio-Ruiz, R. Authentication <strong>of</strong> vegetable oils<br />
by chromatographic techniques. J. Chromatogr. A 2000, 881,<br />
93-104.<br />
(6) Garcia-Gonzalez, D. L.; Aparicio, R. <strong>Virgin</strong> olive oil quality<br />
classification combining neural networks and MOS sensors. J.<br />
Agric. Food Chem. 2003, 51, 3515-3519.<br />
(7) Dourtoglou, V. G.; Gourtoglou, Th.; Antonopoulos, A.; Stefanou,<br />
E.; Lalas, S.; Poulos, C. <strong>Detection</strong> <strong>of</strong> olive oil adulteration using<br />
principle component analysis applied on total regio FA composition.<br />
J. Am. <strong>Oil</strong> Chem. Soc. 2003, 80, 203-208.<br />
(8) Cercaci, L.; Rodriguez-Estrada, M. T.; Lerker, G. Solid-phase<br />
extraction-thin-layer-gas chromatography method for the detection<br />
<strong>of</strong> hazelnut oil in olive oils by determination <strong>of</strong> esterified<br />
sterols. J. Chromatogr. A 2003, 985, 211-220.<br />
(9) Marcos Lorenzo, I.; Luis Perez Pavon, J.; Fernandez Laespada,<br />
E.; Garcia Pinto, C.; Moreno Cordero, B. <strong>Detection</strong> <strong>of</strong> adulterants<br />
in olive by headspace-mass spectrometry. J. Chromatogr. A 2002,<br />
945, 221-230.<br />
(10) Angerosa, F.; Camera, L.; Cumitini, S.; Gleixner, G.; Reniero,<br />
F. Carbon stable isotopes and olive oil adulteration <strong>with</strong> pomace<br />
oil. J. Agric. Food Chem. 1997, 45, 3044-3048.<br />
(11) Downey, G.; McIntyre, P.; Davies, A. N. Detecting sunflower<br />
oil adulteration in extra virgin olive oils from the eastern<br />
Mediterranean by visible and near-infrared spectroscopy. J.<br />
Agric. Food Chem. 2002, 50, 5520-5525.<br />
(12) Baeten, V.; Meurens, M.; Morales, M. T.; Aparicio, R. <strong>Detection</strong><br />
<strong>of</strong> virgin olive oil adulteration by Fourier transform Raman<br />
spectroscopy. J. Agric. Food Chem. 1996, 44, 2225-2230.<br />
(13) Lai, Y. W.; Kemsley, E.; Wilson, R. H. Potential <strong>of</strong> Fourier<br />
transform infrared spectroscopy for the authentication <strong>of</strong> vegetable<br />
oils. J. Agric. Food Chem. 1994, 42, 1154-1159.