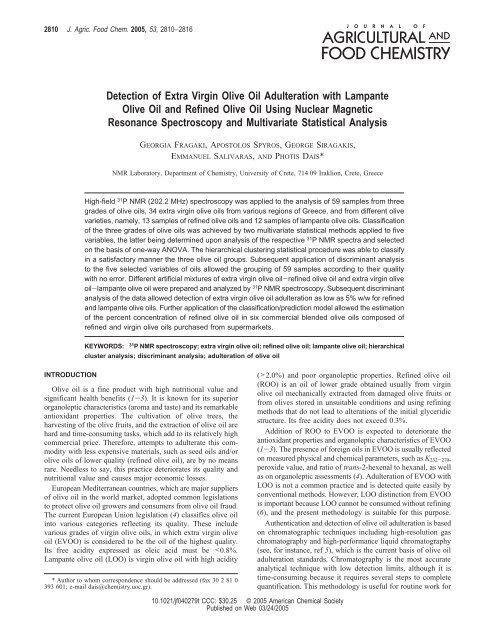
Detection of Extra Virgin Olive Oil Adulteration with - Department of ...
Detection of Extra Virgin Olive Oil Adulteration with - Department of ...
Detection of Extra Virgin Olive Oil Adulteration with - Department of ...

Create successful ePaper yourself
Turn your PDF publications into a flip-book with our unique Google optimized e-Paper software.
2810 J. Agric. Food Chem. 2005, 53, 2810−2816<br />
<strong>Detection</strong> <strong>of</strong> <strong>Extra</strong> <strong>Virgin</strong> <strong>Olive</strong> <strong>Oil</strong> <strong>Adulteration</strong> <strong>with</strong> Lampante<br />
<strong>Olive</strong> <strong>Oil</strong> and Refined <strong>Olive</strong> <strong>Oil</strong> Using Nuclear Magnetic<br />
Resonance Spectroscopy and Multivariate Statistical Analysis<br />
GEORGIA FRAGAKI, APOSTOLOS SPYROS, GEORGE SIRAGAKIS,<br />
EMMANUEL SALIVARAS, AND PHOTIS DAIS*<br />
NMR Laboratory, <strong>Department</strong> <strong>of</strong> Chemistry, University <strong>of</strong> Crete, 714 09 Iraklion, Crete, Greece<br />
High-field 31 P NMR (202.2 MHz) spectroscopy was applied to the analysis <strong>of</strong> 59 samples from three<br />
grades <strong>of</strong> olive oils, 34 extra virgin olive oils from various regions <strong>of</strong> Greece, and from different olive<br />
varieties, namely, 13 samples <strong>of</strong> refined olive oils and 12 samples <strong>of</strong> lampante olive oils. Classification<br />
<strong>of</strong> the three grades <strong>of</strong> olive oils was achieved by two multivariate statistical methods applied to five<br />
variables, the latter being determined upon analysis <strong>of</strong> the respective 31 P NMR spectra and selected<br />
on the basis <strong>of</strong> one-way ANOVA. The hierarchical clustering statistical procedure was able to classify<br />
in a satisfactory manner the three olive oil groups. Subsequent application <strong>of</strong> discriminant analysis<br />
to the five selected variables <strong>of</strong> oils allowed the grouping <strong>of</strong> 59 samples according to their quality<br />
<strong>with</strong> no error. Different artificial mixtures <strong>of</strong> extra virgin olive oil-refined olive oil and extra virgin olive<br />
oil-lampante olive oil were prepared and analyzed by 31 P NMR spectroscopy. Subsequent discriminant<br />
analysis <strong>of</strong> the data allowed detection <strong>of</strong> extra virgin olive oil adulteration as low as 5% w/w for refined<br />
and lampante olive oils. Further application <strong>of</strong> the classification/prediction model allowed the estimation<br />
<strong>of</strong> the percent concentration <strong>of</strong> refined olive oil in six commercial blended olive oils composed <strong>of</strong><br />
refined and virgin olive oils purchased from supermarkets.<br />
KEYWORDS:<br />
31 P NMR spectroscopy; extra virgin olive oil; refined olive oil; lampante olive oil; hierarchical<br />
cluster analysis; discriminant analysis; adulteration <strong>of</strong> olive oil<br />
INTRODUCTION<br />
<strong>Olive</strong> oil is a fine product <strong>with</strong> high nutritional value and<br />
significant health benefits (1-3). It is known for its superior<br />
organoleptic characteristics (aroma and taste) and its remarkable<br />
antioxidant properties. The cultivation <strong>of</strong> olive trees, the<br />
harvesting <strong>of</strong> the olive fruits, and the extraction <strong>of</strong> olive oil are<br />
hard and time-consuming tasks, which add to its relatively high<br />
commercial price. Therefore, attempts to adulterate this commodity<br />
<strong>with</strong> less expensive materials, such as seed oils and/or<br />
olive oils <strong>of</strong> lower quality (refined olive oil), are by no means<br />
rare. Needless to say, this practice deteriorates its quality and<br />
nutritional value and causes major economic losses.<br />
European Mediterranean countries, which are major suppliers<br />
<strong>of</strong> olive oil in the world market, adopted common legislations<br />
to protect olive oil growers and consumers from olive oil fraud.<br />
The current European Union legislation (4) classifies olive oil<br />
into various categories reflecting its quality. These include<br />
various grades <strong>of</strong> virgin olive oils, in which extra virgin olive<br />
oil (EVOO) is considered to be the oil <strong>of</strong> the highest quality.<br />
Its free acidity expressed as oleic acid must be 2.0%) and poor organoleptic properties. Refined olive oil<br />
(ROO) is an oil <strong>of</strong> lower grade obtained usually from virgin<br />
olive oil mechanically extracted from damaged olive fruits or<br />
from olives stored in unsuitable conditions and using refining<br />
methods that do not lead to alterations <strong>of</strong> the initial glyceridic<br />
structure. Its free acidity does not exceed 0.3%.<br />
Addition <strong>of</strong> ROO to EVOO is expected to deteriorate the<br />
antioxidant properties and organoleptic characteristics <strong>of</strong> EVOO<br />
(1-3). The presence <strong>of</strong> foreign oils in EVOO is usually reflected<br />
on measured physical and chemical parameters, such as K 232-270 ,<br />
peroxide value, and ratio <strong>of</strong> trans-2-hexenal to hexanal, as well<br />
as on organoleptic assessments (4). <strong>Adulteration</strong> <strong>of</strong> EVOO <strong>with</strong><br />
LOO is not a common practice and is detected quite easily by<br />
conventional methods. However, LOO distinction from EVOO<br />
is important because LOO cannot be consumed <strong>with</strong>out refining<br />
(6), and the present methodology is suitable for this purpose.<br />
Authentication and detection <strong>of</strong> olive oil adulteration is based<br />
on chromatographic techniques including high-resolution gas<br />
chromatography and high-performance liquid chromatography<br />
(see, for instance, ref 5), which is the current basis <strong>of</strong> olive oil<br />
adulteration standards. Chromatography is the most accurate<br />
analytical technique <strong>with</strong> low detection limits, although it is<br />
time-consuming because it requires several steps to complete<br />
quantification. This methodology is useful for routine work for<br />
10.1021/jf040279t CCC: $30.25 © 2005 American Chemical Society<br />
Published on Web 03/24/2005
<strong>Detection</strong> <strong>of</strong> <strong>Extra</strong> <strong>Virgin</strong> <strong>Olive</strong> <strong>Oil</strong> <strong>Adulteration</strong> J. Agric. Food Chem., Vol. 53, No. 8, 2005 2811<br />
an assessment <strong>of</strong> the olive oil quality according to EU<br />
regulations (ECN 42, spectroscopic constants K 232-270 , triglycerides,<br />
peroxide value, etc.).<br />
In the past decade, there has been an increasing interest in<br />
the classification <strong>of</strong> edible oils including olive oil as an<br />
alternative means to examine authentication and to detect<br />
possible adulteration <strong>of</strong> extra virgin olive oils <strong>with</strong> seed oils<br />
and/or olive oils <strong>of</strong> lower grade. Classification <strong>of</strong> various grades<br />
<strong>of</strong> olive oil has been carried out in several instances by using<br />
a variety <strong>of</strong> analytical techniques and chemometric procedures.<br />
Among these are classical methods based on gas chromatography<br />
and high-performance liquid chromatography (7, 8), mass<br />
spectrometry (9), isotope mass ratio analysis (10), metal oxide<br />
sensors (6), vibrational spectroscopy (11-16), and nuclear<br />
magnetic resonance (NMR) spectroscopy (17-20).<br />
In a recent publication (21) we proposed a methodology based<br />
on NMR spectroscopy in combination <strong>with</strong> multivariate statistical<br />
analysis to classify 13 types <strong>of</strong> edible oils and to detect virgin<br />
olive oil adulteration <strong>with</strong> corn, soybean, sunflower, and<br />
hazelnut oils. In particular, 31 P NMR spectroscopy was used to<br />
determine in a single experiment 1,2-diacylglycerols (1,2-DGs),<br />
1,3-diacylglycerols (1,3-DGs), total diacylglycerols (TDGs), the<br />
ratio D <strong>of</strong> 1,2-DGs over TDGs, total free sterols, and free acidity.<br />
This method (21) is based on the derivatization <strong>of</strong> the labile<br />
hydrogens <strong>of</strong> hydroxyl and carboxyl groups <strong>with</strong> 2-chloro-<br />
4,4,5,5-tetramethyl dioxaphospholane (1) and the use <strong>of</strong> the 31 P<br />
chemical shifts <strong>of</strong> the phosphitylated compounds to identify the<br />
labile centers. The phosphorus reagent reacts rapidly and<br />
quantitatively under mild conditions <strong>with</strong> the hydroxyl and<br />
carboxyl groups (21). The same procedure will be used in the<br />
present study to discriminate among three different grades <strong>of</strong><br />
olive oil, namely, EVOO, ROO, and LOO, and to detect EVOO<br />
adulteration <strong>with</strong> these oils.<br />
MATERIALS AND METHODS<br />
Samples and Reagents. Thirty-four EVOO harvested between<br />
2001and 2003 were provided by local cooperatives. Twenty-one olive<br />
oils were sampled in Crete (Peza, Kolymbari, Heraklion, Sitia), 3 oils<br />
in Messinia, and 1 in Ilia. They were extracted from the olive variety<br />
Koroneiki, whereas the oils from Lakonia (6 oils), Lesvos (1 oil), and<br />
Pilion (2 oils) were extracted from the varieties Athinolia, Kolovi, and<br />
a local variety, respectively. The samples were extracted by centrifugation<br />
<strong>with</strong>in 48 h after harvesting and stored immediately in brown<br />
screw-capped bottles at -20 °C prior to spectrum acquisition and were<br />
coded as extra virgin olive oils according to the <strong>of</strong>ficial limits (4). A<br />
total <strong>of</strong> 25 samples <strong>of</strong> olive oil <strong>of</strong> lower quality were kindly supplied<br />
by the olive oil company Minerva (Athens, Greece): 12 samples <strong>of</strong><br />
LOO and 13 samples <strong>of</strong> ROO. Refined olive oils were deodorized in<br />
the final step <strong>of</strong> the refining process. Finally, six commercial samples<br />
<strong>of</strong> blended olive oil composed <strong>of</strong> refined olive oil and virgin olive oil<br />
(BOO) were purchased from local supermarkets.<br />
The 31 P NMR method was applied to detect olive oil adulteration.<br />
Fresh EVOO samples were mixed <strong>with</strong> LOO and ROO samples. Two<br />
set <strong>of</strong> mixtures <strong>of</strong> 1, 3, 5, 10, 15, 20, 35, 50, 65, and 80% (w/w) and<br />
1, 3, 5, 10, 15, 20, 35, and 50% for ROO adulterant in EVOO and one<br />
set <strong>of</strong> 1, 3, 5, 10, 15, and 20% (w/w) <strong>of</strong> LOO in EVOO were prepared.<br />
EVOO samples <strong>of</strong> different geographical and botanical origins and<br />
different ROO samples were used for the preparation <strong>of</strong> the various<br />
mixtures. Finally, three EVOO samples <strong>of</strong> different geographical and<br />
botanical origins (1 from Pilion, 1 from Sitia, and 1 from Lesvos), not<br />
included in the 34 EVOO samples used for the present analysis, were<br />
adulterated <strong>with</strong> different ROO samples at concentrations <strong>of</strong> 60, 65,<br />
70, 75, and 80% (w/w). These mixtures were analyzed by 31 P NMR<br />
spectroscopy and used as blank tests to estimate the composition <strong>of</strong><br />
BOO samples. All olive oil samples and their mixtures were analyzed<br />
twice.<br />
Pinacol, triethylamine, phosphorus trichloride, protonated solvents<br />
(reagent or analytical grade), and deuterated solvents used in the present<br />
study were purchased from Sigma-Aldrich (Athens, Greece). The<br />
derivatizing phosphorus reagent 2-chloro-4,4,5,5-tetramethyldioxaphospholane<br />
(1) was synthesized from pinacol and phosphorus trichloride<br />
following the method described in the literature (23). However, to<br />
increase the yield <strong>of</strong> the reaction, we utilized hexane solvent instead<br />
<strong>of</strong> benzene and pyridine instead <strong>of</strong> triethylamine as suggested in the<br />
original method. This modification resulted in ∼45% yield <strong>of</strong> the<br />
product against 19% obtained <strong>with</strong> the original method.<br />
Sample Preparation for 31 P NMR Spectral Analysis. A stock<br />
solution was prepared by dissolving 0.6 mg <strong>of</strong> chromium acetylacetonate,<br />
Cr(acac) 3 (0.165 µM), and 13.5 mg <strong>of</strong> cyclohexanol (13.47 mM)<br />
in 10 mL <strong>of</strong> a mixture <strong>of</strong> pyridine and CDCl 3 solvents (1.6:1.0 volume<br />
ratio) and protected from moisture <strong>with</strong> 5A molecular sieves. Cyclohexanol<br />
was used as an internal standard for quantification purposes.<br />
<strong>Olive</strong> oil (100-150 mg) was placed ina5mmNMRtube. The required<br />
volumes <strong>of</strong> the stock solution (0.4 mL) and the reagent 1 (15 µL) were<br />
added. The reaction mixture was left to react for ∼15 min at room<br />
temperature. Upon completion <strong>of</strong> the reaction, the solution was used<br />
to obtain the 31 P NMR spectra.<br />
13<br />
P NMR Experiments. 13 P NMR experiments were conducted on<br />
a Bruker AMX500 spectrometer operating at 202.2 MHz for the<br />
phosphorus-31 nucleus at 30 ( 1 °C. The spectra were recorded by<br />
employing the inverse gated decoupling technique in order to suppress<br />
NOE. Typical spectral parameters for quantitative studies were as<br />
follows: 90° pulse width ) 12.5 µs, sweep width ) 10 kHz, relaxation<br />
delay ) 30 s, memory size ) 16K (zero-filled to 32K). Line broadening<br />
<strong>of</strong> 1 Hz was applied, and drift correction was performed prior to Fourier<br />
transform. Polynomial fourth-order baseline correction was performed<br />
before integration. For each spectrum 32 transients were accumulated.<br />
All 31 P chemical shifts are relative to the product <strong>of</strong> the reaction <strong>of</strong> 1<br />
<strong>with</strong> water (moisture contained in all samples), which gives a sharp<br />
signal in pyridine/CDCl 3 at δ 132.20. It should be noted that the<br />
presence <strong>of</strong> the paramagnetic metal center <strong>of</strong> Cr(acac) 3 in the samples<br />
lowers the relaxation times <strong>of</strong> the phosphorus nuclei, shortening thus<br />
the duration <strong>of</strong> the measurements significantly. The relaxation delay<br />
in the 90° pulse sequence is based on the 31 P spin-lattice relaxation<br />
time <strong>of</strong> 4.9 s measured for the internal standard. Lower values were<br />
measured for other model compounds (3.5 s for stearic acid and 2.3 s<br />
for 1,2-diolein). Therefore, the relaxation delay (5 times the longest<br />
relaxation time) is suitable for quantitative analysis. The applicability<br />
<strong>of</strong> this method to quantitative analysis, as well as its reproducibility<br />
and repeatability, has been tested thoroughly in previous studies (20,<br />
21).<br />
Statistical Analysis. One-way ANOVA was used to find the<br />
variables <strong>with</strong> the highest discriminatory power. The results <strong>of</strong> this<br />
analysis are reported as the Fisher F ratios and p level. The F ratio<br />
<strong>with</strong> the degrees <strong>of</strong> freedom tests whether the between and <strong>with</strong>in<br />
variances are significantly different. The p level represents a decreasing<br />
index <strong>of</strong> reliability <strong>of</strong> a result and gives the probability <strong>of</strong> error involved<br />
in accepting a result as valid. The results reported below show that the<br />
selected variables were significantly different for the three grades <strong>of</strong><br />
olive oil. The unsupervised statistical method <strong>of</strong> hierarchical cluster<br />
analysis (HCA) was applied to explore similarity (or dissimilarity)<br />
among the various olive oil samples, whereas the supervised method<br />
discriminant analysis (DA) classified olive oils according to different<br />
grades and detected adulteration. Discriminant function analysis is used<br />
to determine which variables (e.g., compositional parameters <strong>of</strong> olive<br />
oil samples) discriminate between two or more naturally occurring<br />
groups (e.g., olive oil grades). The DA method applied to a matrix <strong>of</strong><br />
5 independent variables and 59 olive oil samples provided good results<br />
(see below) while being very straightforward in calculation and<br />
interpretation. Visualization <strong>of</strong> the oil classification is achieved by<br />
plotting the individual scores for two principal discriminant functions,<br />
whereas for the detection <strong>of</strong> EVOO adulteration the discriminant<br />
functions obtained from the DA model and the Mahalanobis distances<br />
were used. The statistical package Statistica for Windows 5.1B (StatS<strong>of</strong>t<br />
Inc.) was used.<br />
RESULTS AND DISCUSSION<br />
Data Analysis. Results are summarized in Tables 1-3. Table<br />
1 contains the percentage content <strong>of</strong> five chemical components
2812 J. Agric. Food Chem., Vol. 53, No. 8, 2005 Fragaki et al.<br />
Table 1. Compositional Parameters, Means, and Standard Deviations<br />
<strong>of</strong> <strong>Extra</strong> <strong>Virgin</strong> <strong>Olive</strong> <strong>Oil</strong>s from Various Regions <strong>of</strong> Greece and <strong>of</strong><br />
Commercial Blended <strong>Olive</strong> <strong>Oil</strong>s Determined by 31 P NMR Spectroscopy<br />
sample area 1,2-DGs 1,3-DGs TDGs D sterols acidity<br />
EVOO a<br />
1 Sitia 2.15 0.17 2.32 0.93 0.140 0.33<br />
2 Sitia 1.58 0.09 1.67 0.95 0.148 0.21<br />
3 Sitia 1.88 0.15 2.03 0.93 0.093 0.24<br />
4 Sitia 2.05 0.17 2.22 0.92 0.115 0.35<br />
5 Sitia 2.04 0.13 2.17 0.94 0.126 0.33<br />
6 Sitia 1.74 0.15 1.89 0.92 0.089 0.20<br />
7 Sitia 1.86 0.12 1.98 0.94 0.121 0.25<br />
8 Heraklion 2.49 0.16 2.65 0.94 0.155 0.40<br />
9 Heraklion 1.57 0.15 1.72 0.92 0.091 0.23<br />
10 Heraklion 2.08 0.16 2.24 0.93 0.143 0.24<br />
11 Heraklion 1.70 0.13 1.83 0.93 0.128 0.21<br />
12 Heraklion 1.90 0.14 2.04 0.93 0.149 0.24<br />
13 Heraklion 1.58 0.12 1.70 0.93 0.118 0.38<br />
14 Kolymbari 1.76 0.18 1.94 0.91 0.093 0.39<br />
15 Kolymbari 2.30 0.23 2.53 0.91 0.141 0.30<br />
16 Kolymbari 1.69 0.14 1.83 0.92 0.106 0.26<br />
17 Peza 1.72 0.14 1.86 0.93 0.112 0.32<br />
18 Peza 2.22 0.19 2.41 0.92 0.167 0.41<br />
19 Peza 1.39 0.11 1.50 0.93 0.103 0.18<br />
20 Peza 1.49 0.11 1.60 0.93 0.124 0.18<br />
21 Peza 1.90 0.12 2.02 0.94 0.160 0.22<br />
22 Lakonia 1.94 0.20 2.14 0.91 0.098 0.21<br />
23 Lakonia 2.05 0.13 2.18 0.94 0.071 0.24<br />
24 Lakonia 1.79 0.12 1.91 0.94 0.081 0.16<br />
25 Lakonia 2.08 0.17 2.25 0.93 0.113 0.20<br />
26 Lakonia 2.06 0.16 2.22 0.93 0.077 0.22<br />
27 Lakonia 2.15 0.14 2.29 0.94 0.101 0.21<br />
28 Messinia 1.74 0.12 1.86 0.94 0.094 0.22<br />
29 Messinia 1.77 0.18 1.95 0.91 0.080 0.20<br />
30 Messinia 1.56 0.18 1.74 0.90 0.099 0.24<br />
31 Pilion 2.29 0.17 2.46 0.93 0.099 0.63<br />
32 Pilion 2.10 0.15 2.25 0.93 0.076 0.46<br />
33 Lesvos 1.77 0.16 1.93 0.92 0.104 0.42<br />
34 Ilia 2.37 0.08 2.45 0.97 0.154 0.20<br />
av 1.90 0.15 2.05 0.93 0.114 0.28<br />
SD 0.27 0.03 0.28 0.01 0.027 0.10<br />
35 b Pilion 2.02 0.14 2.16 0.94 0.08 0.46<br />
36 b Lesvos 1.97 0.23 2.20 0.90 0.10 0.77<br />
37 b Sitia 2.15 0.17 2.32 0.93 0.14 0.32<br />
BOO c<br />
1 1.71 1.72 3.43 0.50 0.07 0.53<br />
2 1.41 3.28 4.69 0.30 0.07 0.68<br />
3 1.20 1.88 3.08 0.39 0.06 0.56<br />
4 1.63 3.08 4.71 0.35 0.05 0.22<br />
5 0.92 0.84 1.76 0.52 0.07 0.19<br />
6 1.43 2.24 3.67 0.39 0.06 0.30<br />
a EVOO, extra virgin olive oils. b EVOO samples 35−37 were used for the<br />
preparation <strong>of</strong> blank tests (see text). c BOO, blended olive oils composed <strong>of</strong> refined<br />
olive oils and virgin olive oils.<br />
Table 2. Compositional Parameters, Means, and Standard Deviations<br />
<strong>of</strong> Lampante and Refined <strong>Olive</strong> <strong>Oil</strong>s Determined by 31 P NMR<br />
Spectroscopy<br />
sample 1,2-DGs 1,3-DGs TDGs D sterols acidity<br />
LOO a<br />
1 1.35 2.85 4.20 0.32 0.104 2.81<br />
2 1.85 3.08 4.93 0.38 0.099 6.45<br />
3 1.67 4.14 5.81 0.29 0.080 7.33<br />
4 2.08 2.55 4.63 0.45 0.107 5.10<br />
5 2.10 3.19 5.29 0.40 0.107 8.73<br />
6 1.29 1.92 3.21 0.40 0.168 2.96<br />
7 2.23 5.38 7.61 0.29 0.090 7.55<br />
8 2.38 4.64 7.02 0.34 0.08 10.17<br />
9 1.77 4.31 6.08 0.29 0.07 7.78<br />
10 1.00 2.23 3.23 0.31 0.100 1.88<br />
11 0.73 1.84 2.56 0.28 0.08 2.29<br />
12 2.41 5.80 8.21 0.29 0.07 10.86<br />
av 1.74 3.49 5.18 0.34 0.096 6.16<br />
SD 0.55 1.34 1.79 0.05 0.027 3.11<br />
ROO b<br />
1 1.47 2.95 4.42 0.33 0.066 0.03<br />
2 1.68 3.16 4.84 0.35 0.047 0.00<br />
3 1.55 3.33 4.88 0.32 0.099 0.07<br />
4 1.61 2.83 4.44 0.36 0.063 0.04<br />
5 1.85 3.52 5.37 0.35 0.048 0.02<br />
6 2.14 3.71 5.85 0.37 0.108 0.02<br />
7 2.10 3.71 5.81 0.36 0.086 0.00<br />
8 1.39 2.63 4.02 0.35 0.096 0.00<br />
9 1.60 3.89 5.49 0.29 0.077 0.03<br />
10 1.53 3.50 5.03 0.31 0.067 0.06<br />
11 0.97 2.31 3.28 0.30 0.00 0.015<br />
12 1.49 3.58 5.07 0.29 0.066 0.03<br />
13 0.99 2.23 3.22 0.31 0.066 0.04<br />
av 1.57 3.18 4.75 0.33 0.068 0.03<br />
SD 0.35 0.55 0.85 0.03 0.028 0.02<br />
a LOO, lampante virgin olive oils. a ROO, refined virgin olive oils.<br />
and the ratio D (1,2-DGs/TDG) for the various samples <strong>of</strong><br />
EVOO and BOO, whereas Tables 2 and 3 depict the same<br />
parameters for LOO, ROO, and their mixtures <strong>with</strong> EVOO,<br />
respectively. Spectral assignments and methods <strong>of</strong> quantification<br />
<strong>of</strong> the NMR data have been reported in detail in previous<br />
publications (20, 21). The mean values in Tables 1 and 2 show<br />
that there are discernible differences in 1,3-DGs, TDGs, the ratio<br />
D (1,2-DGs/TDGs), and free acidity. These parameters appear<br />
to differentiate the olive oil samples. In particular, EVOO are<br />
characterized by high values <strong>of</strong> the ratio D and low values <strong>of</strong><br />
TDGs and free acidity relative to the same parameters <strong>of</strong> the<br />
other oils. It is known that the natural content <strong>of</strong> TDGs in EVOO<br />
does not exceed 1-3% depending on the olive fruit ripeness<br />
and olive fruit variety (20, 24-26), whereas the level <strong>of</strong> TDGs<br />
(mainly 1,3-DGs) is higher (4-5%) in ROO (27). Moreover,<br />
in EVOO samples, 1,3-DGs are much lower than the corresponding<br />
values in the ROO samples. This is due to the fact<br />
that the isomerization <strong>of</strong> 1,2-DGs to 1,3-DGs that usually occurs<br />
during prolonged olive oil storage is very rapid upon olive oil<br />
refinement (24, 28). The LOO samples have characteristics<br />
similar to those <strong>of</strong> ROO except free acidity. The discrimination<br />
<strong>of</strong> EVOO <strong>with</strong> respect to the other oils can be seen graphically<br />
in Figure 1, where the ratio D is plotted against the difference<br />
<strong>of</strong> TDGs minus free acidity (TDG-FFA, where FFA stands<br />
for free fatty acids). It is seen clearly that the EVOO samples<br />
are clustered in the upper part <strong>of</strong> the graph, whereas LOO and<br />
ROO are dispersed in the lower part <strong>of</strong> the graph. What is most<br />
interesting in this graph is the observation that adulterated<br />
EVOO samples (solid symbols) <strong>with</strong> LOO and ROO lie between<br />
the group <strong>of</strong> EVOO and the respective group <strong>of</strong> the lower quality<br />
olive oils, depending on the amount <strong>of</strong> the latter oils in the<br />
mixtures. This finding may suggest an alternative method to<br />
detect EVOO adulteration <strong>with</strong> LOO and ROO, although this<br />
observation needs further exploration on an experimental and<br />
theoretical basis. At any rate, it appears that the parameter<br />
TDG-FFA is able to discriminate EVOO from the other oils.<br />
When free acidity was plotted against 1,3-DGs for all oil<br />
samples, a good linear correlation (r ) 0.95) was obtained,<br />
indicating that the concentration <strong>of</strong> free fatty acids increases<br />
<strong>with</strong> increasing concentration <strong>of</strong> 1,3-DGs. This pattern, which<br />
has been observed previously (26), can be explained as<br />
follows: hydrolysis <strong>of</strong> triglycerides results in 1,2- (and/or 2,3-)<br />
DGs and 1,3-DGs in a concentration ratio <strong>of</strong> 2:1 and free fatty<br />
acids, followed by isomerization <strong>of</strong> 1,2-DGs to 1,3-DGs. The<br />
isomerization reaction proceeds more rapidly than hydrolysis<br />
(28), and the consumption <strong>of</strong> 1,2-DGs shifts the equilibrium <strong>of</strong>
<strong>Detection</strong> <strong>of</strong> <strong>Extra</strong> <strong>Virgin</strong> <strong>Olive</strong> <strong>Oil</strong> <strong>Adulteration</strong> J. Agric. Food Chem., Vol. 53, No. 8, 2005 2813<br />
Figure 1. Plot <strong>of</strong> the D ratio against the difference TDGs−FFA for 59 samples <strong>of</strong> extra virgin olive oils (EVOO), refined olive oils (ROO), and lampante<br />
olive oils (LOO) (open symbols) and for the EVOO mixtures <strong>with</strong> the lower quality olive oils (solid symbols). Ellipses were drawn as an aid to the eye.<br />
Table 3. Compositional Parameters <strong>of</strong> Mixtures <strong>of</strong> <strong>Extra</strong> <strong>Virgin</strong> <strong>Olive</strong><br />
<strong>Oil</strong>s <strong>with</strong> Refined and Lampante <strong>Olive</strong> <strong>Oil</strong>s Determined by 31 P NMR<br />
Spectroscopy<br />
mixture<br />
concn<br />
(%, w/w) 1,2-DGs 1,3-DGs TDGs D sterols acidity<br />
EVOO−ROO (1) a 1 1.85 0.16 2.01 0.92 0.100 0.21<br />
3 1.81 0.23 2.04 0.89 0.100 0.18<br />
5 1.76 0.31 2.07 0.85 0.095 0.16<br />
10 1.61 0.54 2.15 0.75 0.090 0.15<br />
15 1.57 0.68 2.25 0.70 0.095 0.15<br />
20 1.54 0.75 2.29 0.67 0.090 0.14<br />
35 1.52 1.36 2.88 0.53 0.078 0.11<br />
50 1.49 1.67 3.16 0.47 0.075 0.10<br />
EVOO−ROO (2) b 1 1.79 0.17 1.96 0.91 0.057 0.15<br />
3 1.72 0.19 1.91 0.90 0.078 0.14<br />
5 1.79 0.28 2.07 0.86 0.072 0.13<br />
10 1.77 0.43 2.20 0.80 0.082 0.13<br />
15 1.73 0.54 2.27 0.76 0.081 0.12<br />
20 1.69 0.67 2.36 0.72 0.073 0.11<br />
35 1.65 1.07 2.72 0.61 0.075 0.10<br />
50 1.62 1.51 3.13 0.52 0.083 0.07<br />
65 1.37 1.75 3.12 0.44 0.060 0.04<br />
80 1.49 2.41 3.90 0.38 0.070 0.06<br />
EVOO-LOO c 1 1.47 0.15 1.62 0.91 0.118 0.37<br />
3 1.41 0.20 1.61 0.88 0.145 0.42<br />
5 1.40 0.23 1.63 0.86 0.109 0.52<br />
10 1.35 0.34 1.69 0.80 0.111 0.60<br />
15 1.33 0.47 1.80 0.74 0.090 0.73<br />
20 1.29 0.60 1.89 0.68 0.121 0.90<br />
EVOO−ROO(3) d<br />
1 60 1.79 1.2.07 3.86 0.46 0.12 0.17<br />
2 65 1.76 2.22 3.98 0.44 0.114 0.16<br />
3 70 1.75 2.55 4.30 0.40 0.074 0.15<br />
4 75 1.70 2.90 4.60 0.37 0.080 0.20<br />
5 80 1.60 3.15 4.75 0.34 0.108 0.13<br />
a First set <strong>of</strong> mixtures obtained from EVOO sample 27 (Table 1) and ROO<br />
sample 2 (Table 2). b Second set <strong>of</strong> mixtures obtained from EVOO sample 24<br />
(Table 1) and ROO sample 4 (Table 2). c Mixtures obtained from EVOO sample<br />
13 (Table 1) and LOO sample 6 (Table 2). d Samples for blank tests were prepared<br />
as follows: 1 and 2 from EVOO sample 37 (Table 1) and ROO 3 (Table 2); 3<br />
from EVOO sample 35 (Table 1) and ROO 10 (Table 2); 4 and 5 from EVOO<br />
sample 36 (Table 1) and ROO 9 (Table 2).<br />
hydrolysis toward the products and, hence, increases the<br />
concentration <strong>of</strong> free fatty acids.<br />
Classification <strong>of</strong> <strong>Olive</strong> <strong>Oil</strong>s <strong>with</strong> Multivariate Statistical<br />
Analysis. A study <strong>of</strong> skewness and kurtosis on each variable<br />
demonstrated that all had an almost normal distribution, except<br />
perhaps free acidity, which showed positive skewness (2.25)<br />
and kurtosis (3.91). Logarithmic transformation was applied to<br />
this variable before further analysis was performed. Multivariate<br />
outliers among samples were detected by applying principle<br />
component analysis (PCA). No outliers were identified in the<br />
present data. The variables <strong>with</strong> the highest discriminating power<br />
were selected by employing one-way ANOVA. On the basis<br />
<strong>of</strong> the Fisher F ratio, we selected the following variables (in<br />
parentheses the F values <strong>with</strong> degrees <strong>of</strong> freedom 2 and 56):<br />
1,3-DGs, (176.2), TDGs (74.0), D (3017.9), sterols (13.4), log<br />
<strong>of</strong> acidity (434.7), TDG-FFA (135.2) <strong>with</strong> the probability p <<br />
0.000017 for sterols and p < 0.000001 for the remaining<br />
variables. The F ratios are higher than the critical values<br />
obtained from standard statistical tables at p ) 0.005, F critical<br />
(2, 56) ) 5.80, or upon comparison <strong>with</strong> F critical (2, 11) ) 7.20<br />
at p ) 0.01, 12 being the number <strong>of</strong> oil samples minus 1 for<br />
the group <strong>of</strong> olive oils <strong>with</strong> the least number <strong>of</strong> samples (LOO<br />
<strong>with</strong> 12 samples). The strict criteria for the chosen probability<br />
(usually p ) 0.05) was justified by the fact that the groups <strong>of</strong><br />
olive oils contain different numbers <strong>of</strong> samples. The relatively<br />
low Fisher F ratio observed for sterols is indicative <strong>of</strong> its limited<br />
discriminatory power, and thus it is excluded from further<br />
statistical analysis.<br />
The selected variables were used next to examine the<br />
similarity (or dissimilarity) <strong>of</strong> the oils by means <strong>of</strong> HCA. This<br />
statistical method organizes the clustering <strong>of</strong> different objects<br />
<strong>with</strong>out any a priori knowledge <strong>of</strong> the <strong>of</strong> class membership on<br />
the basis <strong>of</strong> a similarity indicator (distance) and an amalgamation<br />
algorithm that joins similar objects into clusters. The results <strong>of</strong><br />
HCA for the present olive oil are presented in the form <strong>of</strong> a<br />
dendrogram in Figure 2 obtained <strong>with</strong> Euclidean distances and<br />
single linkage. Apart from one lampante oil sample, a clear<br />
grouping <strong>of</strong> the three olive oil grades is achieved.<br />
For further statistical analysis using DA, the type <strong>of</strong> oil was<br />
chosen as a grouping variable or code. Also, this supervised<br />
statistical method allows detection <strong>of</strong> adulteration (see below).<br />
Figure 3 shows the graph <strong>of</strong> the two canonical functions (roots)<br />
obtained, which succeeded in classifying the 59 oil samples into
2814 J. Agric. Food Chem., Vol. 53, No. 8, 2005 Fragaki et al.<br />
Figure 2. Dendrogram showing the clustering <strong>of</strong> the 59 samples <strong>of</strong> olive oils based on the NMR data set. Samples labeled <strong>with</strong> the same letter originate<br />
from the same olive oil grade: extra virgin olive oil (V), refined olive oil (R), lampante olive oil (L).<br />
Figure 3. Plot <strong>of</strong> the discriminant functions roots 1 and 2 for three grades <strong>of</strong> olive oils, extra virgin olive oils (EVOO), refined olive oils (ROO), and<br />
lampante olive oils (LOO) (open symbols) and two sets <strong>of</strong> mixtures, EVOO−ROO (1) and EVOO−ROO (2), containing 1−50 and 1−80% w/w ROO in<br />
EVOO, respectively, and one set <strong>of</strong> mixtures 1−20% <strong>of</strong> EVOO <strong>with</strong> LOO (solid symbols). Crosses denote the blank tests, EVOO−ROO (3), and solid<br />
triangles denote the commercial blended olive oils (BOO). Arrows indicate mixtures <strong>of</strong> EVOO containing ROO at concentrations >50%.<br />
three groups. The ellipses denote the 95% probability that a<br />
certain sample belongs to its own group <strong>of</strong> oils <strong>with</strong>in the region<br />
defined by the ellipse. The raw coefficients, the tolerance values,<br />
and the Wilk’s λ criterion assigned to the selected variables are<br />
shown in Table 4. Variables 1,3-DGs, TDGs, D, and log acidity<br />
have the largest raw coefficients <strong>of</strong> the canonical functions,<br />
reflecting their significant contribution to the discrimination<br />
between groups. The values <strong>of</strong> Wilk’s λ are very small,<br />
indicating that the five selected variables are characterized by<br />
an effective discriminatory power. Also, the high tolerance<br />
values show no indication <strong>of</strong> redundancy among the selected<br />
variables.<br />
The reliability <strong>of</strong> the system used to classify the oils has been<br />
validated by its ability to correctly classify unknown samples.<br />
In this respect, the data set <strong>of</strong> all oils was split into the training<br />
set (around two-thirds <strong>of</strong> the samples) and the test set (around<br />
one-third <strong>of</strong> the samples) considered as unknowns. The samples<br />
<strong>of</strong> the training and test sets were selected three times at random<br />
from 59 oil samples. Each time, different training and test sets<br />
were used. Application <strong>of</strong> the DA classification functions<br />
obtained for the training set <strong>of</strong> oil samples in all three runs<br />
produced 100% correct assignments for the test set <strong>of</strong> EVOO,<br />
LOO, and ROO.<br />
<strong>Adulteration</strong> <strong>of</strong> <strong>Extra</strong> <strong>Virgin</strong> <strong>Olive</strong> <strong>Oil</strong>s. DA was applied<br />
to the analysis <strong>of</strong> the oil mixtures (adulterated EVOO) analyzed<br />
by 31 P NMR spectroscopy and considered as unknown samples.<br />
Results were calculated using the model obtained by the training<br />
set and depicted in Figure 3. The adulterated EVOO samples<br />
<strong>with</strong> ROO and LOO (solid symbols) (see also Table 3 for the<br />
origin <strong>of</strong> mixtures) lie between the group <strong>of</strong> EVOO and the
<strong>Detection</strong> <strong>of</strong> <strong>Extra</strong> <strong>Virgin</strong> <strong>Olive</strong> <strong>Oil</strong> <strong>Adulteration</strong> J. Agric. Food Chem., Vol. 53, No. 8, 2005 2815<br />
Table 4. Discriminant Analysis: Raw Coefficients, Wilk’s λ Values,<br />
and Tolerance Levels for Each Variable Used for the Classification <strong>of</strong><br />
Four Grades <strong>of</strong> <strong>Olive</strong> <strong>Oil</strong>s<br />
variable root 1 root 2 Wilk’s λ<br />
tolerance<br />
level<br />
1,3-DGs 3.727 −0.026 0.000446 0.0474<br />
TDGs −2.605 −0.511 0.000459 0.0506<br />
D 48.509 −2.765 0.000638 0.4588<br />
log <strong>of</strong> acidity 1.907 5.638 0.001134 0.5598<br />
TDGs−FFA −0.335 −0.069 0.000344 0.6429<br />
constants −29.471 6.70<br />
eigenvalues 152.923 19.01<br />
Table 5. Squared Mahalanobis Distances <strong>of</strong> Adulterated EVOO<br />
Samples from <strong>Olive</strong> <strong>Oil</strong> Centroid<br />
adulterant<br />
1% 3% 5% 10% 15% 20% 35% 50% 65% 80%<br />
ROO a 0.6 3.7 12.3 61.3 102.2 128.0 304.8 394.5<br />
ROO b 3.7 5.2 14.2 38.6 64.24 99.5 217.1 349.9 452.0 576.6<br />
LOO c 3.6 5.5 9.7 26.2 57.61 99.4<br />
a First set <strong>of</strong> mixtures (1−50%) <strong>of</strong> EVOO <strong>with</strong> ROO. b Second set <strong>of</strong> mixtures<br />
(1−80%) <strong>of</strong> EVOO <strong>with</strong> ROO. c Set <strong>of</strong> mixtures (1−20%) <strong>of</strong> EVOO <strong>with</strong> LOO.<br />
respective group <strong>of</strong> ROO and LOO depending on the amount<br />
<strong>of</strong> the latter oils in the mixtures. The first set <strong>of</strong> mixtures<br />
containing the lowest amount <strong>of</strong> adulterant ROO in EVOO (1%)<br />
falls inside the 95% ellipse <strong>of</strong> EVOO, whereas the second set<br />
<strong>of</strong> mixtures <strong>with</strong> the same concentration <strong>of</strong> adulterant lies in<br />
the border <strong>of</strong> the ellipse <strong>of</strong> EVOO (Figure 3). The adulterated<br />
EVOO <strong>with</strong> LOO show higher detection limits, because only<br />
the 5% mixture is outside the 95% ellipse <strong>of</strong> EVOO group,<br />
A more accurate means to detect adulteration is the Mahalanobis<br />
distance, which measures the distances between each<br />
point and the group centroid. The calculated Mahalanobis<br />
distances for mixtures (Table 5) are to be compared <strong>with</strong> the<br />
Mahalanobis distance <strong>of</strong> EVOO samples from the centroid <strong>of</strong><br />
their own group. Apart from 2 EVOO samples <strong>of</strong> 34 <strong>with</strong><br />
Mahalanobis distances 6.7 and 5.3, all other EVOO samples<br />
are characterized by distances lower than those calculated for<br />
the EVOO <strong>with</strong> 5% <strong>of</strong> ROO and EVOO adulterated <strong>with</strong> 5%<br />
LOO. These data clearly show that the minimum amounts <strong>of</strong><br />
ROO and LOO that can be detected by using the present<br />
methodology are 5%.<br />
Although application <strong>of</strong> DA to adulteration studies does not<br />
lead to precise quantitative conclusions, the almost linear array<br />
<strong>of</strong> the adulterated EVOO samples in the plot <strong>of</strong> Figure 3 may<br />
allow a semiquantitative estimation <strong>of</strong> the proportion <strong>of</strong> added<br />
foreign oil. First, we prepared mixtures <strong>of</strong> EVOO <strong>with</strong> ROO<br />
<strong>of</strong> known composition (60, 65, 70, 75, and 80%) using different<br />
EVOO samples not included in the previous statistical treatment<br />
(see Table 3 and footnote). These samples, used as blank tests,<br />
were treated as unknowns using the model obtained by the<br />
training set <strong>of</strong> 59 oils. As shown in Figure 3, these mixtures<br />
indicated by arrows are lying close to the array <strong>of</strong> the adulterated<br />
EVOO <strong>with</strong> ROO used in the statistical analysis at positions<br />
depending on the amount <strong>of</strong> the added ROO. The Mahalanobis<br />
distances for 65% (436.4) and 80% (586.4) adulteration agree<br />
closely <strong>with</strong> those reported for the corresponding values <strong>of</strong> the<br />
mixtures in the array <strong>with</strong> the same composition (Table 5). Next,<br />
we consider real oils represented by six blended olive oils (BOO)<br />
consisting <strong>of</strong> refined olive oil and virgin olive oil and purchased<br />
from supermarkets in an attempt to estimate the percent<br />
concentration <strong>of</strong> ROO in these commercial products. These<br />
samples were treated again as unknowns using the model<br />
obtained by the training set <strong>of</strong> the 59 oil samples (Figure 3).<br />
The observed deviations <strong>of</strong> the commercial oils from the arrays<br />
is justified by the fact that the EVOO and ROO samples used<br />
to prepare these oils are characterized by different compositions<br />
<strong>of</strong> diglycerides and acidity. However, their compositions can<br />
be estimated on the basis <strong>of</strong> the calculated Mahalanobis distances<br />
from the centroid <strong>of</strong> the group <strong>of</strong> EVOO samples, which are to<br />
be compared <strong>with</strong> the corresponding distances <strong>of</strong> all the artificial<br />
mixtures in Figure 3. Two <strong>of</strong> the six BOO samples (1 and 5)<br />
show Mahalanobis distances <strong>of</strong> 286.03 and 323.45, respectively,<br />
which are <strong>with</strong>in the respective distances <strong>of</strong> the adulterated<br />
EVOO samples <strong>with</strong> 35 and 50% ROO (Table 5) and lower<br />
than the Mahalanobis distance <strong>of</strong> 405.5 for the 60% blank<br />
sample. The Mahalanobis distances <strong>of</strong> BOO samples 3 (477.8)<br />
and 6 (488.0) are close to the corresponding value (501.1) <strong>of</strong><br />
the blank mixture <strong>with</strong> 70% ROO, whereas the final commercial<br />
products 2 and 4 contain ∼80% ROO as indicated by their<br />
Mahalanobis distances <strong>of</strong> 606.4 and 560.0, respectively, which<br />
agrees closely <strong>with</strong> those <strong>of</strong> the oils in the array (Table 5) and<br />
the blank sample (586.4) <strong>of</strong> the same concentration.<br />
LITERATURE CITED<br />
(1) Owen, R. W.; Giacosa, A.; Hull, W. E.; Haubner, R.; Wurtele,<br />
G.; Spiegelhalder, B.; Bartsch, H. <strong>Olive</strong>-oil consumption and<br />
health: the possible role <strong>of</strong> antioxidants. Lancet Oncol. 2000,<br />
1, 107-112.<br />
(2) Owen, R. W.; Mier, W.; Giacosa, A.; Hull, W. E.; Spiegelhalder,<br />
B.; Bartsch, H. Identification <strong>of</strong> lignans as major components<br />
in phenolic fraction <strong>of</strong> olive oil. Clin. Chem. 2000, 976-988.<br />
(3) Owen, R. W.; Mier, W.; Giacosa, A.; Hull, W. E.; Spiegelhalder,<br />
B.; Bartsch, H. Phenolic compounds and squalene in olive oils:<br />
the concentration and antioxidant potential <strong>of</strong> total phenols,<br />
simple phenols, secoiridoids, lignans and squalene. Food Chem.<br />
Toxicol. 2000, 38, 647-659.<br />
(4) EC. Off. J. Eur. Communities 2003, Nov 6, Regulation 1989/<br />
2003.<br />
(5) Aparicio, R.; Aparicio-Ruiz, R. Authentication <strong>of</strong> vegetable oils<br />
by chromatographic techniques. J. Chromatogr. A 2000, 881,<br />
93-104.<br />
(6) Garcia-Gonzalez, D. L.; Aparicio, R. <strong>Virgin</strong> olive oil quality<br />
classification combining neural networks and MOS sensors. J.<br />
Agric. Food Chem. 2003, 51, 3515-3519.<br />
(7) Dourtoglou, V. G.; Gourtoglou, Th.; Antonopoulos, A.; Stefanou,<br />
E.; Lalas, S.; Poulos, C. <strong>Detection</strong> <strong>of</strong> olive oil adulteration using<br />
principle component analysis applied on total regio FA composition.<br />
J. Am. <strong>Oil</strong> Chem. Soc. 2003, 80, 203-208.<br />
(8) Cercaci, L.; Rodriguez-Estrada, M. T.; Lerker, G. Solid-phase<br />
extraction-thin-layer-gas chromatography method for the detection<br />
<strong>of</strong> hazelnut oil in olive oils by determination <strong>of</strong> esterified<br />
sterols. J. Chromatogr. A 2003, 985, 211-220.<br />
(9) Marcos Lorenzo, I.; Luis Perez Pavon, J.; Fernandez Laespada,<br />
E.; Garcia Pinto, C.; Moreno Cordero, B. <strong>Detection</strong> <strong>of</strong> adulterants<br />
in olive by headspace-mass spectrometry. J. Chromatogr. A 2002,<br />
945, 221-230.<br />
(10) Angerosa, F.; Camera, L.; Cumitini, S.; Gleixner, G.; Reniero,<br />
F. Carbon stable isotopes and olive oil adulteration <strong>with</strong> pomace<br />
oil. J. Agric. Food Chem. 1997, 45, 3044-3048.<br />
(11) Downey, G.; McIntyre, P.; Davies, A. N. Detecting sunflower<br />
oil adulteration in extra virgin olive oils from the eastern<br />
Mediterranean by visible and near-infrared spectroscopy. J.<br />
Agric. Food Chem. 2002, 50, 5520-5525.<br />
(12) Baeten, V.; Meurens, M.; Morales, M. T.; Aparicio, R. <strong>Detection</strong><br />
<strong>of</strong> virgin olive oil adulteration by Fourier transform Raman<br />
spectroscopy. J. Agric. Food Chem. 1996, 44, 2225-2230.<br />
(13) Lai, Y. W.; Kemsley, E.; Wilson, R. H. Potential <strong>of</strong> Fourier<br />
transform infrared spectroscopy for the authentication <strong>of</strong> vegetable<br />
oils. J. Agric. Food Chem. 1994, 42, 1154-1159.
2816 J. Agric. Food Chem., Vol. 53, No. 8, 2005 Fragaki et al.<br />
(14) Lai, Y. W.; Kemsley, E.; Wilson, R. H. Quantitative analysis <strong>of</strong><br />
potential adulteration <strong>of</strong> extra virgin olive oil using infrared<br />
spectroscopy. Food Chem. 1995, 53, 95-98.<br />
(15) Baeten, V.; Dardenne, P.; Aparicio, R. Interpretation <strong>of</strong> Fourier<br />
transform spectra <strong>of</strong> the unsaponifiable matter in a selection <strong>of</strong><br />
edible oils. J. Agric. Food Chem. 2001, 49, 5096-5107.<br />
(16) Marigheto, N. A.; Kemsley, E. K.; Defernez, M.; Wilson, R. H.<br />
A comparison <strong>of</strong> mid-Infrared and Raman spectroscopies for the<br />
authentication <strong>of</strong> edible oils. J. Am. <strong>Oil</strong> Chem. Soc. 1998, 75,<br />
987-992.<br />
(17) Zamora, R.; Gomez, G.; Hidalgo, F. J. Classification <strong>of</strong> vegetable<br />
oils by high-resolution 13 C NMR spectroscopy using chromatographically<br />
obtained oil fractions. J. Am. <strong>Oil</strong> Chem. Soc. 2002,<br />
79, 267-272.<br />
(18) Fauhl, C.; Reniero, F.; Guillou. 13 C NMR as a tool for the<br />
analysis <strong>of</strong> mixtures <strong>of</strong> virgin olive oils <strong>of</strong> different botanical<br />
origin. Magn. Reson. Chem. 2000, 38, 436-443.<br />
(19) Mannina, L.; Patumi, M.; Fiordiponti, P.; Emanuele, M. C.;<br />
Segre, A. L. <strong>Olive</strong> and hazelnut oils: A study by high-field 1 H<br />
NMR and gas chromatography. Ital. J. Food Sci. 1999, 11, 139-<br />
149.<br />
(20) Vigli, G.; Philippidis, A.; Spyros, A.; Dais, P. Classification <strong>of</strong><br />
edible oils by employing 31 P and 1 H NMR spectroscopy in<br />
combination <strong>with</strong> multivariate statistical analysis. A proposal for<br />
detection <strong>of</strong> seed oil adulteration in virgin olive oils. J. Agric.<br />
Food Chem. 2003, 51, 5715-5722.<br />
(21) Spyros, A.; Dais, P. Application <strong>of</strong> 31 P NMR spectroscopy in<br />
food analysis. Quantitative determination <strong>of</strong> the mono- and<br />
diglyceride composition <strong>of</strong> olive oils. J. Agric. Food Chem. 2000,<br />
48, 802-805.<br />
(22) Sacchi, R.; Addeo, F.; Paolillo, L. 1 H and 13 C NMR <strong>of</strong> virgin<br />
oil. An overview. Magn. Reson. Chem. 1997, 35, 5133-5145.<br />
(23) Zwierzak, A. Cyclic organophosphorus compounds. I. Synthesis<br />
and infrared spectral studies <strong>of</strong> cyclic hydrogen phosphites and<br />
thiophosphites. Can. J. Chem. 1967, 45, 2501-2512.<br />
(24) Perez-Camino, M. C.; Modera, W.; Cert, A. Effects <strong>of</strong> olive oil<br />
fruit quality and oil storage practices on the diacylglycerols<br />
content <strong>of</strong> virgin olive oils. J. Agric. Food Chem. 2001, 49, 699-<br />
704.<br />
(25) Sacchi, R.; Paolillo, L.; Giudicianni, I.; Addeo, F. Rapid 1 H-<br />
NMR determination <strong>of</strong> 1,2 and 1,3 diglycerides in virgin olive<br />
oils. Ital. J. Food Sci. 1991, 3, 253-262.<br />
(26) Fronimaki, P.; Spyros, A.; Christophoridou, S.; Dais, P. Determination<br />
<strong>of</strong> the diglyceride content in Greek virgin olive oils<br />
and some commercial olive oils by employing 31 P NMR<br />
spectroscopy. J. Agric. Food Chem. 2002, 50, 2207-2213.<br />
(27) Vlahov, G. Improved quantitative 13 C nuclear magnetic resonance<br />
criteria for determination <strong>of</strong> grades <strong>of</strong> virgin olive oils. The<br />
normal ranges for diglycerides in olive oil. J. Am. <strong>Oil</strong> Chem.<br />
Soc. 1996, 73, 1201-1203.<br />
(28) Spyros, A.; Philippidis, A.; Dais, P. Kinetics <strong>of</strong> diglyceride<br />
formation and isomerization in virgin olive oils by employing<br />
31<br />
P NMR spectroscopy. Formulation <strong>of</strong> a quantitative measure<br />
to assess olive oil storage history. J. Agric. Food Chem. 2004,<br />
52, 157-164.<br />
Received for review June 9, 2004. Revised manuscript received January<br />
31, 2005. Accepted February 2, 2005. We thank the Greek Ministry <strong>of</strong><br />
Education for financial support through the B′ EPEAEK Graduate<br />
Program and the Program Hrakleitos. Also, we are indebted to Project<br />
4.3.6.2B EPAN funded by the Greek General Secretariat <strong>of</strong> Research<br />
and Technology and the European Union.<br />
JF040279T