Survey Design and Response Rates: - Cornell University Division of ...
Survey Design and Response Rates: - Cornell University Division of ...
Survey Design and Response Rates: - Cornell University Division of ...

Create successful ePaper yourself
Turn your PDF publications into a flip-book with our unique Google optimized e-Paper software.
Improving <strong>Response</strong> <strong>Rates</strong> through Better <strong>Design</strong>:<br />
Rethinking a Web-Based <strong>Survey</strong> Instrument<br />
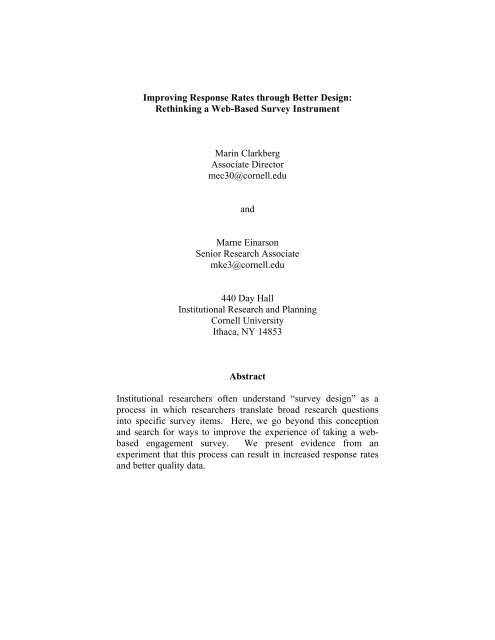
Marin Clarkberg<br />
Associate Director<br />
mec30@cornell.edu<br />
<strong>and</strong><br />
Marne Einarson<br />
Senior Research Associate<br />
mke3@cornell.edu<br />
440 Day Hall<br />
Institutional Research <strong>and</strong> Planning<br />
<strong>Cornell</strong> <strong>University</strong><br />
Ithaca, NY 14853<br />
Abstract<br />
Institutional researchers <strong>of</strong>ten underst<strong>and</strong> “survey design” as a<br />
process in which researchers translate broad research questions<br />
into specific survey items. Here, we go beyond this conception<br />
<strong>and</strong> search for ways to improve the experience <strong>of</strong> taking a webbased<br />
engagement survey. We present evidence from an<br />
experiment that this process can result in increased response rates<br />
<strong>and</strong> better quality data.
Introduction<br />
<strong>Cornell</strong> <strong>University</strong> has administered a survey <strong>of</strong> student engagement four times<br />
since 2003. This survey, titled the Enrolled Student <strong>Survey</strong> or the ESS, was developed in<br />
consortium with 30 other elite institutions <strong>and</strong> included over 250 individual items. Over<br />
the course <strong>of</strong> the four survey administrations, <strong>Cornell</strong>’s response rate declined<br />
substantially, from 47% in 2003 to 29% in 2007.<br />
In an effort to address declining response rates on our campus, we considered the<br />
role <strong>of</strong> survey instrument design <strong>and</strong> how it can contribute positively or negatively to the<br />
experience <strong>of</strong> completing a web-based survey <strong>of</strong> student engagement. In this paper, we<br />
describe how we: reduced the overall length <strong>of</strong> the survey; enhanced its visual appeal;<br />
<strong>and</strong> increased students’ perceptions that the survey was relevant to their experiences.<br />
Evidence from an experiment on our campus indicates that the new survey generates a<br />
higher response rate with better quality data.<br />
Conceptual Approach<br />
Existing research on survey design emphasizes that potential respondents evaluate<br />
signals from the survey instrument itself in deciding whether to respond. We focused on<br />
the following four considerations:<br />
1) <strong>Survey</strong> length. The perceived burden <strong>of</strong> responding to a survey is tied directly to<br />
its overall length (Bogen, 1996; H<strong>and</strong>werk, Carson, & Blackwell, 2000) as well as the<br />
number <strong>of</strong> questions that appear per web screen (Schonlau, Fricker, & Elliott, 2002). In<br />
the course <strong>of</strong> this project, we reduced a survey with over 250 items to one with fewer<br />
1
than 100. In addition, we searched for ways to signal that the survey was not burdensome<br />
to complete, <strong>and</strong> that progress through the survey was swift (e.g. Schonlau et al., 2002).<br />
2) <strong>Survey</strong> content. Researchers are advised to use a “top down” approach to<br />
survey construction where underlying research questions are identified <strong>and</strong> relevant<br />
survey questions follow. While there is considerable merit in this theory driven<br />
approach, we note that surveys enjoy higher response rates when their contents are seen<br />
as relevant to the respondents’ own experiences <strong>and</strong> values (Dillman, 1991; Groves et al.,<br />
2000; Groves, Presser & Dipko, 2004). To enhance the salience <strong>of</strong> our survey, we asked<br />
our interview participants what they thought <strong>of</strong> the questions we had developed <strong>and</strong> what<br />
they wanted to tell us in a survey. Consequently, we added a h<strong>and</strong>ful <strong>of</strong> new questions to<br />
the instrument.<br />
3) Visual appeal. When survey design is viewed as relating narrowly to the choice<br />
<strong>and</strong> wording <strong>of</strong> questions, insufficient thought may be given to the process <strong>of</strong> converting<br />
those items into a web-based survey instrument. Yet extant research suggests the visual<br />
design <strong>of</strong> a web-based survey affects response rates (Couper, Traugott & Lamias, 2001;<br />
Dillman, 2000; Dillman, Tortora, Conradt & Bowker, 1998). In this project, we paid a<br />
great deal <strong>of</strong> attention to the overall look <strong>and</strong> feel <strong>of</strong> the survey, <strong>and</strong> responded to student<br />
feedback regarding the appearance <strong>of</strong> the pages.<br />
4) Delivery <strong>of</strong> survey results. Providing respondents with survey results can help<br />
build rapport with respondents (Cook, Heath & Thompson, 2000; Groves, Singer &<br />
Corning, 2000; Ribisl et al., 1996). In this project, we took advantage <strong>of</strong> what the web<br />
makes possible, using Cold Fusion s<strong>of</strong>tware to incorporate instant results into the survey-<br />
2
taking process. In this way, we immediately rewarded survey respondents with a h<strong>and</strong>ful<br />
<strong>of</strong> findings at key points.<br />
Process<br />
In consortium with 30 other elite institutions, <strong>Cornell</strong> <strong>University</strong> had administered<br />
the ESS four times since 2003. That survey included over 250 individual items, <strong>and</strong> had<br />
gone through one substantial revision (before the 2007 administration). While we had<br />
achieved a respectable 47% response rate in 2003, our 29% response rate in 2007<br />
enhanced our desire to lessen the burden the survey placed on students.<br />
We held a day-<strong>and</strong>-a-half face-to-face meeting with like-minded institutional<br />
research colleagues from peer institutions to establish the foundations for moving the<br />
project forward. Specifically, we held a sustained dialogue concerning, first, the core<br />
objectives <strong>of</strong> our institutions <strong>and</strong> their intersections <strong>and</strong>, second, the criteria we should<br />
use in deciding whether or not a specific item should be included in this survey.<br />
As an illustrative example <strong>of</strong> “core objectives”: there was consensus that our<br />
institutions conscientiously emphasize vibrant intellectual communities (beyond the<br />
classroom), including: residential communities that foster the exchange <strong>of</strong> ideas,<br />
interactions with diverse kinds <strong>of</strong> students, <strong>and</strong> meaningful discussions with faculty.<br />
Thus, a survey that would enable us to hold ourselves accountable for the things we<br />
believe we should be doing would include measures relevant to intellectual communities.<br />
The criteria we adopted to make decisions as to whether or not any specific item<br />
would appear on the new survey included:<br />
3
• The survey item should clearly relate to our shared research agenda.<br />
• The survey item reflects the principles <strong>of</strong> quality survey design.<br />
• The survey is <strong>of</strong> interest to several institutions.<br />
• Previous use <strong>of</strong> the survey item produced results <strong>of</strong> practical importance<br />
on our campuses.<br />
• Prior analyses have demonstrated that the item has a proven track record<br />
statistically: it has sufficient variance; it does not suffer from high itemnonresponse;<br />
it is not redundant with another indicator; it is an important<br />
predictor <strong>of</strong> key outcomes; <strong>and</strong>/or outcomes have changed over time such<br />
that timely data provide new insights.<br />
• The wording <strong>and</strong> interpretation <strong>of</strong> new survey items have been thoroughly<br />
explored <strong>and</strong> pre-tested with students.<br />
• There is utility in time-series data: we should not change ESS question<br />
wording or response categories without a compelling reason. That being<br />
said, the utility <strong>of</strong> legacy items needs to be assessed.<br />
With careful attention to both our core objectives <strong>and</strong> our agreed upon criteria for<br />
inclusion, an engaged working group reduced the 250 item survey to a core <strong>of</strong><br />
approximately 75 measures (including 13 measures—like race <strong>and</strong> gender—which could<br />
be supplied from administrative files when that is a possibility).<br />
With input from a graphic designer, we worked with a <strong>Cornell</strong>-based survey service<br />
to mock-up a version <strong>of</strong> the survey instrument to use for the purposes <strong>of</strong> testing <strong>and</strong><br />
evaluation. We then recruited students—with a $20 payment for a one-hour interview—<br />
to come to our <strong>of</strong>fice to take the survey <strong>and</strong> provide their c<strong>and</strong>idate feedback about the<br />
experience <strong>of</strong> taking the survey. In total, we interviewed nineteen undergraduate<br />
students. After the feedback received in the first ten interviews, we made substantial<br />
revisions to both the aesthetics <strong>and</strong> the substance <strong>of</strong> the evolving survey instrument. This<br />
revised instrument was then pretested with nine more students, with only minor changes<br />
resulting.<br />
4
As a final step in our research, we took the survey instrument that resulted from this<br />
process—now dubbed “PULSE”—<strong>and</strong> tested it head-to-head with the original ESS<br />
instrument. In this experiment, we drew a r<strong>and</strong>om sample <strong>of</strong> 300 summer session<br />
students <strong>and</strong> r<strong>and</strong>omly assigned 100 to take the original ESS just as it had been<br />
administered in the spring semester <strong>of</strong> 2007 <strong>and</strong> 200 students to take the new PULSE.<br />
Results from that experiment are described in the section titled, “Did it Work,” below.<br />
<strong>Survey</strong> Redesign: A Look at Page 1<br />
Figures 1 <strong>and</strong> 2 are screen captures <strong>of</strong> the ESS (the original instrument) <strong>and</strong> PULSE<br />
(the revised instrument) respectively. In glancing across the figures, perhaps the first<br />
thing to note is that the first page <strong>of</strong> the ESS is notably longer than the first page <strong>of</strong> the<br />
PULSE. This is partly a reflection <strong>of</strong> the fact that the entire ESS is longer than the<br />
PULSE, but it is also the case that the single longest page <strong>of</strong> the ESS is the first page,<br />
with a total <strong>of</strong> 42 individual items. In contrast, we conscientiously elected to make the<br />
first page <strong>of</strong> the PULSE particularly short in an attempt to signal with the first impression<br />
that the PULSE was not a particularly lengthy or burdensome endeavor.<br />
A second difference between the instruments is that we replaced the simple<br />
mechanical “progress bar” on the ESS with a more elaborate header on the PULSE. The<br />
PULSE header is not navigable; clicking on it will not take you to a different page <strong>of</strong> the<br />
survey. Rather, the goal <strong>of</strong> the header is to alleviate anxiety about “where the survey is<br />
going” by providing a succinct outline <strong>of</strong> the entire scope <strong>of</strong> the instrument.<br />
Third, on the basis <strong>of</strong> student feedback, we replaced the black grid used on the ESS<br />
with a white grid <strong>and</strong> increased the spacing between items.<br />
5
Fourth, <strong>and</strong> perhaps most substantively, the two instrument use different lead-<strong>of</strong>f<br />
questions. This is not because the surveys differed substantively in content; in fact, the<br />
PULSE includes several <strong>of</strong> the items used to kick-<strong>of</strong>f the ESS. Rather, this was a strategic<br />
choice in recognition <strong>of</strong> work by Dillman <strong>and</strong> others which indicates that the first<br />
question on a survey signals the nature <strong>of</strong> the survey <strong>and</strong> its salience to the respondent.<br />
With the PULSE, we elected to begin by asking for students’ generalized opinions <strong>of</strong><br />
their experience at the university rather than simply asking for unreflective reporting <strong>of</strong><br />
behaviors. Further, given substantial evidence that academic engagement is positively<br />
correlated with survey response rates, we sought to avoid reinforcing this tendency by<br />
introducing the survey with a section on “Academics.”<br />
What Student Didn’t Want to Tell Us, <strong>and</strong> What They Did<br />
In our initial extended interviews with students taking the PULSE, the single most<br />
common complaint with the survey had to do with the bank <strong>of</strong> “time budget” questions.<br />
On the ESS, this bank is launched with the following stem: “During the current school<br />
year, approximately how many hours do you spend during a typical week doing the<br />
following activities.” As illustrated in Figure 3, this stem is followed by 28 individual<br />
items, <strong>and</strong> students are asked to respond regarding the time spent on each item using one<br />
<strong>of</strong> ten response categories.<br />
In the PULSE, we limited ourselves to asking about eight behaviors, but students<br />
still told us unequivocally that it was both daunting to be faced with a “sea <strong>of</strong> bubbles”<br />
ten—or even eight—columns wide <strong>and</strong> quite burdensome to try to have any precision in<br />
their estimates <strong>of</strong> how much time they spent “exercising” or “hanging out.” Indeed, those<br />
6
<strong>of</strong> us who have had the experience <strong>of</strong> having to account for our time use—such as for<br />
reporting purposes at work—may be able to relate to their irritation on this note.<br />
Accordingly, on the PULSE we sacrificed some precision <strong>and</strong> limited ourselves to just<br />
five broad response categories (see Figure 4). We were able to get more coverage out <strong>of</strong><br />
five categories by dividing the time-use questions across two different banks, with<br />
behaviors tending to occupy a large amount <strong>of</strong> time (such as studying) using a different<br />
response scale than behaviors typically consuming less time (such as community service).<br />
As a part <strong>of</strong> the sustained interviews with our nineteen pre-testers, we asked<br />
respondents if there were things that they felt we omitted from the survey—things that<br />
they would want to tell us about their undergraduate experience that we had not asked<br />
about.<br />
More than half <strong>of</strong> our pre-testers indicated in one way or another that they wanted<br />
to tell us more about what is like to be a <strong>Cornell</strong> student. Specifically, they wanted to tell<br />
us that they work hard, that they sacrifice sleep, <strong>and</strong> that they are stressed. Further, they<br />
wanted to tell us not just about binge drinking—a single question on the survey—but<br />
about the role <strong>of</strong> alcohol in social life <strong>and</strong> how they have managed to navigate that.<br />
Finally, they wanted to tell us about the importance <strong>of</strong> Greek life on <strong>Cornell</strong>’s campus.<br />
In response to this feedback, we dismissed our own hesitancy to inquire into quite<br />
personal issues such as drinking <strong>and</strong> mental health <strong>and</strong> added new questions that tapped<br />
these aspects <strong>of</strong> undergraduate life.<br />
7
Web <strong>Survey</strong>s: More than a Paper <strong>Survey</strong> Put on the Web<br />
As we searched for ways to improve the experience <strong>of</strong> taking the new PULSE<br />
survey, we invited ourselves to think about how we could use the fact that is a web-based<br />
survey to our advantage. As one <strong>of</strong> our early collaborators suggested, we should think<br />
about a web survey as being “more than just a paper survey put on the web.” We seized<br />
three opportunities.<br />
First, entirely generic survey instruments that ask about “your institution” or “your<br />
college” may reflect the economies <strong>of</strong> scale inherent in the mass production <strong>of</strong> paper<br />
surveys. With the web, however, the costs <strong>of</strong> customization are substantially less. In the<br />
PULSE, we ask about satisfaction with “<strong>Cornell</strong> <strong>University</strong>” rather than with “your<br />
institution,” <strong>and</strong> we expect that our peer institutions will do similarly.<br />
Second, we have tended to use r<strong>and</strong>om draws for prizes as incentives for our<br />
surveys. Our past practice had been to wait until the survey closes to draw winners. The<br />
trouble with this practice, however, is that it separates the behavior <strong>and</strong> its reward<br />
(stimulus <strong>and</strong> response) by days or even weeks. Indeed, we have contacted prize winners<br />
in the past who have told us they had completely forgotten they had taken the survey!<br />
While this might be the best possible model for drawing winners with a paper survey, the<br />
web makes it possible to program lottery selection right into the survey itself. Thus, for<br />
the PULSE, we indicated that every tenth respondent would know instantly if they had<br />
won $20. By notifying respondents at the time they complete the survey, we create the<br />
possibility that they will share their delight over winning with other students thereby<br />
encouraging others to participate in the survey as well.<br />
8
Third, there is considerable evidence in the literature that respondents want to hear<br />
about the results <strong>of</strong> the study in which they participated. Indeed, our students told us as<br />
much as well. However, the effective delivery <strong>of</strong> study findings has proven to be more<br />
problematic than one might immediately assume. Further, as with post-survey lottery<br />
drawings, the lag between taking the paper survey <strong>and</strong> receiving a summary <strong>of</strong> findings<br />
can be substantial. Here again, the power <strong>of</strong> computing can be used to address the issue.<br />
At three points in the PULSE, we <strong>of</strong>fered students “instant results” about a question they<br />
had already answered. For example, after responding to a question about their own<br />
satisfaction on one page <strong>of</strong> the survey, respondents are told on the next page, “X% <strong>of</strong><br />
students who have taken the PULSE so far also rated their entire educational experience<br />
at <strong>Cornell</strong> as ‘Excellent.” And, upon hitting “submit” on the last page <strong>of</strong> the survey,<br />
respondents are provided a full page <strong>of</strong> bar charts <strong>and</strong> pie graphs portraying the responses<br />
“thus far” to key items <strong>of</strong> interest on the PULSE.<br />
We also found that on our campus, students were sensitive to the notion <strong>of</strong> going to<br />
a URL outside <strong>of</strong> <strong>Cornell</strong> to take a <strong>Cornell</strong> survey. By hosting the survey ourselves –<br />
rather than using a single survey provider for the whole consortium – we were able to<br />
allay concerns that the survey was anything other than a <strong>Cornell</strong>-based effort to inform<br />
<strong>Cornell</strong> administrators about the <strong>Cornell</strong> experience.<br />
Did it Work: Impact on <strong>Response</strong> <strong>Rates</strong> <strong>and</strong> Data Quality<br />
As described above, in order to test whether our efforts would make a difference in<br />
the response rate to the survey, we drew a r<strong>and</strong>om sample <strong>of</strong> 300 summer session<br />
students <strong>and</strong> r<strong>and</strong>omly assigned 100 to take the original ESS <strong>and</strong> 200 students to take the<br />
9
new PULSE. Nearly identical emails were sent from the Dean <strong>of</strong> Students inviting the<br />
students to take the surveys; the only differences in the text were the names <strong>of</strong> the<br />
surveys <strong>and</strong> the estimated time it would take to complete the survey. Thus, 100 students<br />
were asked to complete the ESS with instructions that the “The questionnaire typically<br />
takes 20 to 25 minutes to complete,” <strong>and</strong> 200 students were invited to take the PULSE<br />
with the comment “The survey typically takes around 10 minutes to complete.”<br />
Under any definition <strong>of</strong> “survey response,” the PULSE fared better than the ESS.<br />
For example, if we define a student as a respondent if he or she answered just one or<br />
more questions, the PULSE attained a response rate <strong>of</strong> 47%, while the ESS response rate<br />
was just 39%.<br />
More remarkable, however, is the data we observed on persistence through the<br />
survey, as is illustrated in Figures 5 <strong>and</strong> 6. Aside from the sentence in the invitation<br />
email cluing students to the estimated length <strong>of</strong> time to take the survey, there is little<br />
reason to expect that fewer students would even open the ESS as compared to the<br />
PULSE. Thus we were somewhat surprised to find any difference at all in the percent <strong>of</strong><br />
students who even entered the survey (48% <strong>of</strong> those taking the revised PULSE as<br />
compared to 42% taking the original ESS). 1 The difference grew from there, however:<br />
45% <strong>of</strong> the sample asked to take the PULSE reached the final page <strong>of</strong> the survey,<br />
compared to just 36% <strong>of</strong> those taking the ESS. Moreover, among those who responded,<br />
1 The programming for the ESS did not allow us to observe how <strong>of</strong>ten a student followed the link to the<br />
survey <strong>and</strong> then left without any further action. However, we did observe that three <strong>of</strong> the 110 students<br />
opened the survey, went to the bottom <strong>of</strong> page one without answering any questions <strong>and</strong> clicked the submit<br />
button there without going on to answer any later questions or submit any other pages. Only one student<br />
acted analogously with the PULSE.<br />
10
nearly all (94%) <strong>of</strong> those answering the PULSE provided answers for 90% or more <strong>of</strong> the<br />
questions asked, compared to just 60% <strong>of</strong> ESS respondents doing so.<br />
An analysis not shown here suggests that PULSE respondents were also less select<br />
vis-à-vis non-respondents than the ESS respondents as compared to non-respondents.<br />
That is: the gap between the GPAs <strong>and</strong> SAT scores <strong>of</strong> respondents <strong>and</strong> non-respondents<br />
was substantially smaller for the PULSE group than for the ESS sample. This suggests<br />
that the PULSE data may be more representative <strong>of</strong> the population as a whole.<br />
Implications<br />
Inarguably, the content <strong>of</strong> a survey should be dictated, first <strong>and</strong> foremost, by the<br />
research questions the instrumented is intended to address. Clearly articulating the core<br />
research objectives underpinning a survey <strong>and</strong> establishing criteria to evaluate the utility<br />
<strong>of</strong> specific survey items are two important steps in developing surveys that are both<br />
relevant to our purposes <strong>and</strong> concise. Like other researchers (e.g., Bogen, 1996;<br />
H<strong>and</strong>werk et al., 2000; Schonlau et al., 2002), we found that students are quite sensitive<br />
to the effort required to participate in a survey – whether measured by estimated time for<br />
completion, total number <strong>of</strong> questions, or the complexity <strong>of</strong> the response categories<br />
employed in particular questions. Dropping survey response rates suggest that our<br />
students are less <strong>and</strong> less willing to give up their time to complete a survey. Together,<br />
these points argue for being very sure that we are asking the right questions on our<br />
surveys <strong>and</strong> only those questions that really need to be asked.<br />
But survey design should not be driven by content considerations alone. We may<br />
know what we want to ask our students, but how we present those questions within a web<br />
11
instrument may well affect the likelihood that students will choose to participate in the<br />
survey <strong>and</strong> the quality <strong>of</strong> the data we ultimately collect. Consistent with past research<br />
(e.g., Couper et al., 2001; Dillman, 2000), our study found that visual design elements –<br />
such as the borders <strong>and</strong> spacing used in questions, <strong>and</strong> the number <strong>of</strong> questions presented<br />
per page – elicited strong reactions from our pretesters. And ultimately, differences in<br />
survey length <strong>and</strong> visual design seem to have accounted for significant differences in the<br />
proportion <strong>of</strong> students responding to the original <strong>and</strong> revised versions <strong>of</strong> our survey, as<br />
well as differences in the proportion <strong>of</strong> survey questions completed. Visual design<br />
elements are most under our control when we are developing local survey instruments.<br />
Even when using externally-authored web-based instruments where the content has been<br />
predetermined, there may be opportunities for visually presenting this content in ways<br />
that can positively affect survey participation <strong>and</strong> for hosting the survey on a local<br />
domain. If so, the cost <strong>of</strong> programming such changes would seem to be well worth the<br />
potential benefits in survey response <strong>and</strong> completion rates.<br />
12
References<br />
Bogen, K. (1996). The effect <strong>of</strong> questionnaire length on response rates: A review <strong>of</strong> the<br />
literature. Washington, C.D.: U.S. Census Bureau.<br />
Cook, C., Heath, F., & Thompson, R. (2000). A meta-analysis <strong>of</strong> response rates in Web- or<br />
Internet-based surveys. Educational & Psychological Measurement, 60(6), 821-836.<br />
Couper, M. P., Traugott, M. W., & Lamias, M. J. (2001). Web survey design <strong>and</strong><br />
administration. Public Opinion Quarterly, 65(2), 230-253.<br />
De Leeuw, E., & Heer, W. (2002). Trends in household survey nonresponse: A longitudinal<br />
<strong>and</strong> international comparison. In R. M. Groves, D. A. Dillman, J. L. Eltinge, & R. J. A.<br />
Little, (Eds.), <strong>Survey</strong> Nonresponse (pp. 41-54). New York: John Wiley & Sons.<br />
Dillman, D. A. (1991). The design <strong>and</strong> administration <strong>of</strong> mail surveys. Annual Review <strong>of</strong><br />
Sociology, 17, 225-249.<br />
Dillman, D. A. (2000). Mail <strong>and</strong> internet surveys: The tailored design method (2 nd ed.). New<br />
York: John Wiley & Sons.<br />
Dillman, D. A., Tortora, R. D., Conradt, J., & Bowker, D. K. (1998). Influence <strong>of</strong> plain vs.<br />
fancy design on response rates for web surveys. Paper presented at the Joint Statistical<br />
Meetings, Dallas, TX.<br />
Groves, R. M., Presser, S., & Dipko, S. (2004). The role <strong>of</strong> topic interest in survey<br />
participation decisions. Public Opinion Quarterly, 68(1), 2-31.<br />
Groves, R. M., Singer, E., & Corning, A. (2000). Leverage-saliency theory <strong>of</strong> survey<br />
participation. Public Opinion Quarterly, 64(3), 299-308.<br />
H<strong>and</strong>werk, P., Carson, C., & Blackwell, K. (2000). On-line versus paper-<strong>and</strong>-pencil<br />
surveying <strong>of</strong> stuents: A case study. Paper presented at the Annual Forum <strong>of</strong> the<br />
Association for Institutional Research, Cincinnati, OH.<br />
Ribisl, K. M., Walton, M. A., Mowbray, C. T., Luke, D. A., Davidson, W. S., & Bootsmiller,<br />
B. J. (1996). Minimizing participant attrition in panel studies through the use <strong>of</strong> effective<br />
retention <strong>and</strong> tracking strategies: Review <strong>and</strong> recommendations. Evaluation <strong>and</strong> Program<br />
Planning, 19(1), 1-25.<br />
Schonlau, M., Fricker, R. D., & Elliott, Marc N. (2002). Conducting research surveys via e-<br />
mail <strong>and</strong> the Web. Santa Monica, CA: R<strong>and</strong> Corporation<br />
13
Figure 1. Page 1 <strong>of</strong> Enrolled Student <strong>Survey</strong> (ESS)<br />
14
Figure 2. Page 1 <strong>of</strong> the PULSE<br />
15
Figure 3. The Time-Budget Bank on the ESS<br />
16
Figure 4. The Time-Budget Banks on the PULSE<br />
Page 2:<br />
Page 5:<br />
17
Figure 5.<br />
Percent <strong>of</strong> Sample Entering, Submitting Page 2 <strong>and</strong> Submitting Final<br />
Page, by <strong>Survey</strong><br />
60.0<br />
50.0<br />
47.7<br />
PULSE<br />
46.3<br />
45.0<br />
40.0<br />
ESS<br />
41.8<br />
Percent<br />
30.0<br />
37.3<br />
35.5<br />
20.0<br />
10.0<br />
0.0<br />
Entered Finished p2 Finished survey<br />
18
Figure 6.<br />
Histogram <strong>of</strong> Proportion <strong>of</strong> Questions Answered, by <strong>Survey</strong><br />
100<br />
ESS<br />
PULSE<br />
80<br />
% <strong>of</strong> respondents<br />
60<br />
40<br />
20<br />
0<br />
1 10 20 30 40 50 60 70 80 90 100<br />
10 20 30 40 50 60 70 80 90 100<br />
Proportion <strong>of</strong> Questions Answered<br />
19