Report 45 Task 6 Environmental Evaluation Luxor Demo Site
Report 45 Task 6 Environmental Evaluation Luxor Demo Site
Report 45 Task 6 Environmental Evaluation Luxor Demo Site
You also want an ePaper? Increase the reach of your titles
YUMPU automatically turns print PDFs into web optimized ePapers that Google loves.
<strong>Task</strong> 6. <strong>Environmental</strong> <strong>Evaluation</strong> of Using Treated Wastewater in Agriculture<br />
2.2.3. Water Quality Monitoring Results<br />
Routine samples of TWW were collected from the treatment plant and sent to different<br />
laboratories for testing during the program. Table 5 presents summary of the test schedule.<br />
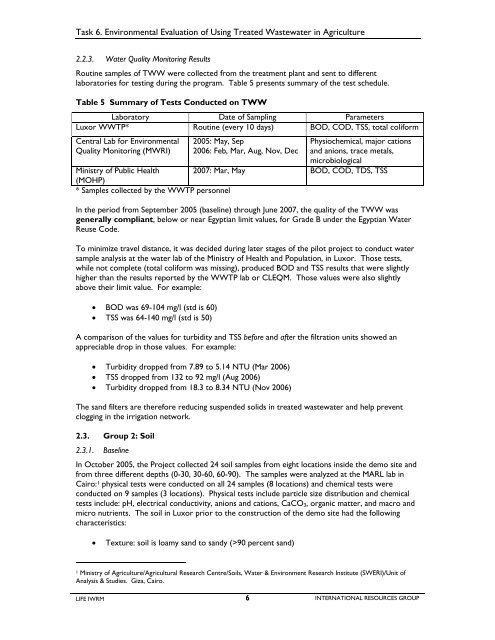
Table 5 Summary of Tests Conducted on TWW<br />
Laboratory Date of Sampling Parameters<br />
<strong>Luxor</strong> WWTP* Routine (every 10 days) BOD, COD, TSS, total coliform<br />
Central Lab for <strong>Environmental</strong><br />
Quality Monitoring (MWRI)<br />
2005: May, Sep<br />
2006: Feb, Mar, Aug, Nov, Dec<br />
Physiochemical, major cations<br />
and anions, trace metals,<br />
microbiological<br />
Ministry of Public Health 2007: Mar, May BOD, COD, TDS, TSS<br />
(MOHP)<br />
* Samples collected by the WWTP personnel<br />
In the period from September 2005 (baseline) through June 2007, the quality of the TWW was<br />
generally compliant, below or near Egyptian limit values, for Grade B under the Egyptian Water<br />
Reuse Code.<br />
To minimize travel distance, it was decided during later stages of the pilot project to conduct water<br />
sample analysis at the water lab of the Ministry of Health and Population, in <strong>Luxor</strong>. Those tests,<br />
while not complete (total coliform was missing), produced BOD and TSS results that were slightly<br />
higher than the results reported by the WWTP lab or CLEQM. Those values were also slightly<br />
above their limit value. For example:<br />
• BOD was 69-104 mg/l (std is 60)<br />
• TSS was 64-140 mg/l (std is 50)<br />
A comparison of the values for turbidity and TSS before and after the filtration units showed an<br />
appreciable drop in those values. For example:<br />
• Turbidity dropped from 7.89 to 5.14 NTU (Mar 2006)<br />
• TSS dropped from 132 to 92 mg/l (Aug 2006)<br />
• Turbidity dropped from 18.3 to 8.34 NTU (Nov 2006)<br />
The sand filters are therefore reducing suspended solids in treated wastewater and help prevent<br />
clogging in the irrigation network.<br />
2.3. Group 2: Soil<br />
2.3.1. Baseline<br />
In October 2005, the Project collected 24 soil samples from eight locations inside the demo site and<br />
from three different depths (0-30, 30-60, 60-90). The samples were analyzed at the MARL lab in<br />
Cairo: 1 physical tests were conducted on all 24 samples (8 locations) and chemical tests were<br />
conducted on 9 samples (3 locations). Physical tests include particle size distribution and chemical<br />
tests include: pH, electrical conductivity, anions and cations, CaCO 3, organic matter, and macro and<br />
micro nutrients. The soil in <strong>Luxor</strong> prior to the construction of the demo site had the following<br />
characteristics:<br />
• Texture: soil is loamy sand to sandy (>90 percent sand)<br />
1 Ministry of Agriculture/Agricultural Research Centre/Soils, Water & Environment Research Institute (SWERI)/Unit of<br />
Analysis & Studies. Giza, Cairo.<br />
LIFE IWRM 6<br />
INTERNATIONAL RESOURCES GROUP


