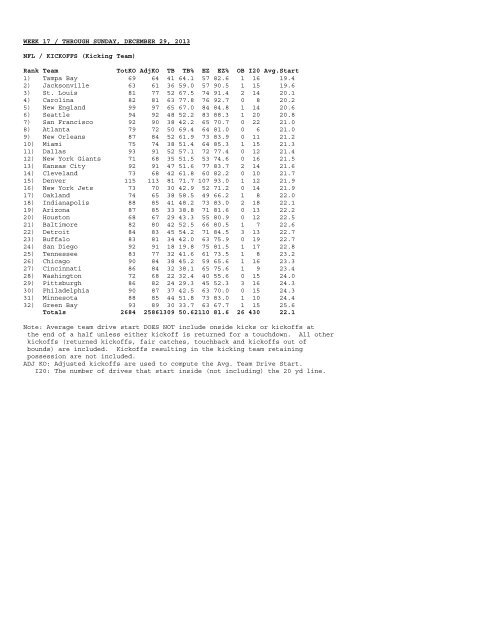
WEEK 17 / THROUGH SUNDAY, DECEMBER 29, 2013 NFL / KICKOFFS (Kicking Team) Rank Team TotKO AdjKO TB TB% EZ EZ% OB I20 Avg.Start 1) Tampa Bay 69 64 41 64.1 57 82.6 1 16 19.4 2) Jacksonville 63 61 36 59.0 57 90.5 1 15 19.6 3) St. Louis 81 77 52 67.5 74 91.4 2 14 20.1 4) Carolina 82 81 63 77.8 76 92.7 0 8 20.2 5) New England 99 97 65 67.0 84 84.8 1 14 20.6 6) Seattle 94 92 48 52.2 83 88.3 1 20 20.8 7) San Francisco 92 90 38 42.2 65 70.7 0 22 21.0 8) Atlanta 79 72 50 69.4 64 81.0 0 6 21.0 9) New Orleans 87 84 52 61.9 73 83.9 0 11 21.2 10) Miami 75 74 38 51.4 64 85.3 1 15 21.3 11) Dallas 93 91 52 57.1 72 77.4 0 12 21.4 12) New York Giants 71 68 35 51.5 53 74.6 0 16 21.5 13) Kansas City 92 91 47 51.6 77 83.7 2 14 21.6 14) Cleveland 73 68 42 61.8 60 82.2 0 10 21.7 15) Denver 115 113 81 71.7 107 93.0 1 12 21.9 16) New York Jets 73 70 30 42.9 52 71.2 0 14 21.9 17) Oakland 74 65 38 58.5 49 66.2 1 8 22.0 18) Indianapolis 88 85 41 48.2 73 83.0 2 18 22.1 19) Arizona 87 85 33 38.8 71 81.6 0 13 22.2 20) Houston 68 67 29 43.3 55 80.9 0 12 22.5 21) Baltimore 82 80 42 52.5 66 80.5 1 7 22.6 22) Detroit 84 83 45 54.2 71 84.5 3 13 22.7 23) Buffalo 83 81 34 42.0 63 75.9 0 19 22.7 24) San Diego 92 91 18 19.8 75 81.5 1 17 22.8 25) Tennessee 83 77 32 41.6 61 73.5 1 8 23.2 26) Chicago 90 84 38 45.2 59 65.6 1 16 23.3 27) Cincinnati 86 84 32 38.1 65 75.6 1 9 23.4 28) Washington 72 68 22 32.4 40 55.6 0 15 24.0 29) Pittsburgh 86 82 24 29.3 45 52.3 3 16 24.3 30) Philadelphia 90 87 37 42.5 63 70.0 0 15 24.3 31) Minnesota 88 85 44 51.8 73 83.0 1 10 24.4 32) Green Bay 93 89 30 33.7 63 67.7 1 15 25.6 Totals 2684 25861309 50.62110 81.6 26 430 22.1 Note: Average team drive start DOES NOT include onside kicks or kickoffs at the end of a half unless either kickoff is returned for a touchdown. All other kickoffs (returned kickoffs, fair catches, touchback and kickoffs out of bounds) are included. Kickoffs resulting in the kicking team retaining possession are not included. ADJ KO: Adjusted kickoffs are used to compute the Avg. Team Drive Start. I20: The number of drives that start inside (not including) the 20 yd line.
WEEK 17 / THROUGH SUNDAY, DECEMBER 29, 2013 AFC / SINGLE-GAME HIGHS / PLAYERS Most Points-- 30, Charles, K.C. at Oak., 12/15, (5 td, 0 fg, 0 xp, 0 2pt) Passing Yards-- 462, Manning, Denv. vs. Balt., 9/5, (27-42, 462, 7 td, 0 int) Longest Pass-- 95, Weeden, Clev. vs. Jax , 12/1, (to Gordon, Josh, td) Passing Touchdowns-- 7, Manning, Denv. vs. Balt., 9/5, (27-42, 462, 7 td, 0 int) Rushing Yards-- 224, Moreno, Denv. at N.E., 11/24 (OT), (37-224, 1 td) Rushing Yards-- 189, Blount, N.E. vs. Buff., 12/29, (24-189, 2 td) Rushing Attempts-- 37, Moreno, Denv. at N.E., 11/24 (OT), (37-224, 1 td) Rushing Attempts-- 29, Mathews, S.D. vs. NY-G, 12/8, (29-103, 1 td) Rushing Attempts-- 29, Mathews, S.D. at Denv., 12/12, (29-127, 1 td) Longest Rush-- 93, Pryor, Oak. vs. Pitt., 10/27, td Receptions-- 14, J. Blackmon, Jax at Denv., 10/13, (14-190, 0 td) Receptions-- 14, Gordon, Clev. vs. Pitt., 11/24, (14-237, 1 td) Receiving Yards-- 261, Gordon, Clev. vs. Jax , 12/1, (10-261, 2 td) Kickoff Return Yards-- 209, L. Washington, Tenn. at Denv., 12/8, (5-209, 0 td) Kickoff Returns-- 8, Demps, K.C. vs. S.D., 11/24, (8-199, 0 td) Longest Kickoff Return-- 108, Davis, K.C. vs. Denv., 12/1, td Punt Return Yards-- 179, Benjamin, Clev. vs. Buff., 10/3, (7-179, 0 fc, 1 td) Punt Returns-- 7, (5 times in Non-Overtime Games) Longest Punt Return-- 89, McCluster, K.C. vs. NY-G, 9/29, td Interceptions-- 2, Ihedigbo, Balt. vs. Cin., 11/10 (OT), (2-46, 0 td) Interceptions-- 2, (15 times in Non-Overtime Games) Longest Interception Return-- 100, S. Smith, K.C. at Buff., 11/3, td Sacks-- 4.5, M. Williams, Buff. vs. Car., 9/15 Sacks-- 4.5, Houston, K.C. at Phil., 9/19 Scrimmage Yards-- 261, Gordon, Clev. vs. Jax , 12/1, (Rush 0-0, Rec 10-261) Longest Punt-- 84, Malone, NY-J vs. T.B., 9/8 Punts-- 11, (3 times in Non-Overtime Games) Field Goals Made-- 6, Tucker, Balt. at Det., 12/16, (6-6, 61 lg) Longest Field Goal-- 64, Prater, Denv. vs. Tenn., 12/8 NFC / SINGLE-GAME HIGHS / PLAYERS Most Points-- 18, Young, Wash. vs. S.D., 11/3 (OT), (3 td, 0 fg, 0 xp, 0 2pt) Most Points-- 18, (15 times in Non-Overtime Games) Passing Yards-- 506, Romo, Dal. vs. Denv., 10/6, (25-36, 506, 5 td, 1 int) Longest Pass-- 91, Palmer, Ariz. at Jax , 11/17, (to Floyd, Michael, td) Passing Touchdowns-- 7, Foles, Phil. at Oak., 11/3, (22-28, 406, 7 td, 0 int) Rushing Yards-- 217, McCoy, Phil. vs. Det., 12/8, (29-217, 2 td) Rushing Attempts-- 35, Peterson, Minn. vs. Chi., 12/1 (OT), (35-211, 0 td) Rushing Attempts-- 33, Stacy, St.L. vs. T.B., 12/22, (33-104, 1 td) Longest Rush-- 80, Ellington, Ariz. vs. Atl., 10/27, td Longest Rush-- 80, Rainey, T.B. vs. Buff., 12/8, td Receptions-- 14, Johnson, Det. vs. Dal., 10/27, (14-329, 1 td) Receiving Yards-- 329, Johnson, Det. vs. Dal., 10/27, (14-329, 1 td) Kickoff Return Yards-- 249, Hester, Chi. vs. Minn., 9/15, (5-249, 0 td) Kickoff Returns-- 8, Paul, Wash. vs. K.C., 12/8, (8-179, 0 td) Longest Kickoff Return-- 109, Patterson, Minn. vs. G.B., 10/27, td Punt Return Yards-- 145, Austin, St.L. at Ind., 11/10, (4-145, 2 fc, 1 td) Punt Returns-- 7, Tate, Sea. at NY-G, 12/15, (7-73, 1 fc, 0 td) Longest Punt Return-- 98, Austin, St.L. at Ind., 11/10, td Interceptions-- 2, Cason, Ariz. at Tenn., 12/15 (OT), (2-36, 1 td) Interceptions-- 2, (16 times in Non-Overtime Games) Longest Interception Return-- 98, Ogletree, St.L. at Hou., 10/13, td Sacks-- 4.0, Tuck, NY-G at Wash., 12/1 Sacks-- 4.0, Hardy, Car. at Atl., 12/29 Scrimmage Yards-- 329, Johnson, Det. vs. Dal., 10/27, (Rush 0-0, Rec 14-329) Longest Punt-- 72, Martin, Det. at Wash., 9/22 Longest Punt-- 72, Nortman, Car. at Miami, 11/24 Punts-- 11, Hekker, St.L. vs. S.F., 9/26, (11-490, 44.5) Field Goals Made-- 5, (4 times in Non-Overtime Games) Longest Field Goal-- 58, Gould, Chi. vs. Cin., 9/8
- Page 2 and 3:
JACKSONVILLE JAGUARS PR CONTACTS: R
- Page 4 and 5:
BRUNELL INDUCTED INTO THE PRIDE At
- Page 6 and 7:
QB CHAD HENNE NOTES CAREER STATISTI
- Page 8 and 9:
HOME VS. AWAY RECORDS JAGUARS NOTES
- Page 10 and 11:
RB MAURICE JONES-DREW NOTES JONES-D
- Page 12 and 13:
RB MAURICE JONES-DREW NOTES JAGUARS
- Page 14 and 15:
JAGUARS OFFENSIVE NOTES TODMAN MAKE
- Page 16 and 17:
PROVEN PASS RUSHER The Jaguars clai
- Page 18 and 19:
K JOSH SCOBEE NOTES SCOBEE BREAKING
- Page 20 and 21:
YEAR-BY-YEAR STATISTICS OFFENSE TOT
- Page 22 and 23:
2013 JAGUARS DRAFT CLASS NAME POSIT
- Page 24 and 25:
HEAD COACH GUS BRADLEY GUS BRADLEY
- Page 26 and 27:
2013 JAGUARS VITAL INFORMATION CUMU
- Page 28 and 29:
JAGUARS 2013 DEFENSIVE STATISTICS J
- Page 30 and 31:
JAGUARS 2013 NUMERICAL ROSTER NO NA
- Page 32 and 33:
GAME-BY-GAME PARTICIPATION OPPONENT
- Page 34 and 35:
HOW THE JAGUARS ARE BUILT ROOKIE, V
- Page 36 and 37:
JAGUARS 2013 ROSTER MOVES DATE PLAY
- Page 38 and 39:
SEASON IN REVIEW PLAYER BIOGRAPHIES
- Page 40 and 41:
TYSON ALUALU tackles for loss … T
- Page 42 and 43:
GAMES PLAYED/STARTED: 2004 (16/16),
- Page 44 and 45:
SEA on Thanksgiving Day … Was ina
- Page 46 and 47:
ANDRE BRANCH 2013 GAME-BY-GAME STAT
- Page 48 and 49:
STEPHEN BURTON 2013 GAME-BY-GAME ST
- Page 50 and 51:
RYAN DAVIS 2013 GAME-BY-GAME STATIS
- Page 52 and 53:
JEREMY EBERT / JOSH EVANS GAMES PLA
- Page 54 and 55:
JUSTIN FORSETT GAMES PLAYED/STARTED
- Page 56 and 57:
BLAINE GABBERT yards with two TD an
- Page 58 and 59:
DWAYNE GRATZ / WINSTON GUY GAMES PL
- Page 60 and 61:
MIKE HARRIS 2013 GAME-BY-GAME STATI
- Page 62 and 63:
CHAD HENNE game with two TD passes,
- Page 64 and 65:
CHAD HENNE / LUKE JOECKEL HENNE’S
- Page 66 and 67:
MAURICE JONES-DREW a 44-yard run in
- Page 68 and 69:
15 times for 37 yards, two passes f
- Page 70 and 71:
MAURICE JONES-DREW JONES-DREW’S G
- Page 72 and 73:
MARCEDES LEWIS / PATRICK LEWIS Beac
- Page 74 and 75:
SEN’DERRICK MARKS / JACQUES MCCLE
- Page 76 and 77:
… Part of an offensive line that
- Page 78 and 79:
DANNY NOBLE 2013 GAME-BY-GAME STATI
- Page 80 and 81:
UCHE NWANERI left the game after th
- Page 82 and 83:
PAUL POSLUSZNY 2011: Started all 16
- Page 84 and 85:
WILL RACKLEY / LAROY REYNOLDS GAMES
- Page 86 and 87:
DENARD ROBINSON ROBINSON 2013 GAME-
- Page 88 and 89:
JOSH SCOBEE GAMES PLAYED/STARTED: 2
- Page 90 and 91:
JOSH SCOBEE SCOBEE TIED FOR LONGEST
- Page 92 and 93:
CECIL SHORTS I.I.I / RICKY STANZI S
- Page 94 and 95:
KERRY TAYLOR / J.T. THOMAS GAMES PL
- Page 96 and 97:
JORDAN TODMAN 2013 GAME-BY-GAME STA
- Page 98 and 99:
JAGUARS 2013 MISCELLANEOUS STATISTI
- Page 100 and 101:
GAME-BY-GAME RUSHING STATISTICS MAU
- Page 102 and 103:
GAME-BY-GAME RECEIVING STATISTICS J
- Page 104 and 105:
GAME-BY-GAME SPECIAL TEAMS STATISTI
- Page 106 and 107:
MISCELLANEOUS DEFENSE GAME-BY-GAME
- Page 108 and 109:
2013 JAGUARS STARTERS OFFENSIVE STA
- Page 110 and 111:
PLAYS OF 30+ YARDS (LAST 10 SEASONS
- Page 112 and 113:
JACKSONVILLE JAGUARS 2012 OFFENSE G
- Page 114 and 115:
JACKSONVILLE JAGUARS 2010 OFFENSE G
- Page 116 and 117:
JACKSONVILLE JAGUARS 2008 OFFENSE G
- Page 118 and 119:
JACKSONVILLE JAGUARS 2006 OFFENSE G
- Page 120 and 121:
JACKSONVILLE JAGUARS 2004 OFFENSE G
- Page 122 and 123:
JACKSONVILLE JAGUARS 2002 OFFENSE G
- Page 124 and 125: JACKSONVILLE JAGUARS 2000 OFFENSE G
- Page 126 and 127: JACKSONVILLE JAGUARS 1998 OFFENSE G
- Page 128 and 129: JACKSONVILLE JAGUARS 1996 OFFENSE G
- Page 130 and 131: GAME SUMMARIES GAME ONE VS. KANSAS
- Page 132 and 133: GAME SUMMARIES GAME FIVE AT ST. LOU
- Page 134 and 135: GAME SUMMARIES GAME NINE AT TENNESS
- Page 136 and 137: GAME SUMMARIES GAME 13 VS. HOUSTON
- Page 142 and 143: JAGUARS QUOTES END OF SEASON REVIEW
- Page 144 and 145: END OF SEASON TRANSCRIPTS (On if th
- Page 146 and 147: END OF SEASON TRANSCRIPTS (On the c
- Page 148 and 149: WEEK 17 / THROUGH SUNDAY, DECEMBER
- Page 150 and 151: WEEK 17 / THROUGH SUNDAY, DECEMBER
- Page 152 and 153: WEEK 17 / THROUGH SUNDAY, DECEMBER
- Page 154 and 155: WEEK 17 / THROUGH SUNDAY, DECEMBER
- Page 156 and 157: WEEK 17 / THROUGH SUNDAY, DECEMBER
- Page 158 and 159: WEEK 17 / THROUGH SUNDAY, DECEMBER
- Page 160 and 161: WEEK 17 / THROUGH SUNDAY, DECEMBER
- Page 162 and 163: WEEK 17 / THROUGH SUNDAY, DECEMBER
- Page 164 and 165: WEEK 17 / THROUGH SUNDAY, DECEMBER
- Page 166 and 167: WEEK 17 / THROUGH SUNDAY, DECEMBER
- Page 168 and 169: WEEK 17 / THROUGH SUNDAY, DECEMBER
- Page 170 and 171: WEEK 17 / THROUGH SUNDAY, DECEMBER
- Page 172 and 173: WEEK 17 / THROUGH SUNDAY, DECEMBER
- Page 176 and 177: WEEK 17 / THROUGH SUNDAY, DECEMBER
- Page 178 and 179: 332, Brees, NO vs. BUF 10/27 (26-34
- Page 180 and 181: 134, J. Graham, NO vs. ARI 09/22 (9
- Page 182 and 183: WEEK 17 / THROUGH SUNDAY, DECEMBER
- Page 184 and 185: AFC / LEADING PASSERS Pct Avg Pct P
- Page 186 and 187: NFL / LEADING PASSERS Pct Avg Pct P
- Page 188 and 189: NFL / FOURTH-QUARTER PASSING LEADER
- Page 190 and 191: AFC / LEADING RUSHERS Rank Player,
- Page 192 and 193: NFL / LEADING RUSHERS Rank Player,
- Page 194 and 195: NFL / THIRD-AND-ONE RUSHING LEADERS
- Page 196 and 197: NFC / LEADERS IN RECEPTIONS Rank Pl
- Page 198 and 199: AFC / RECEIVING YARDAGE LEADERS Ran
- Page 200 and 201: NFL / RECEIVING YARDAGE LEADERS Ran
- Page 202 and 203: NFC / THIRD-DOWN RECEIVING LEADERS
- Page 204 and 205: AFC / LEADING SCORERS, NONKICKERS R
- Page 206 and 207: NFL / LEADING SCORERS, NONKICKERS R
- Page 208 and 209: AFC / TOUCHBACKS ON KICKOFFS Rank P
- Page 210 and 211: AFC / MOST YARDS FROM SCRIMMAGE Tot
- Page 212 and 213: NFL / MOST YARDS FROM SCRIMMAGE Tot
- Page 214 and 215: NFC / LEADERS IN FIRST DOWNS Rank P
- Page 216 and 217: AFC / LEADING PUNTERS Opp Ret In Ne
- Page 218 and 219: AFC / PUNT RETURN LEADERS Rank Play
- Page 220 and 221: AFC / LEADERS IN INTERCEPTIONS Rank
- Page 222 and 223: AFC / LEADERS IN SACKS Rank Player,
- Page 224 and 225:
NFL / LEADERS IN SACKS Rank Player,
- Page 226 and 227:
NFC / FUMBLE RECOVERIES Rank Player
- Page 228 and 229:
AFC / OFFENSIVE FUMBLE RECOVERIES R
- Page 230 and 231:
AFC / DEFENSIVE FUMBLE RECOVERIES R
- Page 232:
BAL BUF CIN CLE DEN HOU IND JAX KC