Sea Isle 2000 on desert greens: Mowing height and ... - GCSAA
Sea Isle 2000 on desert greens: Mowing height and ... - GCSAA
Sea Isle 2000 on desert greens: Mowing height and ... - GCSAA

Create successful ePaper yourself
Turn your PDF publications into a flip-book with our unique Google optimized e-Paper software.
ing dates, but this trend was c<strong>on</strong>sistent <strong>on</strong><br />
almost every evaluati<strong>on</strong> date. In both <str<strong>on</strong>g>2000</str<strong>on</strong>g><br />
<strong>and</strong> 2001, turf color resp<strong>on</strong>ded positively to<br />
fertilizati<strong>on</strong> rate, with improved color at the<br />
higher levels of nitrogen fertilizati<strong>on</strong>. In general,<br />
turf color was lightest in July (m<strong>on</strong>so<strong>on</strong><br />
period), averaging less than 6.0 in both years.<br />
Turf color scores were noticeably higher in<br />
October 2001 than in October <str<strong>on</strong>g>2000</str<strong>on</strong>g>, probably<br />
because temperatures in fall 2001 were<br />
unseas<strong>on</strong>ably warm.<br />
To maintain a color score of 6.0 or greater<br />
throughout the test, turf mowed at 1 ⁄8 inch<br />
required 0.50 pound nitrogen/1,000 square<br />
feet/m<strong>on</strong>th; turf mowed at 5 ⁄32 required 0.38<br />
pound, <strong>and</strong> turf mowed at 3 ⁄16 inch required<br />
0.25 pound.<br />
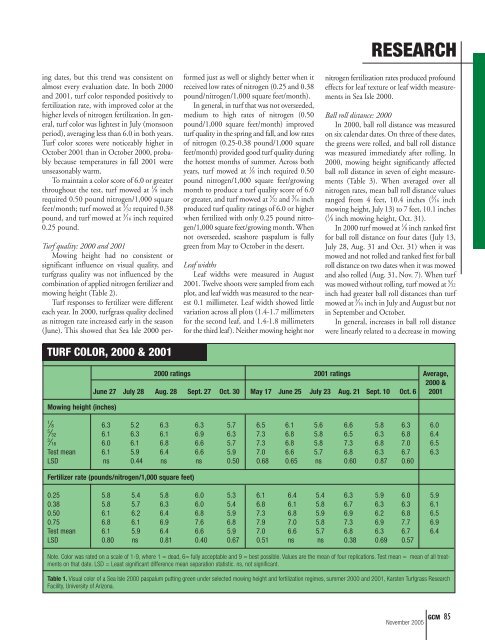
TURF COLOR, <str<strong>on</strong>g>2000</str<strong>on</strong>g> & 2001<br />
Turf quality: <str<strong>on</strong>g>2000</str<strong>on</strong>g> <strong>and</strong> 2001<br />
<strong>Mowing</strong> <strong>height</strong> had no c<strong>on</strong>sistent or<br />
significant influence <strong>on</strong> visual quality, <strong>and</strong><br />
turfgrass quality was not influenced by the<br />
combinati<strong>on</strong> of applied nitrogen fertilizer <strong>and</strong><br />
mowing <strong>height</strong> (Table 2).<br />
Turf resp<strong>on</strong>ses to fertilizer were different<br />
each year. In <str<strong>on</strong>g>2000</str<strong>on</strong>g>, turfgrass quality declined<br />
as nitrogen rate increased early in the seas<strong>on</strong><br />
(June). This showed that <str<strong>on</strong>g>Sea</str<strong>on</strong>g> <str<strong>on</strong>g>Isle</str<strong>on</strong>g> <str<strong>on</strong>g>2000</str<strong>on</strong>g> performed<br />
just as well or slightly better when it<br />
received low rates of nitrogen (0.25 <strong>and</strong> 0.38<br />
pound/nitrogen/1,000 square feet/m<strong>on</strong>th).<br />
In general, in turf that was not overseeded,<br />
medium to high rates of nitrogen (0.50<br />
pound/1,000 square feet/m<strong>on</strong>th) improved<br />
turf quality in the spring <strong>and</strong> fall, <strong>and</strong> low rates<br />
of nitrogen (0.25-0.38 pound/1,000 square<br />
feet/m<strong>on</strong>th) provided good turf quality during<br />
the hottest m<strong>on</strong>ths of summer. Across both<br />
years, turf mowed at 1 ⁄8 inch required 0.50<br />
pound nitrogen/1,000 square feet/growing<br />
m<strong>on</strong>th to produce a turf quality score of 6.0<br />
or greater, <strong>and</strong> turf mowed at 5 ⁄32 <strong>and</strong> 3 ⁄16 inch<br />
produced turf quality ratings of 6.0 or higher<br />
when fertilized with <strong>on</strong>ly 0.25 pound nitrogen/1,000<br />
square feet/growing m<strong>on</strong>th. When<br />
not overseeded, seashore paspalum is fully<br />
green from May to October in the <strong>desert</strong>.<br />
Leaf widths<br />
Leaf widths were measured in August<br />
2001. Twelve shoots were sampled from each<br />
plot, <strong>and</strong> leaf width was measured to the nearest<br />
0.1 millimeter. Leaf width showed little<br />
variati<strong>on</strong> across all plots (1.4-1.7 millimeters<br />
for the sec<strong>on</strong>d leaf, <strong>and</strong> 1.4-1.8 millimeters<br />
for the third leaf). Neither mowing <strong>height</strong> nor<br />
RESEARCH<br />
nitrogen fertilizati<strong>on</strong> rates produced profound<br />
effects for leaf texture or leaf width measurements<br />
in <str<strong>on</strong>g>Sea</str<strong>on</strong>g> <str<strong>on</strong>g>Isle</str<strong>on</strong>g> <str<strong>on</strong>g>2000</str<strong>on</strong>g>.<br />
Ball roll distance: <str<strong>on</strong>g>2000</str<strong>on</strong>g><br />
In <str<strong>on</strong>g>2000</str<strong>on</strong>g>, ball roll distance was measured<br />
<strong>on</strong> six calendar dates. On three of these dates,<br />
the <strong>greens</strong> were rolled, <strong>and</strong> ball roll distance<br />
was measured immediately after rolling. In<br />
<str<strong>on</strong>g>2000</str<strong>on</strong>g>, mowing <strong>height</strong> significantly affected<br />
ball roll distance in seven of eight measurements<br />
(Table 3). When averaged over all<br />
nitrogen rates, mean ball roll distance values<br />
ranged from 4 feet, 10.4 inches ( 3 ⁄16 inch<br />
mowing <strong>height</strong>, July 13) to 7 feet, 10.1 inches<br />
( 1 ⁄8 inch mowing <strong>height</strong>, Oct. 31).<br />
In <str<strong>on</strong>g>2000</str<strong>on</strong>g> turf mowed at 1 ⁄8 inch ranked first<br />
for ball roll distance <strong>on</strong> four dates (July 13,<br />
July 28, Aug. 31 <strong>and</strong> Oct. 31) when it was<br />
mowed <strong>and</strong> not rolled <strong>and</strong> ranked first for ball<br />
roll distance <strong>on</strong> two dates when it was mowed<br />
<strong>and</strong> also rolled (Aug. 31, Nov. 7). When turf<br />
was mowed without rolling, turf mowed at 5 ⁄32<br />
inch had greater ball roll distances than turf<br />
mowed at 3 ⁄16 inch in July <strong>and</strong> August but not<br />
in September <strong>and</strong> October.<br />
In general, increases in ball roll distance<br />
were linearly related to a decrease in mowing<br />
<strong>Mowing</strong> <strong>height</strong> (inches)<br />
<str<strong>on</strong>g>2000</str<strong>on</strong>g> ratings 2001 ratings Average,<br />
<str<strong>on</strong>g>2000</str<strong>on</strong>g> &<br />
June 27 July 28 Aug. 28 Sept. 27 Oct. 30 May 17 June 25 July 23 Aug. 21 Sept. 10 Oct. 6 2001<br />
1<br />
⁄8 6.3 5.2 6.3 6.3 5.7 6.5 6.1 5.6 6.6 5.8 6.3 6.0<br />
5<br />
⁄32 6.1 6.3 6.1 6.9 6.3 7.3 6.8 5.8 6.5 6.3 6.8 6.4<br />
3<br />
⁄16 6.0 6.1 6.8 6.6 5.7 7.3 6.8 5.8 7.3 6.8 7.0 6.5<br />
Test mean 6.1 5.9 6.4 6.6 5.9 7.0 6.6 5.7 6.8 6.3 6.7 6.3<br />
LSD ns 0.44 ns ns 0.50 0.68 0.65 ns 0.60 0.87 0.60<br />
Fertilizer rate (pounds/nitrogen/1,000 square feet)<br />
0.25 5.8 5.4 5.8 6.0 5.3 6.1 6.4 5.4 6.3 5.9 6.0 5.9<br />
0.38 5.8 5.7 6.3 6.0 5.4 6.8 6.1 5.8 6.7 6.3 6.3 6.1<br />
0.50 6.1 6.2 6.4 6.8 5.9 7.3 6.8 5.9 6.9 6.2 6.8 6.5<br />
0.75 6.8 6.1 6.9 7.6 6.8 7.9 7.0 5.8 7.3 6.9 7.7 6.9<br />
Test mean 6.1 5.9 6.4 6.6 5.9 7.0 6.6 5.7 6.8 6.3 6.7 6.4<br />
LSD 0.80 ns 0.81 0.40 0.67 0.51 ns ns 0.38 0.69 0.57<br />
Note. Color was rated <strong>on</strong> a scale of 1-9, where 1 = dead, 6= fully acceptable <strong>and</strong> 9 = best possible. Values are the mean of four replicati<strong>on</strong>s. Test mean = mean of all treatments<br />
<strong>on</strong> that date. LSD = Least significant difference mean separati<strong>on</strong> statistic. ns, not significant.<br />
Table 1. Visual color of a <str<strong>on</strong>g>Sea</str<strong>on</strong>g> <str<strong>on</strong>g>Isle</str<strong>on</strong>g> <str<strong>on</strong>g>2000</str<strong>on</strong>g> paspalum putting green under selected mowing <strong>height</strong> <strong>and</strong> fertilizati<strong>on</strong> regimes, summer <str<strong>on</strong>g>2000</str<strong>on</strong>g> <strong>and</strong> 2001, Karsten Turfgrass Research<br />
Facility, University of Ariz<strong>on</strong>a.<br />
November 2005<br />
GCM 85