14. Appendix D: Risk-Based Soil Gas Cleanup Levels, Schlage OU
14. Appendix D: Risk-Based Soil Gas Cleanup Levels, Schlage OU
14. Appendix D: Risk-Based Soil Gas Cleanup Levels, Schlage OU

You also want an ePaper? Increase the reach of your titles
YUMPU automatically turns print PDFs into web optimized ePapers that Google loves.
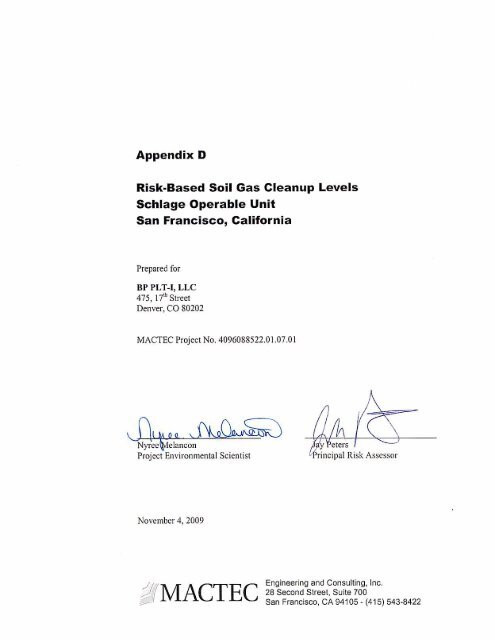
<strong>Appendix</strong> D, <strong>Schlage</strong> <strong>OU</strong>, San Francisco, California November 4, 2009<br />
Feasibility Study/Remedial Action Plan, <strong>Schlage</strong> <strong>OU</strong>/UPC <strong>OU</strong><br />
MACTEC Project No. 4096088522<br />
KB63190 FS-RAP <strong>Appendix</strong> D Text-<strong>Schlage</strong><br />
TABLE OF CONTENTS<br />
ACRONYMS AND ABBREVIATIONS ................................................................................................. Div<br />
D1.0 INTRODUCTION ..................................................................................................................... D1-1<br />
D2.0 BACKGR<strong>OU</strong>ND ....................................................................................................................... D2-1<br />
D2.1 Site Physical Setting ..................................................................................................... D2-1<br />
D2.2 Site Redevelopment Plans............................................................................................. D2-1<br />
D2.3 Previous Investigations ................................................................................................. D2-1<br />
D3.0 EXPOSURE ASSESSMENT .................................................................................................... D3-1<br />
D3.1 Potentially Exposed Populations ................................................................................... D3-1<br />
D3.2 Potential Exposure Pathways ........................................................................................ D3-1<br />
D3.2.1 <strong>Soil</strong> <strong>Gas</strong> Exposure Pathways ........................................................................ D3-1<br />
D3.3 Exposure Assumptions ................................................................................................. D3-2<br />
D4.0 TOXICITY ASSESSMENT ...................................................................................................... D4-1<br />
D4.1 Noncancer Toxicity Assessment ................................................................................... D4-1<br />
D4.1.1 Noncancer Reference Dose .......................................................................... D4-1<br />
D4.1.2 Target Hazard Index ..................................................................................... D4-1<br />
D4.2 Cancer Slope Factors and Target <strong>Risk</strong> Level ................................................................ D4-2<br />
D4.2.1 Cancer Slope Factors .................................................................................... D4-2<br />
D4.2.2 Target <strong>Risk</strong> Level ......................................................................................... D4-2<br />
D5.0 INDOOR AIR TARGET CONCENTRATIONS ...................................................................... D5-1<br />
D5.1 Indoor Air Target Concentrations ................................................................................. D5-1<br />
D5.2 Indoor Air Concentrations - Residential Living Space ................................................. D5-2<br />
D6.0 CLEANUP LEVELS ................................................................................................................. D6-1<br />
D6.1 <strong>Soil</strong> <strong>Gas</strong> <strong>Cleanup</strong> <strong>Levels</strong> ............................................................................................... D6-1<br />
D6.2 Redevelopment Zone <strong>Cleanup</strong> <strong>Levels</strong> .......................................................................... D6-1<br />
D6.2.1 Residential Over Commercial (Zone 2) and Residential Over Podium<br />
Garage (Zone 3) <strong>Cleanup</strong> <strong>Levels</strong> .................................................................. D6-2<br />
D7.0 APPLICATION OF CLEANUP LEVELS ................................................................................ D7-1<br />
D8.0 CONCLUSION .......................................................................................................................... D8-1<br />
D9.0 REFERENCES .......................................................................................................................... D9-1<br />
Dii
<strong>Appendix</strong> D, <strong>Schlage</strong> <strong>OU</strong>, San Francisco, California November 4, 2009<br />
Feasibility Study/Remedial Action Plan, <strong>Schlage</strong> <strong>OU</strong>/UPC <strong>OU</strong><br />
MACTEC Project No. 4096088522<br />
KB63190 FS-RAP <strong>Appendix</strong> D Text-<strong>Schlage</strong><br />
TABLES<br />
D3-1 Exposure Factors to Calculate <strong>Risk</strong> <strong>Based</strong> Human Health <strong>Cleanup</strong> <strong>Levels</strong> for Chlorinated<br />
Volatile Organic Compounds<br />
D4-1 Toxicity Values for Chlorinated Volatile Organic Compounds<br />
D5-1 Target Indoor Air Concentration<br />
D6-1 <strong>Soil</strong> <strong>Gas</strong> <strong>Cleanup</strong> <strong>Levels</strong> Protective of Indoor Air<br />
D6-2 Final <strong>Soil</strong> <strong>Gas</strong> <strong>Cleanup</strong> <strong>Levels</strong><br />
ATTACHMENT<br />
D-1 INTERSTATE TECHNOLOGY AND REGULATORY C<strong>OU</strong>NCIL SCENARIO FOR<br />
MULTI-FAMILY DWELLING<br />
Diii
<strong>Appendix</strong> D, <strong>Schlage</strong> <strong>OU</strong>, San Francisco, California November 4, 2009<br />
Feasibility Study/Remedial Action Plan, <strong>Schlage</strong> <strong>OU</strong>/UPC <strong>OU</strong><br />
MACTEC Project No. 4096088522<br />
KB63190 FS-RAP <strong>Appendix</strong> D Text-<strong>Schlage</strong><br />
ACRONYMS AND ABBREVIATIONS<br />
µg/L<br />
microgram per liter<br />
µg/m 3<br />
microgram per cubic meter<br />
1,1-DCE<br />
1,1-dichloroethene<br />
AF<br />
Attenuation factor (unitless)<br />
AMSL<br />
above mean sea level<br />
AT<br />
averaging time<br />
ATSDR<br />
Agency for Toxic Substances and Disease Registry<br />
B&M<br />
Burns and McDonnell Engineering Company, Inc.<br />
BAAQMD<br />
Bay Area Air Quality Management District<br />
BP<br />
BP PLT-1, LLC<br />
BW<br />
body weight<br />
Cµg/m 3 Ambient air background concentration (µg/m 3 )<br />
CalEPA<br />
California Environmental Protection Agency<br />
cfm/ft 2<br />
cubic feet per minute per square foot<br />
CHHSLs<br />
California Human Health Screening <strong>Levels</strong><br />
cis-1,2-DCE<br />
cis-1,2-dichloroethene<br />
COCs<br />
chemicals of concern<br />
C ppb<br />
Ambient air background concentration (ppb)<br />
CULs<br />
cleanup levels<br />
CVOCs<br />
chlorinated volatile organic compounds<br />
days/year<br />
days per year<br />
DTSC<br />
California Department of Toxic Substances Control<br />
ED<br />
exposure duration<br />
EF<br />
exposure frequency<br />
EIR<br />
environmental impact report<br />
EPA<br />
United States Environmental Protection Agency<br />
EPC<br />
exposure point concentration<br />
ET<br />
exposure time<br />
FS/RAP<br />
Feasibility Study/Remedial Action Plan<br />
IA Indoor air target concentration (µg/m 3 )<br />
IA c Carcinogen indoor air concentration (µg/m 3 )<br />
IA nc Noncarcinogen indoor air concentration (µg/m 3 )<br />
IRIS<br />
Integrated <strong>Risk</strong> Information System<br />
ITRC<br />
Interstate Technology and Regulatory Council<br />
IUR<br />
inhalation unit risk<br />
kg<br />
kilograms<br />
LOAEL<br />
lowest-observed-adverse-effect level<br />
MACTEC<br />
MACTEC Engineering and Consulting, Inc.<br />
mg/m 3<br />
milligrams per cubic meter<br />
MW<br />
Molecular weight of compound<br />
MW PCE Molecular weight of PCE = 165.8<br />
MW TCE Molecular weight of TCE – 131.4<br />
MW VC Molecular weight of VC = 62.5<br />
NOAEL<br />
no-observed-adverse-effect level<br />
OEHHA<br />
Office of Environmental Health Hazard Assessment<br />
PCE<br />
tetrachloroethene<br />
Div
<strong>Appendix</strong> D, <strong>Schlage</strong> <strong>OU</strong>, San Francisco, California November 4, 2009<br />
Feasibility Study/Remedial Action Plan, <strong>Schlage</strong> <strong>OU</strong>/UPC <strong>OU</strong><br />
MACTEC Project No. 4096088522<br />
KB63190 FS-RAP <strong>Appendix</strong> D Text-<strong>Schlage</strong><br />
PPRTV<br />
provisional peer review toxicity values<br />
RAP<br />
remedial action plan<br />
RfC<br />
reference concentration<br />
RSL<br />
Regional Screening <strong>Levels</strong><br />
<strong>Schlage</strong> <strong>OU</strong><br />
<strong>Schlage</strong> Lock Operable Unit<br />
SG <strong>Soil</strong> gas concentration (µg/m 3 )<br />
Site<br />
<strong>Schlage</strong> <strong>OU</strong> and San Francisco County portion of UPC <strong>OU</strong><br />
SP <strong>OU</strong>-1 Southern Pacific Rail Yard Operable Unit 1<br />
SP<br />
Southern Pacific<br />
T&R<br />
Treadwell and Rollo<br />
TCE<br />
trichloroethene<br />
THQ<br />
target hazard quotient<br />
TR<br />
Target risk (unitless)<br />
trans-1,2-DCE<br />
trans-1,2-dichloroethene<br />
TRL<br />
target risk level<br />
UCL<br />
upper confidence limit<br />
UPC <strong>OU</strong><br />
Universal Paragon Corporation Operable Unit<br />
UPC<br />
Universal Paragon Corporation<br />
VC<br />
Vinyl Chloride<br />
VOCs<br />
volatile organic compounds<br />
Dv
<strong>Appendix</strong> D, <strong>Schlage</strong> <strong>OU</strong>, San Francisco, California November 4, 2009<br />
Feasibility Study/Remedial Action Plan, <strong>Schlage</strong> <strong>OU</strong>/UPC <strong>OU</strong><br />
MACTEC Project No. 4096088522<br />
KB63190 FS-RAP <strong>Appendix</strong> D Text-<strong>Schlage</strong><br />
D1.0 INTRODUCTION<br />
On behalf of BP PLT-1, LLC (BP), MACTEC Engineering and Consulting, Inc. (MACTEC) is pleased to<br />
submit to the California Department of Toxic Substances Control (DTSC), this report that presents our<br />
risk analysis for the <strong>Schlage</strong> Lock Operable Unit (<strong>Schlage</strong> <strong>OU</strong>), San Francisco, California. The <strong>Schlage</strong><br />
<strong>OU</strong> is defined as the former <strong>Schlage</strong> Lock site, together with soil and groundwater on the northern portion<br />
of the former Southern Pacific Brisbane Rail Yard – Operable Unit 1 (SP <strong>OU</strong>-1) that is impacted with<br />
volatile organic compounds (VOCs). The Universal Paragon Corporation (UPC) <strong>OU</strong> is defined as soil<br />
and groundwater on SP <strong>OU</strong>-1 that is impacted with chemicals other than VOCs. Together, the <strong>Schlage</strong><br />
<strong>OU</strong> and the San Francisco portion of the UPC <strong>OU</strong> constitute the Site.<br />
For the <strong>Schlage</strong> <strong>OU</strong>, this risk analysis document presents the site physical setting, UPC’s planned<br />
redevelopment, a summary of previous investigations, and estimates of cleanup levels (CULs) for<br />
chemicals of concern (COCs) in soil gas at the Site.<br />
D1-1
<strong>Appendix</strong> D, <strong>Schlage</strong> <strong>OU</strong>, San Francisco, California November 4, 2009<br />
Feasibility Study/Remedial Action Plan, <strong>Schlage</strong> <strong>OU</strong>/UPC <strong>OU</strong><br />
MACTEC Project No. 4096088522<br />
KB63190 FS-RAP <strong>Appendix</strong> D Text-<strong>Schlage</strong><br />
D2.0 BACKGR<strong>OU</strong>ND<br />
D2.1 Site Physical Setting<br />
The <strong>Schlage</strong> <strong>OU</strong> consists of approximately 12.66 acres. The Site consists of approximately 20 acres in<br />
San Francisco, located north of Sunnyvale Avenue, between Bayshore Boulevard on the west, and the<br />
Union Pacific/Joint Powers Board railroad tracks on the east, and Blanken Avenue to the north. The<br />
surface elevation of the Site ranges from approximately 50 feet above mean sea level (AMSL) in the<br />
north to approximately 10 feet AMSL in the south.<br />
D2.2 Site Redevelopment Plans<br />
UPC plans to redevelop the Site in accordance with an Environmental Impact Report (EIR) certified by<br />
the San Francisco Redevelopment Agency on December 16, 2008 and the Planning Commission on<br />
December 18, 2008. The redevelopment plan consists of the following three redevelopment zones, which<br />
are consistent with the plans approved by the San Francisco Planning Department:<br />
• Zone 1 – Public open space on grade.<br />
• Zone 2 – Residential over commercial podium construction.<br />
• Zone 3 – Residential over podium parking construction.<br />
D2.3 Previous Investigations<br />
Investigations to assess the nature and extent of contaminants have been conducted on the Site, with<br />
regulatory oversight, beginning in 1982. Documentation of the field investigations are included in reports<br />
submitted to the DTSC (Treadwell and Rollo (T&R), 2001; Burns & McDonnell Engineering Company,<br />
Inc. [B&M], 2006a and 2006b). Historical soil analytical data is presented in <strong>Appendix</strong> A of the<br />
Feasibility Study/Remedial Action Plan (FS/RAP) for the Site. A compilation of cumulative water level<br />
and water quality data from groundwater monitoring wells at the Site is presented in the draft third quarter<br />
2008 groundwater monitoring report (MACTEC, 2008). A description of the nature and extent of soil and<br />
groundwater contamination and the COCs identified in soil at the <strong>Schlage</strong> <strong>OU</strong> and UPC <strong>OU</strong>s, and<br />
groundwater at the <strong>Schlage</strong> <strong>OU</strong> are presented in the Feasibility Study/Remedial Action Plan (FS/RAP) for<br />
the Site.<br />
D2-1
<strong>Appendix</strong> D, <strong>Schlage</strong> <strong>OU</strong>, San Francisco, California November 4, 2009<br />
Feasibility Study/Remedial Action Plan, <strong>Schlage</strong> <strong>OU</strong>/UPC <strong>OU</strong><br />
MACTEC Project No. 4096088522<br />
KB63190 FS-RAP <strong>Appendix</strong> D Text-<strong>Schlage</strong><br />
D3.0 EXPOSURE ASSESSMENT<br />
In the exposure assessment for the development of soil gas CULs, potential exposed populations and<br />
potential pathways of exposure are identified. The exposure assessment considers the current and future<br />
land use in order to identify pathways and potentially exposed populations. The exposure assessments<br />
from the Human Health <strong>Risk</strong> Assessment of Joint Groundwater Operable Unit (B&M, 2003), Human<br />
Health <strong>Risk</strong> Assessment for the San Francisco County Parcel of Operable Unit – 1 (B&M, 2006c), and<br />
Human Health <strong>Risk</strong> Assessment for the San Mateo County Parcel of Operable Unit – 1 (B&M, 2006d)<br />
were used in developing the populations and pathways in this CUL document.<br />
D3.1 Potentially Exposed Populations<br />
Potentially exposed populations include those persons whose locations and activities create an<br />
opportunity for contact with the COCs. As described in Section D2.2, the UPC <strong>OU</strong> redevelopment zones<br />
for the Site correspond to three human health exposure scenarios. Zone 1 corresponds to “Recreational”<br />
exposure scenario, and Zones 2 and 3 correspond to both “Mixed Use Multi-Family Residential” and<br />
“Commercial” exposure scenarios. A “Mixed Use Multi-Family Residential” (hereafter referred to as<br />
“residential”) exposure scenario was also evaluated for comparison purposes; however, although Zones 2<br />
and 3 both provide for residential development, the podium type of building construction precludes<br />
residential occupation of the ground level. The “Construction/Excavation Worker” exposure scenario<br />
was considered for the entire Site.<br />
The receptors selected are consistent with the receptors that were quantitatively evaluated in the risk<br />
assessments prepared by B&M (B&M, 2003 and 2006c, d), with the exception of recreational receptor.<br />
The previous risk assessments qualitatively evaluated Visitors/Trespassers, which are now quantitatively<br />
evaluated as recreational receptors. <strong>Soil</strong> gas CULs will be developed for commercial worker receptors,<br />
and residential receptors for comparison purposes only, as described below in Section D3.2.<br />
D3.2 Potential Exposure Pathways<br />
Health risks may occur when there is contact with a chemical by a receptor population. Exposed<br />
populations must then either ingest, inhale, or dermally absorb the chemical to complete an exposure<br />
pathway and experience a possible health risk. The following is a discussion of the pathways with which<br />
CULs were developed for the primary media of concern, which is soil gas. <strong>Soil</strong>, groundwater, and soil<br />
gas at <strong>Schlage</strong> <strong>OU</strong> have shown to contain chlorinated volatile organic compounds (CVOCs), which<br />
include 1,1-dichloroethene (1,1-DCE), cis-1,2-dichloroethene (cis-1,2-DCE), trans-1,2-dichloroethene<br />
(trans-1,2-DCE), tetrachloroethene (PCE), trichloroethene (TCE), and vinyl chloride (VC). CULs for the<br />
CVOCs will be developed for soil gas.<br />
D3.2.1<br />
<strong>Soil</strong> <strong>Gas</strong> Exposure Pathways<br />
Conceptually, CVOCs in groundwater can partition to soil gas. <strong>Soil</strong> gas can then passively migrate or be<br />
actively drawn into the enclosed space of structures that overlie the groundwater containing CVOCs. At<br />
the <strong>Schlage</strong> <strong>OU</strong>, soil gas could migrate to the air within the on-grade commercial buildings (podium<br />
construction) at redevelopment Zone 2, or to the air within the on-grade parking garages at redevelopment<br />
Zone 3. At each of these redevelopment zones, air within the on-grade buildings or parking garages could<br />
then migrate (or be drawn) into the residential spaces that are constructed on top of the buildings/garages,<br />
which is further discussed in Section D5.2. CULs will be developed that are protective of commercial<br />
workers expected to occupy the on-grade structures (full time workers in commercial buildings, or full<br />
D3-1
<strong>Appendix</strong> D, <strong>Schlage</strong> <strong>OU</strong>, San Francisco, California November 4, 2009<br />
Feasibility Study/Remedial Action Plan, <strong>Schlage</strong> <strong>OU</strong>/UPC <strong>OU</strong><br />
MACTEC Project No. 4096088522<br />
KB63190 FS-RAP <strong>Appendix</strong> D Text-<strong>Schlage</strong><br />
time parking attendant in garages) and be exposed via inhalation of indoor air. These CULs will also be<br />
protective of the residents living in the residential spaces constructed on top of the buildings/garages as<br />
described in Section D5.2. Under a residential exposure scenario, soil gas could migrate to the air within<br />
the multi-family residential on-grade building. CULs will be developed for comparison purposes only<br />
that are protective of residential receptors who maybe exposed via inhalation of indoor air. The<br />
commercial CULs can be compared with CVOC concentrations in soil gas collected prior to initiation of<br />
Site redevelopment activities. Construction/excavation workers and recreational receptors were<br />
considered to have incomplete pathways to soil gas because they were assumed to spend all of their time<br />
outdoors.<br />
D3.3 Exposure Assumptions<br />
The exposure assumptions used to evaluate the exposure pathways in B&M 2003 and 2006c, and d risk<br />
assessments are the same exposure assumptions used to develop soil gas CULs. Exposure assumptions<br />
are provided in Table D3-1.<br />
The adult receptors were assumed to weigh 70 kilograms (kg) (United States Environmental Protection<br />
Agency [EPA], 1991; DTSC, 1996) and child receptors were assumed to weigh 15 kg (EPA, 1991; DTSC,<br />
1996).<br />
The exposure frequency (EF) parameter of 350 days per year (days/year) is used for residential receptors<br />
(EPA, 1991; DTSC, 1996). The EF parameters for commercial worker receptors are based on a standard<br />
work schedule of 250 days/year. For the commercial worker, the exposure duration (ED) of 25 years is<br />
assumed (EPA, 1991; DTSC, 1996).<br />
The averaging time (AT) is the period over which exposure is averaged in days. The noncancer AT for<br />
all receptors is the ED multiplied by 365 days/year (EPA, 1989), which is provided on Table D3-1. The<br />
cancer AT is 70 year lifetime risk multiplied by 365 days/year for all receptors (EPA, 1989).<br />
The exposure time (ET) for the commercial worker receptor is 8 hours/day, which is based on the average<br />
work day (B&M, 2006c, d) in a garage and commercial building.<br />
D3-2
<strong>Appendix</strong> D, <strong>Schlage</strong> <strong>OU</strong>, San Francisco, California November 4, 2009<br />
Feasibility Study/Remedial Action Plan, <strong>Schlage</strong> <strong>OU</strong>/UPC <strong>OU</strong><br />
MACTEC Project No. 4096088522<br />
KB63190 FS-RAP <strong>Appendix</strong> D Text-<strong>Schlage</strong><br />
D4.0 TOXICITY ASSESSMENT<br />
Toxicity assessment is the process of using the existing toxicity information from human and/or animal<br />
studies to identify potential health risks at various dose levels in exposure populations (EPA, 1989). To<br />
estimate these potential health risks, the relationship between exposure to a chemical (in terms of chronic<br />
daily intake for individuals) and an adverse effect (in terms of bodily response to a specific intake dose<br />
level) must be quantified. The methodologies used to develop toxicity factors differ, depending on<br />
whether the CVOC is a potential carcinogen (i.e., has the potential to cause cancer) and/or has noncancer<br />
adverse effects.<br />
Both California and EPA-derived toxicity values were compiled for the CUL development. For<br />
California, the California Environmental Protection Agency’s (CalEPA) Office of Environmental Health<br />
Hazard Assessment (OEHHA) online toxicity database (OEHHA, 2008) was consulted. The EPA values<br />
were compiled from EPA’s Integrated <strong>Risk</strong> Information System (IRIS), an online database (EPA, 2008c),<br />
the Agency for Toxic Substances and Disease Registry (ATSDR), provided in EPA’s Regional Screening<br />
<strong>Levels</strong> (RSLs) tables (EPA, 2008a), and the provisional peer review toxicity values (PPRTVs), provided<br />
in EPA’s RSLs tables (EPA, 2008a). These sources are updated regularly based on toxicity and exposure<br />
studies. The toxicity values for the CVOCs are discussed below and presented in Table D4-1.<br />
D4.1 Noncancer Toxicity Assessment<br />
D4.1.1<br />
Noncancer Reference Dose<br />
In deriving dose-response criteria for assessing the potential for noncancer health effects from exposure to<br />
chemicals, it is assumed by regulatory agencies that noncancer health effects occur only after a threshold<br />
dose is reached. This threshold dose is usually estimated by regulatory agencies from the no-observed<br />
adverse effect level (NOAEL) or the lowest-observed adverse effect level (LOAEL) determined from<br />
chronic (i.e., long-term) animal studies or human epidemiological studies. The NOAEL is defined as the<br />
highest dose at which no adverse effects are observed, while the LOAEL is defined as the lowest dose at<br />
which adverse effects are observed.<br />
Uncertainty factors or safety factors are applied to the NOAEL or LOAEL observed in animal studies or<br />
human epidemiologic studies to establish inhalation “reference concentrations” (RfCs) in units of<br />
milligrams per cubic meter (mg/m 3 ). Chronic RfC are an estimate of a dose level that is not expected to<br />
result in adverse health effects in persons exposed for a lifetime, even among the most sensitive members<br />
of the population (e.g., children and the aged). Use of these uncertainty and modifying factors add<br />
conservatism into the derivation of the RfC. The chronic inhalation RfCs are presented in Table D4-1.<br />
D4.1.2<br />
Target Hazard Index<br />
Noncarcinogenic effects are health effects pertaining to the function of various organ systems due to<br />
chemically caused toxic endpoints other than cancer and gene mutations. Therefore, EPA (1991)<br />
established a target hazard quotient (THQ) to correspond to a hazard index of one or unity, which is<br />
equivalent to the degree of chemical exposure from all significant exposure pathways in a given medium<br />
below which it is unlikely for even sensitive populations to experience adverse health effects.<br />
D4-1
<strong>Appendix</strong> D, <strong>Schlage</strong> <strong>OU</strong>, San Francisco, California November 4, 2009<br />
Feasibility Study/Remedial Action Plan, <strong>Schlage</strong> <strong>OU</strong>/UPC <strong>OU</strong><br />
MACTEC Project No. 4096088522<br />
KB63190 FS-RAP <strong>Appendix</strong> D Text-<strong>Schlage</strong><br />
D4.2 Cancer Slope Factors and Target <strong>Risk</strong> Level<br />
D4.2.1<br />
Cancer Slope Factors<br />
Some chemicals have been shown, and many more are assumed to be, potential human carcinogens. To<br />
be health protective, the EPA (1989) assumes that a relatively small number of molecular events can elicit<br />
changes in a cell, ultimately resulting in uncontrolled cell proliferation and cancer. <strong>Based</strong> on this theory,<br />
the EPA uses a two-part process in evaluating the potential cancer risk of contaminants: (1) assigning a<br />
weight-of-evidence classification, and (2) calculating an inhalation unit risk (IUR) for inhalation<br />
exposures.<br />
The EPA (2005) weight-of-evidence classification system for carcinogenicity is as follows:<br />
• A Known human carcinogen;<br />
• B1 or B2 Probable human carcinogen;<br />
• C Possible human carcinogen;<br />
• D Not classifiable as to human carcinogenicity; and<br />
• E Evidence of noncarcinogenicity in humans.<br />
The weight-of-evidence classification is based on the source of the data (human epidemiology study or<br />
animal bioassay) and whether cancer has been observed in more than one animal species. These<br />
alphanumeric classifications are currently being phased out by EPA as toxicity data are reviewed and<br />
revised under the Guidelines for Carcinogenic <strong>Risk</strong> Assessment (EPA, 2005). Under the revised<br />
guidelines, a greater emphasis is placed on the conditions under which the observed effects may be<br />
expressed, such as whether the potential for carcinogenicity appears limited to a specific route of<br />
exposure, or whether carcinogenic activity may be secondary to another toxic effect. The current weightof-evidence<br />
system is a narrative classification, as follows (EPA, 2005):<br />
• Carcinogenic to humans;<br />
• Likely to be carcinogenic to humans;<br />
• Suggestive evidence of carcinogenicity, but not sufficient to assess human carcinogenic potential;<br />
• Data are inadequate for an assessment of human carcinogenic potential; and<br />
• Not likely to be carcinogenic to humans.<br />
In general, IURs have been calculated and are available for potential carcinogens in Groups A, B1, and<br />
B2, but are calculated only on a case-by-case basis for Group C (EPA, 1989). The IUR is used to develop<br />
inhalation CULs and is considered an upper-bound excess lifetime cancer risk estimated to result from<br />
continuous exposure to an agent at a concentration of 1 micrograms per cubic meter (µg/m 3 ) in air. IURs<br />
have been developed for known, likely, or suggestive evidence carcinogens for which inhalation<br />
assessments have been conducted and reviewed by EPA. The IURs for the development of CULs are<br />
presented in Table D4-1.<br />
D4.2.2<br />
Target <strong>Risk</strong> Level<br />
Since EPA (1989) assumes that a relatively small number of molecular events can elicit changes in a cell,<br />
EPA uses a two-part process in evaluating the potential cancer risk of contaminants. One part of the<br />
D4-2
<strong>Appendix</strong> D, <strong>Schlage</strong> <strong>OU</strong>, San Francisco, California November 4, 2009<br />
Feasibility Study/Remedial Action Plan, <strong>Schlage</strong> <strong>OU</strong>/UPC <strong>OU</strong><br />
MACTEC Project No. 4096088522<br />
KB63190 FS-RAP <strong>Appendix</strong> D Text-<strong>Schlage</strong><br />
process is calculating an IUR for inhalation exposures. The IUR directly relates to the incremental cancer<br />
risk over a lifetime, which is assumed to be 70 years. EPA (1991) considers a target risk range of one-inone<br />
million (1E -06 ) –to one in-ten thousand (1E -04 ) to be safe and protective of public health. Therefore, a<br />
target risk level (TRL) that corresponds to a 1E -06 was selected to evaluate the incremental risk of an<br />
individual developing cancer over a lifetime as a result of exposure to the potential carcinogen from all<br />
significant exposure pathways for a given medium. The TRL is presented on Table D3-1.<br />
D4-3
<strong>Appendix</strong> D, <strong>Schlage</strong> <strong>OU</strong>, San Francisco, California November 4, 2009<br />
Feasibility Study/Remedial Action Plan, <strong>Schlage</strong> <strong>OU</strong>/UPC <strong>OU</strong><br />
MACTEC Project No. 4096088522<br />
KB63190 FS-RAP <strong>Appendix</strong> D Text-<strong>Schlage</strong><br />
D5.0 INDOOR AIR TARGET CONCENTRATIONS<br />
This section describes the development and selection of residential and commercial indoor air target<br />
concentrations, and describes the approach that is used to evaluate potential exposures to residential<br />
receptors that live in residential units located over the garages or commercial space.<br />
D5.1 Indoor Air Target Concentrations<br />
CULs for soil gas and groundwater that are a vapor source to indoor air are developed by back-calculating<br />
a soil gas or groundwater CVOC concentration that would not result in unsafe levels of the CVOC in<br />
indoor air. Therefore, indoor air target concentrations were selected from published indoor air screening<br />
levels or calculated to represent the levels of CVOC in indoor air that would be safe (protective) for<br />
residents or commercial receptors. The residential and commercial indoor air screening levels from the<br />
California Human Health Screening <strong>Levels</strong> (CHHSLs) (CalEPA, 2005) were compared to the residential<br />
and industrial air RSLs (EPA, 2008a), respectively. The residential CHHSLs and RSLs for trans-1,2-<br />
DCE, PCE, and TCE were similar in value, but VC was not similar because RSL was derived using a less<br />
conservative IUR factor than the CHHSL value. A CHHSL value was not available for 1,1-DCE, and a<br />
RSL value was not available for cis-1,2-DCE. Therefore, the indoor air target concentrations for<br />
residential receptors were identified as the residential CHHSLs (CalEPA, 2005), with the exception of<br />
1,1-DCE, for which the residential air RSL (EPA, 2008a) was used. The commercial indoor air screening<br />
levels from the CHHSLs were not selected in that the CHHSL values are inconsistent with calculated<br />
indoor air commercial receptors. The calculated indoor air values are consistent with the RSLs, which are<br />
more current than the CHHSL values, with the exception of VC because a more conservative CalEPA<br />
IUR was selected than was used for the RSL. Therefore, the indoor air target concentrations for<br />
commercial receptors were calculated as risk-based values using the RSLs User Guide (EPA, 2008b). The<br />
noncancer and cancer indoor air concentrations were calculated to correspond to a hazard index of one or<br />
unity or a cancer risk of 1E -06 , respectively. The following equations were used to develop commercial<br />
target indoor air noncancer and cancer concentrations.<br />
Noncarcinogenic<br />
Where:<br />
µ g<br />
THQ × AT × 1000<br />
mg<br />
IA nc<br />
=<br />
1<br />
EF × ED × ET ×<br />
RfC<br />
IA nc = Noncarcinogen indoor air concentration (µg/m 3 );<br />
THQ = Target hazard quotient (unitless);<br />
AT = Averaging time (days);<br />
EF = Exposure frequency (days/year);<br />
ED = Exposure duration (years);<br />
ET = Exposure time (hours/hour); and<br />
RfC = Reference concentration (mg/m 3 ).<br />
Carcinogenic<br />
IA TR × AT<br />
= c EF × ED × ET × IUR<br />
D5-1
<strong>Appendix</strong> D, <strong>Schlage</strong> <strong>OU</strong>, San Francisco, California November 4, 2009<br />
Feasibility Study/Remedial Action Plan, <strong>Schlage</strong> <strong>OU</strong>/UPC <strong>OU</strong><br />
MACTEC Project No. 4096088522<br />
KB63190 FS-RAP <strong>Appendix</strong> D Text-<strong>Schlage</strong><br />
Where:<br />
IA c = Carcinogen indoor air concentration (µg/m 3 );<br />
TR = Target risk (unitless);<br />
AT = Averaging time (days);<br />
EF = Exposure frequency (days/year);<br />
ED = Exposure duration (years);<br />
ET = Exposure time (hours/hour); and<br />
IUR = Inhalation unit risk (µg/m 3 ) -1 .<br />
The exposure assumptions and toxicity values are provided on Tables D3-1 and D4-1, respectively.<br />
Calculated commercial indoor air concentrations and selected residential indoor air concentrations are<br />
provided on Table D5-1. For the CVOCs that have noncancer and cancer indoor air concentrations, the<br />
more conservative value was selected as the target indoor air concentration for the commercial worker<br />
receptors.<br />
D5.2 Indoor Air Concentrations - Residential Living Space<br />
For comparison purposes, the potential for airflow from on-grade commercial buildings or parking<br />
garages into residential living spaces that are located on top of the buildings/parking garages is evaluated<br />
by determining the amount of air leaking into the residential units from the garage or the commercial<br />
spaces below. The air leakage factor between the garage or commercial spaces and the residential units<br />
above was established based on published studies of airflow distribution in multifamily buildings (Feustel<br />
and Diamond, 1996; and Interstate Technology and Regulatory Council [ITRC], 2007). The ITRC<br />
scenario for multi-family dwelling that is located over a former gas station is provided in Attachment D-1.<br />
In these studies, the air leakage between the garage and the residential units above ranged from less than<br />
4%, to 5%. An air leakage value of 5% from ITRC was used to estimate the indoor air concentrations<br />
within the residential units. Specifically, the commercial indoor air target concentrations, which represent<br />
the maximum level of CVOCs that would exist in on-grade commercial buildings or parking garages,<br />
were multiplied by a 5% leakage factor to estimate the potential CVOC concentrations that could exist in<br />
overlying residential spaces.<br />
The estimated air concentrations within the residential units were compared to the residential CHHSLs<br />
(CalEPA, 2005) and ambient air background concentrations from the Bay Area Air Quality Management<br />
District (BAAQMD). A CHHSL value was not available for 1,1-DCE, so the residential air concentration<br />
from the RSLs (EPA, 2008a) was used. The ambient air background concentrations provided by<br />
BAAQMD are provided in parts per billion. The concentrations were converted to µg/m 3 using the<br />
following equation:<br />
Where:<br />
C 3 = 0. 0409 × C<br />
ppb<br />
× MW<br />
µ g / m<br />
C µg/m3 = Ambient air background concentration (µg/m 3 );<br />
C ppb = Ambient air background concentration (ppb);<br />
MW = Molecular weight of compound:<br />
MW PCE = Molecular weight of PCE = 165.8;<br />
MW TCE = Molecular weight of TCE = 131.4; and<br />
MW VC = Molecular weight of VC = 62.5.<br />
D5-2
<strong>Appendix</strong> D, <strong>Schlage</strong> <strong>OU</strong>, San Francisco, California November 4, 2009<br />
Feasibility Study/Remedial Action Plan, <strong>Schlage</strong> <strong>OU</strong>/UPC <strong>OU</strong><br />
MACTEC Project No. 4096088522<br />
KB63190 FS-RAP <strong>Appendix</strong> D Text-<strong>Schlage</strong><br />
The table below presents the calculated commercial indoor air target concentration, the estimated indoor<br />
air concentrations in overlying residential space (represented as 5% of the commercial indoor air<br />
concentration), residential CHHSLs, and ambient air background concentrations.<br />
Chemicals of Concern<br />
Commercial<br />
Indoor Air<br />
Target<br />
Concentration<br />
(µg/m 3 )<br />
Indoor Air Concentrations<br />
Estimated<br />
Residential<br />
Indoor Air<br />
Concentration b<br />
(µg/m 3 )<br />
Residential<br />
California<br />
Human Health<br />
Screening <strong>Levels</strong><br />
(CHHSLs)<br />
(µg/m 3 )<br />
Ambient Air<br />
Background<br />
Concentrations c<br />
(µg/m 3 )<br />
1,1-Dichloroethene a 876 44 210 --<br />
cis-1,2-Dichloroethene 153 7.7 36.5 --<br />
trans-1,2-Dichloroethene 263 13 73 --<br />
Tetrachloroethene 2.08 0.10 0.41 0.54<br />
Trichloroethene 6.13 0.31 1.22 0.16<br />
Vinyl chloride 0.16 0.008 0.03 0.38<br />
a The residential value is from EPA, 2008a because there is not a CHHSL value for 1,1-DCE.<br />
b Calculated as commercial indoor air target concentration x 5%.<br />
c Ambient air background concentrations from BAAQMD, 2007 and DTSC, 2009.<br />
-- = Not available.<br />
As indicated in this table, estimated indoor air concentrations in residential living space located above ongrade<br />
commercial buildings or parking garages would be below the residential CHHSLs. The estimated<br />
residential indoor air concentrations for PCE and VC are below the ambient air background<br />
concentrations. The estimated residential indoor air concentration of TCE is marginally higher than the<br />
ambient air background concentration. However, the soil gas or groundwater CULs are protective for<br />
vapor migration to on-grade commercial space occupied by full time workers (commercial buildings or<br />
parking garages) would also be protective for the indoor air in residential space located over (on top of)<br />
the commercial buildings/parking garages. An air leakage value of approximately 20% would be needed<br />
to meet the residential CHHSL values.<br />
D5-3
<strong>Appendix</strong> D, <strong>Schlage</strong> <strong>OU</strong>, San Francisco, California November 4, 2009<br />
Feasibility Study/Remedial Action Plan, <strong>Schlage</strong> <strong>OU</strong>/UPC <strong>OU</strong><br />
MACTEC Project No. 4096088522<br />
KB63190 FS-RAP <strong>Appendix</strong> D Text-<strong>Schlage</strong><br />
D6.0 CLEANUP LEVELS<br />
This section describes the development and selection of soil gas CULs by receptor. This section also<br />
provides the equations used to develop soil gas CULs.<br />
D6.1 <strong>Soil</strong> <strong>Gas</strong> <strong>Cleanup</strong> <strong>Levels</strong><br />
<strong>Soil</strong> gas CULs were developed to evaluate soil gas samples that will be collected when the soil and<br />
groundwater remediation is completed to ensure residual concentrations in soil and volatilization from<br />
groundwater is not a significant source to indoor air. The best method of evaluating potential vapor<br />
intrusion is via soil gas, and not soil or groundwater measurements. The soil gas CULs were developed<br />
using the Guidance for the Evaluation and Mitigation of Subsurface Vapor Intrusion to Indoor Air<br />
(DTSC, 2005) for commercial receptors for Zones 2 and 3, which assume there is a full-time commercial<br />
worker in the on-grade building for Zone 2 and a full-time parking attendant in the on-grade garage for<br />
Zone 3, and for residential receptors for comparison purposes, which assume that a resident lives in ongrade<br />
residential structures, using the following equation.<br />
Where:<br />
SG =<br />
IA<br />
AF<br />
SG = <strong>Soil</strong> gas concentration (µg/m 3 );<br />
IA = Indoor air target concentration (µg/m 3 ); and<br />
AF = Attenuation factor (unitless).<br />
The attenuation factors that were used to calculate the soil gas concentrations for residential and<br />
commercial receptors are default attenuation factors from the Guidance for the Evaluation and Mitigation<br />
of Subsurface Vapor Intrusion to Indoor Air (DTSC, 2005). The attenuation factor for future residential<br />
slab-on-grade was used to develop residential soil gas concentrations for comparison purposes only, and<br />
the future commercial slab-on-grade construction was used to develop commercial soil gas concentrations<br />
for the Site. The residential and commercial soil gas concentrations are provided on Table D6-1. The<br />
CHHSL values were not selected due to the inconsistencies with indoor air concentrations as stated in<br />
Section D5.1 for commercial workers, and the CHHSL soil gas concentrations for both residential and<br />
commercial workers were not developed for new construction. Also, the soil gas CULs are conservative<br />
as they do not take into consideration an air exchange rate that would further enhance dilution of CVOCs<br />
present in indoor air. In accordance with the 2007 California Mechanical Code Section 406.4.2 and<br />
Chapter 4 Table 4-4, a mechanical ventilation system shall be provided for an enclosed parking garage<br />
where the air exchange rate needs to meet a minimum exhaust rate of 0.75 cubic feet per minute per<br />
square foot (cfm/ft 2 ).<br />
D6.2 Redevelopment Zone <strong>Cleanup</strong> <strong>Levels</strong><br />
This section describes the selection of soil gas CULs for CVOCs at redevelopment zones 2 and 3 at the<br />
<strong>Schlage</strong> <strong>OU</strong>. The soil gas CULs for redevelopment zones 2 and 3 are provided below and on Table D6-2.<br />
D6-1
<strong>Appendix</strong> D, <strong>Schlage</strong> <strong>OU</strong>, San Francisco, California November 4, 2009<br />
Feasibility Study/Remedial Action Plan, <strong>Schlage</strong> <strong>OU</strong>/UPC <strong>OU</strong><br />
MACTEC Project No. 4096088522<br />
KB63190 FS-RAP <strong>Appendix</strong> D Text-<strong>Schlage</strong><br />
D6.2.1<br />
Residential Over Commercial (Zone 2) and Residential Over<br />
Podium Garage (Zone 3) <strong>Cleanup</strong> <strong>Levels</strong><br />
Redevelopment Zone 2 is designated as residential over commercial buildings, and Zone 3 as residential<br />
over podium parking construction. Both zones assume commercial receptors on the ground floor with<br />
residential receptors above. <strong>Soil</strong> gas CULs are protective of vapor intrusion to indoor air for commercial<br />
receptors, but are also protective for residential receptors that may be exposed to air that may leak from<br />
on-grade commercial buildings or parking garages to the overlying residential space.<br />
Chemicals of Concern<br />
<strong>Soil</strong> <strong>Gas</strong> <strong>Cleanup</strong> <strong>Levels</strong><br />
(g/m 3 )<br />
(g/L)<br />
1,1-Dichloroethene 2,190,000 2,190<br />
cis-1,2-Dichloroethene 383,250 383<br />
trans-1,2-Dichloroethene 657,000 657<br />
Tetrachloroethene 5,197 5.19<br />
Trichloroethene 15,330 15<br />
Vinyl chloride 393 0.39<br />
µg/L: micrograms per liter<br />
D6-2
<strong>Appendix</strong> D, <strong>Schlage</strong> <strong>OU</strong>, San Francisco, California November 4, 2009<br />
Feasibility Study/Remedial Action Plan, <strong>Schlage</strong> <strong>OU</strong>/UPC <strong>OU</strong><br />
MACTEC Project No. 4096088522<br />
KB63190 FS-RAP <strong>Appendix</strong> D Text-<strong>Schlage</strong><br />
D7.0 APPLICATION OF CLEANUP LEVELS<br />
The CULs will be compared to an exposure point concentration (EPC). The EPA defines EPCs as the<br />
representative chemical concentration a receptor may contact in an exposure area over the exposure<br />
period (EPA, 1989). The typical concept of human exposure at a Site or within a defined exposure area is<br />
an individual’s contact with the contaminated medium on a periodic and random basis. Because of the<br />
repeated nature of such contact, the human exposure does not really occur at a fixed point but rather at a<br />
variety of points with equal likelihood that any given point within the exposure area will be the contact<br />
location on any given day. Thus, the EPCs should be the arithmetic averages of chemical concentrations<br />
within the exposure area. To account for uncertainty in estimating the arithmetic mean concentration, the<br />
EPA recommends that an upper confidence limit (UCL) be used to represent the EPC. The EPCs for the<br />
CVOCs for each media of concern will be calculated using EPA’s ProUCL Version 4.0. The maximum<br />
concentration will be used for CVOCs that have insufficient number of samples to calculate a UCL.<br />
If the chemical specific ratio of the EPC to the CUL is less than 1, this indicates that a 1x10 -06 health risk<br />
for carcinogens and a hazard index of 1 for non-carcinogens has been met and that substantial health risks<br />
will not likely to be associated with that chemical. If the ratio of the EPC to the CUL is greater than 1,<br />
this indicates that the concentration of the chemical may exceed the value protective of public health. To<br />
evaluate possible exposure to multiple chemicals, the effects of multiple chemicals will be assumed to be<br />
additive and the ratios will be added together to calculate a ratio sum. A ratio sum of 1 or less indicates<br />
that substantial health risks are not likely to be associated with exposure to the multiple chemicals<br />
evaluated; whereas a ratio sum greater than 1 indicates further action may be necessary.<br />
D7-1
<strong>Appendix</strong> D, <strong>Schlage</strong> <strong>OU</strong>, San Francisco, California November 4, 2009<br />
Feasibility Study/Remedial Action Plan, <strong>Schlage</strong> <strong>OU</strong>/UPC <strong>OU</strong><br />
MACTEC Project No. 4096088522<br />
KB63190 FS-RAP <strong>Appendix</strong> D Text-<strong>Schlage</strong><br />
D8.0 CONCLUSION<br />
The soil gas CULs were developed using the previous risk assessments prepared by B&M as a guide for<br />
population selection, pathway selection, and exposure assumptions. Indoor air target concentrations were<br />
developed in order to calculate CULs for vapor intrusion from soil gas, soil, and groundwater. The soil<br />
gas CULs are presented on Table D6-1. The selected CULs for each redevelopment zone are provided on<br />
Table D6-2 and Section D6.2.<br />
D8-1
<strong>Appendix</strong> D, <strong>Schlage</strong> <strong>OU</strong>, San Francisco, California November 4, 2009<br />
Feasibility Study/Remedial Action Plan, <strong>Schlage</strong> <strong>OU</strong>/UPC <strong>OU</strong><br />
MACTEC Project No. 4096088522<br />
KB63190 FS-RAP <strong>Appendix</strong> D Text-<strong>Schlage</strong><br />
D9.0 REFERENCES<br />
Bay Area Air Quality Management District (BAAQMD), 2007. Annual Report 2003. Toxic Air<br />
Contaminant Control Program. August.<br />
Burns & McDonnell Engineering Company, Inc. (B&M), 2003. Human Health <strong>Risk</strong> Assessment of Joint<br />
Groundwater Operable Unit. March.<br />
_____, 2006a. Groundwater Monitoring & Sampling Results, <strong>Schlage</strong> Lock Company Site, San<br />
Francisco, California. January 11.<br />
_____, 2006b. <strong>Soil</strong> Sampling Summary Report, <strong>Schlage</strong> Lock Company Site, San Francisco, California.<br />
January 25.<br />
_____, 2006c. Human Health <strong>Risk</strong> Assessment for the San Francisco County Parcel of Operable Unit-1.<br />
April.<br />
_____, 2006d. Human Health <strong>Risk</strong> Assessment for the San Mateo County Parcel of Operable Unit-1.<br />
May.<br />
California Environmental Protection Agency (CalEPA), 2005. Use of California Human Health<br />
Screening <strong>Levels</strong> (CHHSLs) in Evaluation of Contaminated Properties. January.<br />
Department of Toxic Substances Control (DTSC), 1996. Supplemental Guidance for Human Health<br />
Multimedia <strong>Risk</strong> Assessments of Hazardous Waste Sites and Permitted Facilities. August.<br />
_____, 2005. Guidance for the Evaluation and Mitigation of Subsurface Vapor Intrusion to Indoor Air.<br />
California Environmental Protection Agency. Revised. February 7.<br />
_____, 2008. Consent Order, dated May 22, 2008, Docket Number HAS-CO 07/08-185.<br />
_____, 2009. Fwd: FW: Toxics Monitoring Data. Electronic mail correspondence between Calvin<br />
Willhite, DTSC, and Nyree Melancon, MACTEC. July 13.<br />
Feustel, H.E. and R.C. Diamond (Feustel and Diamond), 1996. Air Flow Distribution in a High-Rise<br />
Residential Building. Lawrence Berkeley National Laboratory, Berkeley, USA.<br />
Interstate Technology and Regulatory Council (ITRC), 2007. Technical and Regulatory Guidance<br />
Supplement; Vapor Intrusion Pathway: Investigative Approaches for Typical Scenarios. A Supplement to<br />
Vapor Intrusion Pathway: A Practical Guideline. Vapor Intrusion Team. January.<br />
MACTEC Engineering and Consulting, Inc. (MACTEC), 2008. Quarterly Groundwater Monitoring<br />
Report, Third Quarter 2008, <strong>Schlage</strong> <strong>OU</strong>, San Francisco and Brisbane, California. December 18.<br />
Office of Environmental Health Hazard Assessment (OEHHA), 2008. Toxicity Criteria Database.<br />
California Environmental Protection Agency (CalEPA).<br />
http://www.oehha.ca.gov/risk/ChemicalDB/index.asp. December.<br />
Treadwell and Rollo (T&R), 2001. <strong>Soil</strong> Operable Unit Remedial Investigation Report. <strong>Schlage</strong> Lock<br />
Company Site, 2401-2555 Bayshore Boulevard, San Francisco, California. June.<br />
United States Environmental Protection Agency (EPA), 1989. <strong>Risk</strong> Assessment Guidance for Superfund<br />
Volume I - Human Health Evaluation Manual, Part A (RAGS). EPA/540/1-89/002.<br />
_____, 1991. <strong>Risk</strong> Assessment Guidance for Superfund, Volume 1: Human Health Evaluation Manual,<br />
Supplemental Guidance, Standard Default Exposure Factors. Interim Final. OSWER Directive<br />
9285.6-03.<br />
D9-1
<strong>Appendix</strong> D, <strong>Schlage</strong> <strong>OU</strong>, San Francisco, California November 4, 2009<br />
Feasibility Study/Remedial Action Plan, <strong>Schlage</strong> <strong>OU</strong>/UPC <strong>OU</strong><br />
MACTEC Project No. 4096088522<br />
KB63190 FS-RAP <strong>Appendix</strong> D Text-<strong>Schlage</strong><br />
_____, 2005. Guidelines for Carcinogen <strong>Risk</strong> Assessment. EPA/630/P-03/001F. March.<br />
_____, 2008a. Regional Screening <strong>Levels</strong>. Region 9. September.<br />
_____, 2008b. Regional Screening <strong>Levels</strong> User Guide. September 18.<br />
_____, 2008c. Integrated <strong>Risk</strong> Information System (IRIS). Http://www.epa.gov/iris. December.<br />
D9-2
TABLES
<strong>Appendix</strong> D<br />
Feasibility Study/Remedial Action Plan, <strong>Schlage</strong> <strong>OU</strong>,<br />
San Francisco, California<br />
MACTEC Project 4096088522<br />
November 4, 2009<br />
KB63190 FS-RAP <strong>Appendix</strong> D Tables<br />
Table D3-1. Exposure Factors to Calculate <strong>Risk</strong> <strong>Based</strong> Human Health<br />
<strong>Cleanup</strong> <strong>Levels</strong> for Chlorinated Volatile Organic Compounds<br />
Exposure Parameters Units a Default or Assumed Value Reference b<br />
Target Noncancer Hazard Quotient (THQ) unitless 1 EPA, 1991<br />
Target Cancer <strong>Risk</strong> (TR) unitless 1.E-06 EPA, 1991<br />
Body Weight (BW)<br />
Child kg 15 EPA, 1991; DTSC, 1996; B&M, 2006c,d<br />
Adult kg 70 EPA, 1991; DTSC, 1996; B&M, 2006c,d<br />
Averaging Time (AT)<br />
Noncarcinogenic<br />
Residential<br />
Child days 2,190 EPA, 1991; DTSC, 1996; B&M, 2006c,d<br />
Adult days 8,760 EPA, 1991; DTSC, 1996; B&M, 2006c,d<br />
Commercial days 9,125 EPA, 1991; DTSC, 1996; B&M, 2006c,d<br />
Carcinogenic days 25,550 EPA, 1991; DTSC, 1996; B&M, 2006c,d<br />
Exposure Frequency (EF)<br />
Residential days/year 350 EPA, 1991; DTSC, 1996; B&M, 2006c,d<br />
Commercial days/year 250 EPA, 1991; DTSC, 1996; B&M, 2006c,d<br />
Exposure Duration (ED)<br />
Residential<br />
Child years 6 EPA, 1991; DTSC, 1996; B&M, 2006c,d<br />
Adult years 24 EPA, 1991; DTSC, 1996; B&M, 2006c,d<br />
Commercial years 25 EPA, 1991; DTSC, 1996; B&M, 2006c,d<br />
Conversion Factor (CF)<br />
µg/mg 1,000 --<br />
day/hour 0.042 --<br />
Exposure Time (ET)<br />
Residential hour/day 24 B&M, 2006c,d<br />
Commercial hour/day 8 B&M, 2006c,d<br />
Footnotes:<br />
a kg = kilogram; days/year = days per year; µg/mg = microgram per milligram; day/hour = day per hour; and hour/day = hours per day.<br />
b References:<br />
Burns & McDonnell (B&M), 2006c. Human Health <strong>Risk</strong> Assessment for the San Francisco County Parcel of Operable Unit - 1. Universal Paragon<br />
Corporation. April.<br />
Burns & McDonnell (B&M), 2006d. Human Health <strong>Risk</strong> Assessment for the San Mateo County Parcel of Operable Unit - 1. Universal Paragon<br />
Corporation. May.<br />
Department of Toxic Substances Control (DTSC), 1996. Supplemental Guidance for Human Health Multimedia <strong>Risk</strong> Assessments of Hazardous<br />
Waste Sites and Permitted Facilities. August<br />
United States Environmental Protection Agency (EPA), 1991. <strong>Risk</strong> Assessment Guidance for Superfund, Volume 1: Human Health Evaluation Manual,<br />
Supplemental Guidance, Standard Default Exposure Factors. Interim Final. OSWER Directive 9285.6-03.<br />
Checked: NAM<br />
Approved: MS<br />
Page 1 of 5
<strong>Appendix</strong> D<br />
Feasibility Study/Remedial Action Plan, <strong>Schlage</strong> <strong>OU</strong>,<br />
San Francisco, California<br />
MACTEC Project 4096088522<br />
November 4, 2009<br />
KB63190 FS-RAP <strong>Appendix</strong> D Tables<br />
Analyte<br />
Table D4-1. Toxicity Values for Chlorinated Volatile Organic Compounds<br />
Noncancer Chronic Toxicity Values<br />
Reference Conc.<br />
(mg/m 3 )<br />
Source a<br />
RfC<br />
Cancer Toxicity Values<br />
Unit <strong>Risk</strong><br />
(µg/m 3 ) -1<br />
Source a<br />
IUR<br />
1,1-Dichloroethene 2.00E-01 (i) -- -- C<br />
cis-1,2-Dichloroethene 3.50E-02 (oral) -- -- D<br />
trans-1,2-Dichloroethene 6.00E-02 (p) -- -- --<br />
Tetrachloroethene 2.70E-01 (a) 5.90E-06 (o) B<br />
Trichloroethene 6.00E-01 (o) 2.00E-06 (o) B<br />
Vinyl chloride 1.00E-01 (i) 7.80E-05 (o) A<br />
Abbreviations:<br />
mg/m 3 = Milligrams per cubic meter.<br />
µg/m 3 = Micrograms per cubic meter.<br />
-- = Not available.<br />
EPA = United States Environmental Protection Agency.<br />
CalEPA = California Environmental Protection Agency.<br />
Footnotes:<br />
a Values compiled from the following sources:<br />
(a) - Agency for Toxic Substances and Disease Registry (ATSDR), provided in EPA, 2008a .<br />
(i) - Integrated <strong>Risk</strong> Information System (IRIS) online database (EPA, 2008c ).<br />
(p) - Provisional Peer Review Toxicity Values (PPRTVs), provided in EPA, 2008a .<br />
(o) - Office of Environmental Health Hazard Assessment (OEHHA) Toxicity Values, provided in CalEPA, 2008 .<br />
(oral) - Oral value used for inhalation by route-to-route extrapolation.<br />
b Weight of Evidence classification (EPA, 2005 ) as listed in OEHHA and IRIS:<br />
A - Known human carcinogen.<br />
B - Probable Human Carcinogen<br />
B1 - Limited evidence of carcinogenicity in humans<br />
B2 - Sufficient evidence of carcinogenicity in animals with inadequate or lack of evidence in humans.<br />
C - Possible human carcinogen.<br />
D - Not classifiable as to human carcinogenicity.<br />
E - Evidence of noncarcinogenicity for humans.<br />
Weight-of-<br />
Evidence b<br />
References:<br />
Office of Environmental Health Hazard Assessment (OEHHA), 2008. Toxicity Criteria Database . California Environmental Protection Agency<br />
(CalEPA). http://www.oehha.ca.gov/risk/ChemicalDB/index.asp. December.<br />
United States Environmental Protection Agency (EPA), 2005. Guidelines for Carcinogen <strong>Risk</strong> Assessment . EPA/630/P-03/001F. March.<br />
United States Environmental Protection Agency (EPA), 2008a. Regional Screening <strong>Levels</strong> . San Francisco, California. September.<br />
United States Environmental Protection Agency (EPA), 2008c. Integrated <strong>Risk</strong> Information System (IRIS) . Http://www.epa.gov/iris. December.<br />
Checked: NAM<br />
Approved: MS<br />
Page 2 of 5
<strong>Appendix</strong> D<br />
Feasibility Study/Remedial Action Plan, <strong>Schlage</strong> <strong>OU</strong>,<br />
San Francisco, California<br />
MACTEC Project 4096088522<br />
November 4, 2009<br />
KB63190 FS-RAP <strong>Appendix</strong> D Tables<br />
Table D5-1. Target Indoor Air Concentration<br />
Calculated Indoor Air Concentrations<br />
Commercial<br />
Target Indoor Air Concentration<br />
Chemicals of Concern Noncancer a Cancer b Commercial c Residential d<br />
(µg/m 3 ) (µg/m 3 ) (µg/m 3 ) (µg/m 3 )<br />
C nc C c C c/i_ia C r_ia<br />
1,1-Dichloroethene 876 -- 876 210<br />
cis-1,2-Dichloroethene 153 -- 153 37<br />
trans-1,2-Dichloroethene 263 -- 263 73<br />
Tetrachloroethene 1,183 2.08 2.08 0.41<br />
Trichloroethene 2,628 6.13 6.13 1.22<br />
Vinyl chloride 438 0.16 0.16 0.03<br />
Abbreviations:<br />
µg/m 3 = Micrograms per cubic meter.<br />
-- = Not available / not applicable.<br />
Footnotes:<br />
a From Tables D3-1 and D4-1.<br />
C nc = (THQ x AT nc x CF µ/m ) / (EF x ED x ET x CF d/h x (1/RfC))<br />
b From Tables D3-1 and D4-1.<br />
C c = (TR x ATc) / (EF x ED x ET x CF d/h x IUR)<br />
c The lower value of the noncancer and cancer indoor air concentration selected as the target indoor air concentration.<br />
d The target residential indoor air concentration are indoor air California Human Health Screening <strong>Levels</strong> (CHHSLs)<br />
(CalEPA, 2005 ). A CHHSL value was not available for 1,1-DCE, so the residential air concentration from the RSLs<br />
(EPA, 2008a ) was used.<br />
References:<br />
California Environmental Protection Agency (CalEPA), 2005. Use of California Human Health Screening <strong>Levels</strong><br />
(CHHSLs) in Evaluation of Contaminated Properties . January.<br />
United States Environmental Protection Agency (EPA), 2008a. Regional Screening <strong>Levels</strong> . San Francisco, California.<br />
September.<br />
Checked: NAM<br />
Approved: MS<br />
Page 3 of 5
<strong>Appendix</strong> D<br />
Feasibility Study/Remedial Action Plan, <strong>Schlage</strong> <strong>OU</strong>,<br />
San Francisco, California<br />
MACTEC Project 4096088522<br />
November 4, 2009<br />
KB63190 FS-RAP <strong>Appendix</strong> D Tables<br />
Table D6-1. <strong>Soil</strong> <strong>Gas</strong> <strong>Cleanup</strong> <strong>Levels</strong> Protective of Indoor Air<br />
Attenuation Factor a Target Indoor Air Concentration <strong>Soil</strong> <strong>Gas</strong> <strong>Cleanup</strong> <strong>Levels</strong> e<br />
Chemicals of Concern Residential a Commercial b Residential c Commercial d Residential Commercial<br />
(unitless) (unitless) (µg/m 3 ) (µg/m 3 ) (µg/m 3 ) (µg/L) (µg/m 3 ) (µg/L)<br />
1,1-Dichloroethene 0.0009 0.0004 210 876 233,333 233 2,190,000 2,190<br />
cis-1,2-Dichloroethene 0.0009 0.0004 37 153 40,556 41 383,250 383<br />
trans-1,2-Dichloroethene 0.0009 0.0004 73 263 81,111 81 657,000 657<br />
Tetrachloroethene 0.0009 0.0004 0.41 2.08 456 0.46 5,197 5.20<br />
Trichloroethene 0.0009 0.0004 1.22 6.13 1,356 1.36 15,330 15.33<br />
Vinyl chloride 0.0009 0.0004 0.03 0.16 33 0.033 393 0.393<br />
Abbreviations:<br />
µg/m 3 = Micrograms per cubic meter.<br />
µg/L = Micrograms per liter.<br />
Footnotes:<br />
a The attenuation factor is based on future residential slab-on-grade construction (DTSC, 2005 ).<br />
b The attenuation factor is based on future commercial slab-on-grade construction (DTSC, 2005 ).<br />
c The target residential indoor air concentration are indoor air California Human Health Screening <strong>Levels</strong> (CHHSLs)<br />
(CalEPA, 2005 ). A CHHSL value was not available for 1,1-DCE, so the residential air concentration from the RSLs<br />
(EPA, 2008a ) was used.<br />
d From Table D5-1.<br />
e <strong>Soil</strong> <strong>Gas</strong> Concentration = Indoor Air Concentration / Attenuation Factor<br />
References:<br />
California Environmental Protection Agency (CalEPA), 2005. Use of California Human Health Screening <strong>Levels</strong><br />
(CHHSLs) in Evaluation of Contaminated Properties . January.<br />
Department of Toxic Substances Control (DTSC), 2005. Guidance for the Evaluation and Mitigation of Subsurface<br />
Vapor Intrusion to Indoor Air . December 15, 2004. Revised February 7.<br />
United States Environmental Protection Agency (EPA), 2008a. Regional Screening <strong>Levels</strong> . San Francisco, California.<br />
September.<br />
Page 4 of 5<br />
Checked: NAM<br />
Approved: MS
<strong>Appendix</strong> D<br />
Feasibility Study/Remedial Action Plan, <strong>Schlage</strong> <strong>OU</strong>,<br />
San Francisco, California<br />
MACTEC Project 4096088522<br />
November 4, 2009<br />
KB63190 FS-RAP <strong>Appendix</strong> D Tables<br />
Table D6-2. Final <strong>Soil</strong> <strong>Gas</strong> <strong>Cleanup</strong> <strong>Levels</strong><br />
<strong>Soil</strong> <strong>Gas</strong> <strong>Cleanup</strong> Level<br />
Chemicals of Concern<br />
Commercial a<br />
(Zone 2 and 3)<br />
(µg/m 3 )<br />
(µg/L)<br />
1,1-Dichloroethene 2,190,000 2,190<br />
cis-1,2-Dichloroethene 383,250 383<br />
trans-1,2-Dichloroethene 657,000 657<br />
Tetrachloroethene 5,197 5.20<br />
Trichloroethene 15,330 15<br />
Vinyl chloride 393 0.39<br />
Abbreviations:<br />
µg/m 3 = Micrograms per cubic meter.<br />
µg/L = Micrograms per liter.<br />
Zone 2 = Residential over commercial construction.<br />
Zone 3 = Residential over podium parking construction.<br />
Checked: NAM<br />
Approved: MS<br />
Footnotes:<br />
a The soil gas cleanup level is protective of vapor intrusion to indoor air for<br />
commercial receptors.<br />
Page 5 of 5
ATTACHMENT D-1<br />
INTERSTATE TECHNOLOGY AND REGULATORY C<strong>OU</strong>NCIL SCENARIO<br />
FOR MULTI-FAMILY DWELLING
Technical and Regulatory Guidance<br />
Supplement<br />
Vapor Intrusion Pathway:<br />
Investigative Approaches for Typical Scenarios<br />
A Supplement to Vapor Intrusion Pathway: A Practical Guideline<br />
January 2007<br />
Prepared by<br />
The Interstate Technology & Regulatory Council<br />
Vapor Intrusion Team
AB<strong>OU</strong>T ITRC<br />
Established in 1995, the Interstate Technology & Regulatory Council (ITRC) is a state-led, national<br />
coalition of personnel from the environmental regulatory agencies of some 46 states and the District of<br />
Columbia, three federal agencies, tribes, and public and industry stakeholders. The organization is<br />
devoted to reducing barriers to, and speeding interstate deployment of better, more cost-effective,<br />
innovative environmental techniques. ITRC operates as a committee of the Environmental Research<br />
Institute of the States (ERIS), a Section 501(c)(3) public charity that supports the Environmental Council<br />
of the States (ECOS) through its educational and research activities aimed at improving the environment<br />
in the United States and providing a forum for state environmental policy makers. More information<br />
about ITRC and its available products and services can be found on the Internet at www.itrcweb.org.<br />
DISCLAIMER<br />
ITRC documents and training are products designed to help regulators and others develop a consistent<br />
approach to their evaluation, regulatory approval, and deployment of specific technologies at specific<br />
sites. Although the information in all ITRC products is believed to be reliable and accurate, the product<br />
and all material set forth within are provided without warranties of any kind, either express or implied,<br />
including but not limited to warranties of the accuracy or completeness of information contained in the<br />
product or the suitability of the information contained in the product for any particular purpose. The<br />
technical implications of any information or guidance contained in ITRC products may vary widely based<br />
on the specific facts involved and should not be used as a substitute for consultation with professional and<br />
competent advisors. Although ITRC products attempt to address what the authors believe to be all<br />
relevant points, they are not intended to be an exhaustive treatise on the subject. Interested parties should<br />
do their own research, and a list of references may be provided as a starting point. ITRC products do not<br />
necessarily address all applicable health and safety risks and precautions with respect to particular<br />
materials, conditions, or procedures in specific applications of any technology. Consequently, ITRC<br />
recommends also consulting applicable standards, laws, regulations, suppliers of materials, and material<br />
safety data sheets for information concerning safety and health risks and precautions and compliance with<br />
then-applicable laws and regulations. The use of ITRC products and the materials set forth herein is at the<br />
user’s own risk. ECOS, ERIS, and ITRC shall not be liable for any direct, indirect, incidental, special,<br />
consequential, or punitive damages arising out of the use of any information, apparatus, method, or<br />
process discussed in ITRC products. ITRC product content may be revised or withdrawn at any time<br />
without prior notice.<br />
ECOS, ERIS, and ITRC do not endorse or recommend the use of, nor do they attempt to determine the<br />
merits of, any specific technology or technology provider through ITRC training or publication of<br />
guidance documents or any other ITRC document. The type of work described in any ITRC training or<br />
document should be performed by trained professionals, and federal, state, and municipal laws should be<br />
consulted. ECOS, ERIS, and ITRC shall not be liable in the event of any conflict between ITRC training<br />
or guidance documents and such laws, regulations, and/or ordinances. Mention of trade names or<br />
commercial products does not constitute endorsement or recommendation of use by ECOS, ERIS, or<br />
ITRC. The names, trademarks, and logos of ECOS, ERIS, and ITRC appearing in ITRC products may not<br />
be used in any advertising or publicity, or otherwise indicate the sponsorship or affiliation of ECOS,<br />
ERIS, and ITRC with any product or service, without the express written permission of ECOS, ERIS, and<br />
ITRC.
Vapor Intrusion Pathway:<br />
Investigative Approaches for Typical Scenarios<br />
A Supplement to Vapor Intrusion Pathway: A Practical Guideline<br />
January 2007<br />
Prepared by<br />
The Interstate Technology & Regulatory Council<br />
Vapor Intrusion Team<br />
Copyright 2007 Interstate Technology & Regulatory Council<br />
444 North Capitol Street, NW, Suite 445, Washington, DC 20001
Permission is granted to refer to or quote from this publication with the customary<br />
acknowledgment of the source. The suggested citation for this document is as follows:<br />
ITRC (Interstate Technology & Regulatory Council). 2007. Vapor Intrusion Pathway:<br />
Investigative Approaches for Typical Scenarios. VI-1A. Washington, D.C.: Interstate<br />
Technology & Regulatory Council, Vapor Intrusion Team. www.itrcweb.org.
ACKNOWLEDGEMENTS<br />
The members of the Interstate Technology & Regulatory Council (ITRC) Vapor Intrusion Team<br />
wish to acknowledge the individuals, organizations, and agencies that contributed to this<br />
supplement to the technical and regulatory guidance document Vapor Intrusion Pathway: A<br />
Practical Guideline.<br />
As part of the broader ITRC effort, the Vapor Intrusion Team effort is funded primarily by the<br />
U.S. Department of Energy. Additional funding and support have been provided by the U.S.<br />
Department of Defense and the U.S. Environmental Protection Agency. ITRC operates as a<br />
committee of the Environmental Research Institute of the States (ERIS), a Section 501(c)(3)<br />
public charity that supports the Environmental Council of the States (ECOS) through its<br />
educational and research activities aimed at improving the environment in the United States and<br />
providing a forum for state environmental policy makers.<br />
The team co-leaders, Bill Morris (Kansas Department of Health and Environment) and John<br />
Boyer (New Jersey Department of Environmental Protection), also wish to recognize the<br />
individual efforts of the following state team members:<br />
• Delonda Alexander, North Carolina Department of Environment and Natural Resources<br />
• Tonia R. Burk, Georgia Environmental Protection Division<br />
• Mary Camarata, Oregon Department of Environmental Quality<br />
• Craig Dukes, South Carolina Department of Health and Environmental Control<br />
• Peter Eremita, Maine Department of Environmental Protection<br />
• Richard Galloway, Delaware Department of Natural Resources and Environmental Control<br />
• Jerry Grimes, Virginia Department of Environmental Quality<br />
• Marilyn Hajicek, Colorado Department of Labor and Employment<br />
• Jeanene Hanley, Arizona Department of Environmental Quality<br />
• Jim Harrington, New York Department of Environmental Conservation<br />
• Tom Higgins, Minnesota Pollution Control Agency<br />
• Greg Johnson, Colorado Department of Labor and Employment<br />
• Allan V. Jones, Utah Department of Environmental Quality<br />
• Bheem R. Kothur, Florida Department of Environmental Protection<br />
• Diedre Lloyd, Florida Department of Environmental Protection<br />
• William McKercher, Mississippi Department of Environmental Quality<br />
• John S. Mellow, Pennsylvania Department of Environmental Protection<br />
• Robin Mongeon, New Hampshire Department of Environmental Services<br />
• Evelina Morales, Oklahoma Department of Environmental Quality<br />
• Susan Newton, Colorado Department of Public Health and Environment<br />
• Richard Olm, Arizona Department of Environmental Quality<br />
• Nelly F. Smith, Alabama Department of Environmental Management<br />
• Neil Taylor, Utah Department of Environmental Quality<br />
• Rod Thompson, Indiana Department of Environmental Management<br />
i
The co-leaders also wish to thank the industry and federal agency team members, contributing in<br />
various forms, to the guidance: Leah Alejo, Naval Facilities Engineering Service Center; Harry<br />
Anderson, Andre Brown, Jay Hodny, and Jim Whetzel, W. L. Gore & Associates, Inc.; Vanessa<br />
J. Bauders, U.S. Army Corps of Engineers; Tom Biksey, Environmental Strategies Consulting,<br />
LLC; Anita Broughton, Haley & Aldrich, Inc; Richard Burns, Connestoga Associates; Douglas<br />
Cox, Mitretek Systems; Dianne Easly, U.S. Environmental Protection Agency Region 7; Diana<br />
Marquez, Burns and McDonnell Engineering Company, Inc; Amy L. Edwards, Holland &<br />
Knight, LLP; Bart Eklund, URS Corporation; Rachel Farnum, GE Global Research; Mark J.<br />
Fisher, U.S. Army Corps of Engineers; Douglas M. Fitton and Eric M. Nichols, LFR Inc.; David<br />
J. Folkes, EnviroGroup Limited; Kimberly Gates, Naval Facilities Engineering Service Center;<br />
Ken Gilland, Buck Engineering; Sandra Gaurin, BEM Systems, Inc.; Jonathan Gledhill, Policy<br />
Navigation Group; Annette Guiseppi-Elie and Jenny Liu, DuPont Engineering; Blayne Hartman,<br />
H&P Mobile Geochemistry; Stephen Hoffine, Burns & McDonnell Engineering Company, Inc.;<br />
Harley Hopkins, American Petroleum Institute; Alana Lee, U.S. Environmental Protection<br />
Agency Region 9; Ronald J. Marnicio, Tetra Tech, EC; Todd McAlary, GeoSyntec Consultants;<br />
Denise Miller, ARCADIS; Ian T. Osgerby, U.S. Army Corps of Engineers New England<br />
District; Gina M. Plantz, Newfields; Henry Schuver, U.S. Environmental Protection Agency<br />
Office of Solid Waste; Fred Tillman, U.S. Environmental Protection Agency Ecosystems<br />
Research Division; Matthew Traister, O’Brien & Gere; Robert S. Truesdale, RTI; and Yvonne<br />
Walker, Navy Environmental Health Center.<br />
Special thanks to the community stakeholders, Lenny Siegel (Center for Public Environmental<br />
Oversight) and Peter Strauss (PM Strauss and Associates) for their insightful contribution to the<br />
value of the community and residents of facilities being investigated for the vapor intrusion<br />
pathway. And finally thanks to Andrea Futrell, Stacey Kingsbury, Gleness Knauer, and Steve<br />
Hill for their support and guidance in the preparation of the guidance.<br />
ii
EXECUTIVE SUMMARY<br />
This document is not meant to be a stand-alone document—it should be used in conjunction with<br />
Vapor Intrusion Pathway: A Practical Guideline (ITRC 2007). <strong>Appendix</strong> A of this document<br />
also contains Figure 3-3, “Site Investigation Flowchart,” from that technical and regulatory<br />
guidance document.<br />
The ITRC Vapor Intrusion Team comprises of a wide variety of state regulators, federal partners,<br />
industry representatives and stakeholders. It was apparent during team discussions that many<br />
vapor intrusion scenarios exist, but several seemed to continuously engage the conversation.<br />
Since these reoccurring discussions evolved around the same types of sites, the team determined<br />
that walking the reader through these common scenarios may assist in the decision-making<br />
process for a vapor intrusion investigation.<br />
The scenarios are based on the assumption that these sites start with a “yes” answer to the<br />
question in Step 7 of the practical guideline: Does the site require further investigation based on<br />
a preliminary assessment All emergency (acute) exposures, nuisance conditions, and<br />
preliminary screening have been completed, and the site has not exited from the vapor intrusion<br />
assessment process. For the purposes of the following discussion, the need for further<br />
investigation was warranted, though the reasons for the additional investigation may have been<br />
different for each scenario.<br />
Innumerable variations of vapor intrusion scenarios are possible, based on the multitude of<br />
sources and contaminants of concern, geologic and groundwater conditions, and potentially<br />
impacted properties and buildings. Differences in these conditions can lead to numerous<br />
investigation issues, constraints, and options, all of which affect the investigation work plan and<br />
its implementation. While it is impossible to describe every scenario that could result from<br />
varying circumstances, experience has shown that a few situations tend to occur more frequently<br />
than others. This document describes six different, yet common, hypothetical vapor intrusion<br />
scenarios and the investigation approaches that might be followed. Key decision points and the<br />
technical rationale for these decisions are identified in the scenarios. These key points are bolded<br />
in the text to assist the reader. Alternative approaches and investigative tools that may be chosen<br />
during the various stages are also identified.<br />
Vapor intrusion investigations can be very complex, and the scenarios are tools in themselves.<br />
The main theme of each of the scenarios is to highlight the decision process and the reasoning<br />
behind the decision, the selection of a specific tool vs. an alternative investigative strategy, and<br />
how the tool is used in the hypothetical scenarios.<br />
Review of these hypothetical case histories may help users better understand the nuances of<br />
various investigative procedures, particularly if their site is similar to one of the six scenarios,<br />
which are as follows.<br />
1. <strong>Gas</strong> station in residential neighborhood<br />
2. Dry cleaner in strip mall adjacent to neighborhood<br />
iii
3. Large industrial facility with long plume under several hundred buildings<br />
4. Vacant lot with proposed brownfield development over a groundwater plume<br />
5. Vacant large commercial building with warehouse space and office space<br />
6. Apartment building with parking garage over a groundwater plume<br />
iv
TABLE OF CONTENTS<br />
ACKNOWLEDGEMENTS............................................................................................................. i<br />
EXECUTIVE SUMMARY ........................................................................................................... iii<br />
SCENARIO 1. Residential and Commercial Receptors Located near an Active Service<br />
Station ...................................................................................................................1<br />
SCENARIO 2. Dry-Cleaning Operations in a Strip Mall near a Residential<br />
Neighborhood .......................................................................................................9<br />
SCENARIO 3. Degreasing Solvent Contamination from a Small Industrial Site on an<br />
Adjoining Mixed-Use Neighborhood .................................................................15<br />
SCENARIO 4. Brownfield Redevelopment Site (Vacant Land).................................................25<br />
SCENARIO 5. Large Industrial Building Undergoing Redevelopment......................................33<br />
SCENARIO 6. Multifamily Dwelling Located over a Former <strong>Gas</strong> Station ................................41<br />
APPENDIX Site Investigation Flowchart ...............................................................................47<br />
v
ITRC – Vapor Intrusion Pathway: Investigative Approaches for Typical Scenarios January 2007<br />
Scenario 1<br />
Residential and Commercial Receptors<br />
Located Near an Active Service Station<br />
This scenario illustrates a typical case in the assessment of the vapor intrusion (VI) due to<br />
petroleum hydrocarbon vapors.<br />
1.A DESCRIPTION<br />
The Situation<br />
As part of a corporate divesting program, a site investigation was completed on an operating gas<br />
station located in a dense residential neighborhood and submitted to the state due to the<br />
discovery of petroleum contamination. The site investigation encountered contaminated soils in<br />
the vicinity of the existing underground storage tanks (USTs)—a petroleum hydrocarbon<br />
dissolved-phase plume and a small light, nonaqueous-phase liquid (LNAPL) plume at the site.<br />
The contaminant levels in soil and groundwater and the presence of LNAPL prompted the state<br />
UST regulatory agency to require a vapor intrusion investigation to determine whether receptors<br />
were at risk.<br />
Conceptual Site Model<br />
A site visit and review of the state UST regulatory agency files allowed the new facility owner’s<br />
consultant to develop an initial conceptual site model (CSM).<br />
The site, located in a dense residential neighborhood, is mostly paved and includes a<br />
convenience store and operating gas station. Groundwater flow direction is generally to the south<br />
towards a residence that has a dirt floor crawl space. Another residential property abutting the<br />
site to the south has a full concrete basement. During a site visit, odors were noted in the on-site<br />
convenience store but not in the residences that abut the site to the south.<br />
The previous site investigation found the top of groundwater at 20 feet below ground surface<br />
(bgs). <strong>Soil</strong> borings consistently indicated sandy soil from<br />
ground surface to 30 feet below grade. The previous site<br />
investigation delineated an LNAPL plume approximately<br />
70 feet long extending downgradient from the existing<br />
USTs. A dissolved plume extended an additional 110 feet<br />
downgradient of the LNAPL plume onto a residential<br />
property to the south.<br />
The downgradient edge of the LNAPL plume has not left<br />
the site property and is approximately 50 feet upgradient<br />
from a residential structure (House 1) with the dirt floor<br />
crawl space (see Figure 1-1). A monitoring well located at<br />
Site Summary<br />
• Active service station<br />
• Groundwater @ 20 feet bgs<br />
• <strong>Soil</strong> contamination, LNAPL,<br />
and dissolved plume<br />
• Sandy soils present at site<br />
• Two residences downgradient<br />
of site, one with crawl space,<br />
the other with basement<br />
• High benzene concentrations<br />
upgradient of residences<br />
• LNAPL contained on site<br />
1
ITRC – Vapor Intrusion Pathway: Investigative Approaches for Typical Scenarios January 2007<br />
the edge of the LNAPL<br />
plume has a benzene<br />
concentration<br />
of<br />
10,000 μg/L. A monitoring<br />
well located near House 1<br />
has a benzene concentration<br />
of 500 μg/L. The most<br />
downgradient well—<br />
located between House 1<br />
and House 2, which has a<br />
full concrete basement—<br />
has a benzene concentration<br />
of 5 μg/L.<br />
Analysis of soil<br />
immediately adjacent to the<br />
existing USTs detected<br />
benzene at 100 mg/kg<br />
approximately 10 feet from<br />
the on-site convenience<br />
store.<br />
Figure 1-1. Residential neighborhood gas station.<br />
1.B VI INVESTIGATION PROCESS<br />
Is vapor intrusion occurring at this site (Use any existing data to assess whether the pathway is<br />
potentially complete).<br />
Benzene is 500 μg/L in the well closest to the residence, exceeding state risk-based groundwater<br />
screening levels by several orders of magnitude. The state oversight agency does not have any<br />
screening levels for soil phase data, so a soil gas concentration was calculated from the soil<br />
phase data using the U.S. Environmental Protection Agency (EPA) Office of Solid Waste and<br />
Emergency Response (OSWER) spreadsheet. The calculated soil gas values exceed state riskbased<br />
soil gas screening levels by several orders of magnitude.<br />
Conclusion: There is a need to collect additional data.<br />
Step 8. Choose Investigative Strategy (see Site Investigation Flowchart, Figure 3-1 of the<br />
Practical Guideline (ITRC 2007), reproduced in the appendix of this document)<br />
There are two known sources of contamination: the groundwater (free-phase product and<br />
dissolved) and contaminated soil in the tank area.<br />
2
ITRC – Vapor Intrusion Pathway: Investigative Approaches for Typical Scenarios January 2007<br />
Table 1-1 summarizes the pros and cons of the various investigation methods.<br />
Table 1-1. Pros and cons of investigative methods for Scenario 1<br />
Alternative Pros Cons<br />
Indoor air<br />
sampling<br />
Direct confirmation if<br />
benzene in building<br />
Likely to have contributions from numerous<br />
sources, especially store<br />
Can’t differentiate source<br />
Legal complications at residences<br />
Groundwater<br />
or soil phase<br />
data<br />
Passive soil<br />
gas<br />
investigation<br />
External soil<br />
gas<br />
investigation<br />
Subslab soil<br />
gas<br />
Can search and<br />
delineate extent of<br />
contamination sources<br />
Less invasive<br />
More coverage for cost<br />
Gives actual vaporphase<br />
values and<br />
reflects bioattenuation<br />
More coverage for cost<br />
Closest to receptor<br />
Preferred by many<br />
agencies<br />
Decision: External soil gas investigation was chosen.<br />
Public awareness required<br />
Sources already delineated<br />
Vapor intrusion risk often overestimated from<br />
these matrices<br />
Sources already delineated; values are qualitative<br />
Depth of sampling is typically 3 feet bgs, and<br />
basements are ~8 feet bgs<br />
Attenuation factor unknown<br />
Conservative screening levels<br />
Values may not be same as subslab<br />
Attenuation factor unknown<br />
Very intrusive; legal issues<br />
Public awareness required<br />
Rationale: Since hydrocarbons are the contaminant of concern (COC) and bioattenuation<br />
in the vadose zone may be reducing the soil gas concentrations, exterior soil gas data will be<br />
most representative of the subsurface contamination and be less invasive than subslab<br />
sampling. Indoor air was considered not to be a good alternative because of the likely<br />
presence of vapors from the active service station. Subslab sampling will be considered<br />
depending on the results from the exterior sampling.<br />
Steps 9 and 10. Design and Implement VI Investigative Work Plan<br />
There are three primary receptors: House #1, House #2, and the on-site convenience store. The<br />
initial sampling plan was designed to assess the risk to each of these receptors but not to go onto<br />
the residents’ properties to minimize legal complications.<br />
• For House #1 (located over the dissolved plume), soil gas samples from three locations at 5<br />
feet bgs along the property line adjacent to the house are planned. If values exceeding the<br />
risk-based levels are detected, a vertical profile of the soil gas from 5 feet bgs to the surface<br />
at the location showing the highest concentration will be conducted to determine whether the<br />
contamination is making it to the surface, keeping in mind that this building has a dirt crawl<br />
space instead of a slab construction. The logic for this approach is that if the<br />
contamination is not making it to the surface over a higher concentration portion of the<br />
plume, then the same will likely be true further downgradient where other houses<br />
3
ITRC – Vapor Intrusion Pathway: Investigative Approaches for Typical Scenarios January 2007<br />
reside. The vertical profile will also test for the presence of any hydrocarbons moving<br />
laterally from the station at shallower depths, which can happen if the site is completely<br />
paved over.<br />
• For House #2 (not over the groundwater plume), soil gas samples were collected at depth<br />
intervals of 3, 8 and 13 feet bgs (5 feet below the basement floor). Three locations along the<br />
property line adjacent to the residence toward the source were selected to get the<br />
concentration profile at depths corresponding to the basement walls, basement floor, and<br />
below the basement floor. The logic for this approach is that if the contamination levels<br />
are not above risk-based levels at depths corresponding to the basement walls and<br />
basement floor closer to the source, then the same will likely be true at the house that is<br />
farther away from the source.<br />
• For the on-site convenience store, four soil gas samples are<br />
planned on 10-foot spacing on the side of the store towards<br />
the tank pit at a depth just below the surface cover (asphalt<br />
or cement). The logic for this approach is that the<br />
ground surface at most service stations from the tank<br />
pit to the store is typically covered by impervious<br />
material, so near-slab soil gas data should reflect subslab soil gas data and be<br />
obtainable less intrusively. In addition, the samples will be closer to the source, so they<br />
likely will be higher concentrations than subslab samples located farther from the<br />
source. If the near-slab data exceed risk-based levels, then either additional samples will be<br />
collected around the store to get a concentration profile around the store’s footprint or, if<br />
allowed, interior samples below the slab will be collected.<br />
Having the ability to add sampling locations both spatially and vertically in real time will<br />
optimize the field effort, so on-site analysis is planned.<br />
Continuous soil cores may be collected at several locations at the property line and near each<br />
residence to get soil physical properties for later use in vapor intrusion modeling. Depending on<br />
its acceptance by the oversight agency, modeling might be used to determine site-specific<br />
screening values.<br />
Step 11. Evaluate Data<br />
Note: Some states may<br />
require different exposures<br />
pathways (future use,<br />
commercial, etc.) regarding<br />
the on-site convenience store.<br />
The state oversight agency follows the EPA OSWER guidance for soil gas samples 5 feet below<br />
the receptor but uses a different default attenuation factor of 0.01 for subslab samples.<br />
• For the residences, risk-based screening levels for benzene in soil gas at a 1-in-1-million risk<br />
level are 150 μg/m 3 for soil gas samples collected 5 feet below a receptor and 30 μg/m 3 for<br />
subslab soil gas samples.<br />
• For the convenience store, screening levels were calculated using the state-allowed subslab<br />
attenuation factor for residences of 0.01 adjusted for default exposure times and ventilation<br />
rates for commercial settings. For benzene at a 1-in-1-million risk level, the residential risk-<br />
4
ITRC – Vapor Intrusion Pathway: Investigative Approaches for Typical Scenarios January 2007<br />
based screening level is 30 μg/m 3 using an attenuation factor of 0.01. For commercial<br />
settings, assuming an exposure time of 12 hours/day, 250 days a year, and a indoor air<br />
exchange rate of 1 per hour, the calculated risk-based screening level is 11 times higher, so a<br />
value of 330 μg/m 3 will be used as the not to exceed level.<br />
Both EPA test methods 8021 and 8260 can be used for soil gas samples conducted on site and<br />
reach detection levels of 30 μg/m 3 and 100 μg/m 3 , respectively. Method 8021 was selected to<br />
reach the screening level required at the site.<br />
Since the COC is a hydrocarbon, oxygen and carbon dioxide data will be collected to show<br />
bioattenuation and document the presence of highly aerobic soils. These data can be collected<br />
using gas chromatography or with a portable field meter such as a Land Tec GEM-2000.<br />
House #1 (above the groundwater plume): The benzene values at the 5-foot collection depth<br />
ranged 1000–2000 μg/m 3 , which exceeded screening levels by >10 times. To test whether<br />
bioattenuation was reducing concentrations in the shallow vadose zone, it was decided to collect<br />
additional samples at shallower depths even though more influences from the surface would be<br />
expected. A vertical profile in the upper 5 feet gave values<br />
of 500 μg/m 3 at 3 feet bgs, 150 μg/m 3 at 2 feet bgs, and<br />
below detection (detection level of 30 μg/m 3 ) at 1 foot bgs.<br />
Oxygen levels were 12% at 3’ bgs reaching 20% at 1’ bgs.<br />
The vertical profile indicated that bioattenuation was<br />
occurring and that at least 3’ of highly aerobic (>10%) soils<br />
existed. A sample from the 1’ depth was collected for offsite<br />
TO-15 analysis to confirm field results.<br />
House #2 (not over the groundwater plume): The vertical profiles at the property line adjacent to<br />
this residence showed a rapid decrease in the benzene concentration and increase in the oxygen<br />
concentration from depth towards the surface due to bioattenuation. Benzene values 3–8 feet bgs<br />
(depth of the basement floor) were below detection (30 μg/m 3 detection level), and oxygen levels<br />
exceeded 15%. Benzene values at 13 feet bgs (5 feet below the basement) ranged from below<br />
detection to 110 μg/m 3 , which is below the risk-based screening level. All samples with<br />
nondetect benzene values were collected for off-site TO-15 analysis to reach the subslab riskbased<br />
detection limit of 30 μg/m 3 , which would apply if contamination were immediately against<br />
the basement walls.<br />
Convenience Store: The benzene concentrations in the four samples ranged 500–2000 μg/m 3 ,<br />
exceeding the calculated risk-based level of 330 μg/m 3 . Additional samples around the store<br />
showed values ranging from 500 μg/m 3 closer to the source to below detection on the side away<br />
from the source.<br />
Step 12. Is Additional Investigation Warranted<br />
Note: Groundwater<br />
concentrations should be stable<br />
prior to making final decisions<br />
regarding vapor intrusion. If the<br />
plume is expanding, then soil<br />
gas concentrations can<br />
increase with time.<br />
House #1: Possible risk exists although bioattenuation is apparent in the upper 5 feet of the soil<br />
column. Off-site TO-15 (of 1-foot bgs soil gas sample) will document whether benzene is below<br />
subslab risk level of 30 μg/m 3 . The investigator will have to convince the oversight agency that<br />
5
ITRC – Vapor Intrusion Pathway: Investigative Approaches for Typical Scenarios January 2007<br />
the shallow (
ITRC – Vapor Intrusion Pathway: Investigative Approaches for Typical Scenarios January 2007<br />
Although the samples were not collected immediately below the store footprint, there is no<br />
reason to expect there would be any significant difference under the slab, so subslab sampling is<br />
not likely to yield any benefit. Two other types of data might prove more useful for this situation:<br />
• Determination of store ventilation rate—Retail stores such as these have an enormous<br />
amount of foot traffic, which increases the ventilation rate of the store with every opening of<br />
the door. The risk-based screening levels assume a default ventilation rate of 1 room<br />
exchange per hour. The actual rate is likely to be significantly higher. The risk-based<br />
screening level increases linearly with the ventilation rate. Ventilation rates are often<br />
available from architectural drawings or are easy to determine using tracer gases.<br />
• Determination of a slab-specific attenuation factor—The risk-based screening levels assume<br />
a conservative value of the attenuation factor of 0.01. However, many slabs, especially those<br />
with floor coverings, have a higher attenuation. A slab-specific attenuation factor can be<br />
determined using natural conservative tracers, most commonly radon analyses. The riskbased<br />
screening level is inversely proportional to the attenuation factor.<br />
Step 13. Is Mitigation Warranted<br />
The determination of whether mitigation is warranted at either the residential properties or the<br />
convenience store will depend on the investigative results, regulatory agency preferences, the<br />
time frame, and numerous legal issues. If time is not a factor, legal complications could hinder<br />
sampling on the residential property. The regulatory agency may not be comfortable that the<br />
demonstration of bioattenuation on the site applies to the residence based on the SCM. In these<br />
situations, mitigation would be a suitable choice.<br />
1.C WHAT WAS UNIQUE AB<strong>OU</strong>T THIS SCENARIO<br />
• Vertical profiles were used to document bioattenuation.<br />
• Different sampling strategies were used for different buildings/receptors.<br />
• Supplemental approaches such as flux chambers, radon measurements, and ventilation rates<br />
were used.<br />
1.D LESSONS LEARNED<br />
• Near-slab data can be used to make a decision on the need for subslab data.<br />
• Supplemental tools can be extremely useful, especially for commercial settings.<br />
1.E NEXT STEPS<br />
• If flux chambers show flux into crawl space, how do we mitigate<br />
• If increased ventilation rate and slab-specific attenuation from radon still do not lower the<br />
risk levels above measured levels, then mitigation is required.<br />
• Refer to oversight agency regarding other remediation that may be necessary at the site (e.g.,<br />
soil removal, groundwater remedy, etc.)<br />
7
ITRC – Vapor Intrusion Pathway: Investigative Approaches for Typical Scenarios January 2007<br />
Scenario 2<br />
Dry-Cleaning Operations in a Strip Mall<br />
Near a Residential Neighborhood<br />
This scenario illustrates a typical assessment of the vapor intrusion risk to adjoining businesses<br />
due to tetrachloroethene contamination emanating from a dry cleaner.<br />
2.A Description<br />
The Situation<br />
This is a typical strip mall site, with a day care center, candy store, dry cleaner, hardware store,<br />
and fast food restaurant located in one commercial building with slab-on-grade construction. An<br />
odor complaint in the day care center was submitted to the local department of health, which<br />
collected an air sample. The department of health determined that the odor was likely due to<br />
tetrachloroethene (PCE) and that the levels of PCE were unacceptable but did not exceed acute<br />
levels to warrant immediate action. The investigation was addressed ultimately under the state’s<br />
voluntary cleanup program.<br />
Conceptual Site Model<br />
A preliminary assessment (PA) of the site revealed that the only viable source of PCE was the<br />
dry cleaner located several doors down from the day care center. The current owner of the dry<br />
cleaner had recently installed new equipment; however, the PA found that the dry cleaner’s<br />
historical operations likely resulted in a discharge of PCE to the back of the building via a<br />
subsurface floor drain. The new dry-cleaning equipment apparently eliminated any waste<br />
discharge, so there is no current release of PCE to the subsurface soil environment. The dry<br />
cleaner does have an air permit for the equipment.<br />
Preliminary subsurface data developed during geotechnical<br />
investigations for the construction of the strip mall indicate<br />
that groundwater is approximately 40 feet bgs and that the<br />
surficial soil consists primarily of a thick clay layer to the<br />
groundwater interface. Construction plans indicate a 6- to 8-<br />
inch-thick gravel layer directly under the slab of the building.<br />
An environmental consultant is contracted by the owners of<br />
the dry cleaner to determine the extent and severity of the<br />
potential exposure of the strip mall tenants to the historical<br />
release of PCE.<br />
Site Summary<br />
• Historic release of PCE to<br />
subsurface<br />
• No current release<br />
• Air permit for PCE at<br />
current drycleaner<br />
• Groundwater >40 feet bgs<br />
• Lithology is 5 feet silty clay<br />
with >35-foot-thick clay<br />
9
ITRC – Vapor Intrusion Pathway: Investigative Approaches for Typical Scenarios January 2007<br />
2.B VI INVESTIGATION PROCESS<br />
Data must be developed to sufficiently characterize the fate and transport of the PCE release,<br />
including whether the release has generated vapors that potentially could affect the other tenants<br />
in the strip mall.<br />
Step 8. Choose Investigative Strategy<br />
There are no preexisting data for this site to use in determining the optimal investigation method;<br />
however, the location of the source—the dry cleaner—is known. Table 2-1 summarizes the<br />
alternatives.<br />
Table 2-1. Pros and cons of investigative methods for Scenario 2<br />
Alternatives Pros Cons<br />
Perform passive soil<br />
gas investigation<br />
around perimeter of<br />
building<br />
Easy to perform; costeffective<br />
to identify areas<br />
of additional investigation<br />
Works well in tight soils<br />
Data reported in mass, not<br />
concentration<br />
Two- to three-week delay in results<br />
Sample groundwater<br />
underneath the strip<br />
mall<br />
Investigate the<br />
subslab soil gas<br />
under the entire strip<br />
mall area<br />
External soil gas<br />
investigation.<br />
Sample indoor air<br />
quality in the tenant<br />
buildings<br />
Determine whether<br />
secondary source exists<br />
that may affect strip mall<br />
and surrounding properties<br />
Determine whether PCE<br />
may be present at<br />
concentrations that could<br />
affect indoor air quality<br />
Gives actual vapor phase<br />
values<br />
Less invasive<br />
More coverage for cost<br />
Direct measurement of<br />
potential exposure point<br />
concentrations<br />
Decision: External soil gas investigation was chosen.<br />
Surface source of PCE likely to be in<br />
soil and soil vapor before groundwater<br />
The initial geotechnical data suggest<br />
that the clay lenses would inhibit the<br />
vertical migration of the PCE to the<br />
groundwater<br />
More intrusive than initial<br />
characterization<br />
May be unnecessary if determined that<br />
only portions of subsurface are affected<br />
by the release<br />
Attenuation factor unknown<br />
Conservative screening levels<br />
Results may be confounded by other<br />
sources of PCE<br />
Rationale: This strategy was considered to offer the most advantages and fewest<br />
disadvantages for locating the areas of contamination both spatially and vertically and<br />
initially assessing the vapor intrusion pathway.<br />
10
ITRC – Vapor Intrusion Pathway: Investigative Approaches for Typical Scenarios January 2007<br />
Steps 9 and 10. Design and Implement VI Investigative Work Plan<br />
Decision: The initial VI<br />
investigation was to focus on<br />
the characterizing of the<br />
subsurface conditions along<br />
the perimeter of the strip mall<br />
using direct push and<br />
sampling for volatile organic<br />
compounds (VOCs) in soil<br />
gas at depths of 2, 6, and 10<br />
feet. Direct-push borings<br />
were located along the front<br />
and back of the strip mall<br />
(Figure 2-1) approximately<br />
5–15 feet from the building<br />
and included a utility location<br />
survey.<br />
Rationale: There were no<br />
characterization data for<br />
the reported release, and<br />
the air permit was already<br />
issued to control an outdoor<br />
air emission source.<br />
Step 11. Evaluate the Data<br />
Figure 2-1. Neighborhood strip mall.<br />
Results of Sampling: The initial investigations determined the following environmental<br />
conditions of the site:<br />
Table 2-2. <strong>Soil</strong> gas sampling results, μg/m 3<br />
• The source area was identified by soil gas Sample 2 feet 6 feet 10 feet<br />
sampling, only in the back area of the strip SG-1 100,000 2,000 ND* (50)<br />
mall. Table 2-2 shows results of soil gas SG-2 1,000 75 ND (50)<br />
sampling.<br />
SG-3 100 ND (50) ND (50)<br />
SG-4 350 ND (50) ND (50)<br />
• The vapor plume extends radially from SG-5 ND (50) ND (50) ND (50)<br />
zone of release in back of dry cleaner to SG-6 250 50 ND (50)<br />
the surrounding area in a decreasing SG-7 ND (50) ND (50) ND (50)<br />
gradient to the day care center and fast SG-8 8,000 100 ND (50)<br />
food tenants.<br />
SG-9 100 ND (50) ND (50)<br />
SG-10 ND (50) ND (50) ND (50)<br />
• Confirmed soil geology in the affected SG-11 75 ND (50) ND (50)<br />
subsurface area is gravel base immediately SG-12 ND (50) ND (50) ND (50)<br />
beneath the strip mall slab to silty gravel *ND = nondetect with detection limit in parenthesis.<br />
with a thick clay layer to the groundwater<br />
11
ITRC – Vapor Intrusion Pathway: Investigative Approaches for Typical Scenarios January 2007<br />
interface.<br />
• The presence of the sewer line may be an additional transport mechanism for the PCE to<br />
areas away from the site via the sewer line trench. Additional soil gas sampling of the sewer<br />
line to determine the concentration and lateral dispersion of PCE may be needed. Initial data<br />
(SG-6, SG-9) indicate some contamination along the trench, but show concentrations rapidly<br />
decreasing with distance from the building.<br />
Step 12. Is Additional Investigation Warranted<br />
Determine whether PCE from normal dry-cleaner air emissions is being recirculated into<br />
the adjoining businesses. Check design of the exhaust of the dry cleaner to determine whether<br />
the discharge permitted from the dry cleaner could affect air intakes of the other tenants or of any<br />
adjacent buildings downwind of the dry cleaner that may have an air intake.<br />
Establish whether the air discharging from the dry cleaner may be contributing to PCE<br />
concentrations in the day care and the other tenants of the building at levels below an odor<br />
threshold.<br />
<strong>Based</strong> on the inspection of the dry-cleaner air discharge and the other tenants’ air intakes, it is<br />
unlikely, based on wind direction and location of intake, that PCE-affected air from dry cleaner<br />
is getting to the day care center; however, other tenants may be affected.<br />
Determine whether the concentrations of PCE detected along the back perimeter of the<br />
strip mall (landscaped area) are potentially migrating under the slab and potentially<br />
affecting indoor air quality. The vertical profiles indicate that the PCE contamination is a<br />
surface release, so movement laterally under the slab is a likely mechanism. The 2-foot samples<br />
closest to the candy store and day care are below commercial risk exposures but exceed allowed<br />
subslab values for a 1-in-1-million residential risk exposure (40 μg/m 3 ). These values are<br />
considered close enough to allowable levels that further assessment is deemed necessary.<br />
Conduct subslab and indoor air sampling in following buildings: fast food restaurant, hardware<br />
store, dry cleaner, candy store, and day care center. (Note, at the end of strip mall, there is a play<br />
area located outside and immediately adjacent to the day care center). Outdoor ambient sampling<br />
should be included during this phase of the investigation, and some focus on the outdoor play<br />
area may be appropriate. Community outreach with affected parties will be done at this stage, if<br />
not already instigated.<br />
Indoor air and subslab samples were taken from the<br />
occupants of the strip mall with the exception of the dry<br />
cleaner. Indoor air and subslab samples are often coupled<br />
together to aid in the determination of vapor intrusion and<br />
to enable determination of background. Results (Table 2-<br />
3) showed measurable levels in all but the fast food<br />
restaurant (indoor) location.<br />
Table 2-3. Subslab and indoor<br />
air sampling results, μg/m 3<br />
Location Subslab Indoor<br />
Day care 100 5<br />
Candy 1,500 15<br />
Dry cleaner 10,000 NA*<br />
Hardware 1,500 20<br />
Fast food 75 ND (0.2)<br />
*NA = not applicable. ND = nondetect with<br />
detection limit in parenthesis.<br />
12
ITRC – Vapor Intrusion Pathway: Investigative Approaches for Typical Scenarios January 2007<br />
The dry cleaner had the highest subslab soil gas concentration of PCE at 10,000 μg/m 3 , the<br />
hardware and candy stores had PCE concentrations at 1,500 μg/m 3 , the day care at 100 μg/m 3 ,<br />
and the fast food restaurant at 75 μg/m 3 .<br />
The state oversight agency’s acceptable indoor air level for PCE for a 1-in-1-million risk<br />
exposure for a residential setting is 0.4 μg/m 3 . For commercial settings, exposure times are<br />
approximately 5 times lower, and the state uses a 1-in-100,000 risk level, so the allowable level<br />
is 20 μg/m 3 .<br />
Step 13. Is Mitigation Warranted<br />
Although the measured indoor air concentrations appear to be acceptable, the levels in the<br />
subslab soil gas data clearly indicate that PCE from the dry cleaner has migrated underneath the<br />
slab and could impact the indoor air of the neighboring businesses. In addition, the day care<br />
center is considered a sensitive receptor, which could lead to legal ramifications if the problem is<br />
ignored. The choices here are as follows:<br />
• Do not mitigate, but continue to monitor the situation on a regular basis.<br />
• Remove the source of vadose zone contamination. Implement subslab depressurization<br />
mitigation measures, and monitor PCE concentration in depressurization discharge on a<br />
quarterly basis to determine whether source removal has mitigated the presence of PCE<br />
subslab gas and concentrations are decreasing with time.<br />
2.C WHAT WAS UNIQUE AB<strong>OU</strong>T THIS SCENARIO<br />
The first issue facing investigators at dry-cleaning sites is to determine whether PCE is currently<br />
being used in the process and whether there are any permitted waste streams that may contain<br />
PCE. Permitted waste streams that contain PCE must be considered in the relative overall<br />
assessment of potential risks from unpermitted releases that may have occurred historically or<br />
that may be continual release to the environment.<br />
The second major issue affecting dry-cleaning vapor intrusion sites is the presence of other<br />
tenants that may be affected by dry cleaners located in multiuse buildings, such as strip malls or<br />
office buildings with commercial use on the first floor.<br />
Another issue to keep in mind in a strip mall scenario is that some buildings and tenants may<br />
share heating, ventilating, and air conditioning (HVAC) systems, which can further complicate<br />
any VI investigations. There may be contributions to indoor air through the shared HVAC rather<br />
than from vapor intrusion.<br />
Finally, dense vapors of chlorinated solvents leaking from surface sources such as washing units<br />
can create vapor contamination underneath the slab that moves laterally underneath adjacent<br />
businesses. In such cases, groundwater data are likely to have little correlation with soil gas<br />
samples collected in the vadose zone.<br />
13
ITRC – Vapor Intrusion Pathway: Investigative Approaches for Typical Scenarios January 2007<br />
2.D LESSONS LEARNED<br />
• Permitted discharges from dry-cleaning operations must be considered as a potential<br />
secondary source that may affect adjacent buildings via a pathway independent of vapor<br />
intrusion through the subsurface.<br />
• <strong>Soil</strong> gas may follow preferential pathways that lead to confounding sampling results, (e.g.,<br />
the results from SG-6 seem to indicate that vapors have migrated away from the building into<br />
the disturbed soils of the utility trench and may lead to a potential impact to receptors outside<br />
the CSM initially developed.<br />
2.E NEXT STEPS<br />
Future activities at the site will include monitoring of the depressurization discharge to determine<br />
whether the removal action of the vadose zone source area was successful.<br />
Refer to the oversight agency regarding other remediation that may be necessary at the site (e.g.,<br />
soil removal, groundwater remedy, etc.).<br />
14
ITRC – Vapor Intrusion Pathway: Investigative Approaches for Typical Scenarios January 2007<br />
Scenario 3<br />
Degreasing Solvent Contamination<br />
from a Small Industrial Site<br />
on an Adjoining Mixed-Use Neighborhood<br />
This scenario illustrates a typical investigation of a large vapor intrusion site due to chlorinated<br />
VOCs (CVOCs) contamination of groundwater beneath occupied structures.<br />
3.A DESCRIPTION<br />
The Situation<br />
An industrial facility with a small degreaser contaminated groundwater off site more than 20<br />
years ago, impacting the adjoining mixed-use community. The degreaser created a small zone of<br />
high-concentration soil contamination of multiple CVOCs, resulting in a large (several-mile)<br />
groundwater plume beneath several hundred structures. The community is primarily residential,<br />
with mixed zoning of commercial properties, schools, home day cares, etc., in the area. A legacy<br />
evaluation showed that ineffective source control was installed 20 years ago on the facility<br />
property. The evaluation has been reopened specifically to evaluate vapor intrusion into<br />
structures that overlie the plume. This is a state-led site, and project costs are an issue.<br />
Conceptual Site Model<br />
Reports from the original assessment of this site were reviewed. Nothing in the reports indicated<br />
conditions likely to result in vapor impacts to the surrounding community from the soil itself or<br />
laterally from the plume. Existing state vapor intrusion guidance follows the EPA OSWER<br />
guidance and recommends that all structures within 100 feet laterally of the contamination plume<br />
be assessed. Depth to groundwater in the community over the area of the plume varies 15–30<br />
feet. Groundwater is not used as a potable source of water. The report also classified the<br />
lithology/geology of the site as alluvial sands with a clay layer at 3–5 feet bgs.<br />
Existing groundwater data and trends were reexamined<br />
with the vapor intrusion pathway in mind. Such data<br />
were compared to state-approved vapor intrusion<br />
screening levels. A definite hot spot in the<br />
groundwater was identified where concentrations<br />
exceeded screening levels by a factor of 100.<br />
Most of the buildings in the adjacent community are<br />
30–50 years old. Such structures are known to have<br />
basements or crawl spaces or were built on slabs on<br />
grade. Special populations include grade school, home<br />
day care, and several homebound individuals.<br />
Site Summary<br />
• Known CVOC contamination in<br />
groundwater<br />
• Groundwater @ 15–30 feet bgs<br />
• Lithology: alluvial soil with clay<br />
layer 3–5 feet bgs<br />
• Plume several miles long<br />
• Hundreds of occupied structures<br />
above plume<br />
• Structures have basements and<br />
crawl spaces; some slab on grade<br />
• Hot-spot concentration 100 times<br />
screening levels<br />
15
ITRC – Vapor Intrusion Pathway: Investigative Approaches for Typical Scenarios January 2007<br />
3.B VI INVESTIGATION PROCESS<br />
Step 8. Choose Investigative Strategy<br />
Should the investigation encompass the entire area of groundwater contamination or proceed<br />
with a more focused approach There are many factors that go into this decision. It is important<br />
to develop a comprehensive work plan and CSM. Table 3-1 summarizes the alternatives.<br />
Table 3-1. Pros and cons of investigative methods for Scenario 3<br />
Alternatives Pros Cons<br />
Ability to evaluate an<br />
entire site ensures that all<br />
areas and conditions are<br />
considered (most<br />
conservative approach)<br />
Investigate entire area<br />
where groundwater<br />
exceeds screening<br />
levels to reduce area<br />
of VI concern<br />
Statistical selection of<br />
structures within<br />
contamination area<br />
Model groundwater<br />
data to limit area of VI<br />
concern (regulatory<br />
agency may not allow<br />
modeling)<br />
Focus area on hottest<br />
part of plume<br />
Gives a representative mix<br />
of sampling locations<br />
Provides broader coverage<br />
than just hot spots<br />
Inexpensive<br />
Can be done with existing<br />
data if of sufficient quality<br />
and detail<br />
Saves cost<br />
Minimizes disturbance to<br />
residents<br />
Decision: Focus the investigation on the hottest part of the plume.<br />
Very costly<br />
May be unnecessary if it is<br />
determined there is no VI in hot spot<br />
Can be costly if sample size needs to<br />
meet data quality objectives (large<br />
sampling size)<br />
Although costs can be reduced, the<br />
size of the investigation is not<br />
necessarily reduced<br />
Conservative assumptions should be<br />
used due to model imprecision and<br />
uncertainty<br />
May miss some impacted receptors<br />
Not-included residences may get<br />
concerned<br />
Rationale: There are sufficient groundwater concentration data to identify the hottest part<br />
of plume. Geologic conditions are relatively uniform across the site, such that groundwater<br />
concentrations are likely to define the area with the greatest VI potential (in some cases,<br />
depth to groundwater, soil type, and building conditions may be as or more important than<br />
groundwater concentrations, making selection of a hot spot more difficult). So it is<br />
concluded that it is safe to limit the initial VI investigation on this area in the plume.<br />
The hot spot covers approximately five square blocks (~50 structures). Two sensitive<br />
populations are located in the hot spot, and one is directly adjacent to the hot spot.<br />
Table 3-2 summarizes the several methods that can determine the presence and/or concentrations<br />
of contaminants at various points along the vapor intrusion pathway.<br />
16
ITRC – Vapor Intrusion Pathway: Investigative Approaches for Typical Scenarios January 2007<br />
Table 3-2. Pros and cons of investigative methods for Scenario 3 along identified pathway<br />
Alternatives Pros Cons<br />
Additional<br />
groundwater<br />
sampling<br />
Groundwater concentrations<br />
are likely to define the area<br />
with the greatest VI potential<br />
More expensive and slower than soil gas<br />
sampling<br />
May or may not reflect soil gas<br />
Passive soil gas Can be used to focus areas of<br />
investigation<br />
Less invasive, easily installed,<br />
greater number of sampling<br />
locations for lower costs<br />
External soil<br />
gas<br />
investigation<br />
Indoor air<br />
sampling<br />
Investigate the<br />
subslab soil gas<br />
under receptors<br />
over hot spot<br />
Less invasive than subslab<br />
sampling<br />
Faster, less expensive than<br />
groundwater sampling<br />
Can obtain actual exposure<br />
data; can be cheaper if there is<br />
a signature compound (e.g.,<br />
1,1-dichloroethene, carbon<br />
tetrachloride)<br />
If geology doesn’t warrant soil<br />
gas investigation<br />
Gives actual value under<br />
receptors<br />
concentrations under or near receptors<br />
Quantitative testing will still be required<br />
to evaluate vapor intrusion potential and<br />
risks, if any<br />
Location of hot spot already known<br />
External soil gas results may not be<br />
representative of subslab data in lowpermeability,<br />
heterogeneous, or<br />
fractured materials<br />
Background contaminant issues make it<br />
difficult to interpret indoor air results<br />
Has the potential to be more costly,<br />
(multiple sampling events, hardware<br />
problems, etc.)<br />
Must start community relations/<br />
communications at this point<br />
Very intrusive and more expensive<br />
Fewer data points<br />
Decision: The alternative of an external soil gas investigation in the hot spot area was chosen.<br />
Rationale: This is the most practical approach based upon consistent geology and the fact<br />
that the preexisting data enable identification of the worst case area of the plume. <strong>Soil</strong> gas<br />
sampling allows evaluation of a large area with relatively low impacts to occupants of the<br />
structures.<br />
Step 9. Design VI Investigative Work Plan<br />
Determine Target/Screening <strong>Levels</strong>: <strong>Risk</strong>-based screening levels for COCs in soil gas at a<br />
1-in-1-million risk level are ~250 μg/m 3 for soil gas samples collected 5 feet bgs. Commercial<br />
receptors are regulated at 1-in-100,000 risk level, so target levels are at least 10 times higher<br />
(>2,500 μg/m 3 )<br />
To perform the initial soil gas investigation, samples are to be taken in the rights-of-way along<br />
the axis of the plume with multiple transects across the focus area (Figure 3-1). <strong>Soil</strong> gas samples<br />
will be collected at 5-foot intervals, vertical spacing may be different if implants are to be<br />
installed, and several vertical soil gas profiles will be taken.<br />
17
ITRC – Vapor Intrusion Pathway: Investigative Approaches for Typical Scenarios January 2007<br />
Figure 3-1. Potential locations for soil gas sampling.<br />
Initial samples will be analyzed on site by EPA Methods 8021/8260 if a mobile lab is available.<br />
(Quality assurance note: ~10%–20% samples collected in canisters for TO-15 off-site<br />
analysis.) Once work starts in any neighborhood, community relations/communication may<br />
be necessary.<br />
Steps 10 and 11. Collect and Evaluate Data<br />
(These two steps are actually combined for this type of<br />
scenario. Since the sampling program is designed to collect<br />
data, review data, and make additional decisions regarding step<br />
out sampling, it highlights the iterative process of vapor<br />
intrusion investigations.)<br />
<strong>Soil</strong> gas data indicated about 15–20 structures are of higher<br />
concern and need additional investigation (the shallow soil gas<br />
concentrations in the area are approximately two orders of<br />
magnitude over screening levels, the rest of the focus area<br />
about one order of magnitude higher). The data suggest<br />
additional investigation is needed.<br />
Note: The COC(s) at the site<br />
may change the investigative<br />
methodology chosen. Certain<br />
chemicals are good tracers<br />
and do not have the same<br />
issues with background (e.g.,<br />
1,2–dichloroethene, carbon<br />
tetrachloride). Indoor air<br />
sampling may be the most<br />
appropriate investigative tool<br />
in these cases. The oversight<br />
agency may also require<br />
indoor air sampling as the<br />
primary investigative tool.<br />
18
ITRC – Vapor Intrusion Pathway: Investigative Approaches for Typical Scenarios January 2007<br />
Alternatives: Conduct additional exterior near-slab sampling around structure or subslab<br />
sampling in all structures near high soil gas concentrations.<br />
Decision: Conduct subslab sampling. Community participation/communications are necessary at<br />
this point.<br />
Rationale: Exterior soil gas concentrations are very high at shallow depths, and access<br />
limitations are not a problem; otherwise, additional exterior near-slab data might have<br />
been chosen.<br />
The subslab data exceeded allowable risk-based screening levels at eight structures by a factor of<br />
at least 10.<br />
Step 12. Additional Investigation for the Affected Structures<br />
Alternatives: Measure slab-specific attenuation factors using radon, measure indoor ventilation<br />
rate, measure pressure gradients, use flux chambers in crawl spaces, measure indoor air.<br />
Decision: Indoor air sampling is selected as next step.<br />
Rationale: COCs were not common household chemicals, so potential for background<br />
sources is not considered, and all houses were slab-on-grade with floor coverings.<br />
Six of the eight structures failed indoor air levels by up to factor of 10.<br />
Alternatives: Monitor indoor air or mitigate structures.<br />
Decision: The six structures with high indoor levels were mitigated. At the other two structures,<br />
resampling was proposed.<br />
Rationale: Due to the costs associated with indoor air sampling and issues related with<br />
sampling, it was determined that installing subslab depressurization systems was more<br />
cost-effective than additional sampling at the six homes having high indoor air<br />
concentrations.<br />
Since some of the structures over the highest concentration part of the plume clearly had indoor<br />
air impacts, additional investigation to the nearby homes is warranted. Alternatives include the<br />
following:<br />
• Additional exterior soil gas sampling near and around foundations<br />
• Additional subslab sampling<br />
• Additional indoor air sampling<br />
Decision: Collect additional subslab samples by stepping out two additional structures in all<br />
directions from mitigated houses. Continue this sampling protocol until lines of evidence and the<br />
two structures show no vapor intrusion impacts.<br />
19
ITRC – Vapor Intrusion Pathway: Investigative Approaches for Typical Scenarios January 2007<br />
Rationale: This decision point would depend on the results of the first indoor air sampling<br />
event. (That is, for this scenario the levels found within the structures were within an order<br />
of magnitude of the allowed risk-based level. Had they been several orders of magnitude, it<br />
may have been prudent to step out more than two houses.) This point should be covered in<br />
the CSM and work plan, and the regulatory authority will have input. Any community<br />
action groups should be notified of this strategy up front as a practical approach.<br />
Once this process is stated, it is practical to continue until there are several clean structures since<br />
there has been a continual community involvement effort.<br />
These decision points may be different depending on original course of the investigation.<br />
Step 13. Mitigation to Receptors and Remediation of Groundwater<br />
Decision: Verify clean structures are “clean” and mitigation systems are working properly.<br />
Rationale: An additional indoor sampling event when buildings were closed was performed<br />
and verified “clean.” (Community participation/communications have been ongoing at<br />
site.)<br />
Depending on the approach selected, it is important to remember that anytime during this process<br />
modeling with current data collected at the various phases may be performed to determine<br />
whether additional sampling, closure, etc. is/are warranted.<br />
Decision: Institute groundwater—long-term monitoring and closure.<br />
Rationale: Since vapor intrusion has been identified, source control should be considered<br />
unless it can be documented that source concentrations will decline within the time frame<br />
of the operation and maintenance of the mitigation systems. Monitoring and closure<br />
activities will be different from state to state and possibly from structure to structure.<br />
3.C WHAT WAS UNIQUE AB<strong>OU</strong>T THIS SCENARIO<br />
Numerous issues are unique to large vapor intrusion sites, including the extensive resources and<br />
time required to address them, the need for public communications and outreach, and the<br />
logistical challenges associated with investigating and potentially mitigating large numbers of<br />
buildings. Other issues faced by most vapor intrusion sites are often exacerbated by the size and<br />
complexity of large sites, including variable site conditions, seasonal factors, future land use, and<br />
separating the contributions of vapor intrusion from those of background sources.<br />
The first issue facing investigators at large vapor intrusion sites is simply the resources, time, and<br />
money required to determine the extent of vapor intrusion impacts, if any, and to address these<br />
impacts through mitigation or other actions. As a result, site screening becomes a more critical<br />
step to ensure that the costly and involved process triggered by intrusive testing is warranted.<br />
Unfortunately, generic screening levels are often set at (or, in some jurisdictions, below)<br />
20
ITRC – Vapor Intrusion Pathway: Investigative Approaches for Typical Scenarios January 2007<br />
maximum contaminant levels so that the entire plume area is, by definition, above the generic<br />
screening level. Semi-site-specific screening levels may be difficult to apply to large plume areas<br />
due to variable depths to groundwater and soil types and may not raise screening levels high<br />
enough to eliminate an entire plume. Therefore, selection of worst-case buildings often becomes<br />
a critical step for large sites, allowing site-specific testing of a more manageably sized area.<br />
Worst-case building selection can be challenging on its own because of the large number of<br />
factors that contribute to the potential for vapor intrusion, including concentrations in<br />
groundwater, depth to groundwater, geologic conditions, buildings conditions, and building use.<br />
As a result, more than one “worst-case” area may warrant investigation, and more than one<br />
building should be investigated in each worst-case area. To be effective, a worst-case area must<br />
serve as a surrogate for the entire site; i.e., if no vapor intrusion impacts are found in the worstcase<br />
area(s), then no further investigations should be required in the other areas of the site.<br />
Additional groundwater and/or soil vapor data may be warranted to better define worst-case<br />
areas and buildings.<br />
Delineation of the extent of vapor intrusion impacts, if detected in worst-case buildings, is<br />
another issue often faced at large sites. Once again, because of the costs and time associated with<br />
testing a large number of buildings, large sites require efficient decision-making strategies to<br />
limit unnecessary tests. Delineation is commonly accomplished by a “step-out” process, with a<br />
methodical set of rules for selecting buildings for testing (and for stopping testing) around worstcase<br />
or other buildings found to have vapor intrusion impacts. Issues that investigators face when<br />
designing step-out testing programs include the following:<br />
• How many buildings do you test beyond a building with impacts, and in what directions<br />
• Where do you not test (e.g., when requests for testing are received)<br />
• When do you stop testing What are the criteria A certain distance (e.g., 100 feet) beyond<br />
the edge of the groundwater plume A certain number of unimpacted buildings<br />
• What kind of tests do you conduct The same tests in all buildings or different types of test<br />
depending on concentrations, proximity to the edge of the plume, etc.<br />
• Can you make reliable decisions based on fewer tests per building (compared to a single<br />
building case), based on the knowledge gained from testing many buildings in the same area<br />
• Do you make preemptive risk-management decisions without testing all buildings (e.g.,<br />
blanket mitigation)<br />
The second major issue affecting large vapor intrusion sites is public communications and<br />
outreach. Smaller sites may involve only the responsible party’s own site, their lessees, or a<br />
small number of adjacent landowners. Large sites may involve hundreds of different landowners<br />
with different types of buildings and issues, including single-family homes, multifamily<br />
buildings, commercial operations with employees and customers, schools, churches, day care<br />
operations, and public institutions such as libraries. A comprehensive public communications<br />
program will be essential to educate the public and put risks into perspective, gain access to<br />
properties and/or buildings for testing, schedule tests, report results, and install mitigation<br />
systems, if necessary. In addition, community leaders, government representatives, other<br />
regulatory agencies, realtors, and other members of the public may be indirectly affected by the<br />
investigation and require timely information. Finally, the media will need to be informed to<br />
21
ITRC – Vapor Intrusion Pathway: Investigative Approaches for Typical Scenarios January 2007<br />
minimize miscommunication of information to the public. A key issue facing investigators and<br />
regulators of large sites is to determine when public outreach should begin so as to provide<br />
timely notice of potential concerns and investigation activities without creating unnecessary<br />
alarm.<br />
The third major issue affecting both investigators and regulators at large sites is the logistical<br />
challenge associated with investigating and potentially mitigating a large number of buildings in<br />
a relatively short period of time. Investigators must be prepared, often with little advanced<br />
warning, to coordinate access and schedule tests with a large number of property owners; to<br />
obtain, store, and ship large numbers of samples (potentially bulky Summa canisters); to manage<br />
and report large quantities of data to both agencies and property owners on a continual and<br />
relatively rapid turnaround basis; and to coordinate the installation, monitoring, and operation<br />
and maintenance of a large number of mitigation systems. With most of the contamination being<br />
off site, institutional controls may not applicable in this scenario, so long-term monitoring of the<br />
systems needs to be considered. Regulators may be contacted by a large number of interested<br />
parties asking for information over an extended time period and may be under a great deal of<br />
pressure to make a large number of risk-management decisions in short time frames.<br />
Finally, issues potentially affecting all vapor intrusion sites regardless of size are often<br />
exacerbated at large sites. Geologic, groundwater, and building conditions are likely to vary to<br />
greater degrees across larger sites. Each building at a large site may also have unique materials<br />
and occupant activities creating potential background sources. At the same time, it is impractical<br />
to study each building and property at a large site to the degree of detail feasible at smaller sites.<br />
Therefore, building-specific decisions have to be made using less information than typically<br />
available at smaller sites. On the other hand, the database of information provided by testing at<br />
numerous buildings may provide<br />
different tools for evaluating vapor<br />
intrusion impacts that are not available<br />
at smaller sites. For example, spatial<br />
patterns and correlations with other site<br />
factors based on testing at other<br />
properties may aid interpretation of<br />
individual test results.<br />
3.D LESSONS LEARNED<br />
• There are an infinite number of<br />
investigative strategies to handle<br />
large vapor intrusion sites. There is<br />
no cookie-cutter approach to their<br />
investigation. The process must to<br />
start with the CSM and proceed<br />
from there.<br />
• Expect surprises, especially<br />
additional sources when dealing<br />
with large plumes.<br />
Lessons Learned from Redfields<br />
• Very low levels of groundwater contamination can<br />
cause vapor intrusion.<br />
• If using soil gas sampling for screening large site,<br />
make sure to use state-of-the-art techniques,<br />
including the use of vapor implants and tracer<br />
compounds to ensure that the results are the<br />
subsurface soil gas and not ambient air.<br />
• Subslab sampling is likely to be a better indicator of<br />
vapor intrusion potential than soil gas sampling<br />
remote from the building (e.g., in public areas) or<br />
even adjacent to the structure.<br />
• There can be many complications with sampling<br />
indoors due to background chemicals in the<br />
structure. Indoor product inventory is essential to<br />
demonstrate that contributions to indoor air<br />
concentrations are not due to vapor intrusion.<br />
However, inventories may not identify all sources,<br />
particularly if the compound is not indicated on the<br />
container or is present in building materials<br />
• Large sites will be very costly no matter what type of<br />
investigation strategy is used.<br />
• External drivers that dramatically affect the cost of<br />
mitigation include asbestos, dry-layered foundation<br />
walls, and multiple foundations (grade beams, etc.).<br />
22
ITRC – Vapor Intrusion Pathway: Investigative Approaches for Typical Scenarios January 2007<br />
• <strong>Soil</strong> gas investigations may be the preferred method of screening a large vapor intrusion site<br />
if subsurface conditions are suitable and conservative assumptions (i.e., attenuation factors or<br />
modeling assumptions) are applied, but they may not be adequate to close out a site.<br />
• Community involvement is paramount at all sites, more so at large sites. It can greatly<br />
influence how well the investigation proceeds. Significant resources are required for gaining<br />
access to buildings, scheduling tests, and communicating with building owners and<br />
occupants.<br />
• While mitigation of typical residences is straightforward and in many cases less expensive<br />
than resampling multiple times, there will be exceptions.<br />
• Ongoing monitoring of both mitigated and unmitigated buildings can be very expensive,<br />
depending on the number of homes selected for monitoring and the testing frequency.<br />
3.E NEXT STEPS<br />
• Future activities at the site will include groundwater and soil gas monitoring, maintenance,<br />
and performance testing of the vapor intrusion mitigation systems.<br />
• Groundwater, soil gas, and indoor air monitoring will occur for the foreseeable future.<br />
• Groundwater movement may create vapor intrusion issues within structures that are not<br />
currently impacted. An effective groundwater/soil gas monitoring network will be<br />
established and sampled at appropriate intervals.<br />
• Existing mitigation systems will be inspected on a regular basis. A work plan should be<br />
created that details the inspection procedures, frequency, and termination procedure.<br />
• A groundwater or vadose zone source control remedy may be implemented to reduce<br />
subsurface vapor concentrations. The remedy will need to be coordinated with the vapor<br />
intrusion investigation.<br />
• Data collected from the subsurface and indoor air sampling will be analyzed to develop sitespecific<br />
attenuation factors. The attenuation factors may be useful as a screening tool. When<br />
used in conjunction with the soil gas data from the monitoring wells, vapor intrusion problem<br />
spots may be identified. However, it should be noted that even site-specific attenuation<br />
factors may span several orders of magnitude; therefore, application of the most conservative<br />
attenuation factor (generally necessary unless attenuation factors can be correlated with other<br />
parameters, such as depth to groundwater or soil type) will still result in a significant number<br />
of false positives.<br />
• Community involvement will be an ongoing activity at the site. The vapor intrusion<br />
mitigation systems and source control are long-term actions that will require community<br />
input. A community involvement plan will be developed.<br />
• Refer to the oversight agency regarding other remediation that may be necessary at the site<br />
(e.g., soil removal, groundwater remedy, etc.).<br />
23
ITRC – Vapor Intrusion Pathway: Investigative Approaches for Typical Scenarios January 2007<br />
Scenario 4<br />
Brownfield Redevelopment Site (Vacant Land)<br />
This scenario illustrates a typical vapor intrusion investigation at a vacant brownfield site slated<br />
for future development.<br />
4.A DESCRIPTION<br />
The Situation<br />
A 20-acre brownfield site is being sold for redevelopment. The proposed redevelopment plan<br />
consists of converting an old abandoned factory into apartments and the remaining 15 acres into<br />
mixed commercial and residential uses. A Phase 1 evaluation indicated that the old factory<br />
contained a degreaser and parts-washing operation using chlorinated solvents and that the<br />
undeveloped area was used for fire training by the local fire departments. Records indicate that<br />
the fire training operation used pits for fuel oil, but historical aerial photographs did not show<br />
evidence of the locations of the pits.<br />
Conceptual Site Model<br />
The site consists of uniform stratigraphy, primarily silty sand with some fill material near the old<br />
factory. Depth to groundwater is approximately 20 feet across the site. No groundwater wells<br />
exist on the property, so the gradient is unknown. From neighboring properties, it is expected<br />
that the factory is downgradient of the area containing the training pits.<br />
A limited Phase 2 investigation found soil contamination in defined areas to 10-feet depths<br />
within the fire training areas believed to be the former pits. Free product was detected on the<br />
groundwater in the vicinity of the former pits and lies about 500 feet from the factory. A limited<br />
number of discrete water samples were collected near the factory, and no evidence of chlorinated<br />
solvent contamination was detected in the groundwater. Discrete groundwater samples were also<br />
collected at one location on each border of the property, and no contamination was found. Since<br />
there are no occupied buildings currently on the property, no further work was done pending<br />
future development.<br />
Since there are no receptors currently of concern, the<br />
issue is whether there might be potential vapor<br />
intrusion risk to future buildings. Fuel oil does not<br />
contain high concentrations of benzene but does<br />
contain naphthalene and a mix of alkanes that are of<br />
concern to some regulatory agencies. The factory<br />
used chlorinated solvents that might have left<br />
contamination, regardless of the previous<br />
groundwater data showing little contamination. In<br />
this case, the available data are too limited to answer<br />
Site Summary<br />
• Phase 2 found soil contamination in<br />
fire pits<br />
• Free product found in pit area<br />
• Limited water samples found no<br />
groundwater contamination<br />
• No additional work done, awaiting<br />
property redevelopment<br />
• No current receptors—“Future Use”<br />
• Very little data to work with<br />
25
ITRC – Vapor Intrusion Pathway: Investigative Approaches for Typical Scenarios January 2007<br />
whether vapor intrusion may be a concern to future buildings. Since little is known about the site<br />
and proposed redevelopment covers most of the site, the entire parcel needs to be investigated.<br />
Conclusion: Sufficient data do not exist to close VI pathway. Need to collect additional data.<br />
4.B VI INVESTIGATION PROCESS<br />
Step 8. Choose Investigatory Strategy<br />
There are two known sources of contamination:<br />
• The fuel oil in the training area<br />
• Chlorinated hydrocarbons near the factory building<br />
Table 4-1 summarizes the pros and cons of the various applicable methods.<br />
Table 4-1. Pros and cons of investigative methods for Scenario 4<br />
Alternative Pros Cons<br />
Groundwater<br />
or soil phase<br />
data<br />
Can search and delineate extent of<br />
contamination sources<br />
Vapor intrusion risk is often<br />
overestimated from these matrices<br />
Expensive for a large site<br />
<strong>Soil</strong> phase data unreliable for<br />
Active soil<br />
gas<br />
investigation<br />
Passive soil<br />
gas<br />
investigation<br />
Will reflect soil and groundwater<br />
contamination<br />
Less expensive than soil and<br />
groundwater data<br />
Gives quantitative vapor-phase values<br />
Identifies areas that may need further<br />
investigation<br />
Easy to install<br />
Gives best coverage for least cost<br />
vapor intrusion<br />
Not as easy or inexpensive for a<br />
large site<br />
Data may require follow-up<br />
quantitative sampling<br />
Decision: A combined passive soil gas and active soil gas program was considered to offer the<br />
most advantages for this site.<br />
Rationale: The passive soil gas survey would be used to determine areas where VOC<br />
contamination exists on the site to be followed by an active soil gas program in the<br />
identified contamination areas.<br />
Step 9. Design VI Invesigative Work Plan<br />
To determine target/screening levels, the state oversight agency has its own guidance, which<br />
allows risk-based screening values to be determined from modeling. Version 3.1 of the Johnson-<br />
Ettinger soil gas screening spreadsheet was used. The scenario modeled was slab-on-grade<br />
construction, silty vadose zone, and default values for all other parameters. Since residences are<br />
26
ITRC – Vapor Intrusion Pathway: Investigative Approaches for Typical Scenarios January 2007<br />
planned in several portions of the site, residential screening levels apply. Subslab screening<br />
levels were obtained from the same spreadsheet using a 2-foot depth below the slab. The<br />
allowable indoor air concentrations at a 1-in-1-million risk level or a hazard index of 1 from the<br />
state guidance for TCE, 1,1,1-TCA, and naphthalene are 0.022 μg/m 3 , 2,200 μg/m 3 , and 3.0<br />
μg/m 3 , respectively. Table 4-2 shows the risk-based screening levels derived from the model<br />
compared to generic screening values in the EPA OSWER guidance using default attenuation<br />
factors. Also included are the dilution factors for soil gas to indoor air defined as the inverse of<br />
the attenuation factor. Comparison of the generic screening values to the site-specific values<br />
derived from the model show that the generic values are about 30 times more conservative for<br />
the subslab values, but very similar for the 5-foot depth.<br />
Table 4-2. <strong>Risk</strong>-based screening levels derived from J&E Model versus generic values from<br />
EPA OSWER guidance<br />
Location<br />
TCE 1,1,1-TCA Naphthalene<br />
Generic Modeled Generic Modeled Generic Modeled<br />
Subslab, μg/m 3 0.22 6.7 22,000 680,000 30 1,000<br />
Dilution factor 10 306 10 308 10 341<br />
5 feet, μg/m 3 11.0 11.2 1,100,000 1,100,000 1,500 2,000<br />
Dilution factor 500 510 500 510 500 613<br />
Since fuel hydrocarbons are present, EPA test method 8021 may be subject to interferences and<br />
false positives. Method 8260 (GC/MS) is not subject to interferences, can be conducted on site,<br />
and reaches detection levels except for subslab naphthalene detection levels. Method 8260 will<br />
be used with a subset of subslab samples collected for off-site analysis for naphthalene by<br />
method TO-15 or TO-17 if the 8260 analysis is nondetect.<br />
On-site analysis for total alkanes will be done by method 8015 modified (GC–flame ionization<br />
detector). This method gives a detection limit of approximately 50 μg/L for C10 to C20<br />
hydrocarbons. If nondetect, a sample will be collected for off-site analysis by method TO-15 or<br />
TO-3.<br />
Methane will be measured by EPA method 8015 modified, and oxygen and carbon dioxide with<br />
a portable field meter (e.g., Land Tec GEM-2000, etc.).<br />
Step 10. Collect Data<br />
Passive <strong>Soil</strong> <strong>Gas</strong> Program: <strong>Based</strong> on the Phase 2 assessment, passive soil gas samples were<br />
collected on a regularly spaced grid of 100-foot centers in the undeveloped areas. The suspected<br />
fire pit areas, degreaser location, and the old factory were subjected to a more dense sampling<br />
grid of 50-foot centers. The sorbent-based samplers were placed 2–3 feet bgs and were analyzed<br />
by gas chromatography (GC)/mass spectroscopy (MS) (8260/8270 or TO-15) for fuel-related and<br />
chlorinated compounds.<br />
27
ITRC – Vapor Intrusion Pathway: Investigative Approaches for Typical Scenarios January 2007<br />
Results from the Passive <strong>Soil</strong> <strong>Gas</strong> Survey:<br />
Factory: High levels of trichloroethene (TCE) were<br />
found in the area containing the degreaser and<br />
adjacent to this location beneath the factory slab<br />
(Figure 4-1).<br />
Fire Training Area: Numerous detections of<br />
hydrocarbons out into the C20 range and naphthalene,<br />
were detected in the area measuring roughly 100 feet<br />
in diameter (fire pits, Figure 4-2).<br />
Figure 4-1<br />
The remainder of the site was expected to be<br />
contaminant-free; however, an area of<br />
1,1,1-trichloroethane (TCA) was detected northwest<br />
of the factory (Figure 4-3).<br />
Property Borders: No VOCs were detected in the<br />
samples collected along the property borders,<br />
indicating that the VOC contamination is primarily<br />
limited to the interior of the site.<br />
Figure 4-2<br />
Active <strong>Soil</strong> <strong>Gas</strong> Program: <strong>Based</strong> on the passive soil<br />
gas data, 35 initial soil gas sample locations were<br />
selected as follows (Figure 4-4):<br />
• Five vertical profiles (3-, 5- and 10-foot sample<br />
depths) were taken in the fire pit training area, one<br />
from the 1,1,1-TCA hot spot, and another near the<br />
former degreaser.<br />
• <strong>Soil</strong> gas samples at a 5-foot sample depth were<br />
located around the factory and along and across<br />
Figure 4-3<br />
the axes of the naphthalene and 1,1,1-TCA soil<br />
gas plumes.<br />
• Five subslab soil gas samples were collected from underneath the factory slab.<br />
• Samples were collected across the remainder of the site at 5-foot sample depths to test for<br />
background concentrations of VOCs and for the possible presence of methane gas that could<br />
not be detected by the passive survey).<br />
<strong>Soil</strong> gas samples were analyzed for VOCs including naphthalene, hydrocarbons ranging from<br />
C10 to C20, methane, and fixed gases (oxygen and carbon dioxide).<br />
28
ITRC – Vapor Intrusion Pathway: Investigative Approaches for Typical Scenarios January 2007<br />
Having the ability to add sampling locations both spatially and vertically in real time was<br />
considered useful to optimize the field effort, so on-site analysis was planned.<br />
Continuous soil cores were collected from 10 locations across the site to get soil physical<br />
properties for later use in vapor intrusion modeling.<br />
Step 11. Evaluate Data<br />
Fire Training Area:<br />
Figure 4-4. Initial soil gas sample locations.<br />
• The vertical profiles showed a consistent trend in all three locations. Total hydrocarbons<br />
were high at the deepest depth (>500 μg/L), decreasing to below detection at the 3 feet.<br />
Oxygen was near atmospheric levels to 3-foot depths and then decreased rapidly to only a<br />
few percent at depth. Carbon dioxide also increased with depth to percent levels.<br />
• Methane values exceeded 10% in all locations at 5- to 10-foot sampling depths but decreased<br />
to 500–1000 parts per million by volume (ppmv) at the 3-foot depths.<br />
Area Around and Underneath Factory: TCE values at the 5-foot collection depth ranged from<br />
nondetect to 10,000 μg/m 3 , which exceeded screening levels by 20 times. Subslab samples had<br />
TCE at concentrations ranging 50,000–100,000 μg/m 3 , exceeding screening levels by many<br />
29
ITRC – Vapor Intrusion Pathway: Investigative Approaches for Typical Scenarios January 2007<br />
orders of magnitude. The highest values were in the northwest portion of the factory building<br />
coincident with the location of the former degreasers.<br />
Background Areas<br />
• 1,1,1-TCA values were determined to be below the regulatory action level for residential<br />
scenarios.<br />
• No VOCs were detected, and only modest quantities of methane (
ITRC – Vapor Intrusion Pathway: Investigative Approaches for Typical Scenarios January 2007<br />
• Use of vertical profiles to document bioattenuation<br />
• Unexpected presence of methane gas and an approach to see if it represents a risk<br />
• Finding unexpected source areas<br />
• Institutional controls and the problems with implementing them long term<br />
4.D LESSONS LEARNED<br />
• Passive soil gas is an effective screening tool (located additional unknown source area). It<br />
reduced overall investigation costs substantially (fewer active soil gas samples taken).<br />
• Bioattenuation of hydrocarbons is likely when oxygen is present.<br />
• Vapor phase contamination (vapor clouds) can exist with no associated soil phase or<br />
groundwater contamination.<br />
4.E NEXT STEPS<br />
• Validation tests (flux chambers) can ensure shallow methane is not a problem.<br />
• <strong>Soil</strong> removal in the fire training area should be completed to remove contamination, and any<br />
buildings erected in this area should be have integral mitigation systems built in.<br />
• Mitigation of the TCE plume under the factory should be done prior to any redevelopment<br />
and subsequent sampling performed to ensure that vapor intrusion is not occurring after<br />
redevelopment.<br />
• Groundwater monitoring of the plume should continue to document contaminate migration<br />
and/or plume stability.<br />
• Refer to the oversight agency regarding other remediation that may be necessary at the site<br />
(e.g., soil removal, groundwater remedy, etc.).<br />
31
ITRC – Vapor Intrusion Pathway: Investigative Approaches for Typical Scenarios January 2007<br />
Scenario 5<br />
Large Industrial Building<br />
Undergoing Redevelopment<br />
This scenario illustrates a typical vapor intrusion investigation of an existing structure located at<br />
a former industrial site.<br />
5.A DESCRIPTION<br />
The Situation<br />
A large industrial facility with warehouse and offices under one roof is being sold. An<br />
environmental assessment is conducted at the site and contamination is found. Previous shallow<br />
soil data from hand borings indicated a suite of CVOCs directly below a portion of the building.<br />
Building construction is slab on grade and divided into three distinct ventilation areas—open<br />
warehouse, warehouse rooms, and attached offices. Low-level contamination is found outside the<br />
building footprint in one area, but it is suspected that higher concentrations still exist directly<br />
under the building. <strong>Soil</strong> type in the area is likely to be a tight clay soil matrix, and it is assumed<br />
there is a coarse-grain material directly beneath the slab. The seller (Principal Responsible Party)<br />
applies to state voluntary cleanup program for assistance and is trying to lease building in the<br />
interim. The regulatory agency determines that VI needs to be investigated.<br />
Conceptual Site Model<br />
The building plans, historical uses of the facility, and the environmental assessment of this site<br />
were reviewed. Nothing in the review indicated conditions<br />
likely to result in vapor impacts to the surrounding<br />
community. Minimal contamination was detected outside the<br />
building footprint. Therefore, the only potential vapor<br />
impacts would be the existing building above the<br />
contamination. Groundwater at the site varies 15–30 feet bgs<br />
and is not impacted.<br />
After the review, several areas of additional investigation are<br />
identified, including an old degreaser, former drum storage<br />
area, and several floor drains and sump pits. All of these are<br />
identified as potential pathways of contaminants to the<br />
subsurface.<br />
Site Summary<br />
• Former industrial facility<br />
• CVOCs found directly below<br />
building<br />
• Contamination contained in<br />
building footprint<br />
• Several areas of concern<br />
identified<br />
• Site owner applies to state<br />
Voluntary <strong>Cleanup</strong> Program<br />
• Regulatory agency requests<br />
VI assessment<br />
33
ITRC – Vapor Intrusion Pathway: Investigative Approaches for Typical Scenarios January 2007<br />
5.B VI INVESTIGATIVE PROCESS<br />
Step 8. Choose Investigatory Strategy<br />
See Table 5-1.<br />
Table 5-1. Pros and cons of investigative methods for Scenario 5<br />
Alternatives Pros Cons<br />
Collect indoor air samples Direct measure of<br />
VI<br />
High chances of background sources<br />
from materials in warehouse<br />
Collect soil samples around<br />
or under building<br />
Familiar method <strong>Soil</strong> data generally considered not<br />
representative of vapor concentrations<br />
External soil gas<br />
investigation around the<br />
perimeter of the building<br />
Do not have to drill<br />
through the slab<br />
inside building<br />
External soil gas results may not be<br />
representative of subslab data<br />
Perform an investigation<br />
under the building (subslab<br />
and vertical soil gas samples)<br />
Closest point to<br />
receptor<br />
Decision: Collect internal soil gas and subslab gas samples.<br />
More intrusive<br />
Conservative screening levels<br />
Rationale: Access is not a problem, and contaminant source zone lies directly underneath<br />
structure.<br />
Step 9. Design VI Investigative Work Plan<br />
Subslab soil gas samples are to be collected at the following locations (Figure 5-1):<br />
• Near the location of the former degreaser<br />
• Near the floor drains and sumps<br />
• Near the former drum storage area<br />
• Along the edges of the building slab<br />
Vertical profiles of the soil gas are proposed in the hottest locations to ensure no threat to<br />
groundwater.<br />
A second subslab sample will be collected from several points for radon analysis to determine an<br />
average building-specific attenuation factor.<br />
Determine Screening <strong>Levels</strong> and Test Method: The state oversight agency has developed its<br />
own screening levels for vapor intrusion investigations. The state agency has developed riskbased<br />
screening levels and applies conservative attenuation factors for subslab, soil gas, and<br />
groundwater of 0.1, 0.01, 0.001, respectively. Commercial (non–Occupational Safety and Health<br />
Administration) screening levels apply. <strong>Risk</strong>-based screening levels for PCE, TCE, and<br />
1,1,1-TCA in subslab soil gas at a 1-in-100,000 risk level are 700, 225, and 14,500 μg/m 3 ,<br />
respectively.<br />
34
ITRC – Vapor Intrusion Pathway: Investigative Approaches for Typical Scenarios January 2007<br />
EPA test methods 8021, 8260, and TO-15 can be used for soil gas samples and reach detection<br />
levels suitable for these screening levels. On-site analysis is not available, high concentrations<br />
are anticipated, and a mixture of compounds are present, so method 8260 is chosen, with<br />
approximately 10 of the samples to be confirmed by TO-15.<br />
Step 10. Implement Work Plan<br />
The results of the investigation show various levels of soil gas contamination under the structure<br />
footprint. One hot spot near the former degreaser and the offices was identified with subslab<br />
concentrations (for PCE and TCE) approximately 100 times higher than the screening levels. The<br />
hot spot was contained to a very small area; soil gas concentrations decrease laterally away from<br />
the hot spot. A vertical profile at the highest subslab location indicates the contamination<br />
decreases with depth and is below detection at 10 feet bgs.<br />
Step 11. Evaluate Data<br />
Figure 5-1. Subsurface soil gas sampling sites.<br />
Warehouse Area: The radon data show a slab-specific attenuation of 0.005, which is 20 times<br />
lower than default values used to determine screening levels. Using this attenuation factor,<br />
detected subslab values are now slightly above screening levels. Since large warehouse areas will<br />
generally have large doors and usually have more air exchanges per hour, it is concluded that<br />
there is little risk to the warehouse workers. No more data required.<br />
35
ITRC – Vapor Intrusion Pathway: Investigative Approaches for Typical Scenarios January 2007<br />
Office Area: Since ventilation rates are lower in the offices, it is possible that the subslab values<br />
might represent a risk to the office workers. Additional data are needed.<br />
Step 12. Additional Investigation Warranted<br />
See Table 5-2.<br />
Table 5-2. Pros and cons of investigative methods for Scenario 5<br />
Alternatives Pros Cons<br />
Collect indoor air Direct measure in room Background sources can<br />
complicate interpretation<br />
Model indoor air<br />
concentrations based on soil<br />
gas and subslab concentrations<br />
Pressure measurements<br />
Continuous monitoring<br />
Can be inexpensive<br />
Eliminates any background<br />
interferences<br />
Provide evidence if subslab<br />
contaminants entering building<br />
Decision: Collect indoor air samples in offices and warehouse.<br />
Regulatory agency may<br />
not allow just modeling<br />
the data<br />
Data may be variable<br />
Data may be variable<br />
Rationale: Sampling indoors was chosen for a couple of reasons. First, it is believed that<br />
background interferences will be negligent. Second, we want to see actual indoor air<br />
concentrations. Main focus is the offices; however, indoor air sampling in the warehouse<br />
space is conducted at the request of the oversight agency to ensure site specific attenuation<br />
factors are applicable.<br />
Take representative samples from various area of the building, including 8-hour summa cans<br />
collected during normal business hours.<br />
Office results: Office #1, nearest the hot spot, is below commercial risk levels; however, Offices<br />
#2 and #3, away from the hot spot, show elevated levels (Table 5-3). Office #3 is above<br />
commercial standards. Office #2 is below the commercial risk level but above residential<br />
standards. It is determined from a former employee that Office #2 was a printing supply<br />
room, so background contamination may be responsible for elevated levels. Remove<br />
background contamination and resample. Blueprints were used to identify a sewer line<br />
under the offices, and additional investigation confirms leaking sewer line below the Office<br />
#3 accounting for the indoor air impacts. [Matching current data with historic blueprints<br />
and past uses enabled identifying background contributions and additional source(s)<br />
missed during original investigation.]<br />
Warehouse results: Main open spaces<br />
were below commercial risk levels;<br />
several smaller warehouse rooms were<br />
moderately above commercial risk level.<br />
Table 5-3. Office sampling results, μg/m 3<br />
Chemical Office #1 Office #2 Office #3<br />
PCE ND (10) ND (50) 75.0<br />
TCE ND (2.5) 17.0 30.0<br />
1,1,1-TCA ND (10) 500 850<br />
36
ITRC – Vapor Intrusion Pathway: Investigative Approaches for Typical Scenarios January 2007<br />
Decision: Retest after the source remedy.<br />
Rationale: Since a remedy is going to be installed to remediate soils under the building, waiting<br />
until after the remedy seemed to be appropriate.<br />
Table 5-4. Pros and cons of investigative methods the Scenario 5 warehouse<br />
Alternatives Pros Cons<br />
Perform mitigation steps to<br />
eliminate risks to smaller<br />
warehouse rooms, then<br />
resample<br />
If source remedy not a<br />
priority, then this would<br />
be the only route to take<br />
May not be needed if source<br />
control measures are adequate to<br />
reduce subsurface concentrations<br />
Step 13. Is Mitigation Warranted<br />
Remedy #1: Use soil vapor extraction (SVE) in the source area to meet soil cleanup goals,<br />
with an additional SVE leg to the subslab of Office #3 above the leaky sewer pipe. It is<br />
hoped that levels in warehouse spaces will be reduced with the installation of the SVE<br />
system. Once installation of remedial system is completed, resampling should occur in the<br />
smaller warehouse rooms and offices.<br />
Results from the samples show the two warehouse rooms are still slightly above commercial risk<br />
levels. All other samples are nondetect for the COCs. It is determined that a second remedy is<br />
warranted.<br />
Remedy #2: Adjust that HVAC system for the smaller warehouse rooms until source<br />
remedies are more effective. An operation, maintenance, and monitoring plan for the SVE<br />
system and HVAC system adjustments is put into place. Confirmation sampling at a later<br />
date is requested by regulatory agency to obtain clean closure.<br />
5.C WHAT WAS UNIQUE AB<strong>OU</strong>T THIS SCENARIO<br />
This scenario is different from the others because the potential source of vapor intrusion impacts<br />
is in the vadose zone soil directly beneath the building. Therefore, investigations had to focus on<br />
the vadose zone rather than groundwater. In addition, investigations had to be conducted inside<br />
the building and had to consider how foundation infrastructure might impact both source and<br />
vapor distributions. This scenario also demonstrates how multiple sources of vapor intrusion<br />
impacts may be located under the same building.<br />
Another issue associated with this scenario was the need for a rapid solution so that the building<br />
could be put back into productive use and generate revenue, even while remediation was under<br />
way.<br />
Although this scenario has only one building, variations in room size, ventilation rates, and<br />
location with respect to the source zone resulted in varying potentials for vapor intrusion impacts<br />
across the building. Therefore, testing strategies had to account for each of the subregions within<br />
the building. For example, areas closer to the source area may have been subject to higher<br />
37
ITRC – Vapor Intrusion Pathway: Investigative Approaches for Typical Scenarios January 2007<br />
subslab vapor concentrations. On the other hand, the floor slabs were likely thicker and more<br />
robust in former manufacturing and warehouse areas, compared to the office space. In addition,<br />
the large warehouse rooms had larger volumes for mixing of vapors and may have had higher air<br />
exchange rates than the office space. Ventilation systems may also have distributed air from<br />
impacted areas to otherwise unimpacted areas of the building.<br />
Another issue was operation of the HVAC system during indoor air testing. Because HVAC<br />
operations can control vapor intrusion impacts in large buildings, the decision was made to test<br />
with the HVAC system operating normally. In other situations—for example, where future<br />
operation of the HVAC system cannot be relied on—it may be better to turn off the HVAC<br />
system before conducting indoor air tests.<br />
Finally, this scenario presented the need and opportunity for flexible approaches to mitigation.<br />
The nature of the impacted space, the proximity to the source zone, and the opportunity to use<br />
existing remediation and HVAC equipment varied in different portions of the building. No single<br />
approach was best for the entire building, and the vapor intrusion mitigation strategy also varied<br />
over time as the source zone soils were remediated.<br />
5.D LESSONS LEARNED<br />
• In a step-wise, structured assessment protocol, the extent and concentration of the<br />
contaminant(s) under the building would normally be delineated before collecting soil vapor<br />
samples, which would then focus primarily on the hot spots. However, in this instance it was<br />
relatively easy and more economical to collect the subslab vapor samples while the directpush<br />
sampling equipment was at the site and holes were cored through the slab. The extra<br />
expense of analyzing the extra soil vapor samples (from areas away from the hot spots) is<br />
easily justified in light of the cost of remobilizing the equipment to the site and personnel<br />
labor rates.<br />
• There may be considerable spatial distribution and variation in the contaminant<br />
concentrations under large buildings. While some of the individual concentrations may<br />
exceed threshold action levels, the overall average concentration under the building is a more<br />
reliable indicator of whether remedial action may be required. (Note: Unless the sampling<br />
has been conducted on a statistical grid, it may be more prudent to use the third quartile as<br />
the concentration on which to base decisions, thus biasing the data “high” without being as<br />
overly conservative as using strictly the highest concentration.)<br />
• Indoor air sampling in the two offices near the subslab hot spot (degreasing area) did not<br />
detect significant levels. This finding illustrates that vapor migration into interior spaces is<br />
not an absolute “given” because of the tremendous variations that can occur in building<br />
characteristics and interior ventilation patterns. Vapor migration tends to follow preferential<br />
cracks through the foundation slabs and only poorly penetrates through intact concrete. If the<br />
carpeting in these offices were removed, further investigation would probably show that the<br />
underlying concrete slab had no cracks or voids that facilitate vapor migration. Alternatively,<br />
the air exchange rate in the offices may be high enough to dilute out any vapor that does<br />
intrude through the floor.<br />
38
ITRC – Vapor Intrusion Pathway: Investigative Approaches for Typical Scenarios January 2007<br />
• Significant levels were found in two other offices farther away from the hot spot, which were<br />
sampled more as “control samples” (instead of collecting ambient outdoor air). At first<br />
glance, it would seem that these results suggest that vapor intrusion is not predictably<br />
connected to “hot spots”; however, this is not the case. In each instance, there is a logical,<br />
adequate explanation why something was detected where nothing was expected. In one of the<br />
offices, the concentrations were detected because of residual consumer products desorbing<br />
from the building materials. In the second office, the contamination was due to vapor<br />
intrusion from a previously unrecognized subslab source (the leaking sewer line).<br />
• Finding significant levels in the office that was formerly used for the printing supply office<br />
illustrates the problem one encounters because of volatiles sorbing and desorbing off of<br />
building materials, carpet, furniture surfaces, etc. Even though no consumer products were<br />
present during the time of sampling, their residues can continue to desorb from surfaces long<br />
after the cans and bottles containing the consumer products have been removed from the<br />
premises. Obtaining a thorough history of the use of an area can reduce additional,<br />
unnecessary assessment work.<br />
• Finding the significant levels in the second office illustrates what may occur if all subslab<br />
source areas are not adequately determined. If further work had not found the broken sewer<br />
pipe underlying this area of the building, the results would have suggested that significant<br />
vapor intrusion was occurring from the hot spot under the building and that somehow these<br />
vapors were concentrating in this office area. This erroneous conclusion would undoubtedly<br />
lead to additional investigation of the HVAC system, more subslab sampling, modeling,<br />
scrutiny of the attenuation factors, etc.<br />
• The SVE system can be modified to address the sewer line break by running a vacuum line<br />
over the roof of the building from the hot spot area. This is an easy way to remediate the<br />
subslab concentration at that spot if the distance between the locations and the aesthetics of<br />
running a branch line across the roof are not major factors in the design. If a branch line from<br />
the main SVE system cannot address the sewer line break, a small dedicated SVE system can<br />
be installed directly over that area; however, the cost may be significantly higher because of<br />
the need for two SVE pumps, filter collection systems, etc.<br />
• Modification of the HVAC system is a practical and economical means to reduce the<br />
exposure dose for small areas that near borderline indoor concentrations.<br />
5.E NEXT STEPS<br />
• Monitor the SVE system; sample to ensure that the system is working sufficiently.<br />
• Resample the warehouse rooms; determine whether risks are below commercial levels now<br />
that HVAC and SVE systems are operational. If so, it may not be necessary to resample as<br />
long as SVE and HVAC systems are monitored.<br />
• Refer to the oversight agency regarding other remediation that may be necessary at the site<br />
(e.g., soil removal, groundwater remedy, etc.).<br />
39
ITRC – Vapor Intrusion Pathway: Investigative Approaches for Typical Scenarios January 2007<br />
Scenario 6<br />
Multifamily Dwelling<br />
Located Over a Former <strong>Gas</strong> Station<br />
This scenario illustrates special issues in determining the significance of background<br />
concentrations of COCs and assessment for petroleum hydrocarbon vapors.<br />
6.A DESCRIPTION<br />
The Situation<br />
As part of an urban land revitalization project, a former service station site and an adjacent<br />
vacant parcel were redeveloped into a high-end condominium complex. Five years after the<br />
complex was completed, a resident notified the complex’s management company of<br />
petroleumlike fumes in his unit. After an inadequate response by the management company, the<br />
resident notified the public health department. A single air sample collected by the health<br />
department detected benzene at 4 µg/m 3 . Because the site was previously occupied by a service<br />
station that had experienced a UST release, the state UST regulatory agency was brought in to<br />
conduct an investigation to determine the source of the vapors.<br />
Conceptual Site Model<br />
A site visit and review of the state UST regulatory agency files allowed investigators to develop<br />
an initial CSM. The condo complex consists of two four-story buildings separated by a<br />
courtyard. The entire complex overlies a two-level parking garage with elevators to higher<br />
levels. Maps submitted to the agency by the former property owner indicate that the previously<br />
delineated and remediated LNAPL footprint lies beneath the building containing the unit of the<br />
resident who had complained about petroleum odors. During the site visit, investigators noticed<br />
that the sewer line to the building intersected the zone of contamination.<br />
Previous remedial site investigations found the top of groundwater at 20 feet BGS. <strong>Soil</strong> borings<br />
consistently indicated the sandy soil from ground<br />
surface to 40 feet bgs. A previous consultant’s<br />
report had delineated a petroleum hydrocarbon<br />
plume extending beneath the former UST pit to<br />
groundwater and spreading radially and slightly<br />
downgradient, creating a contaminated zone at the<br />
water table approximately 50 feet in diameter. A<br />
dissolved plume extended an additional 100 feet<br />
downgradient of the LNAPL plume.<br />
Agency records of the remedial action showed that<br />
the gasoline-contaminated zone was remediated by<br />
soil vapor extraction. Concentration-based<br />
Site Summary<br />
• Former service station site<br />
• Currently two condominium complexes<br />
separated by a courtyard<br />
• Parking garage below condominiums<br />
• Groundwater at 20 feet bgs<br />
• Previous soil removal and closure by<br />
regulatory agency<br />
• Sandy soils<br />
• Sewer line intersects site<br />
• Single odor complaint led to air sample<br />
by health department that revealed<br />
slightly elevated benzene levels<br />
41
ITRC – Vapor Intrusion Pathway: Investigative Approaches for Typical Scenarios January 2007<br />
remediation goals for soil were met in the area of known contamination and a “No Further<br />
Action” letter was issued by the agency five years prior to construction of the condos.<br />
Vapors emanating from the vehicles in the parking structure were thought to be a likely source of<br />
vapors. However, ongoing drought conditions and dewatering operations at a nearby<br />
construction site led investigators to consider the possibility that a previously unidentified and<br />
recently exposed LNAPL zone from the former service station was the possible vapor source.<br />
6.B VI INVESTIGATION PROCESS<br />
Use any existing data to assess whether the pathway is potentially complete. In this case, the only<br />
recent data that exists is one indoor air measurement. No subsurface recent data exist to allow<br />
this determination, so additional data must be collected.<br />
Step 8. Choose Investigative Strategy<br />
<strong>Based</strong> on the initial site CSM, five potential sources exist for the detected benzene:<br />
• Upward migration of vapors from petroleum-contaminated soil and groundwater remaining<br />
from the former gas station<br />
• Vapors transmitted along the utility corridor created by the sewer line that transects the<br />
former zone of petroleum contamination<br />
• <strong>Gas</strong>oline vapors from the parking structure<br />
• Ambient air<br />
• Background sources<br />
Table 6-1 summarizes the pros and cons of the various investigatory methods.<br />
Table 6-1. Pros and cons of investigative methods for Scenario 6<br />
Alternative Pros Cons<br />
Indoor air<br />
sampling<br />
Direct confirmation of<br />
previous measured result<br />
Likely to have contributions from<br />
numerous sources<br />
Cannot differentiate source<br />
Groundwater<br />
or soil phase<br />
data<br />
Perform soil<br />
gas<br />
investigation<br />
Can search for and delineate<br />
extent of contamination<br />
source<br />
Can be used to locate source<br />
spatially and vertically<br />
Less invasive, easily installed,<br />
greater number of sampling<br />
locations for lower cost<br />
Legal complications<br />
Logistically difficult at this site due to<br />
parking garage<br />
No history of these matrices as likely<br />
sources<br />
Vapor intrusion risk often overestimated<br />
from these matrices<br />
Attenuation factor unknown<br />
Conservative screening levels<br />
42
ITRC – Vapor Intrusion Pathway: Investigative Approaches for Typical Scenarios January 2007<br />
Decision: The condominium management company, its environmental consultant, and agency<br />
investigators agreed that a soil gas investigation was the best initial approach to determine<br />
whether previous contamination was a vapor source. The management company’s newly hired<br />
consultant began preparation of a work plan, which included soil gas sampling and an<br />
investigation of the garage ventilation system.<br />
Step 9. Design VI Investigative Work Plan<br />
Since the location of the source is unknown, the first goal is to determine and delineate the<br />
source spatially by collecting soil gas at 5 feet below the parking garage on an even (50-foot<br />
center) spacing in all directions, starting below the location of the unit with the indoor air<br />
detection. If contamination is found, a depth profile of the soil gas in the location(s) of the<br />
highest concentration will be performed to assess whether the source is from the vadose zone or<br />
from the groundwater. In addition, at locations where contamination exceeding the risk-based<br />
screening levels is found at 5 feet bgs, soil gas samples will be collected immediately under the<br />
parking garage slab to see whether the contamination exists under the garage floor.<br />
Since the source is unknown, having the ability to add sampling locations both spatially and<br />
vertically in real time will optimize the field effort, so on-site analysis is planned.<br />
Determine Target/Screening <strong>Levels</strong>: The state oversight agency follows the EPA OSWER<br />
guidance. For benzene in soil gas at a 1-in-1-million risk level, the risk-based screening levels<br />
are 150 μg/m 3 for soil gas samples collected 5 feet below a receptor and 3 μg/m 3 for soil gas<br />
samples collected immediately below the slab.<br />
Both EPA test methods 8021 and 8260 can be used for soil gas samples conducted on site and<br />
reach detection levels of 10–100 μg/m 3 . For the subslab samples, if the on-site analysis gives<br />
nondetect values, then samples will need to be collected for off-site analysis with a method (such<br />
as TO-15) offering a lower detection level.<br />
Since the COC is a hydrocarbon, oxygen and carbon dioxide data will be useful to show<br />
bioattenuation and document the presence of highly aerobic soils. These data can be collected<br />
using GC or with a portable field meter such as a Landtec GEM-2000.<br />
Steps 10 and 11. Collect and Interpret Data<br />
The 5-foot soil gas data showed only one contamination zone located near the sewer line but not<br />
immediately beneath the condo unit. Maximum values were approximately 1500 μg/m 3 , which<br />
exceed screening levels by more than 10 times.<br />
What is the source Conduct vertical sampling for concentration profile. A vertical profile<br />
of the soil gas at the same location showed that concentrations did not increase with depth, so<br />
groundwater is not the source.<br />
43
ITRC – Vapor Intrusion Pathway: Investigative Approaches for Typical Scenarios January 2007<br />
Is the sewer line the source Collect additional 5-foot soil gas along sewer line. Additional<br />
soil gas data showed no correlation with sewer line. Only one localized subsurface contamination<br />
source of moderate strength appears to exist on the site at depths of 5 or more feet.<br />
Is there a shallower source Are high values underneath the parking garage slab Collect<br />
subslab soil gas below garage at contamination zone. The maximum subslab value is about 50<br />
μg/m 3 , which exceeds the EPA OSWER acceptable level of 3 μg/m 3 for a slab-on-grade<br />
structure. However, this complex has a parking garage between the 50 μg/m 3 value and the<br />
residences, so it is not likely that the benzene source is from the subsurface.<br />
Could the garage be the source Inspection of the ventilation system in the garage shows that<br />
the ventilation system is the type that operates intermittently when carbon monoxide levels build<br />
up to a value that turns the system on. Is the system operating enough to ventilate the garage<br />
effectively And is there communication between the parking garage and the overlying condos<br />
What other tools or data can we collect to test this possibility A tracer can be used to<br />
determine whether there is communication between the garage and condo. SF6 was injected into<br />
the garage, and air samples were collected from the condo. The ratio of SF6 in the condo to the<br />
garage showed about 5% leakage into the condo. Benzene measurements were taken again in the<br />
garage and condo unit to see how they compare. Benzene was 40 μg/m 3 in the garage and<br />
4 μg/m 3 in the condo unit. The tracer study showing a 5% leakage rate into the condo unit<br />
implies a ~2 μg/m 3 benzene contribution to the condo from garage.<br />
Step 12. Is Additional Investigation Warranted<br />
• The primary sources of benzene in the condo are from background sources and the garage.<br />
• The source of benzene in the garage is likely from cars since subsurface soil gas values<br />
would be expected to be at least 10 to 100 times higher than the garage, but they are nearly<br />
equivalent.<br />
6.C WHAT WAS UNIQUE AB<strong>OU</strong>T THIS SCENARIO<br />
• Detected indoor benzene was not from a subsurface source. This scenario gives a sequence of<br />
steps and questions that were taken to reach that conclusion.<br />
• The expected contributions from background and ambient sources precluded simple indoor<br />
air sampling and necessitated the sequence of steps.<br />
6.D LESSONS LEARNED<br />
• Vertical profiles of soil gas are helpful to determine subsurface sources.<br />
• Supplemental tools—in this case, tracers—can be useful in atypical situations.<br />
44
ITRC – Vapor Intrusion Pathway: Investigative Approaches for Typical Scenarios January 2007<br />
6.E NEXT STEPS<br />
• The contribution from the garage to the overlying residences can be reduced if the garage<br />
benzene value is reduced. This effect can readily be accomplished by changing the<br />
ventilation system in the garage to operate continuously.<br />
• After the ventilation system is changed, it might be appropriate to remeasure garage and<br />
condo concentrations to see whether they decrease.<br />
• Refer to oversight agency regarding other remediation that may be necessary at the site (e.g.,<br />
soil removal, groundwater remedy, etc.).<br />
45
ITRC – Vapor Intrusion Pathway: Investigative Approaches for Typical Scenarios January 2007<br />
APPENDIX A<br />
Site Investigation Flowchart<br />
From Chapter 3, Vapor Intrusion Pathway: A Practical Guideline<br />
(ITRC 2007)<br />
47
ITRC – Vapor Intrusion Pathway: Investigative Approaches for Typical Scenarios January 2007<br />
49