Delination of response Functions - Plurel
Delination of response Functions - Plurel
Delination of response Functions - Plurel
- No tags were found...

You also want an ePaper? Increase the reach of your titles
YUMPU automatically turns print PDFs into web optimized ePapers that Google loves.
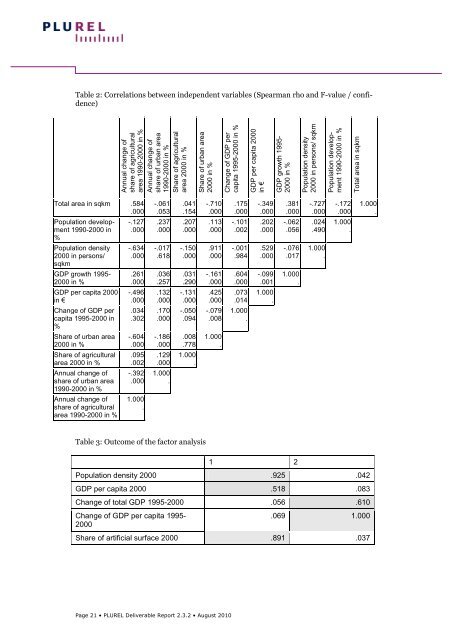
Table 2: Correlations between independent variables (Spearman rho and F-value / confidence)<br />
Annual change <strong>of</strong><br />
share <strong>of</strong> agricultural<br />
area 1990-2000 in %<br />
Annual change <strong>of</strong><br />
share <strong>of</strong> urban area<br />
1990-2000 in %<br />
Share <strong>of</strong> agricultural<br />
area 2000 in %<br />
Share <strong>of</strong> urban area<br />
2000 in %<br />
Change <strong>of</strong> GDP per<br />
capita 1995-2000 in %<br />
GDP per capita 2000<br />
in €<br />
GDP growth 1995-<br />
2000 in %<br />
Population density<br />
2000 in persons/ sqkm<br />
Population development<br />
1990-2000 in %<br />
Total area in sqkm<br />
Total area in sqkm .584<br />
.000<br />
-.061<br />
.053<br />
.041<br />
.154<br />
-.710<br />
.000<br />
.175<br />
.000<br />
-.349<br />
.000<br />
.381<br />
.000<br />
-.727<br />
.000<br />
-.172<br />
.000<br />
1.000<br />
.<br />
Population development<br />
1990-2000 in<br />
%<br />
-.127<br />
.000<br />
.237<br />
.000<br />
.207<br />
.000<br />
.113<br />
.000<br />
-.101<br />
.002<br />
.202<br />
.000<br />
-.062<br />
.056<br />
.024<br />
.490<br />
1.000<br />
.<br />
Population density<br />
2000 in persons/<br />
sqkm<br />
-.634<br />
.000<br />
-.017<br />
.618<br />
-.150<br />
.000<br />
.911<br />
.000<br />
-.001<br />
.984<br />
.529<br />
.000<br />
-.076<br />
.017<br />
1.000<br />
.<br />
GDP growth 1995-<br />
2000 in %<br />
.261<br />
.000<br />
.036<br />
.257<br />
.031<br />
.290<br />
-.161<br />
.000<br />
.604<br />
.000<br />
-.099<br />
.001<br />
1.000<br />
.<br />
GDP per capita 2000<br />
in €<br />
-.496<br />
.000<br />
.132<br />
.000<br />
-.131<br />
.000<br />
.425<br />
.000<br />
.073<br />
.014<br />
1.000<br />
.<br />
Change <strong>of</strong> GDP per<br />
capita 1995-2000 in<br />
%<br />
.034<br />
.302<br />
.170<br />
.000<br />
-.050<br />
.094<br />
-.079<br />
.008<br />
1.000<br />
.<br />
Share <strong>of</strong> urban area<br />
2000 in %<br />
-.604<br />
.000<br />
-.186<br />
.000<br />
.008<br />
.778<br />
1.000<br />
.<br />
Share <strong>of</strong> agricultural<br />
area 2000 in %<br />
.095<br />
.002<br />
.129<br />
.000<br />
1.000<br />
.<br />
Annual change <strong>of</strong><br />
share <strong>of</strong> urban area<br />
1990-2000 in %<br />
-.392<br />
.000<br />
1.000<br />
.<br />
Annual change <strong>of</strong><br />
share <strong>of</strong> agricultural<br />
area 1990-2000 in %<br />
1.000<br />
.<br />
Table 3: Outcome <strong>of</strong> the factor analysis<br />
1 2<br />
Population density 2000 .925 .042<br />
GDP per capita 2000 .518 .083<br />
Change <strong>of</strong> total GDP 1995-2000 .056 .610<br />
Change <strong>of</strong> GDP per capita 1995-<br />
2000<br />
.069 1.000<br />
Share <strong>of</strong> artificial surface 2000 .891 .037<br />
Page 21 • PLUREL Deliverable Report 2.3.2 • August 2010