Tanzania_country_pro.. - GRID Africa GeoPortal - UNEP
Tanzania_country_pro.. - GRID Africa GeoPortal - UNEP
Tanzania_country_pro.. - GRID Africa GeoPortal - UNEP

You also want an ePaper? Increase the reach of your titles
YUMPU automatically turns print PDFs into web optimized ePapers that Google loves.
Climate and Atmosphere-- <strong>Tanzania</strong><br />
EarthTrends<br />
Country Profiles<br />
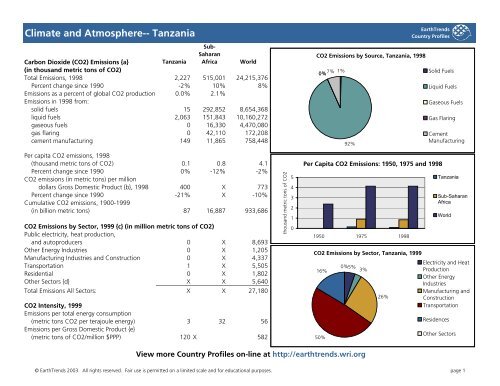
Carbon Dioxide (CO2) Emissions {a}<br />
<strong>Tanzania</strong><br />
Sub-<br />
Saharan<br />
<strong>Africa</strong> World<br />
(in thousand metric tons of CO2)<br />
Total Emissions, 1998 2,227 515,001 24,215,376<br />
Percent change since 1990 -2% 10% 8%<br />
Emissions as a percent of global CO2 <strong>pro</strong>duction 0.0% 2.1%<br />
Emissions in 1998 from:<br />
solid fuels 15 292,852 8,654,368<br />
liquid fuels 2,063 151,843 10,160,272<br />
gaseous fuels 0 16,330 4,470,080<br />
gas flaring 0 42,110 172,208<br />
cement manufacturing 149 11,865 758,448<br />
CO2 Emissions by Source, <strong>Tanzania</strong>, 1998<br />
1%<br />
0%<br />
7% Solid Fuels<br />
92%<br />
Liquid Fuels<br />
Gaseous Fuels<br />
Gas Flaring<br />
Cement<br />
Manufacturing<br />
Per capita CO2 emissions, 1998<br />
(thousand metric tons of CO2) 0.1 0.8 4.1<br />
Percent change since 1990 0% -12% -2%<br />
CO2 emissions (in metric tons) per million<br />
dollars Gross Domestic Product {b}, 1998 400 X 773<br />
Percent change since 1990 -21% X -10%<br />
Cumulative CO2 emissions, 1900-1999<br />
(in billion metric tons) 87 16,887 933,686<br />
CO2 Emissions by Sector, 1999 {c} (in million metric tons of CO2)<br />
Public electricity, heat <strong>pro</strong>duction,<br />
and auto<strong>pro</strong>ducers 0 X 8,693<br />
Other Energy Industries 0 X 1,205<br />
Manufacturing Industries and Construction 0 X 4,337<br />
Transportation 1 X 5,505<br />
Residential 0 X 1,802<br />
Other Sectors {d} X X 5,640<br />
Total Emissions All Sectors: X X 27,180<br />
CO2 Intensity, 1999<br />
Emissions per total energy consumption<br />
(metric tons CO2 per terajoule energy) 3 32 56<br />
Emissions per Gross Domestic Product {e}<br />
(metric tons of CO2/million $PPP) 120 X 582<br />
thousand metric tons of CO2<br />
5<br />
4<br />
3<br />
2<br />
1<br />
0<br />
Per Capita CO2 Emissions: 1950, 1975 and 1998<br />
1950 1975 1998<br />
CO2 Emissions by Sector, <strong>Tanzania</strong>, 1999<br />
16%<br />
50%<br />
0% 5% 3%<br />
26%<br />
<strong>Tanzania</strong><br />
Sub-Saharan<br />
<strong>Africa</strong><br />
World<br />
Electricity and Heat<br />
Production<br />
Other Energy<br />
Industries<br />
Manufacturing and<br />
Construction<br />
Transportation<br />
Residences<br />
Other Sectors<br />
View more Country Profiles on-line at http://earthtrends.wri.org<br />
© EarthTrends 2003. All rights reserved. Fair use is permitted on a limited scale and for educational purposes. page 1
Atmosphere and Climate-- <strong>Tanzania</strong><br />
<strong>Tanzania</strong><br />
Sub-<br />
Saharan<br />
<strong>Africa</strong> World<br />
Non-CO2 Air Pollution, thousand metric tons<br />
Sulfur dioxide emissions, 1995 105 5,345 141,875<br />
Nitrogen oxide emissions, 1995 604 9,309 99,271<br />
Carbon monoxide emissions, 1995 12,947 177,268 852,415<br />
Non-methane VOC emissions {f}, 1995 1,182 17,375 159,634<br />
CO2 emissions: Relative Trends, <strong>Tanzania</strong>, 1960-1998<br />
Multilateral Agreements Status as of September 2002<br />
Data show the year each <strong>country</strong> ratified the agreement, unless labeled as "signed only".<br />
Kyoto Protocol 2002<br />
United Nations Framework Convention<br />
on Climate Change (UNFCCC) 1996<br />
Vienna Convention 1993<br />
Other Resources:<br />
Sustainable Development Country Profile of the<br />
Food and Agriculture Organization of the United Nations:<br />
http://www.fao.org/<strong>country</strong><strong>pro</strong>files/index.aspsubj=2&iso3=<br />
Footnotes:<br />
Some footnotes are not incorporated here. Please refer to the Data Tables section of EarthTrends for a full listing.<br />
a. Source: Carbon Dioxide Information Analysis Center (CDIAC). b. Constant US dollars. c. Source: International Energy Agency (IEA).<br />
d. Includes the commercial sector, agriculture, the public service sector, and international bunkers<br />
e. GDP is in 1995 international dollars, adjusted for Purchasing Power Parity. f. VOC: Volatile Organic Compounds.<br />
View more Country Profiles on-line at http://earthtrends.wri.org<br />
© EarthTrends 2003. All rights reserved. Fair use is permitted on a limited scale and for educational purposes. page 2
Climate and Atmosphere—Sources and Definitions<br />
Carbon Dioxide (CO2) Emissions<br />
Total CO2 emissions represent the mass of CO2 <strong>pro</strong>duced during the combustion of solid, liquid, and gaseous fuels, from gas flaring and the manufacture<br />
of cement. These estimates do not include bunker fuels used in international transportation due to the difficulty of apportioning these fuels among the<br />
countries benefiting from that transport. Carbon dioxide emissions are often calculated and reported in terms of their content of elemental carbon. For<br />
these data, their values were converted to the actual mass of CO2 by multiplying the carbon mass by 3.664 (the ratio of the mass of CO2 to that of carbon).<br />
The primary difference between Carbon Dioxide Information Analysis Center (CDIAC, reported here) and International Energy Agency (IEA) CO2 emission<br />
estimates (also available from EarthTrends) is that the CDIAC data include emissions from sources other than fossil fuel combustion, primarily cement<br />
manufacture. Further differences in methodology are outlined on Web pages listed below..<br />
View full technical notes on-line at http://earthtrends.wri.org/searchable_db/variablenotes_static.cfmvarid=460&themeid=3<br />
CO2 emissions from solid fuels represent the mass of carbon dioxide emitted primarily, but not exclusively, from burning coal. View full technical notes<br />
on-line at http://earthtrends.wri.org/searchable_db/variablenotes_static.cfmvarid=461&themeid=3<br />
Carbon dioxide emissions from liquid fuels are primarily, but not exclusively, from burning of petroleum <strong>pro</strong>ducts. These estimates do not include<br />
bunker fuels used in international transportation due to the difficulty of apportioning these fuels among the countries benefiting from that transport.<br />
View full technical notes on-line at http://earthtrends.wri.org/searchable_db/variablenotes_static.cfmvarid=462&themeid=3<br />
Carbon dioxide emissions from gaseous fuels are primarily, but not exclusively, from burning of natural gas. View full technical notes on-line at<br />
http://earthtrends.wri.org/searchable_db/variablenotes_static.cfmvarid=463&themeid=3<br />
Carbon dioxide emissions from gas flaring result from the burning of gas released in the <strong>pro</strong>cess of petroleum extraction.<br />
View full technical notes on-line at http://earthtrends.wri.org/searchable_db/variablenotes_static.cfmvarid=464&themeid=3<br />
CO2 emissions from cement manufacturing are <strong>pro</strong>duced as cement is calcined to <strong>pro</strong>duce calcium oxide. Ap<strong>pro</strong>ximately 0.5 metric tons of carbon is<br />
released for each metric ton of cement <strong>pro</strong>duction.<br />
View full technical notes on-line at http://earthtrends.wri.org/searchable_db/variablenotes_static.cfmvarid=465&themeid=3<br />
Per capita CO2 emissions figures are obtained by dividing total emissions of carbon dioxide by the population for a particular <strong>country</strong> and year. Total CO2<br />
emissions represent the mass of CO2 <strong>pro</strong>duced during the combustion of solid, liquid, and gaseous fuels, from gas flaring and the manufacture of cement.<br />
These estimates do not include bunker fuels used in international transportation due to the difficulty of apportioning these fuels among the countries<br />
benefiting from that transport.<br />
View full technical notes on-line at http://earthtrends.wri.org/searchable_db/variablenotes_static.cfmvarid=466&themeid=3<br />
CO2 emissions per unit of GDP were calculated by WRI using CO2 emissions data compiled by CDIAC and GDP data <strong>pro</strong>vided by the World Bank. Total<br />
CO2 emissions represent the mass of CO2 <strong>pro</strong>duced during the combustion of solid, liquid, and gaseous fuels, from gas flaring and the manufacture of<br />
cement. These estimates do not include bunker fuels used in international transportation due to the difficulty of apportioning these fuels among the<br />
countries benefiting from that transport. Gross Domestic Product (GDP) measures the total output of goods and services for final use occurring within the<br />
domestic territory of a given <strong>country</strong>, regardless of the allocation to domestic and foreign claims. To obtain comparable series of constant price data, the<br />
World Bank rescales GDP and value added by industrial origin to a common reference year, currently 1995.<br />
View full technical notes on-line at http://earthtrends.wri.org/searchable_db/variablenotes_static.cfmvarid=468&themeid=3<br />
© EarthTrends 2003. All rights reserved. Fair use is permitted on a limited scale and for educational purposes. page 3
Cumulative CO2 emissions levels are calculated by WRI based on CDIAC’s CO2 emissions data through 1998, supplementing this data with the 1999<br />
estimates from the Energy Information Administration. Total CO2 emissions figures consist of the sum of CO2 <strong>pro</strong>duced during the consumption of solid,<br />
liquid, and gaseous fuels, and from gas flaring and the manufacture of cement. These estimates do not include bunker fuels used in international<br />
transportation due to the difficulty of apportioning these fuels among the countries benefiting from that transport.<br />
View full technical notes on-line at http://earthtrends.wri.org/searchable_db/variablenotes_static.cfmvarid=779&themeid=3<br />
Sources<br />
Carbon Dioxide Information Analysis Center (CDIAC), Environmental Sciences Division, Oak Ridge National Laboratory: 2001. Global, Regional, and National<br />
CO2 Emission Estimates from Fossil Fuel Burning, Cement Production, and Gas Flaring: 1751-1998, NDP-030 (Available online at<br />
http://cdiac.esd.ornl.gov/ftp/ndp030/). CDIAC, Oak Ridge, Tennessee.<br />
Energy Information Administration of the U.S. Department of Energy: 2001. Carbon Dioxide Emissions from Use of Fossil Fuels, International Energy Annual<br />
1999. (Available on-line at http://www.eia.doe.gov/iea/carbon.html) Washington, DC: EIA.<br />
CO2 Emissions by Sector<br />
Carbon dioxide emissions from public electricity, heat <strong>pro</strong>duction, and auto<strong>pro</strong>ducers include the sum of emissions from combustion of all fossil fuel<br />
types used for public electricity generation, public combined heat and power generation, and public heat plants. Public utilities are defined as those<br />
undertakings whose primary activity is to supply the public. Carbon dioxide emissions from unallocated auto<strong>pro</strong>ducers include the sum of emissions from<br />
combustion of all fossil fuel types used for generation of electricity and/or heat by auto<strong>pro</strong>ducers. Auto<strong>pro</strong>ducers generate electricity and/or heat wholly or<br />
partly for their own use to support their primary activity. Most of these emissions are attributed to the sector that the auto<strong>pro</strong>ducer falls within, but some<br />
autor<strong>pro</strong>duction cannot be attributed to the end user and is represented here.<br />
View full technical notes on-line at http://earthtrends.wri.org/searchable_db/variablenotes_static.cfmvarid=478&themeid=3<br />
Carbon dioxide emissions from other energy industries include the sum of emissions from combustion of all fossil fuel types used by energy industries.<br />
This includes fuel combusted in petroleum refineries, for the manufacture of solid fuels, coal mining, oil and gas exploration, and other energy-<strong>pro</strong>ducing<br />
industries.<br />
View full technical notes on-line at http://earthtrends.wri.org/searchable_db/variablenotes_static.cfmvarid=480&themeid=3<br />
Carbon dioxide emissions from manufacturing industries and construction include emissions from combustion of fossil fuels in all industries and<br />
construction.<br />
View full technical notes on-line at http://earthtrends.wri.org/searchable_db/variablenotes_static.cfmvarid=476&themeid=3<br />
Carbon Dioxide emissions from all transportation include emissions from combustion of fossil fuels for road, rail, air, and other forms of transportation,<br />
and agricultural vehicles while they are on highways. The emissions include all sectors of the economy, but do not include international aviation or ship<br />
emissions, which are accounted for under bunker fuels. Emissions associated with international transport of people and goods are accounted for in the global<br />
total emissions and under bunker fuels.<br />
View full technical notes on-line at http://earthtrends.wri.org/searchable_db/variablenotes_static.cfmvarid=471&themeid=3<br />
Carbon dioxide emissions from residential sources include emissions from combustion of all fossil fuel types in households.<br />
View full technical notes on-line at http://earthtrends.wri.org/searchable_db/variablenotes_static.cfmvarid=477&themeid=3<br />
Carbon dioxide emissions from "other" sectors include the sum of emissions from combustion of all fossil fuel types used by Includes the commercial,<br />
agricultural, and public service sectors, as well as international bunkers.<br />
© EarthTrends 2003. All rights reserved. Fair use is permitted on a limited scale and for educational purposes. page 4
View full technical notes on-line at http://earthtrends.wri.org/searchable_db/variablenotes_static.cfmvarid=481&themeid=3<br />
Sources<br />
International Energy Agency (IEA), 2001. CO2 Emissions from Fossil Fuel Combustion (2001 Edition). Eletronic database available online at<br />
http://data.iea.org/ieastore/default.asp. Paris: Organization for Economic Cooperation and Development (OECD).<br />
CO2 Intensity, 1999<br />
CO2 emissions per total energy consumption <strong>pro</strong>vides an indicator of how much carbon dioxide is emitted per amount of energy used in a <strong>country</strong>. This<br />
relationship is expressed in metric tons of CO2 per terajoule, and was calculated using the Reference Ap<strong>pro</strong>ach CO2 emissions and total primary energy<br />
supply (including biomass and other non-fossil forms of energy). A higher ratio indicates the use of more carbon-intensive fuels such as coal and oil and<br />
relative smaller usage of low-carbon fuels such as gas, and renewable energy.<br />
Energy consumption is defined as the total amount of primary energy consumed as opposed to total final consumption. Primary energy includes losses<br />
through transportation, friction, heat loss and other inefficiencies. Specifically, consumption equals indigenous <strong>pro</strong>duction plus imports minus exports plus<br />
stock changes minus international marine bunkers. IEA calls this category Total Primary Energy Supply (TPES).<br />
View full technical notes on-line at http://earthtrends.wri.org/searchable_db/variablenotes_static.cfmvarid=605&themeid=3<br />
CO2 emissions per GDP, PPP in 1995 $ Intl indicates the amount of carbon dioxide emitted per amount of income generated by the <strong>country</strong>'s economy.<br />
Carbon dioxide emissions represent total emissions for each <strong>country</strong> and are based on the reference ap<strong>pro</strong>ach, which include emissions from combustion of<br />
all fossil fuels.<br />
Gross Domestic Product (GDP), PPP in constant 1995 international dollars is gross domestic <strong>pro</strong>duct converted to international dollars using Purchasing Power<br />
Parity (PPP) rates, and rescaled to 1995 to give a common reference year. An international dollar has the same purchasing power in a given <strong>country</strong> as a<br />
United States Dollar in the United States. In other words, an international dollar buys an equivalent amount of goods or services in all countries.<br />
View full technical notes on-line at http://earthtrends.wri.org/searchable_db/variablenotes_static.cfmvarid=606&themeid=3<br />
Sources<br />
International Energy Agency (IEA), 2001. CO2 Emissions from Fossil Fuel Combustion (2001 Edition). Eletronic database available online at<br />
http://data.iea.org/ieastore/default.asp. Paris: Organization for Economic Cooperation and Development (OECD).<br />
Non-CO2 Air Pollution<br />
Sulfur Dioxide, or SO2, is a primary contributor to acid deposition, or acid rain. High concentrations of sulfur dioxide affect breathing and may aggravate<br />
existing respiratory and cardiovascular disease. Sulfur dioxide forms when fuel containing sulfur, such as coal and oil, is burned, when gasoline is extracted<br />
from oil, or metals are extracted from ore. Petroleum refineries, cement manufacturing, and metal <strong>pro</strong>cessing facilities, as well as locomotives, large ships,<br />
and some nonroad diesel equipment burn high sulfur fuel and release SO2 emissions to the air in large quantities.<br />
View full technical notes on-line at http://earthtrends.wri.org/searchable_db/variablenotes_static.cfmvarid=812&themeid=3<br />
Nitrogen oxides, or NOx, is the generic term for a group of highly reactive, acidifying gases, all of which contain nitrogen and oxygen in varying amounts.<br />
Nitrogen oxides are a precursor to ground-level ozone, which can trigger serious respiratory <strong>pro</strong>blems. NOx also contributes to acid rain and global warming.<br />
It forms when fuel is burned at high temperatures, as in a combustion <strong>pro</strong>cess. The primary sources of Nox are motor vehicles, electric utilities, and other<br />
industrial, commercial, and residential sources that burn fuels.<br />
View full technical notes on-line at http://earthtrends.wri.org/searchable_db/variablenotes_static.cfmvarid=813&themeid=3<br />
Carbon monoxide, or CO, is a precursor gas of ground-level ozone, which can trigger serious respiratory <strong>pro</strong>blems. When CO enters the bloodstream, it<br />
reduces the delivery of oxygen to the body's organs and tissues. Exposure to elevated CO levels can cause impairment of visual perception, manual dexterity,<br />
© EarthTrends 2003. All rights reserved. Fair use is permitted on a limited scale and for educational purposes. page 5
learning ability and performance of complex tasks. CO is formed when carbon in fuel is not burned completely, and is a component of motor vehicle exhaust.<br />
Other sources of CO emissions include industrial <strong>pro</strong>cesses (such as metals <strong>pro</strong>cessing and chemical manufacturing), residential wood burning, stoves, and<br />
natural sources such as forest fires.<br />
View full technical notes on-line at http://earthtrends.wri.org/searchable_db/variablenotes_static.cfmvarid=814&themeid=3<br />
Non-methane VOCs (Volatile Organic Compounds) are chemicals that vaporize at room temperature, like benzene, toluene, methylene chloride and methyl<br />
chloroform. Common sources that emit VOCs include housekeeping and maintenance <strong>pro</strong>ducts, and building and furnishing materials, such as solvents,<br />
paints, and glues. In sufficient quantities, VOCs can have adverse health effects on humans; some are suspected of causing, or are known to cause, cancer.<br />
VOCs are also precursors to ground-level ozone, which can trigger respiratory <strong>pro</strong>blems.<br />
View full technical notes on-line at http://earthtrends.wri.org/searchable_db/variablenotes_static.cfmvarid=815&themeid=3<br />
Sources<br />
National Institute for Public Health (RIVM) and Netherlands Organization for Applied Scientific Research (TNO). 2001. The Emission Database for Global<br />
Atmospheric Research (EDGAR) 3.2. Precursors:CO (Carbon Monoxide): Aggregated Emissions 1990/1995. Electronic database available online at:<br />
http://arch.rivm.nl/env/int/coredata/edgar/. The Netherlands: RIVM.<br />
Multilateral Agreements, Status as of September 2002<br />
The Kyoto Protocol to the United Nations Framework Convention on Climate Change strengthens the international response to climate change, and<br />
<strong>pro</strong>motes the Convention's ultimate objective of preventing "dangerous anthropogenic [human-made] interference with the climate system". The Kyoto<br />
Protocol, which was adopted by consensus at the third session of the Conference of the Parties (COP-3) in December 1997, contains emission targets for<br />
Annex I (developed) countries for the post-2000 period.<br />
View full technical notes on-line at http://earthtrends.wri.org/searchable_db/variablenotes_static.cfmvarid=428&themeid=3<br />
The United Nations Framework Convention on Climate Change (UNFCCC) refers to the international agreement that targets industrial and other<br />
emissions of greenhouse gases such as carbon dioxide. The UNFCC is the centerpiece of global efforts to combat global warming. Initially adopted in 1992 at<br />
the Rio de Janeiro "Earth Summit" (http://www.un.org/geninfo/bp/enviro.html), the Convention entered into force on March 21, 1994. The ultimate<br />
objective of the UNFCC is the "stabilization of greenhouse gas concentrations in the atmosphere at a level that would prevent dangerous anthropogenic<br />
(human-made) interference with the climate system. Such a level should be achieved within a time-frame sufficient to allow ecosystems to adapt naturally to<br />
climate change, to ensure that food <strong>pro</strong>duction is not threatened and to enable economic development to <strong>pro</strong>ceed in a sustainable manner."<br />
View full technical notes on-line at http://earthtrends.wri.org/searchable_db/variablenotes_static.cfmvarid=620&themeid=3<br />
The Vienna Convention refers to the United Nations Environment Program’s (<strong>UNEP</strong>) Convention on the Protection of the Ozone Layer, adopted by the<br />
governments of the world in 1985. Through the Vienna Convention on the Protection of the Ozone Layer, governments committed themselves to <strong>pro</strong>tect the<br />
ozone layer, to cooperate in scientific research, and to im<strong>pro</strong>ve the understanding of atmospheric <strong>pro</strong>cesses<br />
Under the Convention, nations agree to take "ap<strong>pro</strong>priate measures…to <strong>pro</strong>tect human health and the environment against adverse effects resulting or<br />
likely to result from human activities which modify or are likely to modify the Ozone Layer." The measures are unspecified. There is no mention of any<br />
substances that might harm the ozone; CFCs appear towards the end of the annex to the treaty, where they are mentioned as chemicals that should be<br />
monitored.<br />
View full technical notes on-line at http://earthtrends.wri.org/searchable_db/variablenotes_static.cfmvarid=622&themeid=3<br />
Sources<br />
United Nations Framework Convention on Climate Change (UNFCCC). 2002. Kyoto Protocol Status of Ratification. Bonn: UNFCCC. Available on-line at<br />
http://www.unfccc.int/resource/kpstats.pdf.<br />
© EarthTrends 2003. All rights reserved. Fair use is permitted on a limited scale and for educational purposes. page 6
United Nations Framework Convention on Climate Change (UNFCCC). 2001. UNFCCC Status of Ratification. Bonn: UNFCCC. Available on-line at<br />
http://unfccc.int/resource/conv/ratlist.pdf.<br />
Secretariat for the Vienna Convention and the Montreal Protocol . 2002. Status of Ratification/Accession/Acceptance/Ap<strong>pro</strong>val of the agreements on the<br />
<strong>pro</strong>tection of the stratospheric ozone layer. Nairobi: United Nations Environment Program. Available online at: http://www.unep.ch/ozone/ratif.shtml.<br />
© EarthTrends 2003. All rights reserved. Fair use is permitted on a limited scale and for educational purposes. page 7
Biodiversity and Protected Areas-- <strong>Tanzania</strong><br />
<strong>Tanzania</strong><br />
Sub-<br />
Saharan<br />
<strong>Africa</strong> World<br />
Total Land Area (000 ha) 94,509 2,429,241 13,328,979<br />
Protected Areas<br />
Extent of Protected Areas by IUCN Category (000 ha), 2003:<br />
Nature Reserves, Wilderness Areas, and<br />
National Parks (categories I and II) 4,100 78,828 438,448<br />
Natural Monuments, Species Management<br />
Areas, and Protected Landscapes and<br />
Seascapes (categories III, IV, and V) 9,687 63,482 326,503<br />
Areas Managed for Sustainable Use and<br />
Unclassified Areas (category VI and "other") 23,641 122,080 692,723<br />
Total Area Protected (all categories) 37,428 264,390 1,457,674<br />
Marine and Littoral Protected Areas {a} 107 X 417,970<br />
Protected Areas as a Percent of Total Land<br />
Area, 2003 {b} 39.6% 10.9% 10.8%<br />
Number of Protected Areas, 2003 792 6,867 98,400<br />
Number of Areas >100,000 ha, 2003 69 425 2,091<br />
Number of Areas > 1 million ha, 2003 6 50 243<br />
Wetlands of International Importance (Ramsar Sites), 2002:<br />
Number of Sites 3 X 1,179<br />
Total Area (000 ha) 4,272 X 102,283<br />
Biosphere Reserves, 2002<br />
Number of Sites 3 46 408<br />
Total Area (000 ha) 5,228 X 439,000<br />
Number and Status of Species<br />
Higher Plants<br />
Total known species (number), 1992-2002 10,008 X X<br />
Number of threatened species, 2002 235 X 5,714<br />
Mammals<br />
Total known species (number), 1992-2002 316 X X<br />
Number of threatened species, 2002 42 X 1,137<br />
Breeding Birds<br />
Total known species (number), 1992-2002 229 X X<br />
Number of threatened species, 2002 33 X 1,192<br />
Percent of Total Land Area Protected<br />
30%<br />
25%<br />
20%<br />
15%<br />
10%<br />
5%<br />
0%<br />
Higher Plants<br />
EarthTrends<br />
Country Profiles<br />
Portion of Land Area Protected by IUCN Category, <strong>Tanzania</strong>,<br />
2003<br />
Mammals<br />
Breeding Birds<br />
Categories I and II<br />
Reptiles<br />
Amphibians<br />
Fish<br />
<strong>Tanzania</strong><br />
Categories III, IV,<br />
and V<br />
Category VI and<br />
Unclassified Areas<br />
Sub-Saharan <strong>Africa</strong><br />
Threatened Species, <strong>Tanzania</strong>, 2002-03<br />
0 50 100 150 200 250<br />
Number of Species<br />
View more Country Profiles on-line at http://earthtrends.wri.org<br />
© EarthTrends 2003. All rights reserved. Fair use is permitted on a limited scale and for educational purposes. page 1
Biodiversity and Protected Areas-- <strong>Tanzania</strong><br />
Number and Status of Species, continued <strong>Tanzania</strong><br />
Sub-<br />
Saharan<br />
<strong>Africa</strong> World<br />
Reptiles<br />
Number of Total Known Species, 1992-2003 335 X X<br />
Number of threatened species, 2002 5 X 293<br />
Amphibians<br />
Number of Total Known Species, 1992-2003 116 X X<br />
Number of threatened species, 2002 X X 157<br />
Fish<br />
Number of Total Known Species, 1992-2003 331 X X<br />
Number of threatened species, 1992-2002 17 X 742<br />
Legal Trade in Selected Wildlife and CITES {c} Status<br />
Year CITES Ratified<br />
Net International Legal Trade Reported by CITES, 2000 (number) {d}<br />
Live Lizards -31,829 -150,281<br />
Live Snakes -66 -148,644<br />
Live Primates 0 -12,677<br />
Live Parrots -82 -201,235<br />
Lizard Skins X -270,275<br />
Snake Skins X -24,245<br />
Crocodile Skins -1,533 -104,282<br />
Wild Cat Skins -49 -754<br />
X<br />
Unique Species Per 10,000 km2, <strong>Tanzania</strong>, 1990s<br />
Mammals<br />
Breeding Birds<br />
Reptiles<br />
Amphibians<br />
0 0.5 1 1.5 2 2.5 3 3.5 4<br />
number of species<br />
Footnotes:<br />
a. Marine and littoral <strong>pro</strong>tected areas are not included in the "Total Area Protected" above.<br />
b. Includes IUCN categories I-V. Marine and littoral <strong>pro</strong>tected areas are excluded from these totals.<br />
c. CITES is an acronym for the Convention on International Trade in Endangered Species of Wild Fauna and Flora.<br />
d. Postive numbers represent net imports; negative numbers represent net exports. Regional figures are the sum of <strong>country</strong>-level trade statistics, therefore,<br />
these numbers include trade between countries in the same region.<br />
View more Country Profiles on-line at http://earthtrends.wri.org<br />
© EarthTrends 2003. All rights reserved. Fair use is permitted on a limited scale and for educational purposes. page 2
Biodiversity and Protected Areas—Sources and Definitions<br />
Protected Areas<br />
Total Land Area is reported by the Food and Agriculture Organization of the United Nations (FAO). The area of inland water bodies is included in the total.<br />
Extent of Protected Areas by IUCN Category<br />
View full technical notes on-line at http://earthtrends.wri.org/pdf_library/data_tables/Bio2_2003.pdf<br />
An IUCN Management Protected Area is defined by IUCN as “an area of land and/or sea especially dedicated to the <strong>pro</strong>tection and maintenance of biological<br />
diversity, and of natural and associated cultural resources, and managed through legal or other effective means." As of Summer 2003 a World Database on<br />
Protected Areas (WDPA) consortium has been working to <strong>pro</strong>duce an im<strong>pro</strong>ved and updated database available in the public domain. Summary information<br />
presented in the WDPA, of which <strong>UNEP</strong>-WCMC is the custodian, includes the legal designation, name, IUCN Management Category, size in hectares, location<br />
(latitude and longitude), and the year of establishment for over 100,000 sites. IUCN categorizes <strong>pro</strong>tected areas by management objective.<br />
All calculations for the analyses were performed by WRI using the WDPA GIS point file containing all nationally-designated <strong>pro</strong>tected areas, joined with a<br />
corresponding table showing area in hectares (<strong>pro</strong>vided by <strong>UNEP</strong>-WCMC). Due to variations in consistency and methodology of collection, data on <strong>pro</strong>tected<br />
areas are highly variable among countries. Some countries update their information with greater regularity; others may have more accurate data on extent of<br />
coverage. Many countries have an underreported number and/or extent of <strong>pro</strong>tected areas within their borders.<br />
Nature Reserves, Wilderness, Areas, and National Parks (categories I and II) include all land area <strong>pro</strong>tected in the following IUCN categories:<br />
Category Ia. Strict nature reserve: A <strong>pro</strong>tected area managed mainly for scientific research and monitoring; an area of land and/or sea possessing some<br />
outstanding or representative ecosystems, geological or physiological features and/or species.<br />
Category Ib. Wilderness area: A <strong>pro</strong>tected area managed mainly for wilderness <strong>pro</strong>tection; a large area of unmodified or slightly modified land and/or sea<br />
retaining its natural character and influence, without permanent or significant habitation, which is <strong>pro</strong>tected and managed so as to preserve its natural<br />
condition.<br />
Category II. National park: A <strong>pro</strong>tected area managed mainly for ecosystem <strong>pro</strong>tection and recreation; a natural area of land and/or sea designated to: (a)<br />
<strong>pro</strong>tect the ecological integrity of one or more ecosystems for present and future generations; (b) exclude exploitation or occupation inimical to the purposes<br />
of designation of the area; and (c) <strong>pro</strong>vide a foundation for spiritual, scientific, educational, recreational, and visitor opportunities, all of which must be<br />
environmentally and culturally compatible.<br />
Natural Monuments, Species Management Areas, and Protected Landscapes and Seascapes (categories III, IV, and V) include all land area<br />
<strong>pro</strong>tected in the following IUCN categories:<br />
Category III. Natural monument: A <strong>pro</strong>tected area managed mainly for conservation of specific natural features; an area containing one or more specific<br />
natural or natural/cultural features that is of outstanding or unique value because of its inherent rarity, representative or aesthetic qualities, or cultural<br />
significance.<br />
Category IV. Habitat/species management area: A <strong>pro</strong>tected area managed mainly for conservation through management intervention; an area of land and/or<br />
sea subject to active intervention for management purposes so as to ensure the maintenance of habitats and/or to meet the requirements of specific species.<br />
Category V. Protected landscape/seascape: A <strong>pro</strong>tected area managed mainly for landscape/seascape conservation and recreation; an area of land, with coast<br />
and sea as ap<strong>pro</strong>priate, where the interaction of people and nature over time has <strong>pro</strong>duced an area of distinct character with significant aesthetic, ecological,<br />
and/or cultural value, and often with high biological diversity.<br />
© EarthTrends 2003. All rights reserved. Fair use is permitted on a limited scale and for educational purposes. page 3
Areas Managed for Sustainable Use and Unclassified Areas (category VI and "other" ) include some <strong>pro</strong>tected areas not classified by IUCN and:<br />
Category VI. Managed mainly for the sustainable use of natural ecosystems. These areas contain predominantly unmodified natural systems, managed to<br />
ensure long-term <strong>pro</strong>tection and maintenance of biological diversity, while also <strong>pro</strong>viding a sustainable flow of natural <strong>pro</strong>ducts and services to meet<br />
community needs.<br />
Marine and Littoral Protected Areas (MPAs) include marine <strong>pro</strong>tected areas, littoral <strong>pro</strong>tected areas, and <strong>pro</strong>tected areas with both marine and littoral<br />
components. All are assigned an IUCN category (I-VI), although MPAs are excluded from the totals listed above. IUCN defines a Marine Protected Area as:<br />
"any area of intertidal or subtidal terrain, together with its overlying water and associated flora and fauna, historical and cultural features, which has been<br />
reserved by law or other effective means to <strong>pro</strong>tect part or all of the enclosed environment." These marine <strong>pro</strong>tected areas include areas that are fully marine<br />
and areas that have only a small percentage of intertidal land. Many MPAs have large terrestrial areas. The extent of the marine portion of most <strong>pro</strong>tected<br />
areas is rarely documented. The degree of <strong>pro</strong>tection varies from one <strong>country</strong> to another, and may bear little relationship to the legal status of any site.<br />
"Littoral" is defined as any site which is known to incorporate at least some intertidal area.<br />
Protected Areas as a % of Total Land Area is calculated by dividing the total land area <strong>pro</strong>tected under IUCN Categories I-V by the total land area in a<br />
<strong>country</strong> (see above for complete definitions). Marine and Littoral <strong>pro</strong>tected areas are excluded from this calculation.<br />
Data for the Number of Protected Areas, Number of Areas >100,000 ha, and Number of Areas > 1,000,000 ha include areas classified in IUCN<br />
categories I-V. Marine and littoral <strong>pro</strong>tected areas are not included here.<br />
Number and Area of Wetlands of International Importance, or Ramsar Sites, are defined under the Wetlands Convention, signed in Ramsar, Iran, in<br />
1971. The Convention on Wetlands is an intergovernmental treaty that <strong>pro</strong>vides the framework for national action and international cooperation for the<br />
conservation and wise use of wetlands and their resources. In order to qualify as a Ramsar site, an area must have "international significance in terms of<br />
ecology, botany, zoology, limnology or hydrology.” See http://www.ramsar.org/key_criteria.htm for a full listing of the selection criteria.<br />
View full technical notes on-line at http://earthtrends.wri.org/searchable_db/variablenotes_static.cfmvarid=174&theme=7<br />
Number and Area of Biosphere Reserves are terrestrial and coastal/marine environments that have been internationally recognized under the Man and the<br />
Biosphere Programme of the United Nations Educational, Scientific, and Cultural Organization (UNESCO). These sites have been selected for their value to<br />
conservation and are intended to foster the scientific knowledge and skills necessary for <strong>pro</strong>moting sustainable development. Each reserve must contain a<br />
diverse, natural ecosystem large enough to be an effective conservation unit. Some Biosphere Reserves are shared by two or more countries, but the land area<br />
presented here corresponds to the portion of the shared Biosphere Reserve in that <strong>country</strong> only.<br />
View full technical notes on-line at http://earthtrends.wri.org/searchable_db/variablenotes_static.cfmvarid=437&theme=7<br />
Sources<br />
United Nations Environment Programme - World Conservation Monitoring Centre (<strong>UNEP</strong>-WCMC). World Database on Protected Areas (WDPA) Version 6.<br />
Compiled by the World Database on Protected Areas Consortium. Cambridge, U.K., August, 2003.<br />
United Nations Educational, Scientific, and Cultural Organization (UNESCO). 2002. Man and the Biosphere Reserves Directory. Paris: UNESCO. Available on<br />
line at: http://www.unesco.org/mab/wnbr.htm.<br />
The Ramsar Bureau. 2002. List of Wetlands of International Importance. Gland: The Ramsar Bureau. Available online at: http://ramsar.org/sitelist.pdf.<br />
© EarthTrends 2003. All rights reserved. Fair use is permitted on a limited scale and for educational purposes. page 4
Number and Status of Species<br />
Known Species<br />
The Number of Known Species refers to the total number of known, described, and recorded species in a given <strong>country</strong>. Total numbers for all species<br />
groups include both endemic and non-endemic species (a species that is found in a particular region and nowhere else is said to endemic to that region).<br />
Numbers may also include introduced species. Figures are not necessarily comparable among countries because taxonomic concepts and the extent of<br />
knowledge about actual species numbers vary. Country totals of species are underestimates of actual species numbers.<br />
The number of Known Plants include vascular plant species (flowering plants, conifers, cycads and fern species), but do not include mosses. Known<br />
Mammals exclude marine mammals. Known Birds include only birds that breed in that <strong>country</strong>, not those that migrate or winter there. The number of<br />
Known Fish include both freshwater and marine species.<br />
Data are collected by the United Nations Environment Programme World Conservation Monitoring Centre (<strong>UNEP</strong>-WCMC) from a variety of sources, including,<br />
but not limited to: national reports from the convention on biodiversity, other national documents, independent studies, and other texts. Data are updated<br />
on a continual basis as they become available; however, updates vary widely by <strong>country</strong>. While some countries (<strong>UNEP</strong>-WCMC estimates about 12) have data<br />
that were updated in the last 6 months, other species estimates have not changed since the data were first collected in 1992.<br />
The complete <strong>UNEP</strong>-WCMC dataset from which Known Species of Mammals, Birds, Plants, Reptiles, and Amphibians were extracted represents only<br />
about 2% of the total species of the world. As a result, the numbers reported here are vast underestimates of the actual species worldwide. Mammals and<br />
birds are better known and represented than other taxonomic groups. Invertebrates in the kingdom Animalia, the kingdom Protista, and the kingdom<br />
Monera are not included in these <strong>country</strong> <strong>pro</strong>files.<br />
Data on Known Species of Mammals, Birds, Plants, Reptiles, and Amphibians are based on a compilation of available data from a large variety of<br />
sources. They are not based on species checklists. Data have been collected over the last decade without a consistent ap<strong>pro</strong>ach to taxonomy. Additionally,<br />
while the number of species in each <strong>country</strong> does change, not all countries are updated systematically, and some data may not reflect recent trends.<br />
Threatened Species<br />
The Number of Threatened Species for include "all full species categorized at the global level as Critically Endangered, Endangered or Vulnerable." Subspecies,<br />
introduced species, species whose status is insufficiently known, and species whose status has not been assessed are excluded.<br />
Threatened species are classified in one of 3 categories:<br />
1. Critically Endangered: includes species facing an extremely high risk of extinction in the wild in the immediate future.<br />
2. Endangered: includes species that are not "Critically Endangered" but are facing a very high risk of extinction in the wild in the near future<br />
3. Vulnerable: includes species facing a high risk of extinction in the wild in the medium-term future.<br />
For each threat category, five criteria A-E are used to classify species in one of the three categories mentioned above:<br />
A- Declining population<br />
B- Small population and decline or fluctuation<br />
C- Small population size and decline<br />
D- Very small population/very restricted distribution<br />
E- Quantitative analysis (e.g. Population Viability Analysis)<br />
© EarthTrends 2003. All rights reserved. Fair use is permitted on a limited scale and for educational purposes. page 5
Data on threatened species are compiled and maintained by the IUCN in their Red List of Threatened Animals and the World List of Threatened Trees.<br />
Generally, the information presented in the current IUCN Red List represents an accumulation of knowledge derived from previously published Red Lists. In<br />
some cases, assessments are the <strong>pro</strong>duct of group discussion, but often they represent the judgement of individual Specialist Group members. In order to<br />
ensure greater accuracy and transparency in the listing <strong>pro</strong>cess, a peer review system of Red List Evaluators was initiated. Designated Red List Authorities are<br />
responsible for ensuring that all species they are responsible for are documented and re-assessed at regular intervals. For more detailed information please<br />
refer to the original source at: http://www.redlist.org/info/categories_criteria2001.html.<br />
Data on threatened species of mammals, birds, plants, reptiles, and amphibians underestimate the total number of threatened species in these groups<br />
worldwide. To date, threatened species assessments have been undertaken for 100% of described birds and mammals, for less than 15% of described<br />
reptiles and amphibians, and for less than 10% of described fish. For plants, threatened species assessments have been undertaken for less than 1% of<br />
described mosses, less than 72% of Gymnosperms, less than 5% of Dicotyledons, and less than 2% of Monocotyledons. Beyond the group of described<br />
species, there are many species that have yet to be described and whose status is yet unknown. Data on threatened species is better represented for<br />
mammals and birds than for other taxonomic groups. Far-ranging species, such as some marine species, may not be well-documented in the <strong>country</strong> data.<br />
Sources<br />
United Nations Environment Programme World Conservation Monitoring Centre (<strong>UNEP</strong>-WCMC). 2002-2003. <strong>UNEP</strong>-WCMC Species Database. Cambridge,<br />
U.K.: <strong>UNEP</strong>-WCMC. Web site: http://www.unep-wcmc.org.<br />
International Union for Conservation of Nature and Natural Resources (IUCN). 2002. 2002 IUCN Red List of Threatened Species. IUCN: Gland, Switzerland.<br />
Available on-line at: http://www.redlist.org/info/tables/table5.html; http://www.redlist.org/info/tables/table1.html.<br />
Legal Trade in Selected Wildlife and CITES Status<br />
Year CITES ratified indicates the year that a <strong>country</strong> has either signed or ratified The Convention on International Trade in Endangered Species of Wild<br />
Fauna and Flora. By signing the treaty, a state recognizes the authentic text, intends to complete the <strong>pro</strong>cedures for becoming legally bound by it, and is<br />
committed not to act against the treaty's objectives before ratification. Ratification (or its equivalents of acceptance, ap<strong>pro</strong>val, or accession) binds the state to<br />
observe the treaty. Depending on a <strong>country</strong>'s system of governance, signing the treaty may be simply an executive decision while ratification requires<br />
legislative ap<strong>pro</strong>val. CITES is an international agreement to ensure that the survival of wild animals and plants is not threatened by international trade. It has<br />
been in force for almost 30 years; today, it accords varying degrees of <strong>pro</strong>tection to more than 30,000 species of animals and plants, whether they are traded<br />
as live specimens, fur coats, or dried herbs. CITES is legally binding on countries that have joined the Convention, and <strong>pro</strong>vides a framework to be respected<br />
by each Party, which has to adopt its own domestic legislation to make sure that CITES is implemented at the national level. More information is available at<br />
http://www.cites.org.<br />
View full technical notes on-line at http://earthtrends.wri.org/searchable_db/variablenotes_static.cfmvarid=632&theme=7<br />
Net International Legal Trade Reported by CITES is the balance of imports minus exports of selected wildlife and wildlife <strong>pro</strong>ducts from the spectrum of<br />
wildlife and wildlife <strong>pro</strong>ducts for which export, re-export, and import permits are issued. Net exports are shown as negative, and all figures are for trade<br />
reported for the year 2000. Data on net exports and net imports as reported by CITES correspond to legal international trade and are based on permits issued,<br />
not actual items traded. Figures may be overestimates if not all permits are used that year. In addition, some permits issued in one year are used at a later<br />
date. For these reasons, numbers of exports and imports may not match exactly for any given year. Regional values represent the sum of intra-regional and<br />
inter-regional trade for all countries in a given region, and is not limited to the sum of exports into and out of a region. World totals show the total number<br />
of exports, since calculating the balance of trade for the world would have canceled all figures. About 25,000 species of plants and 5,000 species of animals<br />
are listed under CITES; many species groups are not listed.<br />
© EarthTrends 2003. All rights reserved. Fair use is permitted on a limited scale and for educational purposes. page 6
Live Lizards include the net number of import, export, and re-export permits issued in the year 2000 for individuals from all Sauria and Rhynchocephalia<br />
species listed under the CITES treaty, while Lizard Skins represent the net number of permits issued for whole skins for these groups of species. Live<br />
Snakes include the net number of permits issued in the year 2000 for individuals from all Serpentes species listed under the CITES treaty, while Snake Skins<br />
represent the net number of permits issued for whole skins for these groups of species. Live Primates include the net number of permits issued in the year<br />
2000 for individuals of all monkeys, apes, and <strong>pro</strong>simians listed under the CITES treaty. Live Parrots include the net number of permits issued in the year<br />
2000 for individuals of all Psittaciformes species listed under the CITES treaty. Crocodilian skins represent the number of permits issued in the year 2000 for<br />
whole skins belonging to individuals of Crocodylia species that are listed under the CITES treaty. Cat skins represent the number of permits issued in the year<br />
2000 for whole skins belonging to individuals of Felidae species that are listed under the CITES treaty.<br />
Sources<br />
Convention on International Trade in Endangered Species of Wild Flora and Fauna (CITES) Secretariat. List of Contracting Parties. Available on-line at:<br />
http://www.cites.org/eng/parties/alphabet.shtml (United Nations Environment Program, Nairobia, Kenya, May 2002).<br />
United Nations Environment Programme World Conservation Monitoring Centre (<strong>UNEP</strong>-WCMC). Convention on International Trade in Endangered Species<br />
of Wild Flora and Fauna (CITES) annual report data, WCMC CITES Trade Database (<strong>UNEP</strong>-WCMC, Cambridge, U.K., July 2002).<br />
© EarthTrends 2003. All rights reserved. Fair use is permitted on a limited scale and for educational purposes. page 7
Forests, Grasslands, and Drylands-- <strong>Tanzania</strong><br />
EarthTrends<br />
Country Profiles<br />
Forest Area and Change<br />
<strong>Tanzania</strong><br />
Sub-<br />
Saharan<br />
<strong>Africa</strong> World<br />
Total forest area, 2000 (000 ha) 38,811 486,571 3,869,455<br />
Natural forest area, 2000 (000 ha) 38,676 478,576 3,682,722<br />
Plantations area, 2000 (000 ha) 135 6,210 186,733<br />
Total dryland area, 1950-1981 (000 ha) {a} X 1,120,649 5,059,984<br />
Change in forest area:<br />
Total, 1990-2000 -2% -9% -2%<br />
Natural, 1990-2000 X X -4%<br />
Plantations, 1990-2000 X X 3%<br />
Original forest {b} as a percent of<br />
total land area {c} 22% X 48%<br />
Forest area in 2000 as a percent of<br />
total land area {c} 41% 20% 29%<br />
Forest Area by Crown Cover (000 ha), 2000<br />
Note: Crown cover data are gathered using different methodologies than the forest area calculated above. The<br />
two estimates may differ substantially.<br />
Area of forest with crown cover:<br />
Greater than 10% 75,474 1,238,077 6,537,209<br />
Greater than 25% 45,571 837,730 4,842,071<br />
Greater than 50% 9,841 421,190 3,143,720<br />
Greater than 75% 1,340 225,239 1,945,916<br />
Ecosystem Areas by Type<br />
Total land area 94,509 2,429,241 13,328,979<br />
Percent of total land area covered by:<br />
Forests 27% 15% 24%<br />
Shrublands, savanna, and grasslands 27% 50% 37%<br />
Cropland and crop/natural vegetation<br />
mosaic 39% 15% 20%<br />
Urban and built-up areas 0.0% 0.0% 0.2%<br />
Sparse or barren vegetation; snow and ice 0% 18% 16%<br />
Wetlands and water bodies 7% 2% 3%<br />
Ecosystem Areas by Type, <strong>Tanzania</strong>, 1992-93<br />
39%<br />
0% 7%<br />
27%<br />
27%<br />
forests<br />
shrublands, savanna, and<br />
grasslands<br />
cropland and crop/natural<br />
vegetation mosaic<br />
urban and built-up areas<br />
sparse or barren<br />
vegetation; snow and ice<br />
wetlands and water bodies<br />
Forests certified through the Forest Stewardship Council<br />
Natural forests, 2002 (hectares) 0 85,980 11,457,393<br />
Plantations, 2002 (hectares) 0 983,936 3,324,996<br />
Mixed forests, 2002 (hectares) 0 0 11,461,154<br />
View more Country Profiles on-line at http://earthtrends.wri.org<br />
© EarthTrends 2003. All rights reserved. Fair use is permitted on a limited scale and for educational purposes. page 1
Forests, Grasslands, and Drylands-- <strong>Tanzania</strong><br />
Forest Protection<br />
<strong>Tanzania</strong><br />
Sub-<br />
Saharan<br />
<strong>Africa</strong> World<br />
Percent of forests <strong>pro</strong>tected:<br />
Tropical forest, 1990s 15.8% 9.1% 9.0%<br />
Nontropical forest, 1990s X 26.4% 6.0%<br />
Sparse trees and parkland, 1990s 3.3% 11.3% 5.5%<br />
Number of tree species threatened, 1990s 317 X 5,904<br />
Wood Production and Trade<br />
Annual roundwood <strong>pro</strong>duction:<br />
Total, 1996-1998 (000 meters 3 ) 38,193 512,491 3,261,621<br />
Fuel, 1996-1998 (000 meters 3 ) 35,947 445,783 1,739,504<br />
Industrial, 1996-1998 (000 meters 3 ) 2,246 66,709 1,522,116<br />
Wood-based panels, 1996-1998<br />
(000 meters 3 ) 4 1,630 151,390<br />
Paper and paperboard, 1996-1998<br />
(thousand metric tons) 25 X 313,206<br />
Recovered paper, 1996-1998<br />
(thousand metric tons) X X 126,404<br />
Average value of trade in forest <strong>pro</strong>ducts {d}:<br />
Imports, 1996-1998 (thousand US$) 6,003 980,339 142,932,629<br />
Exports, 1996-1998 (thousand US$) 4,797 2,628,858 135,313,009<br />
Forest <strong>pro</strong>duct exports as a percent of the<br />
total value of all exports, 1997 X 3.5% 2.0%<br />
Other Resources:<br />
Country Profiles of the Food and Agriculture Organization<br />
of the United Nations, Forestry Sector:<br />
http://www.fao.org/<strong>country</strong><strong>pro</strong>files/index.aspsubj=5&iso3=TZA<br />
Fuelwood and Industrial Roundwood, million m3<br />
Forest Products Production, <strong>Tanzania</strong>, 1961-2001<br />
25<br />
20<br />
15<br />
10<br />
5<br />
0<br />
no data available<br />
1961 1971 1981 1991 2001<br />
no data available<br />
35<br />
30<br />
25<br />
20<br />
15<br />
10<br />
5<br />
0<br />
Paper and Paperboard,<br />
metric tons<br />
fuelwood industrial roundwood Paper and Paperboard<br />
Average Paper Consumption per Capita, 2000<br />
Footnotes:<br />
a. Areas are presented as long-term average covering the years from 1950 to 1981.<br />
b. Original forest refers to estimated forest cover about 8,000 years ago assuming current climatic conditions.<br />
c. "Forest area in 2000 as a percent of total land area" and "Original forest as a percent of total land area" are not directly comparable; data are from two different sources.<br />
d. Includes trade in industrial roundwood, wood fuel, sawnwood, wood-based panels, pulp, paper and paperboard, recovered paper, chips, particles, & wood residues.<br />
View more Country Profiles on-line at http://earthtrends.wri.org<br />
© EarthTrends 2003. All rights reserved. Fair use is permitted on a limited scale and for educational purposes. page 2
Forests, Grasslands, and Drylands—Sources and Definitions<br />
Forest Area and Change<br />
Total forest area includes both natural forests and plantations. Total Forest is defined as land with tree crown cover of more than 10 percent of the ground<br />
and area of more than 0.5 hectares. Tree height at maturity should exceed 5 meters. These forest statistics are based primarily on forest inventory<br />
information <strong>pro</strong>vided by national governments. In the case of the tropical region, inventory information is supplemented by a remote sensing survey. If only<br />
limited or out-dated inventory data are available, combination of linear <strong>pro</strong>jections and expert opinion techniques were applied to fill in data gaps.<br />
View full technical notes on-line at http://earthtrends.wri.org/searchable_db/variablenotes_static.cfmvarid=296&theme=9<br />
Natural forest area is the total area of forest composed primarily of indigenous (native) tree species. Natural forests include closed forest, where trees cover<br />
a high <strong>pro</strong>portion of the ground and where grass does not form a continuous layer on the forest floor (e.g., broadleaved forests, coniferous forests, and<br />
bamboo forests), and open forest, which the Food and Agriculture Organization of the United Nations (FAO) defines as mixed forest/grasslands with at least<br />
10 percent tree cover and a continuous grass layer on the forest floor. Tree height at maturity should exceed 5 meters. Natural forest is estimated by<br />
subtracting plantation area from total forest areas.<br />
View full technical notes on-line at http://earthtrends.wri.org/searchable_db/variablenotes_static.cfmvarid=300&theme=9<br />
Plantations area describes forest stands established artificially by afforestation and reforestation for industrial and non-industrial usage. Reforestation does<br />
not include regeneration of old tree crops (through either natural regeneration or forest management), although some countries may report regeneration as<br />
reforestation. Many trees are also planted for non-industrial uses, such as village wood lots. Non-industrial plantations include those established for fuelwood<br />
<strong>pro</strong>duction, soil <strong>pro</strong>tection, amenity or other purposes. They do not include plantations of agro-forestry crops, such as rubber and oil palm. The data<br />
presented here reflect plantation survival rate as estimated by FAO. Tree height at maturity should exceed 5 meters.<br />
View full technical notes on-line at http://earthtrends.wri.org/searchable_db/variablenotes_static.cfmvarid=304&theme=9<br />
Total dryland land area is the total terrestrial area falling within three of the world’s six aridity zones—the arid, semi-arid, and dry sub-humid zones. These<br />
areas are especially vulnerable to land degradation. In drylands, the ratio of average precipitation to average evapotranspiration, called the aridity index, is<br />
between .05 and .65 (excluding polar and sub-polar regions). The East Anglica University Climatic Research Centre used climate surfaces to define aridity<br />
zone boundaries for the globe.<br />
View full technical notes on-line at http://earthtrends.wri.org/searchable_db/variablenotes_static.cfmvarid=700&theme=9<br />
Change in forest area is the total percent change in both natural forests and plantations between 1990 and 2000. Total forest is defined as land with tree<br />
crown cover of more than 10 percent of the ground and area of more than 0.5 hectares. Tree height at maturity should exceed 5 meters. In many cases, FAO<br />
<strong>pro</strong>jected forward or backward in time to estimate forest area in the two reference years and calculate change in area over the decade.<br />
View full technical notes on-line at http://earthtrends.wri.org/searchable_db/variablenotes_static.cfmvarid=298&theme=9<br />
Original forest as a percent of land area refers to the estimate of the percent of land that would have been covered by closed forest about 8,000 years<br />
ago assuming current climatic conditions, before large-scale disturbance by human society began. Figures are based on a map of estimated forest cover<br />
developed by the World Conservation Monitoring Centre (WCMC). This map was developed by WCMC based on numerous global and regional<br />
biogeographic maps.<br />
View full technical notes on-line at http://earthtrends.wri.org/searchable_db/variablenotes_static.cfmvarid=312&theme=9<br />
Forest area in 2000 as a percent of total land area is calculated by dividing total forest area (see above) by total land area.<br />
© EarthTrends 2003. All rights reserved. Fair use is permitted on a limited scale and for educational purposes. page 3
Sources<br />
Food and Agriculture Organization of the United Nations (FAO). 2001. Global Forest Resources Assessment 2000--main Report. FAO Forestry Paper No. 140.<br />
Rome: FAO. Data available on-line at http://www.fao.org/forestry/foris/webview/forestry2/index.jspsiteId=101&langId=1<br />
<strong>UNEP</strong>/<strong>GRID</strong>. United Nations Environment Program/Global Resource Information Database. 1991. Global digital data sets for land degradation studies: a GIS<br />
ap<strong>pro</strong>ach. Prepared by U. Deichmann and L. Eklundh. <strong>GRID</strong> Case Study Series No. 4. <strong>UNEP</strong>/GEMS and <strong>GRID</strong>. Nairobi, Kenya.<br />
Bryant, D., D. Nielsen and L. Tangley, "The Last Frontier Forests: Ecosystems and Economies on the Edge", (World Resources Institute, Washington, DC,<br />
1997).<br />
Forest Area by Canopy Cover<br />
Area of forest with canopy cover greater than 10% shows the amount of a <strong>country</strong>'s land area that is at least 10% covered by the crown of a woody<br />
species. Area of forest with canopy cover greater than 25%, 50%, and 75% shows the amount of a <strong>country</strong>'s land area that is at least 25, 50, or 75%<br />
covered by the crown of a woody species. Canopy cover is the vertical <strong>pro</strong>jection of a tree's outermost perimeter, including small openings in the crown.<br />
Areas reported here are gathered via satellite data by the Moderate Resolution Imaging Spectroradiometer (MODIS) instrument over several months in 2000.<br />
The percent tree cover data are derived from an automated algorithm depicting percent tree crown cover for each 500 meter pixel based on a year of MODIS<br />
data inputs.<br />
View full technical notes on-line at http://earthtrends.wri.org/searchable_db/variablenotes_static.cfmvarid=781&theme=9<br />
Sources<br />
University of Maryland (UMd) Global Land Cover Facility (GLCF). 2002. MODIS 500m Vegetation Continuous Fields Percent Tree Cover. Available online at<br />
http://glcf.umiacs.umd.edu/data/. Data by <strong>country</strong> were <strong>pro</strong>cessed by UMd for the World Resources Institute.<br />
Ecosystem Areas By Type<br />
Total land area is the total area of the <strong>country</strong>, including area under inland water bodies, obtained mainly from the United Nations Statistical Division.<br />
View full technical notes on-line at http://earthtrends.wri.org/searchable_db/variablenotes_static.cfmvarid=102&theme=9<br />
Ecosystem areas by type were measured by the Global Land Cover Characteristics (GLCC) <strong>pro</strong>ject using satellite images in conjunction with ancillary data.<br />
The satellite data were measured by a Advanced Very High Resolution Radiometer (AVHRR), with a resolution of 1 X 1 km. Ancillary data include (1) a digital<br />
elevation model of the ecological factors that govern natural vegetation distribution; (2) ecoregions data to to stratify vegetation by seasonal impacts; and (3)<br />
maps of soils, vegetation, and land cover enabling post-classification refinement. The GLCC study classified vegetation and other land cover types into one<br />
of18 categories, originally defined by the International Geosphere-Biosphere Programme (IGBP) (please see http://www.igbp.kva.se/ for details). WRI's<br />
<strong>country</strong> <strong>pro</strong>files have combined these 18 original cateogories into the 6 larger classifications described below:<br />
View full technical notes on-line at http://earthtrends.wri.org/searchable_db/variablenotes_static.cfmvarid=750&theme=9<br />
Forests include all areas dominated by evergreen or deciduous trees with a canopy cover of greater than 60% and a height exceeding 2 meters. Both<br />
broadleaf and needleleaf trees are included.<br />
Shrublands, savannah and grasslands include lands dominated by woody vegetation less than 2 meters tall and with shrub canopy cover greater than<br />
10%. The shrub foliage can be either evergreen or deciduous. This category also includes savannas and grasslands with herbaceous and other understory<br />
systems. These lands may have a tree or shrub cover of less than 60%.<br />
© EarthTrends 2003. All rights reserved. Fair use is permitted on a limited scale and for educational purposes. page 4
Cropland and crop/natural vegetation mosaic. Croplands are lands covered with temporary crops followed by harvest and a bare soil period (e.g., single<br />
and multiple cropping systems). Perennial woody crops are classified as forest or shrub land cover. Cropland/natural vegetation mosaics are lands with a<br />
mosaic of croplands, forests, shrublands, and grasslands in which no one component comprises more than 60% of the landscape.<br />
Urban and built-up areas are covered by buildings and other man-made structures. This class was developed from the the Digital Chart of the World's<br />
"populated places layer" (Defense Mapping Agency, 1992).<br />
Sparse or barren vegetation; snow and ice. Barren and sparsely vegetated areas are lands of exposed soil, sand, rocks, or snow and never has more than<br />
10% vegetated cover during any time of the year. Snow and ice covered areas are lands under snow and/or ice cover throughout the year.<br />
Wetlands and water bodies. Permanent wetlands are lands with a permanent mixture of water and herbaceous or woody vegetation that cover extensive<br />
areas. The vegetation can be present in either salt, brackish, or fresh water. Water bodies are oceans, seas, lakes, reservoirs, and rivers. They can be either<br />
fresh or salt water bodies.<br />
Sources<br />
Loveland, T.R., Reed, B.C., J.F., Brown, J.F., Ohlen, D.O., Zhu, Z., Yang, L. Merchant. J. 2000. Global Land Cover Characteristics Database (GLCCD) Version<br />
2.0. Available online at: http://edcdaac.usgs.gov/glcc/globdoc2_0.html.<br />
Forest Certification and Protection<br />
The Forest Stewardship Council (FSC) certifies forests and plantations in accordance with the ten FSC principles and criteria. Groups around the world are<br />
accredited by the FSC to act as independent certification bodies.<br />
Full certification of forest <strong>pro</strong>ducts involves two steps. First, an assessment of forest management is made at the site to ensure that management practices will<br />
sustain the resource and <strong>pro</strong>vide environmental goods and services. Second, chain of custody is traced from forest, to <strong>pro</strong>cessor, to distributors, to the final<br />
consumer to ensure that only wood from the certified forests are being sold and delivered as FSC-certified. Many companies that have certified forests also<br />
possess certified mills and are distributors of certified wood as well. According to the FSC, all forest <strong>pro</strong>ducts carrying their logo have been independently<br />
certified as coming from forests that meet the FSC Principles and Criteria of Forest Stewardship.<br />
Certified forests are categorized as natural forests, plantations, or mixed.<br />
Natural forests are those where most of the principal characteristics and key elements of the native ecosystems, such as complexity, structure and diversity<br />
are present.<br />
Plantations are areas which result from the human activities of planting, sowing or intensive silvicultural treatments, and lack most of the principal<br />
characteristics and key elements of native ecosystems. According to FSC, certified plantations should decrease the pressures on natural forests, have diversity<br />
in composition in species and age classes, preferentially choose native over exotic species, serve to im<strong>pro</strong>ve soil function, fertility and structure, and have some<br />
<strong>pro</strong>portion of their area managed for the restoration of natural forest cover.<br />
Mixed natural forest and plantations include large areas certified as one block that contains both natural forests and plantations. Semi-natural areas are<br />
forests that have some elements of both natural forests and plantations.<br />
View full technical notes on-line at http://earthtrends.wri.org/searchable_db/variablenotes_static.cfmvarid=308&theme=9<br />
Percent of forests <strong>pro</strong>tected. Forest estimates were calculated by WCMC by compiling many national and regional data showing forest extent. The<br />
legends of these maps were harmonized into 15 different tropical and 11 non-tropical forest types for the globe, defined specifically for this study. Percent<br />
<strong>pro</strong>tected includes forest areas that fall within the <strong>pro</strong>tected areas in the world that are listed by IUCN - World Conservation Union as being within their<br />
management categories I-VI.<br />
© EarthTrends 2003. All rights reserved. Fair use is permitted on a limited scale and for educational purposes. page 5
The forest type categories were split between "tropical" and non-tropical." Tropical forests included all forests located between the Tropics of Cancer and<br />
Capricorn. All other forests were put into the non-tropical categories. Sparse trees and parkland are natural forests in which the tree canopy cover is between<br />
10-30%, such as in the savannah and steppe regions of the world.<br />
View full technical notes on-line at http://earthtrends.wri.org/searchable_db/variablenotes_static.cfmvarid=318&theme=9<br />
Number of tree species threatened includes full species that are categorized by IUCN as being critically endangered, endangered, or vulnerable. Data are<br />
from The World List of Threatened Trees, presenting the results of the first survey of the conservation status of trees species worldwide. Figures are not<br />
necessarily comparable among countries because taxonomic concepts and the extent of knowledge vary. Some taxonomic groups of trees were not<br />
evaluated, including tree ferns in the families Cyatheaceae and Dicksoniaceae, tree species in the cycad families Cycadaceae and Zamiaceae, and arborescent<br />
members of the Cactaceae family.<br />
View full technical notes on-line at http://earthtrends.wri.org/searchable_db/variablenotes_static.cfmvarid=149&theme=9<br />
Sources<br />
Forest Stewardship Council (FSC). 1998, 1999, 2000, 2002. Forests Certified by FSC-Accredited Certification Bodies. Document 5.3.3. Oaxaca, Mexico, FSC.<br />
Available online at: http://www.fscoax.org/principal.htm.<br />
Iremonger, S., C. Ravilious, T. Quinton. 1997 "A statistical analysis of global forest conservation." In A Global Overview of Forest Conservation CD-ROM.<br />
Cambridge, U.K.: World Conservation Monitoring Centre (WCMC) and Centre for International Forestry Research.<br />
S. Oldfield, C. Lusty and A. MacKinven (eds.). 1998. Tree Conservation Database. From The World List of Threatened Trees. Cambridge, U.K.: World<br />
Conservation Monitoring Centre (WCMC) and The World Conservation Union (IUCN). Available on-line at<br />
http://www.wcmc.org.uk/trees/Background/<strong>country</strong>_stats.htm<br />
Wood Production and Trade<br />
FAO compiles forest <strong>pro</strong>ducts data from responses to annual questionnaires sent to national governments. Data from other sources, such as national<br />
statistical yearbooks, are also used. In some cases, FAO prepares its own estimates.<br />
Roundwood <strong>pro</strong>duction refers to all wood in the rough, whether destined for industrial or fuelwood uses. All wood felled or harvested from forests and<br />
trees outside the forest, with or without bark, round, split, roughly squared, or in other forms such as roots and stumps, is included. Wood that is harvested<br />
for charcoal <strong>pro</strong>duction is also included. All wood <strong>pro</strong>duction data refer to both coniferous and nonconiferous species.<br />
View full technical notes on-line at http://earthtrends.wri.org/searchable_db/variablenotes_static.cfmvarid=326&theme=9<br />
Wood fuel <strong>pro</strong>duction refers to all roundwood used as fuel for purposes such as cooking, heating, or power <strong>pro</strong>duction. It includes wood harvested from<br />
main stems, branches and other parts of trees. It also includes wood intended for charcoal <strong>pro</strong>duction (e.g., pit kilns, and portable ovens). FAO data include<br />
only wood from direct sources such as natural forests, plantations, and other wooded land, such as homesteads and roadsides. FAO data do not currently<br />
include wood fuel from indirect sources such as industrial by-<strong>pro</strong>ducts derived from primary and secondary wood industries, recovered sources (wood waste<br />
from construction sites demolition, packaging etc.), and black liquor (derived from by-<strong>pro</strong>ducts of the pulp industry). FAO wood fuel estimates are partly<br />
based on household consumption surveys dating from the 1960s and per capita consumption estimates from the 1980s. Estimates are updated in line with<br />
population growth.<br />
View full technical notes on-line at http://earthtrends.wri.org/searchable_db/variablenotes_static.cfmvarid=327&theme=9<br />
© EarthTrends 2003. All rights reserved. Fair use is permitted on a limited scale and for educational purposes. page 6
Industrial roundwood <strong>pro</strong>duction comprises all roundwood <strong>pro</strong>ducts other than fuelwood and charcoal. It includes sawlogs or veneer logs, posts,<br />
pit<strong>pro</strong>ps, pulpwood, and other roundwood industrial <strong>pro</strong>ducts. All wood <strong>pro</strong>duction data refer to both coniferous and nonconiferous species..<br />
View full technical notes on-line at http://earthtrends.wri.org/searchable_db/variablenotes_static.cfmvarid=328&theme=9<br />
Wood-based panel <strong>pro</strong>duction includes the following commodities: veneer sheets, plywood, particle board, and compressed or non-compressed<br />
fiberboard. All wood <strong>pro</strong>duction data refer to both coniferous and nonconiferous species.<br />
View full technical notes on-line at http://earthtrends.wri.org/searchable_db/variablenotes_static.cfmvarid=330&theme=9<br />
Paper and paperboard <strong>pro</strong>duction is the amount of primary paper and paperboard <strong>pro</strong>duced, even though a portion of it may immediately be consumed<br />
in the <strong>pro</strong>duction of another <strong>pro</strong>duct. Paper and paperboard includes newsprint, printing and writing paper, packaging paper, household and sanitary paper,<br />
and other paper and paperboard. All <strong>pro</strong>duction data refer to both coniferous and non-coniferous species.<br />
View full technical notes on-line at http://earthtrends.wri.org/searchable_db/variablenotes_static.cfmvarid=570&theme=9<br />
Recovered paper <strong>pro</strong>duction describes the amount of waste and scrap of paper or paperboard <strong>pro</strong>duced in a given <strong>country</strong> in a given year. This<br />
commodity includes paper and paperboard which has been used for its original purpose and residues from paper conversion, including waste and scrap<br />
collected for re-use as a raw material for the manufacture of paper and related <strong>pro</strong>ducts. These definitions follow those contained in Classification and<br />
Definitions of Forest Products, FAO, Rome, 1982.<br />
View full technical notes on-line at http://earthtrends.wri.org/searchable_db/variablenotes_static.cfmvarid=585&theme=9<br />
Average value of trade in forest <strong>pro</strong>ducts include imports and exports in industrial roundwood, wood fuel, sawnwood, wood-based panels, pulp, paper<br />
and paperboard, recovered paper, chips and particles, and wood residues. Figures are national totals in millions of US dollars. Imports and exports are usually<br />
on a cost, insurance, and freight basis (c.f.i.) (i.e., insurance and freight costs added in). "In-transit" shipments are excluded wherever possible.<br />
View full technical notes on-line at http://earthtrends.wri.org/searchable_db/variablenotes_static.cfmvarid=337&theme=9<br />
Forest <strong>pro</strong>ducts exports as a percent of the total value of all exports is calculated by dividing the total value of forest <strong>pro</strong>ducts exports by a <strong>country</strong>'s<br />
total exports of goods and services. Exports of goods and services represent the value of all goods and other market services <strong>pro</strong>vided to the rest of the<br />
world. They include the value of merchandise, freight, insurance, transport, travel, royalties, license fees, and other services, such as communication,<br />
construction, financial, information, business, personal, and government services. They exclude labor and <strong>pro</strong>perty income (formerly called factor services) as<br />
well as transfer payments.<br />
Sources<br />
Development Data Group, The World Bank. 2002. World Development Indicators 2002 online (see<br />
http://publications.worldbank.org/ecommerce/catalog/<strong>pro</strong>ductitem_id=631625) Washington, D.C.: The World Bank.<br />
Food and Agriculture Organization of the United Nations (FAO). 2002. FAOSTAT on-line statistical service. Available on-line at http://apps.fao.org. Rome:<br />
FAO.<br />
© EarthTrends 2003. All rights reserved. Fair use is permitted on a limited scale and for educational purposes. page 7
Agriculture and Food-- <strong>Tanzania</strong><br />
EarthTrends<br />
Country Profiles<br />
Agricultural Production and Yields<br />
<strong>Tanzania</strong><br />
Sub-Saharan<br />
<strong>Africa</strong> World<br />
Cereals, 1999-2001<br />
Average <strong>pro</strong>duction (000 metric tons) 3,787 87,715 2,075,387<br />
Percent change since 1979-81 26% 54% 32%<br />
Per capita <strong>pro</strong>duction (tons per person) 108 135 343<br />
Percent change since 1979-81 -32% -11% -4%<br />
Average crop yield (kg per ha) 1,273 1,221 3,096<br />
Percent change since 1979-81 20% 9% 41%<br />
Roots and tubers 1996-1998<br />
Average <strong>pro</strong>duction (000 metric tons) 6,603 132,744 638,438<br />
Average crop yield (kg per ha) 7,436 7,694 12,958<br />
Pulses, 1996-1998<br />
Average <strong>pro</strong>duction (000 metric tons) 421 6,499 55,469<br />
Average crop yield (kg per ha) 540 481 808<br />
Meat, 1999-2001<br />
Average <strong>pro</strong>duction (000 metric tons) 325 8,124 233,218<br />
Percent change since 1979-81 76% 49% 71%<br />
Agricultural Land,<br />
Total cropland (000 ha), 1999 4,650 173,572 1,501,452<br />
Hectares of cropland per 1,000 population,<br />
1999 136 274 251<br />
Arable & permanent cropland as a percent of<br />
total land area, 1998 4.9% 7.1% 11.3%<br />
Percent of cropland that is irrigated, 1999 3.3% 3.8% 18.3%<br />
Agricultural Inputs<br />
Average annual fertilizer use, 1999<br />
Total (thousand metric tons) 21 2,124 141,360<br />
Intensity (kg per hectare cropland) 5 12 94<br />
Pesticide use, 1994-1996 (kg/ha cropland) {c} X X X<br />
Number of tractors, 1997 7,600 261,984 26,334,690<br />
Agricultural workers as a percentage of the<br />
total labor force, 1990 84.4% X X<br />
Percent of GDP generated from agricultural<br />
activities, 2000 45.1% 16.7% 5.0%<br />
Index (1989=100)<br />
metric tons per hectare<br />
Kg per Hectare<br />
12<br />
10<br />
120<br />
100<br />
8<br />
6<br />
4<br />
2<br />
0<br />
80<br />
60<br />
40<br />
20<br />
0<br />
Index of Total and Per Capita Food Production,<br />
<strong>Tanzania</strong>, 1961-1998<br />
1960 1970 1980 1990 2000<br />
Total Per Capita<br />
Yields of Cereals, Roots and Tubers, and Pulses,<br />
<strong>Tanzania</strong>, 1961-1998<br />
1960 1970 1980 1990 2000<br />
80<br />
60<br />
40<br />
20<br />
0<br />
Cereals Roots & Tubers Pulses<br />
Fertilizer Consumption per Hectare of Cropland, <strong>Tanzania</strong>,<br />
1961-1998<br />
1960 1970 1980 1990 2000 2010<br />
View more Country Profiles on-line at http://earthtrends.wri.org<br />
© EarthTrends 2003. All rights reserved. Fair use is permitted on a limited scale and for educational purposes. page 1
Agriculture and Food-- <strong>Tanzania</strong><br />
<strong>Tanzania</strong><br />
Sub-Saharan<br />
<strong>Africa</strong> World<br />
Food Security<br />
Variation in domestic cereal <strong>pro</strong>duction, 1992-2001<br />
(average percent variation from mean) 9.2% 6.5% 3.5%<br />
Net cereal imports and food aid as a percent<br />
of total consumption {b}, 1998-2000 11.0% 13.5% X<br />
Food aid as a percent of total imports,<br />
1998-2000 10.6% 19.9% X<br />
Average daily per capita calorie supply,<br />
1999 (kilocalories) 1,940 2,238 2,808<br />
Average daily per capita calories from<br />
animal <strong>pro</strong>ducts, 1999 (kilocalories) 125 152 460<br />
Percent of children that are underweight,<br />
1995-2000 {c} 29.0% 30.0% 27.0%<br />
Net Cereal Imports and Food Aid as a<br />
Percent of Total Cereal Consumption,<br />
<strong>Tanzania</strong>, 1961-1998<br />
89%<br />
11%<br />
Other Resources:<br />
Country Profiles of the Food and Agriculture Organization<br />
of the United Nations, Agriculture Sector:<br />
http://www.fao.org/<strong>country</strong><strong>pro</strong>files/index.aspsubj=4&iso3=ALB<br />
Imports and Food Aid<br />
Domestic Production<br />
Footnotes:<br />
a. The index of agricultural <strong>pro</strong>duction is a ratio of <strong>country</strong>'s net agricultural output in 1996-98 relative to the base period 1989--91. This ratio is then<br />
multipled by 100 to obtain an index number.<br />
b. Negative values, indicating a net export of grain, are not shown. Cereal consumption is defined as <strong>pro</strong>duction plus imports minus exports.<br />
c. Data are for the most recent year available within the given time range.<br />
View more Country Profiles on-line at http://earthtrends.wri.org<br />
© EarthTrends 2003. All rights reserved. Fair use is permitted on a limited scale and for educational purposes. page 2
Agriculture and Food—Sources and Definitions<br />
Agricultural Production and Yields<br />
Production includes the quantities of a commodity sold in the market (marketed <strong>pro</strong>duction) and the quantities consumed or used by <strong>pro</strong>ducers (autoconsumption).<br />
Harvesting losses, threshing losses, and unharvested portions of the crop are not included. The time reference on crop <strong>pro</strong>duction is based on<br />
the calendar year; data for any particular crop are reported under the calendar year in which the entire harvest or the bulk of it took place. In a number of<br />
cases, crops assigned by countries to a particular split year may appear under two different calendar years.<br />
Average <strong>pro</strong>duction of cereals refer to the amount of cereals <strong>pro</strong>duced in a given <strong>country</strong> or region each year. Cereals include wheat, barley, maize, rye,<br />
oats, millet, sorghum, rice, buckwheat, alpiste/canary seed, fonio, quinoa, triticale, wheat flour, and the cereal component of blended foods. Data relate to<br />
crops harvested for dry grain only. Mixed grains and buckwheat are included, although the following cereals are excluded: crops harvested for hay, crops<br />
used for grazing, and crops harvested green for food, feed or silage.<br />
Per capita <strong>pro</strong>duction of cereals is calculated using national population data for the year specified.<br />
View full technical notes on-line at http://earthtrends.wri.org/searchable_db/variablenotes_static.cfmvarid=183&themeid=8<br />
Average cereal crop yields refer to the amount of grain <strong>pro</strong>duced per unit of harvested area of cereals in a given <strong>country</strong> or region each year (i.e. average<br />
yield=total <strong>pro</strong>duction/harvested area). For cereal crop yields, area data relate to harvested area. Some countries report sown or cultivated area only;<br />
however, in these countries the sown or cultivated area does not differ significantly in normal years from the area actually harvested, either because<br />
practically the whole area sown is harvested or because the area surveys are conducted around the harvest period. For most countries, FAO does not directly<br />
record yield data but instead divides <strong>pro</strong>duction data by the area harvested for a particular <strong>country</strong> and year. In all cases, yields are computed from detailed<br />
area and <strong>pro</strong>duction data expressed in hectares and metric tons.<br />
View full technical notes on-line at http://earthtrends.wri.org/searchable_db/variablenotes_static.cfmvarid=185&themeid=8<br />
Average <strong>pro</strong>duction and yield of roots and tubers covers all root crops grown principally for human consumption, such as cassava, yucca, taro, and<br />
yams; root crops grown principally for feed are excluded. See <strong>pro</strong>duction of cereals, cereal crop yields, and the introductory paragraph above for more<br />
information.<br />
View full technical notes on-line at http://earthtrends.wri.org/searchable_db/variablenotes_static.cfmvarid=182&themeid=8<br />
Average <strong>pro</strong>duction and yield of pulses includes those harvested for dry harvest only, such as lentils, pigeon peas, cowpeas, and vetches, and does not<br />
exclude those used for feed. See <strong>pro</strong>duction of cereals, cereal crop yields, and the introductory paragraph above for more information.<br />
View full technical notes on-line at http://earthtrends.wri.org/searchable_db/variablenotes_static.cfmvarid=188&themeid=8<br />
Average annual meat <strong>pro</strong>duction refers to the mass of meat in metric tons <strong>pro</strong>duced annually in a given <strong>country</strong>. Total meat <strong>pro</strong>duction comprises horse<br />
meat, poultry meat and meat from all other domestic or wild animals such as camels, rabbits, reindeer and game animals. Both commercial and farm<br />
slaughter are included. Meat <strong>pro</strong>duction for most species is calculated from multiplying the number of animals slaughtered by the average dressed carcass<br />
weight. Dressed carcass weights exclude offal and slaughter fats. Data relate to animals slaughtered within national boundaries, irrespective of their origin.<br />
Production data were collected mostly through annual FAO surveys to governments. Data have been grouped in 12 month periods ending 30 September of<br />
the years stated in the tables. For example, animals enumerated in a given <strong>country</strong> at any time between 1 October 1999 and 30 September 2000 are shown<br />
under the year 2000.<br />
View full technical notes on-line at http://earthtrends.wri.org/searchable_db/variablenotes_static.cfmvarid=190&themeid=8<br />
© EarthTrends 2003. All rights reserved. Fair use is permitted on a limited scale and for educational purposes. page 3
Sources<br />
Food and Agriculture Organization of the United Nations (FAO). 2002. FAOSTAT on-line statistical service. Rome: FAO. Available on-line at<br />
http://apps.fao.org.<br />
Population Data (for per capita calculations): Population Division of the Department of Economic and Social Affairs of the United Nations Secretariat. 2002.<br />
World Population Prospects: The 2000 Revision. New York: United Nations. Data set on CD-ROM.<br />
Agricultural Land and Inputs<br />
Total cropland is comprised of both arable and permanent land in a given <strong>country</strong> for each year. Arable land is land under temporary crops (doublecropped<br />
areas are counted only once), temporary meadows for mowing or pasture, land under market and kitchen gardens, and land fallow for less than five<br />
years. The abandoned land resulting from shifting cultivation is not included in this category. Data for “Arable land” are not meant to indicate the amount<br />
of land that is potentially cultivable. Permanent Crops is land cultivated with crops that occupy the land for long periods and need not be replanted after<br />
each harvest, such as cocoa, coffee and rubber; this category includes land under flowering shrubs, fruit trees, nut trees and vines, but excludes land under<br />
trees grown for wood or timber.<br />
Hectares of cropland per 1,000 population is calculated using national population data for the year specified.<br />
View full technical notes on-line at http://earthtrends.wri.org/searchable_db/variablenotes_static.cfmvarid=194&themeid=8<br />
Arable and Permanent Cropland as a Percent of Total Land area is calculated by dividing total cropland (above) by total land area for a given <strong>country</strong>.<br />
According to FAO, the total area of the <strong>country</strong> includes the area under inland water bodies. Theses data are reported to FAO by United Nations Statistical<br />
Division. Possible variations in the data may be due to updating and revisions of <strong>country</strong> data and not necessarily to any change of area.<br />
View full technical notes on-line at http://earthtrends.wri.org/searchable_db/variablenotes_static.cfmvarid=194&themeid=8<br />
Percentage of cropland that is irrigated is calculated by dividing irrigated land by total cropland (above) for a given <strong>country</strong>. Irrigated land refers to the<br />
area of land with access to irrigation in a given <strong>country</strong> each year. These data refer to, in thousands of hectares, the area of land in a given <strong>country</strong> which is<br />
equipped to <strong>pro</strong>vide water to crops. These include areas equipped for full and partial control irrigation, spate irrigation areas, and equipped wetland or<br />
inland valley bottoms.<br />
View full technical notes on-line at http://earthtrends.wri.org/searchable_db/variablenotes_static.cfmvarid=195&themeid=8<br />
Average annual fertilizer use is the use in metric tons of the nutrients nitrogen (N), potash (K2O), and phosphate (P2O5). Data refer to the fertilizer year 1<br />
July - 30 June. For countries that report their fertilizer statistics on a calendar-year basis, data are shown under the fertilizer year that begins in that calendar<br />
year; for example, 1991 data are under the fertilizer year starting on 1 July 1991. Data is collected through the FAO fertilizer questionnaire.<br />
Fertilizer Intensity is calculated by fertilizer use by total cropland (above) for a given <strong>country</strong>.<br />
View full technical notes on-line at http://earthtrends.wri.org/searchable_db/variablenotes_static.cfmvarid=196&themeid=8<br />
Pesticide Use includes quantities of pesticides used in (or sold to) the agricultural sector. Figures are generally expressed in terms of active ingredients.<br />
Pesticides include: insecticides, mineral oils, herbicides, fungicides and bactericides, seed treatment fungicides and insecticides, plant growth regulators, and<br />
rodenticides. A strict inter-<strong>country</strong> comparison on the basis of the database is not feasible because (1) The <strong>country</strong> coverage and time series are incomplete<br />
due to a high rate of non-response, and (2) Although countries have been requested to report data in terms of active ingredients, some countries may have<br />
reported in formulation weight (including diluents and adjuvants) without specific indication.<br />
Number of Tractors generally refer to wheeled and crawler tractors used in agriculture. Garden tractors are excluded.<br />
© EarthTrends 2003. All rights reserved. Fair use is permitted on a limited scale and for educational purposes. page 4
Agricultural workers as a percentage of the total labor force is the <strong>pro</strong>portion of the total labor force recorded as working in agriculture, hunting,<br />
forestry, and fishing. Labor force comprises all people who meet the International Labour Organization's definition of the economically active population.<br />
View full technical notes on-line at http://earthtrends.wri.org/searchable_db/variablenotes_static.cfmvarid=205&themeid=8<br />
Percent of GDP generated from agricultural activities measures the percent of total output of goods and services which are a result of value added by<br />
the agriculture sector. These goods and services are for final use occurring within the domestic territory of a given <strong>country</strong>, regardless of the allocation to<br />
domestic and foreign claims. The industrial origin of value added is determined by the International Standard Industrial Classification (ISIC) revision 3.<br />
Agriculture corresponds to ISIC divisions 1-5 and includes forestry and fishing. Agricultural <strong>pro</strong>duction often must be estimated indirectly, using a<br />
combination of methods involving estimates of inputs, yields, and area under cultivation. This ap<strong>pro</strong>ach sometimes leads to crude ap<strong>pro</strong>ximations that can<br />
differ from the true values over time and across crops for reasons other than climatic conditions or farming techniques. Similarly, agricultural inputs that<br />
cannot easily be allocated to specific outputs are frequently "netted out" using equally crude and ad hoc ap<strong>pro</strong>ximations.<br />
View full technical notes on-line at http://earthtrends.wri.org/searchable_db/variablenotes_static.cfmvarid=214&themeid=8<br />
Sources<br />
Food and Agriculture Organization of the United Nations (FAO). 2002. FAOSTAT on-line statistical service. Rome: FAO. Available on-line at<br />
http://apps.fao.org.<br />
Development Data Group, The World Bank. 2002. World Development Indicators 2002 online (see<br />
http://publications.worldbank.org/ecommerce/catalog/<strong>pro</strong>ductitem_id=631625). Washington, D.C.: The World Bank.<br />
Food Security<br />
Variation in domestic cereal <strong>pro</strong>duction is found by taking the average variation (absolute deviation from mean) of cereal <strong>pro</strong>duction between 1992 and<br />
2001 and dividing this by the mean <strong>pro</strong>duction. This is an indicator of whether cereal <strong>pro</strong>duction is stable enough to ensure a predictable food supply. Please<br />
refer to the definition above for more information on cereal <strong>pro</strong>duction.<br />
Net cereal imports and food aid as a percent of total consumption indicates whether countries are able to <strong>pro</strong>duce sufficient grain for domestic<br />
consumption. It is calculated by dividing net imports (imports minus exports) by total cereal consumption (<strong>pro</strong>duction + imports – exports).<br />
Food Aid as a Percent of Total Imports is calculated by dividing total food aid by net cereal imports (imports minus exports).<br />
Import and export data have, for the most part, been supplied to FAO by governments through magnetic tapes, national publications and, most frequently,<br />
FAO questionnaires. Official trade data have sometimes been supplemented with data from unofficial sources or trade information supplied by other national<br />
or international agencies or organizations. Cereal food aid shipments are included in FAO's import and export calculations. Information on food aid<br />
shipments has been <strong>pro</strong>vided to FAO by the World Food Program (please see http://www.wfp.org). Donors that have <strong>pro</strong>vided food aid in very small<br />
quantities or at irregular intervals are not listed individually.<br />
View full technical notes on-line at http://earthtrends.wri.org/searchable_db/variablenotes_static.cfmvarid=210&themeid=8<br />
Average Daily Per Capita Calorie supply refers to the amount of available food per person, per day, expressed in kilocalories (1 kilocalorie = 1 Calorie =<br />
4.19 kilojoules).<br />
View full technical notes on-line at http://earthtrends.wri.org/searchable_db/variablenotes_static.cfmvarid=212&themeid=8<br />
Calorie supply from animal <strong>pro</strong>ducts refers to the amount of available food from animal <strong>pro</strong>ducts per person, per day. Animal <strong>pro</strong>ducts include: all types<br />
of meat and fish; animal fats and fish oils; edible offal; milk, butter, cheese and cream; and eggs and egg <strong>pro</strong>ducts.<br />
View full technical notes on-line at http://earthtrends.wri.org/searchable_db/variablenotes_static.cfmvarid=295&themeid=8<br />
FAO compiles statistics on apparent food consumption based on Supply/Utilization Accounts (SUAs) maintained in FAOSTAT. SUAs are time series data<br />
dealing with statistics on supply and utilization. For each <strong>pro</strong>duct, the SUA traces supplies from <strong>pro</strong>duction, imports and stocks to its utilization in different<br />
© EarthTrends 2003. All rights reserved. Fair use is permitted on a limited scale and for educational purposes. page 5
forms—addition to stocks, exports, animal feed, seed, <strong>pro</strong>cessing for food and non-food purposes, waste (or losses), and lastly, as food available to the<br />
population, where ap<strong>pro</strong>priate. For internal consistency, total supply balances with total utilization. In many cases commodities are not consumed in the<br />
primary form in which they are presented, e.g. cereals enter the household mainly in <strong>pro</strong>cessed form like flour, meal, husked or milled rice. To take this fact<br />
into account, the caloric value has been derived by applying the ap<strong>pro</strong>priate food composition factors to the quantities of the <strong>pro</strong>cessed commodities, not by<br />
examining primary commodities. Per capita supplies are derived from the total supplies available for human consumption by dividing the quantities of food<br />
by the total population actually partaking of the food supplies during the reference period. In almost all cases, the population figures used are the mid-year<br />
estimates published by the United Nationals Population Division.<br />
Percent of Children that are Underweight refers to children under 5 whose weight-for-age is below minus 2 standard deviations (for moderate<br />
underweight) or below minus 3 standard deviations (for severe underweight) from the median weight-for-age of a reference population. The above data<br />
include both moderately and severely underweight children. Multiple Indicator Cluster Surveys (MICS), developed by UNICEF with partners in 1997, were used<br />
by 66 government ministries to collect the data presented. Demographic and Health Surveys (DHS) <strong>pro</strong>vided relevant data to UNICEF for more than 35<br />
additional countries. For more information, please consult the website maintained by DHS at http://www.measuredhs.com. Official national level government<br />
data <strong>pro</strong>vide data for the majority of remaining countries. Where no reliable official figures exist, estimates have been made by UNICEF. The various data<br />
sources dictate that the data inevitably cover a wide range of quality; where possible, only comprehensive or representative national data have been used.<br />
Sources<br />
Food and Agriculture Organization of the United Nations (FAO). 2002. FAOSTAT on-line statistical service. Rome: FAO. Available on-line at<br />
http://apps.fao.org.<br />
United Nation's Children's Fund (UNICEF). 2001. State of the World's Children 2002. New York: UNICEF. Data available on-line at<br />
http://www.unicef.org/sowc02/.<br />
© EarthTrends 2003. All rights reserved. Fair use is permitted on a limited scale and for educational purposes. page 6
Coastal and Marine Ecosystems-- <strong>Tanzania</strong><br />
Coastal Statistics, 2000<br />
<strong>Tanzania</strong><br />
Sub-<br />
Saharan<br />
<strong>Africa</strong> World<br />
Length of coastline {a} (km) 3,461 63,124 1,634,701<br />
Percent of population within 100 km<br />
of the coast 21% X 39%<br />
Area of continental shelf (km2) {b} 17,903 987,021 24,285,959<br />
Territorial sea (up to 12 nautical miles) (km2) 36,578 871,895 18,816,919<br />
Claimed Exclusive Economic Zone (km2) 204,294 7,866,074 102,108,403<br />
Coastal Biodiversity and Protected Areas Data, 1990s<br />
Area of Mangrove Forests (km2) 3,233 38,013 169,452<br />
Percent of Mangrove forests <strong>pro</strong>tected 0% 1% 13%<br />
Number of Mangrove Species 10 17 70<br />
Number of Seagrass Species 7 15 58<br />
Number of Scleractinia Coral Genera {c} 57 68 X<br />
International Legal Net Trade in Live Coral,<br />
1997 (number of pieces) {d} X -202 X<br />
Number of Marine or Littoral Protected 9 150 3,636<br />
Areas, 1999<br />
Wetlands of International Importance,<br />
Extent (km2), 2000 X 143,481 730,116<br />
thousand metric tons<br />
70<br />
60<br />
50<br />
40<br />
30<br />
20<br />
10<br />
0<br />
no available data<br />
EarthTrends<br />
Country Profiles<br />
Average Annual Capture of Marine Fish, <strong>Tanzania</strong><br />
1965 1970 1975 1980 1985 1990 1995 2000<br />
Total Aquaculture Production, <strong>Tanzania</strong>, 1984-2001<br />
Fisheries Production<br />
Average Annual Capture<br />
(excludes aquaculture) in metric tons:<br />
Marine Fish, 2000 52,407 X 84,411,066<br />
Mulluscs and Crustaceans, 1997 3,153 140,424 12,055,801<br />
Aquaculture Production (in metric tons):<br />
Total (includes freshwater), 2000 7,210 55,520 45,715,559<br />
Marine and Diadromous Fish, 1997 X 1,202 2,623,888<br />
Mulluscs and Crustaceans, 1997 X 6,299 9,889,688<br />
Aquatic Plants, 1997 3,000 3,095 7,241,754<br />
Fish Consumption and Trade, 2000<br />
Per Capita Food Supply from Fish and<br />
Fishery Products (kg/person) 8 8 16<br />
thousand metric tons<br />
8<br />
7<br />
6<br />
5<br />
4<br />
3<br />
2<br />
1<br />
0<br />
no available data<br />
Freshwater<br />
Aquatic<br />
Plants<br />
Crustaceans<br />
Molluscs<br />
Marine Fish<br />
Diadromous<br />
Fish<br />
View more Country Profiles on-line at http://earthtrends.wri.org<br />
© EarthTrends 2003. All rights reserved. Fair use is permitted on a limited scale and for educational purposes. page 1
Coastal and Marine Ecosystems-- <strong>Tanzania</strong><br />
<strong>Tanzania</strong><br />
Sub-<br />
Saharan<br />
<strong>Africa</strong> World<br />
Fish Consumption and Trade, 2000 (cont'd)<br />
Fish Protein as a % of Total Protein Supply 6% 6% 6%<br />
Annual Trade in Fish and Fisheries Products<br />
Imports (thousand $US) 680 778,886 60,008,337<br />
percent change since 1980 -54% -3% 275%<br />
Exports (thousand $US) 58,069 1,642,028 54,570,489<br />
percent change since 1980 14098% X 258%<br />
Fishing Effort, both freshwater and marine<br />
People Employed in Fishing and 92,529 1,995,694 36,116,329<br />
Aquaculture, 2000 (number)<br />
Docked Fishery Vessels, 1995-98 (number) {e} 17 X 1,297,017<br />
Other Resources:<br />
Country Profiles of the Food and Agriculture Organization<br />
of the United Nations' Fishery Sector:<br />
http://www.fao.org/fi/fcp/en/TZA/<strong>pro</strong>file.htm<br />
million U.S. dollars<br />
Trade in Fish and Fisheries Products, <strong>Tanzania</strong>, 1980-2000<br />
70<br />
60<br />
no available data<br />
50<br />
40<br />
30<br />
20<br />
10<br />
0<br />
1980 1990 2000<br />
Exports<br />
Imports<br />
Footnotes:<br />
Some footnotes are not incorporated here. Please refer to the Data Tables section of EarthTrends for a full listing.<br />
a. Figures should be interpreted as ap<strong>pro</strong>ximations. Estimates may differ from other published sources<br />
b. Up to 200 meters depth c. Reef forming corals (i.e. "true" or stony corals).<br />
d. Imports - exports = net trade. E. Data are for the most recent available year in the listed range of years.<br />
View more Country Profiles on-line at http://earthtrends.wri.org<br />
© EarthTrends 2003. All rights reserved. Fair use is permitted on a limited scale and for educational purposes. page 2
Coastal and Marine Ecosystems—Sources and Definitions<br />
Coastal Statistics<br />
Length of Coastline was derived from the World Vector Shoreline database of the United States Mapping Agency. The estimates presented here were<br />
calculated using a Geographic Information System (GIS) with a resolution of 1:250,000 kilometers and an underlying database consistent for the entire<br />
world. In general, the coastline length of islands that are part of a <strong>country</strong>, but are not overseas territories, are included in the coastline estimate for that<br />
<strong>country</strong> (i.e., Canary Islands are included in Spain).<br />
View full technical notes on-line at http://earthtrends.wri.org/searchable_db/variablenotes_static.cfmvarid=61&theme=1<br />
Percent of Population within 100 km of Coast. Estimates were based on 1995 population figures. The Gridded Population of the World is a raster data set<br />
that <strong>pro</strong>vides information on the spatial distribution of the world's human population. The grid cells are ap<strong>pro</strong>ximately 4.6 km on each side. Populations are<br />
distributed according to administrative districts which vary in scale, level and size from <strong>country</strong> to <strong>country</strong>. A 100 km coastal buffer with a 10 km 'safe area'<br />
falling into the sea were used in the geographic information system to calculate the number of people in the coastal zone for each <strong>country</strong> individually.<br />
View full technical notes on-line at http://earthtrends.wri.org/searchable_db/variablenotes_static.cfmvarid=63&theme=1<br />
Area of Continental Shelf. According to the UN Convention of the Law of the Sea, the Continental Shelf is the area of the seabed and subsoil which<br />
extends beyond the territorial sea to a distance of 200 nautical miles from the territorial sea baseline and beyond that distance to the outer edge of the<br />
continental margin. Coastal States have sovereign rights over the continental shelf (the national area of the seabed) for exploring and exploiting it; the shelf<br />
can extend at least 200 nautical miles from the shore, and more under specified circumstances.<br />
View full technical notes on-line at http://earthtrends.wri.org/searchable_db/variablenotes_static.cfmvarid=62&theme=1<br />
Territorial Sea is defined under the United Nations Convention on the Law of the Sea (UNCLOS) as the 12-nautical mile zone from the baseline or low-water<br />
line along the coast. The coastal State's sovereignty extends to the territorial sea, including its sea-bed, subsoil, and air space above it. Foreign vessels are<br />
allowed "innocent passage" through those waters. Even though the established limit for a territorial sea is 12 nautical miles, some countries claim larger<br />
areas.<br />
View full technical notes on-line at http://earthtrends.wri.org/searchable_db/variablenotes_static.cfmvarid=56&theme=1<br />
Claimed Exclusive Economic Zone . Under UNCLOS, coastal States can claim sovereign rights in a 200-nautical mile exclusive economic zone (EEZ). This<br />
allows for exploration, exploitation, conservation and management of all natural resources in the seabed, its subsoil and overlaying waters. UNCLOS allows<br />
other states to navigate and fly over the EEZ, as well as to lay submarine cables and pipelines. The inner limit of the EEZ starts at the outer boundary of the<br />
Territorial Sea (see above). Under UNCLOS, "land-locked and geographically disadvantaged States have the right to participate on an equitable basis in<br />
exploitation of an ap<strong>pro</strong>priate part of the surplus of the living resources of the EEZ's of coastal States of the same region or sub-region."<br />
View full technical notes on-line at http://earthtrends.wri.org/searchable_db/variablenotes_static.cfmvarid=58&theme=1<br />
Sources<br />
Center for International Earth Science Information Network (CIESIN), World Resources Institute, and International Food Policy Research Institute, "Gridded<br />
Population of the World, Version 2 alpha" (Columbia University, Palisades, NY, 2000) available at: http://sedac.ciesin.org/plue/gwp.<br />
Pruett, L. and Cimino, J. Unpublished data, Global Maritime Boundaries Database (GMBD), Veridian - MRJ Technology Solutions, (Fairfax, Virginia, January,<br />
2000).<br />
© EarthTrends 2003. All rights reserved. Fair use is permitted on a limited scale and for educational purposes. page 3
Coastal Biodiversity and Protected Areas Data<br />
Area of Mangrove Forests and Percent of Mangrove Forests Protected . Mangrove estimates were calculated by the World Conservation Monitoring<br />
Center (WCMC) by compiling many national and regional data showing forest extent. The legends of these maps were harmonized into 15 different tropical<br />
and 11 non-tropical forest types for the globe, defined specifically for this study. Percent <strong>pro</strong>tected includes forest areas that fall within the <strong>pro</strong>tected areas in<br />
the world that are listed by IUCN - World Conservation Union as being within their management categories I-VI.<br />
View full technical notes on-line at http://earthtrends.wri.org/searchable_db/variablenotes_static.cfmvarid=317&theme=1<br />
Number of Mangrove Species . Mangrove trees and shrubs, including ferns and palms, are found along river banks and coastlines in tropical and<br />
subtropical countries. Their main characteristic is that they can tolerate salt and brackish water environments. Original data on species richness was compiled<br />
by the World Conservation Monitoring Centre (WCMC) from a variety of sources including, governments, mapping agencies, non-governmental<br />
organizations, international agencies and scientists. The year and quality of the data vary from <strong>country</strong> to <strong>country</strong>, therefore figures are not strictly<br />
comparable between countries.<br />
View full technical notes on-line at http://earthtrends.wri.org/searchable_db/variablenotes_static.cfmvarid=65&theme=1<br />
Number of Seagrass Species . Seagrasses are marine angiosperms that live in seawater. They grow in soft substrates like sandy soils and form large<br />
underwater meadows in coastal regions of the world. The total number of seagrass species is low, but these plants <strong>pro</strong>vide habitat, breeding, and feeding<br />
grounds for many species of fish and shellfish. The year and quality of the data vary from <strong>country</strong> to <strong>country</strong>, therefore figures are not strictly comparable<br />
between countries.<br />
View full technical notes on-line at http://earthtrends.wri.org/searchable_db/variablenotes_static.cfmvarid=66&theme=1<br />
Number of Sceleractinia Coral Genera . Coral reefs are home to more than a quarter of all known marine fish species. In general coral reefs are found in<br />
shallow waters, between the Tropic of Capricorn and the Tropic of Cancer. Most reef-forming corals belong to the family Scleractinia, which are also called<br />
true or stony corals. They may be solitary or colonial and have a heavy external calcareous skeleton. The year and quality of the data vary from <strong>country</strong> to<br />
<strong>country</strong>, therefore figures are not strictly comparable between countries.<br />
View full technical notes on-line at http://earthtrends.wri.org/searchable_db/variablenotes_static.cfmvarid=67&theme=1<br />
International Legal Net Trade in Live Corals includes pieces of all coral species traded under the regulation of the Convention on International Trade in<br />
Endangered Species (CITES). Net trade is calculated as total imports minus total exports; a negative value means that a <strong>country</strong> or region exports more coral<br />
than they import. CITES monitors the trade in more than 2000 species of Coral. The typical size of live coral pieces in trade is 10 x 6 cm in cross section, 6cm<br />
in height and weighing about 200g. Species traded within national borders or illegal trade in wildlife and wildlife <strong>pro</strong>ducts are not reflected in these figures.<br />
Mortality of individuals during capture or collection, transit, or quarantine also are not reflected in these numbers.<br />
View full technical notes on-line at http://earthtrends.wri.org/searchable_db/variablenotes_static.cfmvarid=154&theme=1<br />
Number of Marine or Littoral Protected Areas . IUCN defines a 'marine <strong>pro</strong>tected area' as: "any area of intertidal or subtidal terrain, together with its<br />
overlying water and associated flora and fauna, historical and cultural features, which has been reserved by law or other effective means to <strong>pro</strong>tect part or all<br />
of the enclosed environment." "Marine" is defined as any site which is known to incorporate at least some subtidal area permanently submerged under the<br />
ocean. "Littoral" is defined as any site which is known to incorporate at least some intertidal area. The categories of marine and littoral are not exclusive.<br />
Many of these <strong>pro</strong>tected areas have a large terrestrial component. The degree of <strong>pro</strong>tection varies from one <strong>country</strong> to another.<br />
View full technical notes on-line at http://earthtrends.wri.org/searchable_db/variablenotes_static.cfmvarid=116&theme=1<br />
Wetlands of International Importance, Extent . The Convention on Wetlands of International Importance especially as Waterfowl Habitat, signed in<br />
Ramsar, Iran, 1971, is an intergovernmental treaty for the conservation and sustainable use of wetlands. When a <strong>country</strong> becomes a Party to the Convention,<br />
© EarthTrends 2003. All rights reserved. Fair use is permitted on a limited scale and for educational purposes. page 4
it agrees to designate at least one wetland for inclusion in the List of Wetlands of International Importance (the "Ramsar List") and to <strong>pro</strong>mote its<br />
conservation. In order for a site to qualify as a Ramsar site, it has to have "international significance in terms of ecology, botany, zoology, limnology or<br />
hydrology."<br />
View full technical notes on-line at http://earthtrends.wri.org/searchable_db/variablenotes_static.cfmvarid=720&theme=1<br />
Sources<br />
Convention on International Trade in Endangered Species of Wild Fauna and Flora (CITES) annual report data, World Conservation Monitoring Centre<br />
(WCMC) CITES Trade Database (WCMC, Cambridge, U.K., December, 1999).<br />
Iremonger, S., C. Ravilious, T. Quinton, "A statistical analysis of global forest conservation." In: S. Iremonger, C. Ravilious, and T. Quinton (Eds). "A Global<br />
Overview of Forest Conservation CD-ROM" (World Conservation Monitoring Centre (WCMC) and Centre for International Forestry Research,<br />
Cambridge, U.K., 1997).<br />
Protected Areas Database of the World Conservation Monitoring Centre (WCMC), unpublished data (WCMC, Cambridge, U.K., August, 1999).<br />
Ramsar Convention Bureau, Gland, Switzerland. Available on-line at: http://ramsar.org/sitelist.pdf<br />
Spalding, M., F. Blasco, and C. Field (Eds.). "World Mangrove Atlas", The International Society for Mangrove Ecosystems (ISME), Okinawa, Japan, 1997.<br />
World Conservation Monitoring Centre, unpublished data, WCMC, Cambridge, UK (August, 1999). The data presented here has been compiled by WCMC<br />
from different published sources.<br />
Fisheries Production, Consumption and Trade:<br />
Capture is defined by the Food and Agriculture Organization of the United Nations (FAO) as "the nominal catch of fish, crustaceans and molluscs, the<br />
<strong>pro</strong>duction of other aquatic animals, residues and plants and catches of aquatic mammals, taken for commercial, industrial, recreational and subsistence<br />
purposes from marine waters. " Statistics for aquaculture are not included in the capture totals. Production of fish, crustaceans and molluscs is expressed in<br />
live weight--the nominal weight of the aquatic organisms at the time of capture. Data include all quantities caught and landed for both food and feed<br />
purposes but exclude discards. Figures are national totals which include fish caught by a <strong>country</strong>'s fleet anywhere in the world.<br />
Marine Fish Captured include cods, hakes and haddocks; flounders, halibuts and soles; herrings, sardines and anchovies; jacks, mullets and sauries;<br />
redfishes, basses and congers; tunas, bonitos and billfishes; and miscellaneous marine fishes. Marine capture totals exclude freshwater species, brackishwater<br />
species, and harvest totals from mariculture and aquaculture.<br />
View full technical notes on-line at http://earthtrends.wri.org/searchable_db/variablenotes_static.cfmvarid=514&theme=1<br />
Mollusc and Crustacean Capture data refer to marine and inland waters molluscs and crustaceans caught or trapped. Crustaceans include freshwater<br />
crustaceans, sea-spiders, crabs, lobsters, shrimps, prawns, and miscellaneous marine crustaceans.<br />
View full technical notes on-line at http://earthtrends.wri.org/searchable_db/variablenotes_static.cfmvarid=40&theme=1<br />
Aqaculture is defined by FAO as "the farming of aquatic organisms, including fish, molluscs, crustaceans, and aquatic plants. Farming implies some form of<br />
intervention in the rearing <strong>pro</strong>cess to enhance peoduction, such as regular stocking, feeding, <strong>pro</strong>tection from predators, etc. [It] also implies ownership of the<br />
stock being cultivated." Aquatic organisms that are exploitable by the public as a common <strong>pro</strong>perty resource are included in the harvest of fisheries.<br />
Total aquaculture <strong>pro</strong>duction includes marine, freshwater, and diadromous fish, molluscs, crustaceans, cephalopods, miscellaneous aquatic animals, and<br />
aquatic plants cultivated in marine, inland or brackish environments.<br />
© EarthTrends 2003. All rights reserved. Fair use is permitted on a limited scale and for educational purposes. page 5
View full technical notes on-line at http://earthtrends.wri.org/searchable_db/variablenotes_static.cfmvarid=37&theme=1<br />
Marine and Diadromous Fish . Diadromous fish include sturgeons, paddlefishes, river eels, salmons, trouts, smelts, shads, and miscellaneous diadromous<br />
fishes. Marine Fish include cods, hakes and haddocks; flounders, halibuts and soles; herrings, sardines and anchovies; jacks, mullets and sauries; redfishes,<br />
basses and congers; tunas, bonitos and billfishes; and miscellaneous marine fishes.<br />
View full technical notes on-line at http://earthtrends.wri.org/searchable_db/variablenotes_static.cfmvarid=363&theme=1<br />
Molluscs and Crustaceans . Molluscs include freshwater molluscs, abalones, winkles, conchs, oysters, mussels, scallops, pectens, clams, squids, and<br />
miscellaneous marine molluscs. Crustaceans include freshwater crustaceans, sea-spiders, crabs, lobsters, shrimps, prawns, and miscellaneous marine<br />
crustaceans.<br />
View full technical notes on-line at http://earthtrends.wri.org/searchable_db/variablenotes_static.cfmvarid=34&theme=1<br />
Aquatic plants include brown, red, and green seaweeds, and miscellaneous aquatic plants.<br />
View full technical notes on-line at http://earthtrends.wri.org/searchable_db/variablenotes_static.cfmvarid=36&theme=1<br />
Per Capita Food Supply from Fish and Fishery Products is defined as the quantity of both freshwater and marine fish, seafood and derived <strong>pro</strong>ducts<br />
available for human consumption. Data were calculated by taking a <strong>country</strong>'s fish <strong>pro</strong>duction plus imports of fish and fishery <strong>pro</strong>ducts, minus exports, minus<br />
the amount of fishery <strong>pro</strong>duction destined to non-food, and plus or less variations in stocks. The data represent apparent consumption in live weight basis,<br />
which means that the amounts of fish and fishery <strong>pro</strong>ducts consumed include all parts of the fish, including bones.<br />
View full technical notes on-line at http://earthtrends.wri.org/searchable_db/variablenotes_static.cfmvarid=50&theme=1<br />
Fish Protein as a percent of total <strong>pro</strong>tein supply is defined as the quantity of <strong>pro</strong>tein from both freshwater and marine fish, seafood and derived <strong>pro</strong>ducts<br />
available for human consumption as a percentage of all the animal <strong>pro</strong>tein available. Data were calculated by taking a <strong>country</strong>'s fish <strong>pro</strong>duction plus imports<br />
of fish and fishery <strong>pro</strong>ducts, minus exports, minus the amount of fishery <strong>pro</strong>duction destined to non-food uses (i.e., reduction to meal, etc.), and plus or less<br />
variations in stocks. The data represent apparent consumption in live weight basis, which means that the amounts of fish and fishery <strong>pro</strong>ducts consumed<br />
include all parts of the fish, including bones.<br />
View full technical notes on-line at http://earthtrends.wri.org/searchable_db/variablenotes_static.cfmvarid=53&theme=1<br />
Annual Trade in Fish and Fishery Products . Import and export values of fish and fisheries <strong>pro</strong>ducts includes that of fish that are live, fresh, chilled, frozen,<br />
dried, salted, smoked or canned, and other fish <strong>pro</strong>ducts and preparations. Molluscs, crustaceans, meals, oils, sponges, corals, and inedible <strong>pro</strong>ducts are also<br />
included in these totals. Values are expressed in thousands of United States dollars.<br />
View full technical notes on-line at http://earthtrends.wri.org/searchable_db/variablenotes_static.cfmvarid=42&theme=1<br />
Sources<br />
Fishery Information, Data and Statistics Unit, Food and Agriculture Organization of the United Nations (FAO). 2002. FISHSTAT Plus: Universal software for<br />
fishery statistical time series, Version 2.3 (available on-line at http://www.fao.org/fi/statist/FISOFT/FISHPLUS.asp); Aquaculture Production dataset. Rome:<br />
FAO.<br />
Food and Agriculture Organization of the United Nations (FAO), FAOSTAT on-line statistical service. Available on-line at http://apps.fao.org. FAO: Rome,<br />
2002.<br />
Fishing Effort, both Freshwater and Marine<br />
People employed in fishing and aquaculture includes the number of people employed in commercial and subsistence fishing (both personnel on fishing<br />
vessels and on shore), operating in freshwater, brackish and marine areas, and in aquaculture <strong>pro</strong>duction activities.<br />
View full technical notes on-line at http://earthtrends.wri.org/searchable_db/variablenotes_static.cfmvarid=54&theme=1<br />
© EarthTrends 2003. All rights reserved. Fair use is permitted on a limited scale and for educational purposes. page 6
Decked Fishery Vessels . The term "fishery vessel" refers to "mobile floating objects of any kind and size, operating in freshwater, brackish and marine<br />
areas, and used for catching, harvesting, searching, transporting, landing, preserving and/or <strong>pro</strong>cessing fish, shellfish and other aquatic animals, residues and<br />
plants." Decked vessels are those that have a fixed structural deck covering the entire hull above the deepest operating waterline. Decked fishery vessels data<br />
include trawlers, purse seiners, gill netters, long liners, trap setters, other seiners and liners, multipurpose vessels, dredgers and other fishing vessels, and nonfishing<br />
vessels such as motherships, fish carriers, fishery research vessels, etc.<br />
View full technical notes on-line at http://earthtrends.wri.org/searchable_db/variablenotes_static.cfmvarid=98&theme=1<br />
Sources<br />
Fishery fleet data are from the Food and Agriculture Organization of the United Nations (FAO), Fishery Information, Data and Statistics Unit (FIDI), July, 2002.<br />
© EarthTrends 2003. All rights reserved. Fair use is permitted on a limited scale and for educational purposes. page 7
Economic Indicators -- <strong>Tanzania</strong><br />
Gross Domestic Product, 2000<br />
<strong>Tanzania</strong><br />
Sub-<br />
Saharan<br />
<strong>Africa</strong> World<br />
GDP in million constant 1995 US dollars 6,419 362,493 34,109,900<br />
GDP PPP (million current international dollars) {a} 17,606 1,053,452 44,913,910<br />
Gross National Income (PPP, in million current<br />
international dollars), 2000 {a} 17,522 994,240 44,458,520<br />
GDP per capita, 2000<br />
in 1995 US dollars 183 617 5,632<br />
in current international dollars 501 1,797 7,416<br />
Average annual growth in GDP, 1991-2000<br />
Total 3% 2% 3%<br />
Per capita 0% 0% 1%<br />
Percent of GDP earned by:<br />
Agriculture, 2000 45% 17% X<br />
Industry, 2000 16% 31% X<br />
Services, 2000 39% 53% X<br />
International Trade<br />
Trade in Goods and Services (million current $US)<br />
Imports, 2000 2,094 80,986 X<br />
Exports, 2000 1,325 78,438 X<br />
Exports as a percent of GDP, 2000 15% 33% X<br />
Balance of Trade, 2000 (million current $US) -769 1,213 X<br />
Millions of Dollars<br />
18,000<br />
16,000<br />
14,000<br />
12,000<br />
10,000<br />
8,000<br />
6,000<br />
4,000<br />
2,000<br />
0<br />
6,000<br />
Gross Domestic Product, <strong>Tanzania</strong>, 1975-2000<br />
1975 1980 1985 1990 1995 2000<br />
million constant US$<br />
GDP per capita, 1985-2000<br />
EarthTrends<br />
Country Profiles<br />
million $intl (PPP)<br />
Official Development Assistance (ODA ) and Financial Flows<br />
ODA in million US dollars, 1998-2000 {b} 1,012 8,040 59,073<br />
ODA per capita in US dollars, 1998-2000 {b} 30 17 10<br />
Current Account Balance (million $US), 2000 -298 X X<br />
Total external debt, million $US, 1998-2000 {b} 7,705 224,885 X<br />
Debt service as a % of export earnings, 1995-97 {b} 16.6% X X<br />
Foreign Direct Investment, net inflows<br />
(million current $US), 2000 193 6,664 X<br />
International Tourism Receipts,<br />
1995-1997 (million $US) 313 X X<br />
Constant 1995 US dollars<br />
5,000<br />
4,000<br />
3,000<br />
2,000<br />
1,000<br />
0<br />
1985 1990 1995 2000<br />
<strong>Tanzania</strong> Sub-Saharan <strong>Africa</strong> World<br />
View more Country Profiles on-line at http://earthtrends.wri.org<br />
© EarthTrends 2003. All rights reserved. Fair use is permitted on a limited scale and for educational purposes. page 1
Economic Indicators -- <strong>Tanzania</strong><br />
<strong>Tanzania</strong><br />
Sub-<br />
Saharan<br />
<strong>Africa</strong> World<br />
National Savings (as a percent of Gross National Income)<br />
Gross National Savings, 2000 14% 13% 23%<br />
Net National Savings, 2000 7% 5% X<br />
Adjusted Net Savings, 2000 10% -1% X<br />
Allocation of GDP by Sector, <strong>Tanzania</strong>, 2000<br />
Agriculture<br />
Income Distribution (years vary)<br />
Gini coefficient (0=perfect equality;<br />
100=perfect inequality) 38 X X<br />
Percent of total income earned by the richest<br />
20% of the population: 45.5% X X<br />
Percent of total income earned by the poorest<br />
20% of the population: 6.8% X X<br />
National Poverty Rate 41.6% X X<br />
Poverty Rate, Urban Population 24.4% X X<br />
Percent of population living on less than $1 a day 19.9% X X<br />
Percent of population living on less than $2 a day 59.7% X X<br />
Other Resources:<br />
Country Profiles of the Food and Agriculture Organization<br />
of the United Nations, Economic Situation:<br />
http://www.fao.org/fi/fcp/en/TZA/<strong>pro</strong>file.htm<br />
Percent of Total Income<br />
50<br />
45<br />
40<br />
35<br />
30<br />
25<br />
20<br />
15<br />
10<br />
5<br />
0<br />
38%<br />
46%<br />
16%<br />
Distribution of Income, <strong>Tanzania</strong><br />
poorest<br />
Industry<br />
Services<br />
richest<br />
Quintile of Population<br />
a. Data are in international dollars, adjusted for purchasing power parity (PPP). PPP rates <strong>pro</strong>vide a standard measure allowing comparison of real<br />
price levels between countries. b. Data are averaged for the range of years listed.<br />
View more Country Profiles on-line at http://earthtrends.wri.org<br />
© EarthTrends 2003. All rights reserved. Fair use is permitted on a limited scale and for educational purposes. page 2
Economic Indicators—Sources and Definitions<br />
Gross Domestic Product<br />
Gross domestic <strong>pro</strong>duct (GDP) measures the total output of goods and services for final use occurring within the domestic territory of a given <strong>country</strong>,<br />
regardless of the allocation to domestic and foreign claims. Gross domestic <strong>pro</strong>duct at purchaser values (market prices) is the sum of gross value added by all<br />
resident and nonresident <strong>pro</strong>ducers in the economy plus any taxes and minus any subsidies not included in the value of the <strong>pro</strong>ducts. The gross domestic<br />
<strong>pro</strong>duct estimates at purchaser values (market prices) are in constant 1995 U.S. dollars and are the sum of GDP at purchaser values (value added in the<br />
agriculture, industry, and services sectors) and indirect taxes, less subsidies. It is calculated without making deductions for depreciation of fabricated assets or<br />
for depletion and degradation of natural resources. Value added is the net output of an industry after adding up all outputs and subtracting intermediate<br />
inputs. The industrial origin of value added is determined by the International Standard Industrial Classification (ISIC) revision 3.<br />
View full technical notes on-line at http://earthtrends.wri.org/searchable_db/variablenotes_static.cfmvarid=220&themeid=5<br />
Gross Domestic Product (GDP), PPP is gross domestic <strong>pro</strong>duct converted to international dollars using Purchasing Power Parity (PPP) rates. An international<br />
dollar has the same purchasing power in a given <strong>country</strong> as a United States Dollar in the United States. In other words, it buys an equivalent amount of goods<br />
or services in that <strong>country</strong>. Data has not been adjusted to a constant year.<br />
View full technical notes on-line at http://earthtrends.wri.org/searchable_db/variablenotes_static.cfmvarid=222&themeid=5<br />
Gross National Income or GNI, current dollars is the sum of value added by all resident <strong>pro</strong>ducers plus any <strong>pro</strong>duct taxes (less subsidies) not included in the<br />
valuation of output plus net receipts of primary income (compensation of employees and <strong>pro</strong>perty income) from abroad. In other words, GNI measures the<br />
total income of all people who are citizens of a particular <strong>country</strong> while GDP (gross domestic <strong>pro</strong>duct) measures the total output of all persons living in that<br />
particular <strong>country</strong>’s borders.<br />
View full technical notes on-line at http://earthtrends.wri.org/searchable_db/variablenotes_static.cfmvarid=223&themeid=5<br />
Gross domestic <strong>pro</strong>duct (GDP) per capita, constant 1995 dollars measures the total output per person of goods and services for final use occurring within<br />
the domestic territory of a given <strong>country</strong>. Output is measured regardless of the allocation to domestic and foreign claims.<br />
View full technical notes on-line at http://earthtrends.wri.org/searchable_db/variablenotes_static.cfmvarid=640&themeid=5<br />
Gross Domestic Product (GDP) per capita, PPP is gross domestic <strong>pro</strong>duct converted to international dollars using Purchasing Power Parity (PPP) rates, and<br />
divided by the population of the <strong>country</strong> that year. An international dollar has the same purchasing power in a given <strong>country</strong> as a United States Dollar in the<br />
United States. In other words, it buys an equivalent amount of goods or services in that <strong>country</strong>.<br />
View full technical notes on-line at http://earthtrends.wri.org/searchable_db/variablenotes_static.cfmvarid=225&themeid=5<br />
Average annual growth in Gross domestic <strong>pro</strong>duct (GDP) measures the annual growth in GDP of a particular <strong>country</strong> from one year to the next. GDP<br />
per capita, annual growth measures the annual growth in GDP per person of a particular <strong>country</strong> from one year to the next.<br />
View full technical notes on-line at http://earthtrends.wri.org/searchable_db/variablenotes_static.cfmvarid=641&themeid=5<br />
Gross Domestic Product (GDP), Percent from Agriculture measures the percent of total output of goods and services which are a result of value added by<br />
the agriculture sector. The industrial origin of value added is determined by the International Standard Industrial Classification (ISIC) revision 3. Agriculture<br />
corresponds to ISIC divisions 1-5 and includes forestry and fishing. Gross Domestic Product (GDP), Percent from Industry measures the percent of total<br />
output of goods and services which are a result of value added by the industrial sector. Industry corresponds to ISIC divisions 10-45 and includes<br />
manufacturing (ISIC divisions 15-37). It comprises value added in mining, manufacturing (also reported as a separate subgroup), construction, electricity,<br />
© EarthTrends 2003. All rights reserved. Fair use is permitted on a limited scale and for educational purposes. page 3
water, and gas. Gross Domestic Product (GDP), Percent from Services measures the percent of total output of goods and services which are a result of<br />
value added by the service sector. Services correspond to ISIC divisions 50-99 and they include value added in wholesale and retail trade (including hotels and<br />
restaurants), transport, and government, financial, <strong>pro</strong>fessional, and personal services such as education, health care, and real estate services. Also included<br />
are imputed bank service charges, import duties, and any statistical discrepancies noted by national compilers as well as discrepancies arising from rescaling.<br />
View full technical notes on-line at http://earthtrends.wri.org/searchable_db/variablenotes_static.cfmvarid=214&themeid=5<br />
International Trade<br />
Exports and Imports of goods and services represent the value of all goods and other market services <strong>pro</strong>vided to or received from the rest of the world.<br />
They include the value of merchandise, freight, insurance, transport, travel, royalties, license fees, and other services, such as communication, construction,<br />
financial, information, business, personal, and government services. They exclude labor and <strong>pro</strong>perty income (formerly called factor services) as well as transfer<br />
payments.<br />
View full technical notes on-line at http://earthtrends.wri.org/searchable_db/variablenotes_static.cfmvarid=240&themeid=5<br />
Exports as a percent of GDP is calculated by dividing Exports of Goods and Services for a given <strong>country</strong> by the Gross Domestic Product (constant 1995<br />
dollars) of that <strong>country</strong> for a given year.<br />
View full technical notes on-line at http://earthtrends.wri.org/searchable_db/variablenotes_static.cfmvarid=658&themeid=5<br />
Balance of trade is the net exports (exports minus imports) of goods and services for a particular <strong>country</strong>. It includes all transactions between residents of a<br />
<strong>country</strong> and the rest of the world involving a change in ownership of general merchandise, goods sent for <strong>pro</strong>cessing and repairs, nonmonetary gold, and<br />
services. Data are in current U.S. dollars. If a <strong>country</strong>’s exports exceed its imports, it has a trade surplus and the trade balance is said to be positive. If imports<br />
exceed exports, the <strong>country</strong> has a trade deficit and its trade balance is said to be negative.<br />
View full technical notes on-line at http://earthtrends.wri.org/searchable_db/variablenotes_static.cfmvarid=716&themeid=5<br />
Official Development Assistance (ODA ) and Financial Flows<br />
Official development assistance records the amount of international aid received by a <strong>country</strong>. It refers to the actual international transfer by the donor of<br />
financial resources or of goods or services valued at the cost to the donor, less any repayments of loan principal during the same period. Grants by official<br />
agencies of the members of the Development Assistance Committee are included, as are loans with a grant element of at least 25 percent, and technical<br />
cooperation and assistance. Data are in current U.S. dollars and dollar exchange rates.<br />
View full technical notes on-line at http://earthtrends.wri.org/searchable_db/variablenotes_static.cfmvarid=218&themeid=5<br />
Official development assistance per capita records the amount of international aid received per capita.<br />
View full technical notes on-line at http://earthtrends.wri.org/searchable_db/variablenotes_static.cfmvarid=244&themeid=5<br />
Current account balance is the sum of net exports of goods, services, net income, and net current transfers. Data are in current U.S. dollars. The data on<br />
current account balances are based on balance of payments data reported by the International Monetary Fund (IMF) in their Balance of Payment and<br />
International Financial Statistics databases, supplanted by estimates by World Bank staff for countries whose national accounts are recorded in fiscal years and<br />
countries for which the IMF does not collect balance of payments statistics. In addition, World Bank staff make estimates of missing data for the most recent<br />
year. More information on balance of payments can be found in the fifth edition of the IMF’s Balance of Payments Manual 1993 (available online at<br />
© EarthTrends 2003. All rights reserved. Fair use is permitted on a limited scale and for educational purposes. page 4
http://www.imf.org/external/np/sta/bop/BOPman.pdf). The World Bank acquires data with the IMF through electronic files that in most cases are more timely<br />
and cover a longer period than the published sources. World Resources Institute downloads data in electronic form directly from the World Bank.<br />
View full technical notes on-line at http://earthtrends.wri.org/searchable_db/variablenotes_static.cfmvarid=657&themeid=5<br />
Total external debt is debt owed to nonresidents of a <strong>country</strong> repayable in foreign currency, goods, or services. It is the sum of public, publicly guaranteed,<br />
and private non-guaranteed long-term debt, use of IMF credit, and short-term debt. Short-term debt includes all debt having an original maturity of one year<br />
or less and interest in arrears on long-term debt. Long-term debt includes all debt having a maturity of more than one year.<br />
View full technical notes on-line at http://earthtrends.wri.org/searchable_db/variablenotes_static.cfmvarid=229&themeid=5<br />
Total debt service as a percent of export earnings (in foreign currencies, goods, and services) comprises interest payments and principal repayments<br />
made on the disbursed long-term public debt and private, non-guaranteed debt, International Monetary Fund (IMF) debt repurchases, IMF charges, and<br />
interest payments on short-term debt. Total debt service is the sum of principal repayments and interest actually paid in foreign currency, goods, or services<br />
on long-term debt, interest paid on short-term debt, and repayments (repurchases and charges) to the IMF.<br />
View full technical notes on-line at http://earthtrends.wri.org/searchable_db/variablenotes_static.cfmvarid=248&themeid=5<br />
Foreign direct investment is net inflows of investment to acquire a lasting management interest (10 percent or more of voting stock) in an enterprise<br />
operating in an economy other than that of the investor. It is the sum of equity capital, reinvestment of earnings, other long-term capital, and short term<br />
capital, as shown in the balance of payments. Data are in current U.S. dollars.<br />
View full technical notes on-line at http://earthtrends.wri.org/searchable_db/variablenotes_static.cfmvarid=250&themeid=5<br />
International tourism receipts are expenditures by international inbound visitors, including payments to national carriers for international transport. Figures<br />
are in current U.S. dollars.<br />
View full technical notes on-line at http://earthtrends.wri.org/searchable_db/variablenotes_static.cfmvarid=252&themeid=5<br />
National Savings (as a percent of Gross National Income)<br />
Gross national savings is equal to gross domestic savings (gross domestic <strong>pro</strong>duct minus final consumption) plus net income and net current transfers from<br />
abroad. The United Nations system of national accounts defines gross national income as "the aggregate value of the balances of gross primary incomes for<br />
all sectors; (gross national income is identical to gross national <strong>pro</strong>duct (GNP) as hitherto understood in national accounts generally.)"<br />
View full technical notes on-line at http://earthtrends.wri.org/searchable_db/variablenotes_static.cfmvarid=588&themeid=5<br />
Net national savings is equal to gross national savings minus the value of consumption of fixed capital (the replacement value of capital used up in the<br />
<strong>pro</strong>cess of <strong>pro</strong>duction.)<br />
View full technical notes on-line at http://earthtrends.wri.org/searchable_db/variablenotes_static.cfmvarid=589&themeid=5<br />
Adjusted net savings attempts to measure the "true" rate of savings of a <strong>country</strong>'s economy by taking into account human capital, depletion of natural<br />
resources, and the damages of pollution in addition to standard economic savings measures. Adjusted net savings is calculated by the World Bank by the<br />
following formula:<br />
NAS = ( GNS – Dh + CSE – S R n,i – CD ) / GNI<br />
Where NAS = Net Adjusted Savings Rate<br />
GNS = Gross National Saving<br />
© EarthTrends 2003. All rights reserved. Fair use is permitted on a limited scale and for educational purposes. page 5
Dh = Depreciation of <strong>pro</strong>duced capital<br />
CSE = Current (non- fixed-capital) expenditure on education<br />
R n,i= Rent from depletion of natural capital<br />
CD = Damages from carbon dioxide emissions<br />
GNI = Gross National Income at Market Prices<br />
View full technical notes on-line at http://earthtrends.wri.org/searchable_db/variablenotes_static.cfmvarid=590&themeid=5<br />
Income Distribution<br />
The Gini index measures the extent to which the distribution of income (or in some cases consumption expenditure) among individuals or households within<br />
an economy deviates from a perfectly equal distribution. A Gini index score of zero implies perfect equality while a score of one hundred implies perfect<br />
inequality.<br />
View full technical notes on-line at http://earthtrends.wri.org/searchable_db/variablenotes_static.cfmvarid=353&themeid=5<br />
Share of total income, lowest 20% is equal to the percentage share of all income in a given <strong>country</strong> which is earned by the poorest fifth of the population.<br />
View full technical notes on-line at http://earthtrends.wri.org/searchable_db/variablenotes_static.cfmvarid=354&themeid=5<br />
Share of total income, highest 20% is equal to the percentage share of all income in a given <strong>country</strong> which is earned by the richest fifth of the population.<br />
View full technical notes on-line at http://earthtrends.wri.org/searchable_db/variablenotes_static.cfmvarid=358&themeid=5<br />
The National Poverty Rate is the percent of the population of a <strong>country</strong> which earns less than that <strong>country</strong>’s national poverty line. The National Poverty<br />
Rate, Urban is the percent of the urban population of a <strong>country</strong> which earns less than that <strong>country</strong>’s national poverty line.<br />
These poverty measures are based on surveys conducted mostly between 1990 and 2000, prepared by the World Bank’s Development Research Group.<br />
National poverty lines are based on the Bank’s <strong>country</strong> poverty assessments.<br />
View full technical notes on-line at http://earthtrends.wri.org/searchable_db/variablenotes_static.cfmvarid=362&themeid=5<br />
Poverty: Population living below $1/day is the percent of the population of a <strong>country</strong> living on less than $1.08 a day at 1993 international prices,<br />
(equivalent to $1 in 1985 prices, adjusted for purchasing power parity). Poverty: Population living below $2/day is the percent of the population of a<br />
<strong>country</strong> living on less than $2.15 a day at 1993 international prices, (equivalent to $2 in 1985 prices, adjusted for purchasing power parity). These poverty<br />
measures are based on surveys conducted mostly between 1994 and 1999, prepared by the World Bank’s Development Research Group. The international<br />
poverty lines are based on nationally representative primary household surveys conducted by national statistical offices or by private agencies under the<br />
supervision of government or international agencies and obtained from government statistical offices and World Bank <strong>country</strong> departments.<br />
View full technical notes on-line at http://earthtrends.wri.org/searchable_db/variablenotes_static.cfmvarid=359&themeid=5<br />
Sources:<br />
Development Data Group, The World Bank. 2002. World Development Indicators 2002 online (see<br />
http://publications.worldbank.org/ecommerce/catalog/<strong>pro</strong>ductitem_id=631625) Washington, D.C.: The World Bank.<br />
© EarthTrends 2003. All rights reserved. Fair use is permitted on a limited scale and for educational purposes. page 6
Energy and Resources-- <strong>Tanzania</strong><br />
EarthTrends<br />
Country Profiles<br />
Energy Production and Consumption <strong>Tanzania</strong><br />
Sub-<br />
Saharan<br />
<strong>Africa</strong> World<br />
(in thousand metric tons of oil equivalent) {a}<br />
Total energy <strong>pro</strong>duction, 2000 14,601 552,808 10,077,984<br />
% change since 1980 54% 71% 37%<br />
Energy imports, 1997 781 28,564 9,521,506<br />
Energy exports, 1997 29 219,173 3,419,104<br />
Total energy consumption {b}, 1999 15,033 X 9,702,786<br />
Electricity consumption, 1999 155 X 1,040,770<br />
Energy consumption per capita, 1997 0.45 0.54 1.64<br />
% change since 1990 -8% -2% 0%<br />
Energy consumption per GDP {c}, 1999: 823 425 244<br />
% change since 1990 -8% 4% -13%<br />
Energy Consumption by Source, 1999 (in thousand metric tons oil equivalent)<br />
Total Fossil Fuels 762 X 7,689,047<br />
Coal and coal <strong>pro</strong>ducts 3 X 2,278,524<br />
Crude oil and natural gas liquids 628 X 3,563,084<br />
Natural gas 0 X 2,012,559<br />
Nuclear 0 X 661,901<br />
Hydroelectric 187 X 222,223<br />
Renewables, excluding hydroelectric: 14,079 X 1,097,889<br />
Primary solid biomass (includes fuelwood) 14,079 X 1,035,139<br />
Biogas and liquid biomass 0 X 14,931<br />
Geothermal 0.0 X 43,802<br />
Solar 0.0 X 2,217<br />
Wind 0.0 X 1,748<br />
Tide, wave, and ocean 0.0 X 53<br />
Energy Consumption by Sector, 1999<br />
(in thousand metric tons of oil equivalent)<br />
Industry 1,581 X 2,140,474<br />
Transportation 290 X 1,755,505<br />
Agriculture 436 X 166,287<br />
Commercial & public services 40 X 511,555<br />
Residential 10,697 X 1,845,475<br />
Non-energy uses and "other" consumption 543 X 333,981<br />
Total final energy consumption {d} 13,589 X 6,753,276<br />
View more Country Profiles on-line at http://earthtrends.wri.org<br />
Index Value (1971=100)<br />
million tons of oil equivalent<br />
180.0<br />
160.0<br />
140.0<br />
120.0<br />
100.0<br />
80.0<br />
60.0<br />
40.0<br />
20.0<br />
0.0<br />
16<br />
14<br />
12<br />
10<br />
8<br />
6<br />
4<br />
2<br />
0<br />
Energy Consumption: Relative trends, <strong>Tanzania</strong>,<br />
1971-1999<br />
1970 1975 1980 1985 1990 1995 2000<br />
Total per capita per $million GDP<br />
Energy Consumption by Source, <strong>Tanzania</strong>, 1971-<br />
1999<br />
1971 1981 1991<br />
Other<br />
Renewables<br />
Hydroelectric<br />
Nuclear<br />
Fossil Fuels<br />
© EarthTrends 2003. All rights reserved. Fair use is permitted on a limited scale and for educational purposes. page 1
Energy and Resources-- <strong>Tanzania</strong><br />
<strong>Tanzania</strong><br />
Sub-<br />
Saharan<br />
<strong>Africa</strong> World<br />
Resource Consumption<br />
Passenger cars per 1000 people, 1998 X X 109<br />
Annual motor gasoline consumption, 2000<br />
(liters per person) 4 X 179<br />
Annual meat consumption, 1998<br />
(kg per person) 10 13 38<br />
Annual paper consumption, 2000<br />
(kg per person) X X 53<br />
Annual coffee consumption, 2001<br />
(kg per person) 0 X X<br />
Energy Consumption by Sector, <strong>Tanzania</strong>, 1999<br />
79%<br />
4%<br />
12%<br />
2%<br />
3%<br />
0%<br />
Industry<br />
Transportation<br />
Agriculture<br />
Commercial & public<br />
services<br />
Residential<br />
Non-energy Uses and<br />
"Other" consumption<br />
Footnotes:<br />
a. One metric ton of oil equivalent (toe) is defined as 10 Exp. 7 kilocalories or 41.868 gigajoules, equal to the amount of energy contained in 1 metric ton of crude oil.<br />
b. In metric tons of oil equivalent per million constant 1995 international dollars.<br />
TPES = Energy Production + Imports - Exports - Stock Changes - Consumption by International Marine Bunkers<br />
c. In metric tons of oil equivalent per million constant 1995 international dollars.<br />
d. "Total final consumption" is calculated as the sum of energy consumption by sectors.<br />
View more Country Profiles on-line at http://earthtrends.wri.org<br />
© EarthTrends 2003. All rights reserved. Fair use is permitted on a limited scale and for educational purposes. page 2
Energy and Resources—Sources and Definitions<br />
All energy consumption values presented here are calculated and reported by the International Energy Agency (IEA) based on an energy balance methodology<br />
using metric tons of oil equivalent (toe), a common unit based on the calorific content of energy commodities. One toe is defined as 10 Exp. 7 kilocalories,<br />
41.868 gigajoules, or 11,628 GWh. This amount of energy is roughly equal to the amount of energy contained in a ton of crude oil.<br />
Energy Use<br />
Total Energy Production is the total amount of primary energy <strong>pro</strong>duced in the year specified by all sources, i.e. hard coal, lignite/brown coal, peat, crude<br />
oil, natural gas liquids (NGLs), natural gas, combustible renewables and wastes, nuclear, hydro, geothermal, solar and the heat from heat pumps that is<br />
extracted from the ambient environment. Production is calculated after removal of impurities (e.g. sulphur from natural gas).<br />
View full technical notes at: http://earthtrends.wri.org/searchable_db/variablenotes_static.cfmvarid=253&themeid=6<br />
Energy Imports and Energy Exports present the energy equivalent amounts of electricity, coal, natural gas, oil and oil <strong>pro</strong>ducts that have crossed the<br />
national territorial boundaries of a <strong>country</strong>, whether or not customs clearance has taken place. Crude oil, natural gas, and natural gas liquids are reported as<br />
coming from the <strong>country</strong> of origin; refinery feedstocks and oil <strong>pro</strong>ducts are reported as coming from the <strong>country</strong> of last consignment. Coal or oil in transit is<br />
not included. If electricity is "wheeled" or transited through a <strong>country</strong>, the amount is shown as both an import and an export.<br />
View full technical notes at: http://earthtrends.wri.org/searchable_db/variablenotes_static.cfmvarid=269&themeid=6<br />
Total Energy Consumption is the total amount of primary energy consumed from all sources in the year specified. Primary energy includes losses from<br />
transportation, friction, heat loss and other inefficiencies. Specifically, consumption equals indigenous <strong>pro</strong>duction plus imports and stock changes, minus<br />
exports and international marine bunkers. The International Energy Agency (IEA) calls this value Total Primary Energy Supply (TPES).<br />
View full technical notes at: http://earthtrends.wri.org/searchable_db/variablenotes_static.cfmvarid=267&themeid=6<br />
Electricity Consumption is the amount of electricity consumed by each <strong>country</strong> or region in the year specified. This variable includes electricity from all<br />
energy sources. This variable accounts for the amount of electricity consumed by the end user, meaning that losses due to transportation, friction, heat loss<br />
and other inefficiencies are not included in this figure.<br />
View full technical notes at: http://earthtrends.wri.org/searchable_db/variablenotes_static.cfmvarid=271&themeid=6<br />
Energy Consumption per capita is the total amount of energy consumed per person, in each <strong>country</strong> in the year specified. This variable includes energy<br />
from all energy sources. The % Change since 1980 shows the percentage change in per capita energy consumption between 1980 and the specified year: in<br />
this case, 1997.<br />
View full technical notes at: http://earthtrends.wri.org/searchable_db/variablenotes_static.cfmvarid=351&themeid=6<br />
Energy Consumption per GDP PPP indicates the amount of energy consumed per unit of income generated by the <strong>country</strong>'s economy. GDP PPP is a<br />
<strong>country</strong> or region’s gross domestic <strong>pro</strong>duct (GDP) converted to international dollars using Purchasing Power Parity (PPP) rates, and rescaled to 1995 to give a<br />
common reference year. An international dollar has the same purchasing power in a given <strong>country</strong> as a United States Dollar in the United States. In other<br />
words, an international dollar buys an equivalent amount of goods or services in all countries. The % Change since 1980 shows the percentage change in<br />
energy consumption per GDP PPP between 1980 and the specified year: in this case, 1999.<br />
View full technical notes at: http://earthtrends.wri.org/searchable_db/variablenotes_static.cfmvarid=668&themeid=6<br />
© EarthTrends 2003. All rights reserved. Fair use is permitted on a limited scale and for educational purposes. page 3
Energy Consumption by Source is the total amount of primary energy consumed from the usage of a specified fuel. Primary energy includes losses from<br />
transportation, friction, heat loss and other inefficiencies. Specifically, consumption equals indigenous <strong>pro</strong>duction plus imports and stock changes, minus<br />
exports and international marine bunkers. The IEA calls this value Total Primary Energy Supply (TPES).<br />
Fossil Fuels, total is the amount of energy consumed from the use of crude oil and natural gas liquids, coal and coal <strong>pro</strong>ducts, and natural gas.<br />
Coal and coal <strong>pro</strong>ducts refer coal and all coal <strong>pro</strong>ducts, such as peat and coke.<br />
Crude oil and natural gas liquids refer to liquid fuels such as crude oil or natural gas liquids, including motor and aviation gasoline, kerosene, diesel oil, and<br />
petrochemical feedstocks. Feedstocks include all oil <strong>pro</strong>ducts used as raw material in the petrochemical industry for steamcracking, and aromatics plants, such<br />
as naphtha, liquefied petroleum gases, light and heavy gasoil, reformate, etc.<br />
Natural gas refers to natural gases that occur in underground deposits, whether liquefied or gaseous, consisting mainly of methane. Natural gas includes<br />
both non-associated gas originating from fields <strong>pro</strong>ducing hydrocarbons only in gaseous form, associated gas <strong>pro</strong>duced in association with crude oil, and<br />
methane recovered from coal mines (colliery gas).<br />
View full technical notes at: http://earthtrends.wri.org/searchable_db/variablenotes_static.cfmvarid=559&themeid=6<br />
Nuclear Fuels shows the primary heat equivalent of the electricity consumed from nuclear power plants. Heat-to-electricity conversion efficiency is assumed<br />
to be 33 percent.<br />
View full technical notes at: http://earthtrends.wri.org/searchable_db/variablenotes_static.cfmvarid=275&themeid=6<br />
Hydroelectric refers to the energy content of the electricity consumed from hydroelectric power plants, which convert the potential and kinetic energy of<br />
water into electricity. This variable excludes output from pumped storage.<br />
View full technical notes at: http://earthtrends.wri.org/searchable_db/variablenotes_static.cfmvarid=276&themeid=6<br />
Renewables, excluding Hydroelectric shows the amount of energy consumed from renewable sources such as wind; tide, wave and ocean; thermal and<br />
photovoltaic solar; primary solid biomass; liquid biomass and biogas; and geothermal systems.<br />
Solid Biomass is defined as any plant matter used directly as fuel or converted into other forms before combustion. This category includes wood; vegetal<br />
waste such as wood waste and crop waste; animal materials and wastes; sulphite lyes (also known as black liquor, a sludge that contains the lignin digested<br />
from wood for paper making); and other solid biomass.<br />
Biogas and liquid biomass. Biogases are derived principally from the anaerobic fermentation of biomass and solid wastes, which are combusted to <strong>pro</strong>duce<br />
heat and electrical power. Landfill gases and gases from sewage and animal waste facilities are included in this category. Energy from liquid biomass uses<br />
liquid derivatives from biomass as a fuel. Ethanol is the main form of liquid biomass <strong>pro</strong>duced.<br />
Geothermal energy is available as heat emitted from within the earth's crust, usually in the form of hot water or steam. It is exploited for electricity<br />
generation using dry steam or high enthalpy brine after flashing, or directly as heat for district heating, agriculture, etc.<br />
Solar energy is harnessed using two primary methods. Solar-thermal power exploits solar radiation for hot water <strong>pro</strong>duction and electricity generation by flat<br />
plate collectors (mainly of the thermosiphon type, for domestic hot water or for the seasonal heating of swimming pools) or solar thermal-electric plants.<br />
Solar power from photovoltaics involves the conversion of solar energy to electricity in photovoltaic cells. Passive solar energy for the direct heating, cooling<br />
and lighting of dwellings or other buildings is not included in this category.<br />
Wind power exploits the kinetic energy of wind in wind turbines to generate electrical power.<br />
Tide, wave, ocean power captures the mechanical energy from tidal motion or wave activity and transforms it into electrical power.<br />
View full technical notes at: http://earthtrends.wri.org/searchable_db/variablenotes_static.cfmvarid=542&themeid=6<br />
© EarthTrends 2003. All rights reserved. Fair use is permitted on a limited scale and for educational purposes. page 4
Energy Consumption by Sector<br />
Industry represents energy consumed by activities in all industrial sub-sectors, such as mining and quarrying, iron and steel, construction, etc. Energy used for<br />
transport by industry is not included here but is reported under transportation. The industry sector is further defined as including International Standard<br />
Industrial Classification (ISIC) divisions 15-37.<br />
View full technical notes at: http://earthtrends.wri.org/searchable_db/variablenotes_static.cfmvarid=281&themeid=6<br />
Transportation represents energy used for all transport except international marine bunkers. It covers road, railway, air, internal navigation (including small<br />
craft and coastal shipping not included under marine bunkers), transport in the industry sector, and energy used for transport of materials by pipeline and<br />
non-specified transport. Energy used for ocean, coastal and inland fishing is not included here but is reported under agriculture. The transportation sector is<br />
further defined as including International Standard Industrial Classification (ISIC) divisions 60, 61 and 62.<br />
View full technical notes at: http://earthtrends.wri.org/searchable_db/variablenotes_static.cfmvarid=534&themeid=6<br />
Agriculture encompasses all energy consumed by all traction (excluding agricultural highway use), power, or heating (agricultural and domestic) for activities<br />
defined under the International Standard Industrial Classification (ISIC) divisions of Agriculture or Hunting & Forestry. These activities include, for example,<br />
operation of irrigation systems and agricultural machinery, animal husbandry, maintenance of parks and gardens, hunting and trapping, logging, and ocean,<br />
coastal, and inland fishing.<br />
View full technical notes at: http://earthtrends.wri.org/searchable_db/variablenotes_static.cfmvarid=286&themeid=6<br />
Commercial & Public Sectors refers to the energy consumed by wholesale and retail trade; the operation of hotels and restaurants; post and<br />
telecommunications; real estate, renting and business activities; the collection, purification and distribution of water; maintenance and repair of motor vehicles<br />
and motorcycles; financial intermediation, except insurance and pension funding; computer and related activities; sewage and refuse disposal; public<br />
administration and defense; education; and other community, health, social and personal service activities. The activities and services defined above are listed<br />
under International Standard Industrial Classification (ISIC) divisions 41, 50, 51, 55, 63, 64, 65, 66, 70, 71, 72, 73, 74, 75, 80, 85, 90, 91, 93 and 99.<br />
View full technical notes at: http://earthtrends.wri.org/searchable_db/variablenotes_static.cfmvarid=288&themeid=6<br />
Residential includes all energy used for activities by households except for transportation.<br />
View full technical notes at: http://earthtrends.wri.org/searchable_db/variablenotes_static.cfmvarid=287&themeid=6<br />
Non-Energy Uses covers the amount of energy consumed by the use of petroleum <strong>pro</strong>ducts such as white spirit, paraffin waxes, lubricants, bitumen and<br />
other <strong>pro</strong>ducts, as well as the non-energy use of coal (excluding peat). It is assumed that the use of these <strong>pro</strong>ducts is exclusively non-energy use. An exception<br />
to this treatment is petroleum coke, which is counted under non-energy use only when there is evidence of such use; otherwise it is shown under energy use<br />
in industry or in other sectors. Non-energy use of coal includes carbon blacks, graphite electrodes, etc. and is also shown separately by sector. Feedstocks for<br />
the petrochemical industry, like naptha, are accounted for in industry under chemical industry.<br />
Total Final Energy Consumption (TFC) is the sum of consumption of energy by the different end-use sectors described above. In final consumption,<br />
petrochemical feedstocks and non-energy use of such oil <strong>pro</strong>ducts as white spirit, lubricants, bitumen, paraffin waxes and other <strong>pro</strong>ducts are included.<br />
Backflows from the petrochemical industry are not included in final consumption (see other transformation).<br />
Resource Consumption<br />
Passenger Cars per 1000 People refer to the number of individual four-wheel vehicles per 1,000 people. These numbers exclude buses, freight vehicles, and<br />
two-wheelers such as mopeds and motorcycles.<br />
View full technical notes at: http://earthtrends.wri.org/searchable_db/variablenotes_static.cfmvarid=290&themeid=6<br />
© EarthTrends 2003. All rights reserved. Fair use is permitted on a limited scale and for educational purposes. page 5
Annual Motor Gasoline Consumption refers to the per capita consumption of motor gasoline, a light hydrocarbon oil used in internal combustion engines<br />
such as motor vehicles. The data in this variable only considers the fuels used in road vehicles (including military) as well as agricultural and industrial highway<br />
use. It excludes motor gasoline used in stationary engines.<br />
View full technical notes at: http://earthtrends.wri.org/searchable_db/variablenotes_static.cfmvarid=292&themeid=6<br />
Annual Meat Consumption refers to per capita meat consumption. This variable includes meat from animals slaughtered in countries, irrespective of their<br />
origin, and comprises horsemeat, poultry, and meat from all other domestic or wild animals such as camels, rabbits, reindeer, and game animals. Meat<br />
consumption was calculated using a trade balance ap<strong>pro</strong>ach (total <strong>pro</strong>duction plus imports, minus exports).<br />
View full technical notes at: http://earthtrends.wri.org/searchable_db/variablenotes_static.cfmvarid=193&themeid=6<br />
Annual Paper Consumption refers to the per capita consumption of newsprint, printing and writing paper, packaging paper, household and sanitary paper,<br />
and other paper and paperboard. Paper consumption was calculated using a trade balance ap<strong>pro</strong>ach (total <strong>pro</strong>duction plus imports, minus exports). For some<br />
countries for which the FAO has no <strong>pro</strong>duction data, <strong>pro</strong>duction was assumed to be negligible and was assigned a value of 0 instead of reporting X for these<br />
countries. These countries, marked with a footnote, have

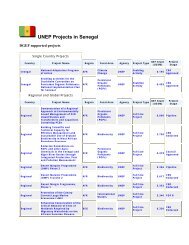


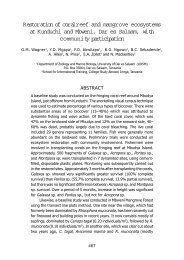
![Please Click to download [English] - GRID Africa GeoPortal - UNEP](https://img.yumpu.com/30633391/1/184x260/please-click-to-download-english-grid-africa-geoportal-unep.jpg?quality=85)