Lab #1: Introduction to Velocity - NNM-Science
Lab #1: Introduction to Velocity - NNM-Science
Lab #1: Introduction to Velocity - NNM-Science

Create successful ePaper yourself
Turn your PDF publications into a flip-book with our unique Google optimized e-Paper software.
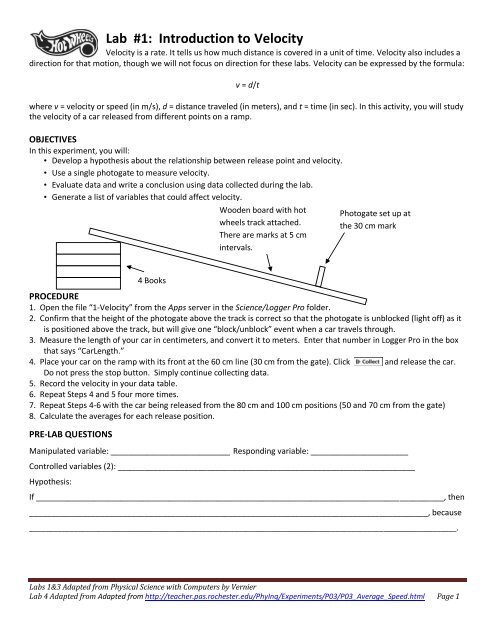
<strong>Lab</strong> <strong>#1</strong>: <strong>Introduction</strong> <strong>to</strong> <strong>Velocity</strong><br />
<strong>Velocity</strong> is a rate. It tells us how much distance is covered in a unit of time. <strong>Velocity</strong> also includes a<br />
direction for that motion, though we will not focus on direction for these labs. <strong>Velocity</strong> can be expressed by the formula:<br />
v = d/t<br />
where v = velocity or speed (in m/s), d = distance traveled (in meters), and t = time (in sec). In this activity, you will study<br />
the velocity of a car released from different points on a ramp.<br />
OBJECTIVES<br />
In this experiment, you will:<br />
• Develop a hypothesis about the relationship between release point and velocity.<br />
• Use a single pho<strong>to</strong>gate <strong>to</strong> measure velocity.<br />
• Evaluate data and write a conclusion using data collected during the lab.<br />
• Generate a list of variables that could affect velocity.<br />
PROCEDURE<br />
1. Open the file “1-<strong>Velocity</strong>” from the Apps server in the <strong>Science</strong>/Logger Pro folder.<br />
2. Confirm that the height of the pho<strong>to</strong>gate above the track is correct so that the pho<strong>to</strong>gate is unblocked (light off) as it<br />
is positioned above the track, but will give one “block/unblock” event when a car travels through.<br />
3. Measure the length of your car in centimeters, and convert it <strong>to</strong> meters. Enter that number in Logger Pro in the box<br />
that says “CarLength.”<br />
4. Place your car on the ramp with its front at the 60 cm line (30 cm from the gate). Click and release the car.<br />
Do not press the s<strong>to</strong>p but<strong>to</strong>n. Simply continue collecting data.<br />
5. Record the velocity in your data table.<br />
6. Repeat Steps 4 and 5 four more times.<br />
7. Repeat Steps 4-6 with the car being released from the 80 cm and 100 cm positions (50 and 70 cm from the gate)<br />
8. Calculate the averages for each release position.<br />
PRE-LAB QUESTIONS<br />
Manipulated variable: ___________________________ Responding variable: ______________________<br />
Controlled variables (2): ___________________________________________________________________<br />
Hypothesis:<br />
4 Books<br />
Wooden board with hot<br />
wheels track attached.<br />
There are marks at 5 cm<br />
intervals.<br />
Pho<strong>to</strong>gate set up at<br />
the 30 cm mark<br />
If ____________________________________________________________________________________________, then<br />
__________________________________________________________________________________________, because<br />
__________________________________________________________________________________________________________.<br />
<strong>Lab</strong>s 1&3 Adapted from Physical <strong>Science</strong> with Computers by Vernier<br />
<strong>Lab</strong> 4 Adapted from Adapted from http://teacher.pas.rochester.edu/PhyInq/Experiments/P03/P03_Average_Speed.html Page 1
DATA<br />
VELOCITY (M/S)<br />
TRIAL # 60 CM (30 CM FROM GATE) 80 CM (50 CM FROM GATE) 100 CM (70 CM FROM GATE)<br />
1<br />
2<br />
3<br />
4<br />
5<br />
AVERAGE<br />
PROCESSING THE DATA (SEPARATE PIECE OF PAPER, PLEASE!)<br />
1. Print your graph and draw a line of best fit through your data points.<br />
2. <strong>Velocity</strong> is calculated by determining how much distance is covered in a certain period of time. What distance did<br />
Logger Pro use? What time? Draw a labeled picture or explain. Be careful on this one!<br />
3. What happened <strong>to</strong> velocity as you released the car from higher points?<br />
4. Did you have any outliers? If so, what is your explanation for why they exist?<br />
5. What was the extra validity measure in this investigation?<br />
6. List 3 other variables that you think might change how quickly the car travels down the ramp (not release point).<br />
7. Write a conclusion for this lab.<br />
<strong>Lab</strong> #2: <strong>Velocity</strong> Inquiry<br />
In lab <strong>#1</strong>, you identified 3 variables that could affect the velocity of the car. You will now pick one<br />
of those variables and write a procedure <strong>to</strong> test your hypothesis about that particular variable.<br />
OBJECTIVES:<br />
In this investigation, you will:<br />
* Develop a hypothesis about a manipulated variable of your choice.<br />
* Write a procedure and conduct an investigation.<br />
* Analyze data and write a conclusion about your experiment.<br />
* Use a single pho<strong>to</strong>gate as you did in <strong>Lab</strong> <strong>#1</strong> <strong>to</strong> measure velocity.<br />
Manipulated variable: ___________________________ Responding variable: ______________________<br />
Controlled variables (2): ___________________________________________________________________<br />
Hypothesis: If __________________________________________________________________________________, then<br />
__________________________________________________________________________________________, because<br />
__________________________________________________________________________________________________.<br />
� The variables and hypothesis have been checked by your teacher.<br />
Write a procedure on a piece of notebook paper that includes: logical steps, 2 controlled variables, 3 conditions of the<br />
manipulated variable, what you are measuring and how often (responding variable), recording the data, multiple trials,<br />
an extra validity measure, and an experimental control.<br />
� The procedure has been checked by your teacher. Use the “2-Inquiry” file on the App$ server in the <strong>Science</strong>/Logger<br />
Pro folder. Consider printing your graph for your lab report, due _______________________.<br />
<strong>Lab</strong>s 1&3 Adapted from Physical <strong>Science</strong> with Computers by Vernier<br />
<strong>Lab</strong> 4 Adapted from Adapted from http://teacher.pas.rochester.edu/PhyInq/Experiments/P03/P03_Average_Speed.html Page 2
<strong>Lab</strong> #3: It’s Race Day<br />
Air resistance, mass and friction are some fac<strong>to</strong>rs that influence the speed of a Hot Wheels car. In<br />
this contest, you will use principles you have learned in science as you race a car down a ramp. The<br />
fastest car will be the one that reaches the highest maximum velocity going down the ramp.<br />
<strong>Velocity</strong> will be measured with a computer-interfaced Motion Detec<strong>to</strong>r.<br />
OBJECTIVES<br />
In this contest, you will:<br />
* Apply knowledge gained from lab 1 and 2 <strong>to</strong> a new scenario.<br />
* Have a little fun.<br />
GUIDELINES<br />
1. You may use your own car or temporarily modify a labora<strong>to</strong>ry car supplied by your teacher. You are encouraged <strong>to</strong><br />
make changes that will increase the speed of the car.<br />
2. The car may only be powered by the pull of gravity. It may not be otherwise pulled, pushed, or propelled.<br />
3. You are encouraged <strong>to</strong> experiment and practice before the contest.<br />
4. During the contest, your car will get two runs down a ramp set up by your teacher. A Pho<strong>to</strong>gate will be used <strong>to</strong><br />
measure velocity as in <strong>Lab</strong> <strong>#1</strong>, “<strong>Introduction</strong> <strong>to</strong> <strong>Velocity</strong>.” The greater velocity of your two runs will count, and the<br />
winning car is the one with the highest maximum velocity.<br />
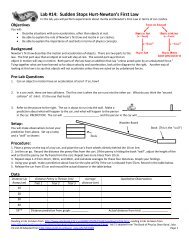
<strong>Lab</strong> #4: Instantaneous vs. Average Speed<br />
In these lab activities, you'll investigate the relationship between instantaneous speed and average<br />
speed, and see how a series of average speeds can be used <strong>to</strong> deduce an instantaneous speed.<br />
Background<br />
An average speed can be a useful value. It's the ratio of the overall distance an object travels and the amount of time<br />
that the object travels. If you know you will average 50 miles per hour on a 200-mile trip, it's easy <strong>to</strong> determine how long<br />
the trip will take. On the other hand, the highway patrol office following you doesn't care about your average speed<br />
over 200 miles. The patrol officer wants <strong>to</strong> know how fast you're driving at the instant the radar strikes your car, so he or<br />
she can determine whether or not <strong>to</strong> give you a ticket. The officer wants <strong>to</strong> know your instantaneous speed.<br />
If you measure average speed of a moving object over smaller and smaller intervals of distance, the value of the average<br />
speed approaches the value of the object's instantaneous speed.<br />
In this activity, you will use two pho<strong>to</strong>gates <strong>to</strong> measure the amount of time it takes for an object <strong>to</strong> move a measured<br />
distance. You will enter the measured distance in<strong>to</strong> the computer (since the computer has no way of knowing the<br />
distance between the two pho<strong>to</strong>gates). The Logger Pro program will calculate the average speed based on the distance<br />
you enter, and the time that is measured. Then you will change the distance over which the object's motion is measured<br />
and repeat the process.<br />
Set-up<br />
Pho<strong>to</strong>gate set up at the<br />
90 cm mark (this one<br />
DOES move for each test)<br />
4 Books<br />
Wooden board with<br />
hot wheels track<br />
attached. There are<br />
marks at 5 cm<br />
intervals.<br />
Pho<strong>to</strong>gate set up at the<br />
10 cm mark (this one<br />
does not move)<br />
<strong>Lab</strong>s 1&3 Adapted from Physical <strong>Science</strong> with Computers by Vernier<br />
<strong>Lab</strong> 4 Adapted from Adapted from http://teacher.pas.rochester.edu/PhyInq/Experiments/P03/P03_Average_Speed.html Page 3
Procedure<br />
1. Open the file “4-Average and Instantaneous” from the App$ server in the <strong>Science</strong>/Logger Pro Files folder.<br />
2. Place the first pho<strong>to</strong>gate at the 90 cm mark. Place the second pho<strong>to</strong>gate at the 10 cm mark.<br />
3. Confirm that the height of the pho<strong>to</strong>gate above the track is correct so that the pho<strong>to</strong>gate is unblocked (light off) as it<br />
is positioned above the track, but will give one “block/unblock” event when a car travels through.<br />
4. Determine the overall distance "D" between the centers of the two pho<strong>to</strong>gates. Record the value of D in the in Logger<br />
Pro and on this paper. In Logger Pro, you will only enter distances in the first row.<br />
6. Place the Hot Wheels car at the 95 cm mark. Click and release the car. Once the car has passed through<br />
both pho<strong>to</strong>gates, collection will s<strong>to</strong>p. Record the velocity in your data table. Press CTRL+L <strong>to</strong> s<strong>to</strong>re the latest run on your<br />
graph. If there was something wrong, do not s<strong>to</strong>re the run. Repeat this step two more times.<br />
7. Move the <strong>to</strong>p pho<strong>to</strong>gate <strong>to</strong> the 80 cm mark.<br />
8. Repeat steps 3-6.<br />
9. Continue <strong>to</strong> move the <strong>to</strong>p pho<strong>to</strong>gate closer <strong>to</strong> the bot<strong>to</strong>m pho<strong>to</strong>gate by 10 cm for each test. S<strong>to</strong>p when the<br />
pho<strong>to</strong>gates are 10 centimeters apart.<br />
10. Print your graph.<br />
PRE-LAB QUESTIONS<br />
Manipulated variable: ___________________________ Responding variable: ______________________<br />
Controlled variables (2): ___________________________________________________________________<br />
Hypothesis: If__________________________________________________________________________________, then<br />
__________________________________________________________________________________________, because<br />
__________________________________________________________________________________________________.<br />
Data<br />
Distance between<br />
Pho<strong>to</strong>gates (m)<br />
Average Speed (m/s) Calculated Averages for Each<br />
pho<strong>to</strong>gate distance (m/s)<br />
Trial <strong>#1</strong> Trial #2 Trial #3<br />
<strong>Lab</strong>s 1&3 Adapted from Physical <strong>Science</strong> with Computers by Vernier<br />
<strong>Lab</strong> 4 Adapted from Adapted from http://teacher.pas.rochester.edu/PhyInq/Experiments/P03/P03_Average_Speed.html Page 4
QUESTIONS (on a separate piece of paper, please!)<br />
1. At which pho<strong>to</strong>gate distance do you think you came the closest <strong>to</strong> measuring the instantaneous speed of the car<br />
at the 15 cm mark? What was the velocity at this point?<br />
2. Extrapolate your graph back <strong>to</strong> the y-axis. At what value does the line or curve cross the y-axis ?<br />
3. What experimental situation would the "Y-intercept" represent? Draw a picture.<br />
4. What type of speed would the “Y-intercept” represent…instantaneous or average?<br />
5. What variables can change the instantaneous speed of an object?<br />
6. Are there ways <strong>to</strong> measure instantaneous speed directly, or is instantaneous speed always a value that must be<br />
derived from average speed measurements? Explain.<br />
7. Which of the average speeds that you measured comes closest <strong>to</strong> the average speed of the cart as it moved over<br />
the whole track?<br />
8. Look back at <strong>Lab</strong> <strong>#1</strong> when we measured the velocity of a car with one pho<strong>to</strong>gate. Did that lab come closer <strong>to</strong><br />
measuring average speed or instantaneous speed?<br />
9. Attach your graph <strong>to</strong> this lab. Be sure <strong>to</strong> plot and label where the y-intercept would be. <strong>Lab</strong>el the point you<br />
think best reflects the average speed over the whole track and label the point you think best reflects the<br />
instantaneous speed at point X1.<br />
OBJECTIVES<br />
In this contest, you will<br />
<strong>Lab</strong> #5: Make a Track<br />
• Apply knowledge gained from lab 4 <strong>to</strong> the design of a track with specific guidelines.<br />
• Use a computer <strong>to</strong> measure speed (both instantaneous and average).<br />
Your teacher will provide you with a track. You must shape the track in such a way that the highest instantaneous speed<br />
is not at the end of the track. Your track may not be a simple ramp. You must draw a picture of this track neatly on a<br />
piece of computer paper, labeling the following:<br />
� Placement of a single pho<strong>to</strong>gate <strong>to</strong> determine the instantaneous speed at the point on the track with the<br />
highest instantaneous speed. Show the location by labeling the distance from the start and end of the track <strong>to</strong><br />
the pho<strong>to</strong>gate.<br />
� The instantaneous speed at this point.<br />
� The average speed over the whole track.<br />
� Your placement of two pho<strong>to</strong>gates <strong>to</strong> determine average speed. Show the locations by labeling distances from<br />
the start and end of the track <strong>to</strong> each pho<strong>to</strong>gate.<br />
Your grade on this lab is determined mostly by your drawing. Please take your time on this drawing and make it neat.<br />
Be sure <strong>to</strong> include all required parts. Use colored pencils <strong>to</strong> differentiate between pho<strong>to</strong>gates for average speed and<br />
instantaneous speed. Use the “5-Make a Track” file on the App$ server in the <strong>Science</strong>/Logger Pro folder.<br />
Is your packet ready <strong>to</strong> be turned in?? Turn your lab report in separately (do not attach), but do make sure all of the<br />
packet is filled in (10 pts.), and make sure the following are attached:<br />
� Questions for labs 1 & 4 (5 pts. each)<br />
� Graphs for labs 1 & 4 (with proper labels) (5 pts. each)<br />
� Drawing for lab 5 (15 pts.)<br />
You do not need <strong>to</strong> attach your lab report <strong>to</strong> this packet. Turn it in separately, please!<br />
<strong>Lab</strong>s 1&3 Adapted from Physical <strong>Science</strong> with Computers by Vernier<br />
<strong>Lab</strong> 4 Adapted from Adapted from http://teacher.pas.rochester.edu/PhyInq/Experiments/P03/P03_Average_Speed.html Page 5