The GAMCO Global Telecommunications Fund - Gabelli
The GAMCO Global Telecommunications Fund - Gabelli
The GAMCO Global Telecommunications Fund - Gabelli

You also want an ePaper? Increase the reach of your titles
YUMPU automatically turns print PDFs into web optimized ePapers that Google loves.
<strong>The</strong> <strong>GAMCO</strong> <strong>Global</strong> <strong>Telecommunications</strong> <strong>Fund</strong><br />
Shareholder Commentary – March 31, 2012<br />
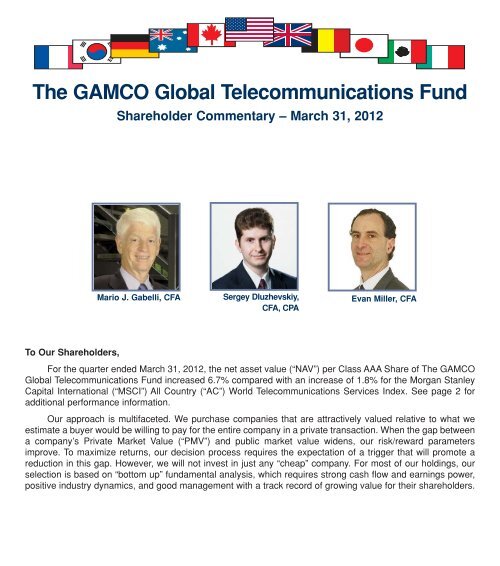
Mario J. <strong>Gabelli</strong>, CFA<br />
Sergey Dluzhevskiy,<br />
CFA , CPA<br />
Evan Miller, CFA<br />
To Our Shareholders,<br />
For the quarter ended March 31, 2012, the net asset value (“NAV”) per Class AAA Share of <strong>The</strong> <strong>GAMCO</strong><br />
<strong>Global</strong> <strong>Telecommunications</strong> <strong>Fund</strong> increased 6.7% compared with an increase of 1.8% for the Morgan Stanley<br />
Capital International (“MSCI”) All Country (“AC”) World <strong>Telecommunications</strong> Services Index. See page 2 for<br />
additional performance information.<br />
Our approach is multifaceted. We purchase companies that are attractively valued relative to what we<br />
estimate a buyer would be willing to pay for the entire company in a private transaction. When the gap between<br />
a company’s Private Market Value (“PMV”) and public market value widens, our risk/reward parameters<br />
improve. To maximize returns, our decision process requires the expectation of a trigger that will promote a<br />
reduction in this gap. However, we will not invest in just any “cheap” company. For most of our holdings, our<br />
selection is based on “bottom up” fundamental analysis, which requires strong cash flow and earnings power,<br />
positive industry dynamics, and good management with a track record of growing value for their shareholders.
Comparative Results<br />
Average Annual Returns through March 31, 2012 (a)<br />
Since<br />
Inception<br />
Quarter 1 Year 5 Year 10 Year (11/1/93)<br />
————— ———— ———— ———— —————<br />
Class AAA (GABTX) . . . . . . . . . . . . . . . . . . . . . . . . . . . . 6.67% (5.70)% (1.55)% 6.20% 7.60%<br />
MSCI AC World Telecommunication Services Index . . . . 1.83 (7.91) (3.09) 2.01 N/A<br />
MSCI AC World Free Index . . . . . . . . . . . . . . . . . . . . . . . 11.96 (0.28) 0.29 5.80 4.36(e)<br />
Class A (GTCAX) . . . . . . . . . . . . . . . . . . . . . . . . . . . . . . 6.67 (5.72) (1.54) 6.21 7.61<br />
With sales charge (b) . . . . . . . . . . . . . . . . . . . . . . . . . . . . 0.54 (11.14) (2.70) 5.59 7.26<br />
Class B (GTCBX) . . . . . . . . . . . . . . . . . . . . . . . . . . . . . . 6.38 (6.46) (2.31) 5.39 7.09<br />
With contingent deferred sales charge (c) . . . . . . . . . . . . 1.38 (11.14) (2.70) 5.39 7.09<br />
Class C (GTCCX) . . . . . . . . . . . . . . . . . . . . . . . . . . . . . . 6.46 (6.37) (2.29) 5.40 7.09<br />
With contingent deferred sales charge (d) . . . . . . . . . . . 5.46 (7.31) (2.29) 5.40 7.09<br />
Class I (GGTIX) . . . . . . . . . . . . . . . . . . . . . . . . . . . . . . . 6.73 (5.46) (1.33) 6.32 7.67<br />
In the current prospectus dated April 27, 2012, the expense ratios for Class AAA, A, B, C, and I Shares are<br />
1.61%, 1.61%, 2.36%, 2.36%, and 1.36%, respectively. Class AAA and Class I Shares do not have a sales charge.<br />
<strong>The</strong> maximum sales charge for Class A, B, and C Shares is 5.75%, 5.00%, and 1.00%, respectively.<br />
(a) Returns represent past performance and do not guarantee future results. Total returns and average annual<br />
returns reflect changes in share price, reinvestment of distributions, and are net of expenses. Investment returns<br />
and the principal value of an investment will fluctuate. When shares are redeemed, they may be worth more or less<br />
than their original cost. <strong>The</strong> <strong>Fund</strong> imposes a 2% redemption fee on shares sold or exchanged within seven days<br />
after the date of purchase. Current performance may be lower or higher than performance data presented.<br />
Performance returns for periods of less than one year are not annualized. Visit www.gabelli.com for performance<br />
information as of the most recent month end. Investors should carefully consider the investment objectives,<br />
risks, charges, and expenses of the <strong>Fund</strong> before investing. <strong>The</strong> prospectus contains information about<br />
these and other matters and should be read carefully before investing. Investing in foreign securities involves<br />
risks not ordinarily associated with investments in domestic issues, including currency fluctuation, economic, and<br />
political risks. <strong>The</strong> Class AAA Share NAVs per share are used to calculate performance for the periods prior to the<br />
issuance of Class A Shares, Class B Shares, Class C Shares, and Class I Shares on March 12, 2000, March 13,<br />
2000, June 2, 2000, and January 11, 2008, respectively. <strong>The</strong> actual performance for the Class B Shares and Class<br />
C Shares would have been lower due to the additional expenses associated with these classes of shares. <strong>The</strong><br />
MSCI AC World Telecommunication Services Index is an unmanaged index that measures the performance of the<br />
global telecommunication securities from around the world. <strong>The</strong> MSCI AC World Free Index is a free float adjusted<br />
market capitalization weighted index that is designed to measure the equity market performance of developed and<br />
emerging markets. <strong>The</strong> MSCI AC World Free Index consists of 45 country indices comprising 24 developed and 21<br />
emerging market country indices. Dividends are considered reinvested. You cannot invest directly in an index.<br />
(b) Performance results include the effect of the maximum 5.75% sales charge at the beginning of the period.<br />
(c) Assuming payment of the maximum contingent deferred sales charge (“CDSC”). <strong>The</strong> maximum CDSC for Class B<br />
Shares is 5% which is gradually reduced to 0% after six years.<br />
(d) Assuming payment of the 1% maximum CDSC imposed on redemptions made within one year of purchase.<br />
(e) MSCI AC World Free Index performance are as of inception of the indices since October 29, 1993.<br />
2
<strong>Global</strong> Allocation<br />
<strong>The</strong> accompanying chart presents the<br />
<strong>Fund</strong>’s holdings by geographic region as of<br />
March 31, 2012. <strong>The</strong> geographic allocation will<br />
change based on current global market<br />
conditions. Countries and/or regions represented<br />
in the chart and below may or may not be<br />
included in the <strong>Fund</strong>’s future portfolio.<br />
HOLDINGS BY GEOGRAPHIC REGION<br />
North America 44.7%<br />
Europe 29.7%<br />
Asia/Pacific 10.1%<br />
Latin America 9.8%<br />
Japan 4.1%<br />
Africa/Middle East 1.6%<br />
Industry Allocation<br />
<strong>The</strong> accompanying chart depicts the <strong>Fund</strong>’s<br />
holdings by industry sector as of March 31, 2012.<br />
Industry sectors represented in the chart and<br />
below may or may not be included in the <strong>Fund</strong>’s<br />
future portfolio.<br />
Performance Discussion<br />
Diversified<br />
<strong>Telecommunications</strong> 48.2%<br />
<strong>The</strong> <strong>GAMCO</strong> <strong>Global</strong> <strong>Telecommunications</strong> <strong>Fund</strong> gained 6.7% in the first quarter, more than a 470 basis<br />
point outperformance of the MSCI AC World Telecommunication Services Index, which was up by 1.8% in the<br />
period. <strong>The</strong> solid start to 2012 for the <strong>Global</strong> <strong>Telecommunications</strong> <strong>Fund</strong> maintains the strong sequential<br />
outperformance trend set in the fourth quarter of 2011, and provides an encouraging foundation for the year.<br />
Once again, the pattern of the telecommunications sector underperforming broader equity markets was<br />
evident in the first quarter. <strong>The</strong> difference this time was in the degree of underperformance: While global<br />
markets experienced their strongest rally in nearly four years with the MSCI World Index ahead by 12.0%, the<br />
telecoms group barely participated in the rally driven heavily by financial services and technology. Indeed, in<br />
Euro terms, the European Telecom Index declined by 2.8% in the first quarter (unchanged in USD terms),<br />
against the 8.0% gain for the broader European index. But as in the fourth quarter, it was again the case that<br />
the telecom sector underperformed across all geographies, with the most substantial relative<br />
underperformance having been recorded in Japan.<br />
<strong>The</strong> very weak performance of the European telecom group in the first quarter should perhaps not come<br />
as a surprise. <strong>The</strong> year-end 2011 reporting season was accompanied by dividend cuts and profit warnings from<br />
some of the largest operators. Current returns, which had reached historically high levels relative to<br />
government bonds at the end of 2011, were no longer acting to underpin sector valuations. Both mobile and<br />
fixed line revenue growth deteriorated sequentially in the first quarter, resulting in year-on-year declines of 4.7%<br />
and 4.4%, respectively. <strong>The</strong> continued pressure on top line results is owing to the combination of weak macro<br />
conditions (particularly in southern Europe), intense regulator pressures and price competition. We would note<br />
that even absent the regulatory impacts in the first quarter, European mobile revenue would have still seen a<br />
1.6% decline as modest usage gains were negated by price declines, and data revenue growth was insufficient<br />
to offset the decline in traditional revenues. Regulatory intervention, unfortunately, shows no signs of abating.<br />
<strong>The</strong> EU continues to press for cuts in mobile termination rates and international roaming rates and has been<br />
successful in pressing national regulators to fall in line. At the same time, the Commission is exerting pressure<br />
on incumbent operators to rapidly deploy fiber optic networks that will support ultra-high broadband connectivity<br />
for businesses and consumers.<br />
3<br />
HOLDINGS BY INDUSTRY SECTOR<br />
Wireless<br />
<strong>Telecommunications</strong> 30.4%<br />
Other 21.4%
Clearly the first quarter performance for the telecoms sector would have been weaker still, were it not for<br />
the gains delivered by emerging market operators. In Latin America, the regional telecommunications index<br />
gained 12.6% in the first quarter, though still trailing the broader Latin American Index gain of 14.7%. In Asia,<br />
excluding Japan, the telecom sector was ahead by 5.7%, despite China lagging. In much of the emerging<br />
world, macro conditions remain supportive, driving mobile usage gains and traditional voice and messaging.<br />
Moreover, many emerging markets are only just beginning to see the benefit of data in the form of 3G<br />
deployments and smartphones, in a trend that should be sustainable for the foreseeable future. Finally,<br />
emerging market operators remain justifiably positive on their ability to drive increasing average revenue per<br />
user (ARPU) through the introduction of financial services such as money transfer in markets where banking<br />
remains poorly developed.<br />
In examining first quarter outperformance of the <strong>Global</strong> <strong>Telecommunications</strong> <strong>Fund</strong>, five of the ten top<br />
contributors to performance operate in emerging markets. With a gain of 115.2%, Cable & Wireless Worldwide<br />
(0.9% of net assets as of March 31, 2012) was the largest percentage gainer in the <strong>Fund</strong> after the<br />
announcement that Vodafone (1.4%) and subsequently Tata Communications of India were exploring the<br />
possible acquisition of the company. In emerging markets, Orascom Telecom (0.6%), with operations in the<br />
Middle East and Asia, jumped by 78.8% and its controlling shareholder, VimpelCom (2.1%), gained 17.9% as<br />
the market gained conviction that the firm would receive a fair market price for the forced sale of its operation<br />
to the Algerian government. Other emerging market top contributors included America Movil (3.7%) (+9.9%),<br />
Millicom (2.6%) (+12.4%), and TIM Participacoes (1.3%) (+29.0%), all of whom are mobile operators in Latin<br />
America, where they continue to see growth. In the U.S., the list of top contributors was headed by Cincinnati<br />
Bell (2.3%) with a gain of 32.7% in the first quarter. <strong>The</strong> catalyst was an early February announcement that<br />
management will pursue evaluation of structural, capital, and financial alternatives for its data center business<br />
that may include no changes, a partial separation through a sale, an initial public offering, or a full separation.<br />
Other U.S.-listed names amongst the top contributors included Liberty <strong>Global</strong> (2.9%) (+22.1%), DISH Network<br />
(2.7%) (+15.6%), and DIRECTV (4.1%) (+15.4%). Here, our exposure to alternative network operators and<br />
content distributors has been a significant factor in the <strong>Fund</strong> outperformance.<br />
<strong>The</strong> list of negative contributors to the first quarter performance is far more geographically diverse than<br />
the positive list. In Europe, Vivendi (1.4%) of France heads the list with a decline of 16.6% in the period. At least<br />
a portion of this move can be attributed to the December launch of a fourth wireless operator in the French<br />
market Iliad (0.2%) competing with Vivendi’s SFR unit. Telefonica (3.6%) in Spain declined a further 4.5% in<br />
the first quarter as the after effects of its dividend cut, combined with a deservedly cautious outlook for the<br />
domestic market in 2012, delivered with fourth quarter results. Both NTT (–10.7%) and its wireless subsidiary<br />
NTT DoCoMo (1.2%) (–7.4%) of Japan negatively impacted <strong>Fund</strong> performance, due primarily to the currency<br />
effect of the falling Yen from the beginning of February to the end of the quarter. One exception to the strong<br />
Latin American showing in the period was NII Holdings (0.8%) (–14.0%), as the company announced weaker<br />
than expected fourth quarter results and indicated that it will have to delay the start dates for 3G network<br />
launches. As a result, 3G is now expected to be available in Mexico in late third quarter and in Brazil by the<br />
end of 2012.<br />
4
Let’s Talk Stocks<br />
<strong>The</strong> following are stock specifics on selected holdings of our <strong>Fund</strong>. Favorable earnings prospects do not<br />
necessarily translate into higher stock prices, but they do express a positive trend that we believe will develop<br />
over time. Individual securities mentioned are not necessarily representative of the entire portfolio. For the<br />
following holdings, the percentage of net assets and their share prices stated in U.S. dollars or U.S. dollar<br />
equivalent terms are presented as of March 31, 2012.<br />
AboveNet, Inc. (0.5% of net assets as of March 31, 2012) (ABVT - $82.80 - NYSE) is a facilities-based provider<br />
of high bandwidth connectivity solutions for businesses and carriers. ABVT provides services in 17 markets in<br />
the U.S. and 4 markets in Europe through fiber networks in metro markets, its long haul network connecting<br />
those markets, and its IP network. ABVT’s metro market networks span over 2.2 million fiber miles, over 9,000<br />
cable route miles, and connect over 3,100 buildings in the U.S. and the U.K. ABVT’s long haul network spans<br />
over 13,000 cable route miles. On March 19, 2012, AboveNet agreed to be acquired by privately owned Zayo<br />
Group, LLC, a national provider of fiber-based bandwidth infrastructure and network-neutral colocation and<br />
interconnection services, for $84 per share in cash. <strong>The</strong> deal valued ABVT at approximately $2.2 billion or 9.2x<br />
2012 estimated EBITDA and is expected to close in mid 2012.<br />
América Móvil, S.A. de C.V. (3.7%) (AMX - $24.83 - NYSE) is Latin America’s largest wireless company,<br />
serving 241.8 million wireless customers. It also serves 29.4 million landlines, 15.1 million broadband<br />
connections, and 13.4 million Pay TV clients in Latin America. In August 2011, America Movil announced a<br />
tender offer (MxP $10.50 per share) for all of the outstanding shares of Telmex that were not already owned,<br />
directly or indirectly, by AMX (the company owned 60% of Telmex at the time of the announcement). AMX<br />
believes that with this transaction it will be in a position to provide better conditions and more advanced telecom<br />
services to its customers in Mexico. In November 2011, AMX announced final results of the tender offer, noting<br />
that it owned approximately 93% of Telmex.<br />
Cable & Wireless Worldwide plc (0.9%) (CW/ LM - $0.54 - London Stock Exchange) provides voice, data,<br />
hosting, and IP services to a customer base mainly comprised of large corporations, multinationals,<br />
government entities, and other carriers and resellers. Although most of the CWW business is UK based, the<br />
company also has a presence in Asia, India, the Middle East, Europe, and North America. Cable & Wireless<br />
Worldwide suffered a series of missteps in its short history as a separately listed entity (since March 2010),<br />
including four sequential profit warnings. With first-half fiscal 2012 results released in November 2011 the<br />
company delivered weak operating performance, suspended the dividend, and announced the departure<br />
(again) of CEO John Pluthero. <strong>The</strong> stock dropped 26% on the day, and just over a week later reached an<br />
intraday low of 13.0p, a decline of 57% from the pre-results price. On February 13, 2012, Vodafone confirmed<br />
press reports that it was considering an all-cash takeover offer for CWW. This resulted in a 28% gain in the<br />
share price as the market focused on the potential price Vodafone would be willing to pay for the asset. Some<br />
two weeks later, CWW shares rallied a further 18% on news that Tata Communications of India was considering<br />
a competing bid. After the original deadline for a formal offer expired on March 29, both Vodafone and Tata now<br />
have until April 19 to either table firm offers or walk away from the process. We continue to believe that CWW’s<br />
extensive domestic (20,500 kilometers) and international (425,000 kilometers) fiber networks plus 6,000<br />
customers generating nearly £2.2 billion in revenue, makes CWW an attractive target.<br />
5
Cincinnati Bell Inc. (2.3%) (CBB - $4.02 - NYSE) is a full-service regional provider of data and voice<br />
communications services over wireline and wireless networks in the Greater Cincinnati and Dayton, Ohio<br />
areas, serving 621,000 access lines, 257,000 broadband connections, and 459,000 mobile subscribers. CBB<br />
also provides business customers with outsourced data center colocation and related managed services in<br />
state-of-the-art data center facilities, primarily located in Cincinnati, Houston, Dallas, and Austin (the company<br />
operates 20 data centers with 763,000 square feet of space). Cincinnati Bell is also a reseller of information<br />
technology (IT) and telephony equipment. In February 2012, CBB announced that its Board has authorized the<br />
company’s management to pursue evaluation of structural, capital, and financial alternatives for its data center<br />
business. CBB will consider options that may include, among others, operating the Data Center business under<br />
the current structure with no changes, a partial separation through a sale, initial public offering, or other<br />
transaction, or, depending on the value to shareholders, a full separation. <strong>The</strong> evaluation of these alternatives<br />
will include an assessment of the structure that will optimize shareholder value while ultimately leaving<br />
Cincinnati Bell with an appropriate level of debt for its Communications business. This evaluation is expected<br />
to take 6 to 12 months.<br />
Deutsche Telekom AG (2.5%) (DTE GR - $12.05 - Frankfurt Stock Exchange) is the incumbent German<br />
telecom provider, with substantial international holdings in Eastern and Southeastern Europe. Following the<br />
decision by AT&T not to pursue the acquisition of Deutsche Telekom T-Mobile USA unit (owing to staunch<br />
regulatory opposition), the business has been tasked with operational turnaround and the technology upgrade<br />
of the network. <strong>The</strong> latter effort is aimed at enabling T-Mobile USA to introduce LTE service covering nearly 200<br />
million people by 2013. In parallel, Deutsche Telekom is believed to be continuing to consider strategic options<br />
for the U.S. business. In the domestic German market, DT is beginning to make good progress with its TV<br />
product after an admittedly slow start and successfully defending its 45% broadband market share against<br />
cable and other alternative operators. Although DT’s fiber-to-the-home (FTTH) network currently only covers<br />
less than 10% of German households, the strong desire by the government to see this ratio increase should<br />
translate into regulatory and political support. Finally, continued aggressive cost cutting measures are<br />
succeeding in sustaining domestic margins, even in view of continued pricing pressure in traditional telephony.<br />
Deutsche Telekom trades at an attractive multiple of 4.6x 2012 EBITDA with a current return of 7.8%.<br />
DIRECTV (4.1%) (DTV - $49.34 - Nasdaq) is the largest pay television provider in the world, with over nineteen<br />
million subscribers in the U.S. and eight million throughout Latin America. Originally part of General Motors,<br />
DTV used its technological advantage, a focus on high income customers, recognition of the necessity for<br />
superior customer service, and clever (Sunday Ticket) participation in exclusive sports programming to cement<br />
its position in the U.S. <strong>The</strong> company used essentially the same strategy in Latin America, where it is benefiting<br />
from the growth of the middle class in countries such as Brazil and Colombia. Atop a superior operating<br />
business, DTV has layered a capital structure that maximizes equity returns. <strong>The</strong> company has used modest<br />
leverage to repurchase stock, in the process cutting its shares outstanding by more than half over the last three<br />
years. We expect CEO Mike White to continue on this path for the foreseeable future.<br />
DISH Network Corp. (2.7%) (DISH - $32.93 - Nasdaq) is the third largest pay TV provider in the U.S., with<br />
nearly 14 million subscribers. As a satellite operator unburdened by local franchising requirements and wired<br />
plant, DISH can market and deliver video extremely efficiently across the entire country. Under the leadership<br />
of Charlie Ergen, founder and owner of approximately 54% of company shares, DISH has explored options for<br />
adding mobility to its service offerings, including through the acquisition of spectrum. <strong>The</strong> company has begun<br />
to integrate its 2011 acquisition of the Blockbuster DVD “rentail” chain by enriching its basic offering with a DVD<br />
and on-demand movie service. Ultimately, we believe DISH could make an attractive acquisition target for a<br />
traditional telecom operator.<br />
6
Liberty <strong>Global</strong> Inc. (2.9%) (LBTYA - $50.08 - Nasdaq; LBTYK - $47.89 - Nasdaq) is the leading international<br />
cable operator, offering advanced video, telephone, and broadband internet services. <strong>The</strong> company operates<br />
broadband communications networks in 14 countries principally located in Europe operating under the brands<br />
UPC, Unitymedia (Germany), Cablecom (Switzerland), Telenet (Belgium), VTR (Chile), and AUSTAR<br />
(Australia). Liberty <strong>Global</strong>’s operations also include significant media and programming businesses such as<br />
Chellomedia, a world class multimedia content provider based in Europe. <strong>The</strong> company is internationally<br />
focused and well positioned to capitalize on the growing demand for digital television, broadband internet, and<br />
digital telephony (VoIP) services in markets across its diverse geographic footprint. In a continued effort to<br />
sharpen its focus on Western Europe, Liberty has agreed, pending regulatory approval, to sell its controlling<br />
stake in AUSTAR (less than 0.02%).<br />
NII Holdings, Inc. (0.8%) (NIHD - $18.31 - Nasdaq) is a wireless carrier focused primarily on business<br />
customers in Latin America. NIHD serves 10.7 million customers in Brazil, Mexico, Argentina, Peru, and Chile,<br />
utilizing iDEN and WCDMA network technologies. In May 2011, the company held an analyst and investor<br />
meeting in Lima, Peru, where it successfully demonstrated that its push-to-talk (PTT) technology works over<br />
WCDMA (3G), with no noticeable difference in latency or call quality between iDEN and WCDMA PTT<br />
experience. Management also provided aggressive five year revenue, EBITDA, and subscriber growth targets.<br />
NII expects to grow its subscriber base by more than 2.5 times over the next five years and more than double<br />
revenues and EBITDA over the same period. In February 2012, NIHD indicated that it will have to somewhat<br />
push out the start dates for 3G commercial network launches as it was experiencing construction-related delays<br />
(e.g. pace of site acquisition, delays in construction equipment delivery, etc.). As a result, based on an updated<br />
timetable, 3G is expected to be made available in Mexico in late third quarter and in Brazil by the end of 2012.<br />
While positive catalysts are unlikely until the second half of the year, NIHD’s longer-term growth prospects<br />
remain intact. NII is trading at under 4x 2012 estimated EBITDA and at a significant discount to its private<br />
market value. <strong>The</strong> company is a likely long-term acquisition target for larger carriers or private equity firms,<br />
given its strong brand name in Latin America and valuable (predominantly postpaid) customer base.<br />
Rogers Communications Inc. (2.9%) (RCI - $39.70 - NYSE) is one of the few companies in North America to<br />
offer consumers the “Quadruple Play” of video, high speed data, and fixed and wireless telephony through a<br />
wholly owned plant. <strong>The</strong> company, founded by late telecom pioneer Ted Rogers, is Canada’s largest cable and<br />
wireless company. As the largest spectrum owner in North America, Rogers is aggressively deploying the next<br />
generation of wireless services. Rogers also has a substantial media business that operates radio stations,<br />
television networks (including <strong>The</strong> Shopping Channel), magazines, and trade publications, and the Toronto<br />
Blue Jays baseball team. In December 2011, the company increased its presence in the lucrative sports market<br />
by purchasing a stake in the parent of the Toronto Maple Leafs (NHL) and Raptors (NBA). Prior investments<br />
and acquisitions, combined with significant operational improvements, have positioned Rogers for cash flow<br />
growth for the next several years.<br />
Telefonica SA (3.6%) (TEF SM - $16.41 and $16.38 - Madrid Stock Exchange) has telecommunications<br />
businesses spanning Europe and Latin America, which constitutes 43% of group revenue. In the fourth quarter,<br />
Telefonica reported a 0.5% decline in organic revenue, driven largely by a recovery in Latin America. Here, a<br />
top line gain of 5.3% came as a result of strong performance in the Brazilian mobile business (Vivo), and fixed<br />
line gains in Argentina and Peru. In order for Telefonica to achieve its 2012 guidance of at least 1% group<br />
revenue growth, Latin America will have to continue growing at a comparable rate to the fourth quarter, owing<br />
to the expected weakness in Spain and limited, if any, growth in the rest of Europe. In Spain, Telefonica has<br />
7
ecome much more aggressive on price, in an effort to slow market share erosion in both fixed and wireless.<br />
<strong>The</strong> initiatives and promotions in broadband introduced in the second half of 2011 are already showing benefits<br />
in terms of market share stabilization, although at the expense of top line performance. In mobile, new tariff<br />
plans were introduced late in the year. While these could stem market share losses, the very weak macro<br />
conditions in Spain are hurting mobile metrics. In the fourth quarter, Telefonica saw mobile traffic decline by 7%<br />
and service revenue fell by 12.9%. In Europe, Telefonica (O2) performance has been mixed, with disappointing<br />
margins in the UK, but strong share gains and top line performance in Germany. Concerns about the economic<br />
environment in Spain, coupled with the dividend cut announced in December have driven Telefonica shares to<br />
levels not seen in more than a decade. <strong>The</strong> stock trades at 5.2x 2012 EBITDA and still carries a current return<br />
of 10.8%.<br />
Telephone & Data Systems, Inc. (2.6%) (TDS - $23.15 - NYSE), based in Chicago, IL, is a telecommunications<br />
company primarily with wireless and rural local exchange wireline operations. <strong>The</strong> company’s 84% owned<br />
subsidiary, U.S. Cellular Corporation (3.8%), is the seventh largest wireless operator in the United States,<br />
providing service to 5.9 million subscribers. TDS Telecom, the wireline unit, serves 1.1 million access line<br />
equivalents in 30 states (largest presence in Wisconsin and Michigan). In August 2011, TDS announced a plan<br />
to reclassify Special Common shares into Common shares without changing voting control (i.e. “freezing”<br />
voting power of Series A and Common Shares at current levels). <strong>The</strong> company believes that the above plan<br />
should simplify TDS capital structure, improve liquidity, and provide TDS with greater financial flexibility. After<br />
the company failed to receive majority of non-affiliated common shareholder votes for the original plan, it<br />
revised the exchange ratio under the share reclassification proposal to 1.087 common shares for each old<br />
common share (previously, TDS proposed to exchange each old common and special common share into one<br />
new common share). <strong>The</strong> revised share reclassification proposal was approved by shareholders on January 13,<br />
2012 and special common shares stopped trading on NYSE on January 25, 2012.<br />
Verizon Communications Inc. (3.6%) (VZ - $38.23 - NYSE) is one of the world’s leading telecommunications<br />
services companies, serving 24.1 million access lines and 8.7 million broadband connections. VZ also owns a<br />
controlling 55% interest in Verizon Wireless, the largest wireless carrier in the United States with 109 million<br />
mobile customers. <strong>The</strong> company is focused on building on its wireless broadband, FiOS, and global internet<br />
backbone networks by putting together unique, integrated solutions that can be delivered to any device, giving<br />
customers new ways to manage their digital lives and transforming how businesses operate. Verizon Wireless<br />
plans to complete its nationwide build-out of 4G LTE by mid-2013 (at 12/31/11, it reached 200 million people in<br />
195 markets with LTE). In December 2011, Verizon Wireless agreed to acquire 122 Advanced Wireless<br />
Services (AWS) spectrum licenses from a consortium of cable companies (Comcast (0.3%), Time Warner<br />
Cable (0.3%), and Bright House Networks) for $3.6 billion. <strong>The</strong> companies also announced that they have<br />
entered into several agreements focused on re-selling one another’s products, and, over time, the cable<br />
companies will have the option of selling Verizon Wireless’ service on a wholesale basis.<br />
8
Conclusion<br />
As we stated at the conclusion of 2011, ‘While sub-par economic growth looks set to continue in Europe<br />
in 2012, the apparent decoupling of the U.S. market and American telcos from their European peers may offer<br />
a clue for the Telecom <strong>Fund</strong>’s geographic bias in 2012.’ What has also become apparent thus far in 2012 is<br />
that the growth in emerging markets may offer a useful means to drive <strong>Fund</strong> outperformance. Finally, we will<br />
seek those names in the universe that look best positioned to capitalize on the continued dramatic gains in<br />
mobile data around the world. 2012 will see major strides in fourth generation, LTE network deployment which<br />
could act as a catalyst for those operators that can capture and monetize the insatiable demand for data.<br />
April 4, 2012<br />
Sincerely,<br />
<strong>The</strong> <strong>GAMCO</strong> <strong>Global</strong> <strong>Telecommunications</strong> <strong>Fund</strong><br />
Portfolio Management Team<br />
Top Ten Holdings (Percent of Net Assets)<br />
March 31, 2012<br />
DIRECTV 4.1%<br />
United States Cellular Corp. 3.8%<br />
América Móvil S.A.B de C.V., Cl. L, ADR 3.7%<br />
Telefonica SA 3.6%<br />
Verizon Communications Inc. 3.6%<br />
Rogers Communications Inc. 2.9%<br />
Liberty <strong>Global</strong> Inc. 2.9%<br />
DISH Network Corp. 2.7%<br />
AT&T Inc. 2.6%<br />
Millicom International Cellular SA 2.6%<br />
Note: <strong>The</strong> views expressed in this Shareholder Commentary reflect those of the Portfolio Managers only<br />
through the end of the period stated in this Shareholder Commentary. <strong>The</strong> Portfolio Managers’ views are<br />
subject to change at any time based on market and other conditions. <strong>The</strong> information in this Portfolio Managers’<br />
Shareholder Commentary represents the opinions of the individual Portfolio Managers and is not intended to<br />
be a forecast of future events, a guarantee of future results, or investment advice. Views expressed are those<br />
of the Portfolio Managers and may differ from those of other portfolio managers or of the Firm as a whole. This<br />
Shareholder Commentary does not constitute an offer of any transaction in any securities. Any<br />
recommendation contained herein may not be suitable for all investors. Information contained in this<br />
Shareholder Commentary has been obtained from sources we believe to be reliable, but cannot be guaranteed.<br />
9
Portfolio Manager Compensation<br />
Mr. <strong>Gabelli</strong>’s incentive-based, variable compensation structure and dollar amount have been fully<br />
disclosed each year since April of 2000 in <strong>GAMCO</strong> Investors, Inc.’s (NYSE: GBL) annual proxy statement.<br />
Mr. <strong>Gabelli</strong> receives no base salary, no annual bonus, and no options.<br />
As founder and team portfolio manager of <strong>The</strong> <strong>GAMCO</strong> <strong>Global</strong> <strong>Telecommunications</strong> <strong>Fund</strong>, Mr. <strong>Gabelli</strong><br />
received $265,331 in calendar 2011. Starting in November 1993, the <strong>Fund</strong>’s first year of operation, Mr. <strong>Gabelli</strong><br />
received less than $155,000. As beneficial owner, he had $72,152 invested in <strong>The</strong> <strong>GAMCO</strong> <strong>Global</strong><br />
<strong>Telecommunications</strong> <strong>Fund</strong> as of December 31, 2011, which includes the holdings of GGCP Inc., GBL’s parent<br />
holding company.<br />
Minimum Initial Investment – $1,000<br />
<strong>The</strong> <strong>Fund</strong>’s minimum initial investment for regular accounts is $1,000. <strong>The</strong>re are no subsequent<br />
investment minimums. No initial minimum is required for those establishing an Automatic Investment Plan.<br />
Additionally, the <strong>Fund</strong> and other <strong>Gabelli</strong>/<strong>GAMCO</strong> <strong>Fund</strong>s are available through the no-transaction fee programs<br />
at many major brokerage firms. <strong>The</strong> <strong>Fund</strong> imposes a 2% redemption fee on shares sold or exchanged within<br />
seven days after the date of purchase. See the prospectus for more details.<br />
www.gabelli.com<br />
Please visit us on the Internet. Our homepage at www.gabelli.com contains information about <strong>GAMCO</strong><br />
Investors, Inc., the <strong>Gabelli</strong>/<strong>GAMCO</strong> Mutual <strong>Fund</strong>s, IRAs, 401(k)s, current and historical quarterly reports,<br />
closing prices, and other current news. We welcome your comments and questions via e-mail at<br />
info@gabelli.com.<br />
<strong>The</strong> <strong>Fund</strong>’s daily net asset value is available in the financial press and each evening after 7:00 PM<br />
(Eastern Time) by calling 800-GABELLI (800-422-3554). <strong>The</strong> <strong>Fund</strong>’s Nasdaq symbol is GABTX for Class AAA<br />
Shares. Please call us during the business day, between 8:00 AM – 7:00 PM (Eastern Time), for further<br />
information.<br />
You may sign up for our e-mail alerts at www.gabelli.com and receive early notice of quarterly report<br />
availability, news events, media sightings, and mutual fund prices and performance.<br />
Multi-Class Shares<br />
<strong>The</strong> <strong>GAMCO</strong> <strong>Global</strong> Series <strong>Fund</strong>s, Inc. began offering additional classes of <strong>Fund</strong> shares in March 2000.<br />
Class AAA Shares are no-load shares offered directly through selected broker/dealers. Class A and Class C<br />
Shares are targeted to the needs of investors who seek advice through financial consultants. Class I Shares<br />
are available solely to certain institutions, directly through the <strong>Fund</strong>’s distributor or brokers that have entered<br />
into selling agreements specifically with respect to Class I Shares. <strong>The</strong> minimum initial investment amount for<br />
Class I Shares is $500,000. <strong>The</strong> Board of Directors determined that expanding the types of <strong>Fund</strong> shares<br />
available through various distribution options will enhance the ability of the <strong>Fund</strong> to attract additional investors.<br />
10
Mandatory Cost Basis Reporting<br />
As part of the Emergency Economic Stabilization Act of 2008, mutual fund companies will be required to<br />
report cost basis information for taxable accounts to the Internal Revenue Service for any sale of mutual<br />
fund shares acquired after the effective date of January 1, 2012. Further information about Cost Basis<br />
Reporting can be found on our website at www.gabelli.com.<br />
We have separated the portfolio managers’ commentary from the financial statements and investment<br />
portfolio due to corporate governance regulations stipulated by the Sarbanes-Oxley Act of 2002. We have<br />
done this to ensure that the content of the portfolio managers’ commentary is unrestricted. <strong>The</strong> financial<br />
statements and investment portfolio are mailed separately from the commentary. Both the commentary and<br />
the financial statements, including the portfolio of investments, are available on our website at<br />
www.gabelli.com.<br />
11
<strong>GAMCO</strong> <strong>Global</strong> Series <strong>Fund</strong>s, Inc.<br />
<strong>The</strong> <strong>GAMCO</strong> <strong>Global</strong> <strong>Telecommunications</strong> <strong>Fund</strong><br />
One Corporate Center<br />
Rye, New York 10580-1422<br />
800-GABELLI<br />
800-422-3554<br />
fax: 914-921-5118<br />
website: www.gabelli.com<br />
e-mail: info@gabelli.com<br />
Net Asset Value per share available daily by calling<br />
800-GABELLI after 7:00 P.M.<br />
E<br />
M P PS<br />
V<br />
MANAGEMENT<br />
CASH FLOW<br />
R E S E A R C H<br />
Board of Directors<br />
Mario J. <strong>Gabelli</strong>, CFA<br />
Chairman and Chief<br />
Executive Officer<br />
<strong>GAMCO</strong> Investors, Inc.<br />
John D. <strong>Gabelli</strong><br />
Senior Vice President<br />
<strong>Gabelli</strong> & Company, Inc.<br />
E. Val Cerutti Werner J. Roeder, MD<br />
Chief Executive Officer<br />
Medical Director<br />
Cerutti Consultants, Inc. Lawrence Hospital<br />
Anthony J. Colavita<br />
President<br />
Anthony J. Colavita, P.C.<br />
Arthur V. Ferrara<br />
Former Chairman and<br />
Chief Executive Officer<br />
Guardian Life Insurance<br />
Company of America<br />
Officers<br />
Bruce N. Alpert<br />
President, Secretary, and<br />
Acting Chief Compliance Officer<br />
Anthonie C. van Ekris<br />
Chairman<br />
BALMAC International, Inc.<br />
Salvatore J. Zizza<br />
Chairman<br />
Zizza & Associates Corp.<br />
Agnes Mullady<br />
Treasurer<br />
<strong>The</strong><br />
<strong>GAMCO</strong><br />
<strong>Global</strong><br />
<strong>Telecommunications</strong><br />
<strong>Fund</strong><br />
Custodian, Transfer Agent, and Dividend Agent<br />
State Street Bank and Trust Company<br />
Distributor<br />
G.distributors, LLC<br />
Legal Counsel<br />
Skadden, Arps, Slate, Meagher & Flom LLP<br />
This report is submitted for the general information of the<br />
shareholders of <strong>The</strong> <strong>GAMCO</strong> <strong>Global</strong> <strong>Telecommunications</strong> <strong>Fund</strong>. It is<br />
not authorized for distribution to prospective investors unless<br />
preceded or accompanied by an effective prospectus.<br />
GAB401Q112SC<br />
SHAREHOLDER COMMENTARY<br />
MARCH 31, 2012
<strong>The</strong> <strong>GAMCO</strong> <strong>Global</strong> <strong>Telecommunications</strong> <strong>Fund</strong><br />
First Quarter Report — March 31, 2012<br />
Mario J. <strong>Gabelli</strong>, CFA Sergey Dluzhevskiy, CFA, CPA Evan Miller, CFA<br />
To Our Shareholders,<br />
For the quarter ended March 31, 2012, the net asset value (“NAV”) per Class AAA Share of <strong>The</strong> <strong>GAMCO</strong> <strong>Global</strong> <strong>Telecommunications</strong><br />
<strong>Fund</strong> increased 6.7% compared with an increase of 1.8% for the Morgan Stanley Capital International (“MSCI”) All Country<br />
(“AC”) World <strong>Telecommunications</strong> Services Index.<br />
Enclosed is the schedule of investments as of March 31, 2012.<br />
Comparative Results<br />
Average Annual Returns through March 31, 2012 (a) (Unaudited)<br />
Since<br />
Inception<br />
Quarter 1 Year 5 Year 10 Year (6/30/95)<br />
Class AAA (GABTX) ......................................... 6.67% (5.70)%(1.55)% 6.20% 7.60%<br />
MSCI AC World Telecommunication Services Index .................... 1.83 (7.91) (3.09) 2.01 N/A<br />
MSCI AC World Free Index ..................................... 11.96 (0.28) 0.29 5.80 4.36(e)<br />
Class A (GTCAX). ........................................... 6.67 (5.72) (1.54) 6.21 7.61<br />
With sales charge (b) ......................................... 0.54 (11.14) (2.70) 5.59 7.26<br />
Class B (GTCBX). ........................................... 6.38 (6.46) (2.31) 5.39 7.09<br />
With contingent deferred sales charge (c) ........................... 1.38 (11.14) (2.70) 5.39 7.09<br />
Class C (GTCCX). ........................................... 6.46 (6.37) (2.29) 5.40 7.09<br />
With contingent deferred sales charge (d) ........................... 5.46 (7.31) (2.29) 5.40 7.09<br />
Class I (GGTIX) ............................................. 6.73 (5.46) (1.33) 6.32 7.67<br />
In the current prospectus dated April 27, 2012, the expense ratios for Class AAA, A, B, C, and I Shares are 1.61%, 1.61%, 2.36%, 2.36%, and 1.36%,<br />
respectively. Class AAA and Class I Shares do not have a sales charge. <strong>The</strong> maximum sales charge for Class A, B, and C Shares is 5.75%, 5.00%, and<br />
1.00%, respectively.<br />
(a) Returns represent past performance and do not guarantee future results. Total returns and average annual returns reflect changes in share price,<br />
reinvestment of distributions, and are net of expenses. Investment returns and the principal value of an investment will fluctuate. When shares are redeemed,<br />
they may be worth more or less than their original cost. <strong>The</strong> <strong>Fund</strong> imposes a 2% redemption fee on shares sold or exchanged within seven days after the date<br />
of purchase. Performance returns for periods of less than one year are not annualized. Current performance may be lower or higher than performance data<br />
presented. Visit www.gabelli.com for performance information as of the most recent month end. Investors should carefully consider the investment<br />
objectives, risks, charges, and expenses of the <strong>Fund</strong> before investing. <strong>The</strong> prospectus contains information about these and other matters and<br />
should be read carefully before investing. Investing in foreign securities involves risks not ordinarily associated with investments in domestic issues, including<br />
currency fluctuation, economic, and political risks. <strong>The</strong> Class AAA Share NAVs per share are used to calculate performance for the periods prior to the issuance<br />
of Class A Shares, Class B Shares, Class C Shares, and Class I Shares on March 12, 2000, March 13, 2000, June 2, 2000, and January 11, 2008, respectively.<br />
<strong>The</strong> actual performance for the Class B Shares and Class C Shares would have been lower due to the additional expenses associated with these classes of<br />
shares. <strong>The</strong> MSCI AC World Telecommunication Services Index is an unmanaged index that measures the performance of the global telecommunication<br />
securities from around the world. <strong>The</strong> MSCI AC World Free Index is a free float adjusted market capitalization weighted index that is designed to measure the<br />
equity market performance of developed and emerging markets. <strong>The</strong> MSCI AC World Free Index consists of 45 country indices comprising 24 developed and 21<br />
emerging market country indices. Dividends are considered reinvested. You cannot invest directly in an index.<br />
(b) Performance results include the effect of the maximum 5.75% sales charge at the beginning of the period.<br />
(c) Assuming payment of the maximum contingent deferred sales charge (CDSC). <strong>The</strong> maximum CDSC for Class B Shares is 5% which is gradually reduced to 0%<br />
after six years.<br />
(d) Assuming payment of the 1% maximum CDSC imposed on redemptions made within one year of purchase.<br />
(e) MSCI AC World Free Index performance are as of inception of the indices since October 29, 1993.
<strong>The</strong> <strong>GAMCO</strong> <strong>Global</strong> <strong>Telecommunications</strong> <strong>Fund</strong><br />
Schedule of Investments — March 31, 2012 (Unaudited)<br />
Market<br />
Shares<br />
Value<br />
COMMON STOCKS — 99.2%<br />
DIVERSIFIED TELECOMMUNICATIONS SERVICES — 48.2%<br />
Africa/Middle East — 0.5%<br />
37,000 Maroc Telecom SA .............................. $ 601,542<br />
200,000 Pakistan Telecommunication Co. Ltd.(a).......... 27,157<br />
9,100 Telkom SA Ltd. .................................. 28,471<br />
657,170<br />
Asia/Pacific — 5.0%<br />
225,000 Asia Satellite <strong>Telecommunications</strong> Holdings<br />
Ltd.(b)........................................ 550,508<br />
5,280 Chorus Ltd., ADR† .............................. 79,464<br />
170,000 First Pacific Co. Ltd. ............................. 188,486<br />
9,000 First Pacific Co. Ltd., ADR ....................... 50,040<br />
3,913 HKT Trust and HKT Ltd.† ........................ 3,044<br />
90,000 PCCW Ltd. ...................................... 32,219<br />
36,000 Philippine Long Distance Telephone Co., ADR .... 2,238,840<br />
18,860 PT Telekomunikasi Indonesia, ADR............... 572,590<br />
777,000 Singapore <strong>Telecommunications</strong> Ltd............... 1,947,059<br />
375,000 Telekom Malaysia Berhad ........................ 651,216<br />
1,865,000 True Corp. Public Co. Ltd., Cl. F†................. 205,543<br />
8,075 TT&T Public Co. Ltd., GDR†(a)(b)(c) ............. 242<br />
6,519,251<br />
Europe — 19.3%<br />
11,250 Belgacom SA.................................... 361,676<br />
2,090,000 Cable & Wireless Worldwide plc ................. 1,136,596<br />
110,000 Colt Group SA†.................................. 184,389<br />
273,000 Deutsche Telekom AG, ADR...................... 3,289,650<br />
16,000 Elisa Oyj ........................................ 383,467<br />
25,000 France Telecom SA, ADR ........................ 371,250<br />
3,807 Hellenic <strong>Telecommunications</strong> Organization SA .... 16,197<br />
25,900 Hellenic <strong>Telecommunications</strong> Organization SA,<br />
ADR.......................................... 55,685<br />
2,100 Iliad SA ......................................... 289,321<br />
39,000 Koninklijke KPN NV, ADR ........................ 431,340<br />
30,000 Portugal Telecom SGPS SA ...................... 163,206<br />
30,000 Portugal Telecom SGPS SA, ADR ................ 162,300<br />
9,300 Rostelecom OJSC, ADR† ........................ 272,372<br />
83,600 Sistema JSFC, GDR(d)........................... 1,646,084<br />
100,000 Sonaecom SGPS SA............................. 162,045<br />
40,500 Swisscom AG, ADR.............................. 1,631,340<br />
8,000 Tele2 AB, Cl. B................................... 163,246<br />
860,000 Telecom Italia SpA............................... 1,022,540<br />
21,000 Telecom Italia SpA, ADR ......................... 249,270<br />
281,000 Telefonica SA, ADR .............................. 4,611,210<br />
112,000 Telekom Austria AG.............................. 1,304,344<br />
62,000 Telenor ASA ..................................... 1,149,691<br />
472,000 TeliaSonera AB .................................. 3,291,829<br />
242,000 VimpelCom Ltd., ADR ........................... 2,700,720<br />
25,049,768<br />
Market<br />
Shares<br />
Value<br />
Japan — 0.7%<br />
16,000 Nippon Telegraph & Telephone Corp.............. $ 725,867<br />
10,000 Nippon Telegraph & Telephone Corp., ADR ....... 226,200<br />
952,067<br />
Latin America — 3.7%<br />
37,415,054 Cable & Wireless Jamaica Ltd.(e) ................ 68,988<br />
26,000 Oi SA ........................................... 162,229<br />
16,034 Oi SA, ADR...................................... 254,941<br />
6,490 Oi SA, Cl. C, ADR ................................ 41,082<br />
44 Oi SA, Preference................................ 233<br />
13,500 Tele Norte Leste Participacoes SA ................ 187,696<br />
20,193 Tele Norte Leste Participacoes SA, ADR .......... 229,191<br />
147,000 Telecom Argentina SA, ADR...................... 2,604,840<br />
18,270 Telefonica Brasil SA ............................. 508,231<br />
12,266 Telefonica Brasil SA, ADR........................ 375,708<br />
5,046 Telefonica Brasil SA, Preference.................. 154,328<br />
6,361 Telefonica SA.................................... 104,222<br />
3,355 Telemar Norte Leste SA, Preference, Cl. A ........ 87,594<br />
4,779,283<br />
North America — 19.0%<br />
8,000 AboveNet Inc.† .................................. 662,400<br />
109,000 AT&T Inc. ....................................... 3,404,070<br />
30,000 Atlantic Tele-Network Inc......................... 1,090,800<br />
28,500 CenturyLink Inc.................................. 1,101,525<br />
740,000 Cincinnati Bell Inc.† ............................. 2,974,800<br />
10,000 E.Spire Communications Inc.†(b) ................ 0<br />
25,000 EarthLink Inc. ................................... 199,750<br />
3,600 Equinix Inc.† .................................... 566,820<br />
54,000 General Communication Inc., Cl. A† .............. 470,880<br />
50,000 Internap Network Services Corp.†................ 367,000<br />
22,422 McLeodUSA Inc., Cl. A†(b) ...................... 110<br />
130,000 McLeodUSA Inc., Cl. A, Escrow†(b) .............. 0<br />
27,100 New ULM Telecom Inc. .......................... 210,025<br />
20,000 NorthPoint Communications Group Inc.†......... 8<br />
38,500 Shenandoah <strong>Telecommunications</strong> Co. ............ 429,275<br />
145,843 Telephone & Data Systems Inc. .................. 3,376,256<br />
28,000 TELUS Corp. .................................... 1,624,783<br />
18,000 TELUS Corp., Non-Voting........................ 1,024,111<br />
96,000 tw telecom inc.†................................. 2,127,360<br />
122,000 Verizon Communications Inc. .................... 4,664,060<br />
36,000 Windstream Corp. ............................... 421,560<br />
24,715,593<br />
TOTAL DIVERSIFIED TELECOMMUNICATIONS<br />
SERVICES .................................... 62,673,132<br />
WIRELESS TELECOMMUNICATIONS SERVICES — 29.6%<br />
Africa/Middle East — 1.1%<br />
4,000 Econet Wireless Zimbabwe Ltd. .................. 15,200<br />
21,000 MTN Group Ltd. ................................. 369,628<br />
222,440 Orascom Telecom Holding SAE, GDR†(d) ........ 715,812<br />
See accompanying notes to schedule of investments.<br />
2
<strong>The</strong> <strong>GAMCO</strong> <strong>Global</strong> <strong>Telecommunications</strong> <strong>Fund</strong><br />
Schedule of Investments (Continued) — March 31, 2012 (Unaudited)<br />
Market<br />
Shares<br />
Value<br />
COMMON STOCKS (Continued)<br />
WIRELESS TELECOMMUNICATIONS SERVICES (Continued)<br />
Africa/Middle East (Continued)<br />
222,440 Orascom Telecom Media and Technology Holding<br />
SAE, GDR†(a)(b).............................. $ 266,928<br />
1,367,568<br />
Asia/Pacific — 3.7%<br />
263,000 Axiata Group Berhad............................. 446,418<br />
50,000 China Mobile Ltd., ADR .......................... 2,754,000<br />
56,000 China Unicom Hong Kong Ltd., ADR ............. 940,800<br />
666 Hutchison <strong>Telecommunications</strong> Hong Kong<br />
Holdings Ltd. ................................. 282<br />
4,800 PT Indosat Tbk, ADR ............................ 134,352<br />
38,000 SK Telecom Co. Ltd., ADR ....................... 528,580<br />
200,000 Time dotCom Berhad† ........................... 44,067<br />
4,848,499<br />
Europe — 7.4%<br />
30,000 Bouygues SA.................................... 917,457<br />
309,000 Cable & Wireless Communications plc ........... 159,591<br />
29,800 Millicom International Cellular SA, SDR .......... 3,378,276<br />
12,000 Mobile TeleSystems OJSC, ADR.................. 220,080<br />
103,000 Turkcell Iletisim Hizmetleri A/S, ADR† ............ 1,297,800<br />
99,000 Vivendi SA ...................................... 1,816,829<br />
65,000 Vodafone Group plc, ADR........................ 1,798,550<br />
9,588,583<br />
Japan — 3.0%<br />
365 KDDI Corp....................................... 2,363,658<br />
950 NTT DoCoMo Inc. ............................... 1,577,021<br />
3,940,679<br />
Latin America — 5.8%<br />
194,000 America Movil SAB de CV, Cl. L, ADR ............ 4,817,020<br />
17,500 Grupo Iusacell SA de CV†(b)..................... 0<br />
58,000 NII Holdings Inc.† ............................... 1,061,980<br />
150,000 Tim Participacoes SA ............................ 953,190<br />
23,536 Tim Participacoes SA, ADR ...................... 759,271<br />
7,591,461<br />
North America — 8.6%<br />
113,000 Clearwire Corp., Cl. A†........................... 257,640<br />
44,500 MetroPCS Communications Inc.† ................ 401,390<br />
300 Nextwave Wireless Inc.†......................... 42<br />
96,000 Rogers Communications Inc., Cl. B .............. 3,811,200<br />
620,000 Sprint Nextel Corp.† ............................. 1,767,000<br />
119,200 United States Cellular Corp.†..................... 4,878,856<br />
11,116,128<br />
TOTAL WIRELESS TELECOMMUNICATIONS<br />
SERVICES .................................... 38,452,918<br />
Market<br />
Shares<br />
Value<br />
OTHER — 21.4%<br />
Africa/Middle East — 0.0%<br />
1,009 Kingdom Financial Holdings Ltd., Cl. L†(b) ....... $ 0<br />
504 Meikles Ltd.†.................................... 71<br />
71<br />
Asia/Pacific — 0.5%<br />
19,065 Austar United Communications Ltd.† ............ 28,635<br />
70,000 C.P. Pokphand Co., ADR ......................... 206,500<br />
26,000 Himachal Futuristic Communications,<br />
GDR†(a)(b) ................................... 22,719<br />
4,000(f) Hutchison Port Holdings Trust ................... 3,060<br />
40,000 Hutchison Whampoa Ltd......................... 399,714<br />
250,000 Time Engineering Berhad ........................ 27,338<br />
687,966<br />
Europe — 3.0%<br />
9,000 British Sky Broadcasting Group plc .............. 97,313<br />
1,000 British Sky Broadcasting Group plc, ADR......... 43,280<br />
9,000 E.ON AG ........................................ 215,580<br />
56,000 G4S plc ......................................... 244,082<br />
88,000 GN Store Nord A/S .............................. 939,224<br />
20,000 InterXion Holding NV†........................... 359,000<br />
4,300 Kinnevik Investment AB, Cl. A.................... 100,094<br />
55,500 Kinnevik Investment AB, Cl. B.................... 1,291,068<br />
14,000 Nokia OYJ, ADR ................................. 76,860<br />
16,082 PostNL NV, ADR................................. 98,100<br />
900 Shellshock Ltd.† ................................ 583<br />
21,000 Telegraaf Media Groep NV ....................... 247,337<br />
14,181 TNT Express NV, ADR ........................... 174,426<br />
12,000 Waterloo Investment Holdings Ltd.†(b) .......... 768<br />
4,000 Zon Multimedia Servicos de Telecomunicacoes e<br />
Multimedia SGPS SA.......................... 13,604<br />
8,000 Zon Multimedia Servicos de Telecomunicacoes e<br />
Multimedia SGPS SA, ADR .................... 27,166<br />
3,928,485<br />
Japan — 0.4%<br />
72,000 Furukawa Electric Co. Ltd. ....................... 191,374<br />
21,000 Tokyo Broadcasting System Holdings Inc. ........ 313,084<br />
504,458<br />
Latin America — 0.3%<br />
15,000 Grupo Televisa SA, ADR ......................... 316,200<br />
1,224 Shellproof Ltd.† ................................. 891<br />
317,091<br />
North America — 17.2%<br />
80,000 Adelphia Communications Corp., Cl. A†(b) ....... 0<br />
80,000 Adelphia Communications Corp., Cl. A,<br />
Escrow†(b) ................................... 0<br />
80,000 Adelphia Recovery Trust†........................ 56<br />
24,250 AMC Networks Inc., Cl. A† ....................... 1,082,278<br />
2,100 Ascent Capital Group Inc., Cl. A†................. 99,309<br />
See accompanying notes to schedule of investments.<br />
3
<strong>The</strong> <strong>GAMCO</strong> <strong>Global</strong> <strong>Telecommunications</strong> <strong>Fund</strong><br />
Schedule of Investments (Continued) — March 31, 2012 (Unaudited)<br />
Market<br />
Shares<br />
Value<br />
COMMON STOCKS (Continued)<br />
OTHER (Continued)<br />
North America (Continued)<br />
112,000 Cablevision Systems Corp., Cl. A................. $ 1,644,160<br />
11,434 CanWest <strong>Global</strong> Communications Corp., Cl. A,<br />
Canada†(b) ................................... 517<br />
23,566 CanWest <strong>Global</strong> Communications Corp., Cl. A,<br />
United States†(b) ............................. 1,063<br />
7,400 Cogeco Inc. ..................................... 402,402<br />
15,000 Comcast Corp., Cl. A, Special .................... 442,650<br />
4,000 Convergys Corp.† ............................... 53,400<br />
109,000 DIRECTV, Cl. A† ................................. 5,378,060<br />
107,000 DISH Network Corp., Cl. A ....................... 3,523,510<br />
14,400 EchoStar Corp., Cl. A† ........................... 405,216<br />
6,000 Fisher Communications Inc.† .................... 184,320<br />
400 Google Inc., Cl. A†............................... 256,496<br />
30,000 Liberty <strong>Global</strong> Inc., Cl. A† ........................ 1,502,400<br />
46,500 Liberty <strong>Global</strong> Inc., Cl. C† ........................ 2,226,885<br />
14,000 Liberty Interactive Corp., Cl. A† .................. 267,260<br />
18,500 Liberty Media Corp. - Liberty Capital, Cl. A† ...... 1,630,775<br />
45,000 LSI Corp.† ...................................... 390,600<br />
1,000 NCM Services Inc.† ............................. 60<br />
2,000 News Corp., Cl. B................................ 39,960<br />
24,000 Pendrell Corp.†.................................. 62,640<br />
6,000 SCANA Corp. .................................... 273,660<br />
4,500 SJW Corp. ...................................... 108,540<br />
18,000 <strong>The</strong> Madison Square Garden Co., Cl. A† .......... 615,600<br />
4,000 Time Warner Cable Inc. .......................... 326,000<br />
14,000 Time Warner Inc. ................................ 528,500<br />
47 Xanadoo Co., Cl. A† ............................. 13,395<br />
56,000 Yahoo! Inc.† .................................... 852,320<br />
22,312,032<br />
TOTAL OTHER .................................. 27,750,103<br />
TOTAL COMMON STOCKS ....................... 128,876,153<br />
PREFERRED STOCKS — 0.0%<br />
DIVERSIFIED TELECOMMUNICATIONS SERVICES — 0.0%<br />
Latin America — 0.0%<br />
26,044 Brasil Telecom, Pfd., Ser. B ...................... 36,285<br />
WARRANTS — 0.8%<br />
WIRELESS TELECOMMUNICATIONS SERVICES — 0.8%<br />
Asia/Pacific — 0.8%<br />
160,000 Bharti Airtel Ltd., expire 09/19/13†(a) ............ 1,062,656<br />
TOTAL INVESTMENTS — 100.0%<br />
(Cost $104,976,386) ................$129,975,094<br />
Market<br />
Value<br />
Aggregate tax cost............................... $107,494,379<br />
Gross unrealized appreciation.................... $ 42,697,076<br />
Gross unrealized depreciation.................... (20,216,361)<br />
Net unrealized appreciation/depreciation ......... $ 22,480,715<br />
(a) Security exempt from registration under Rule 144A of the Securities Act of<br />
1933, as amended. <strong>The</strong>se securities may be resold in transactions exempt<br />
from registration, normally to qualified institutional buyers. At March 31, 2012,<br />
the market value of Rule 144A securities amounted to $1,379,702 or 1.06%<br />
of total investments.<br />
(b) Security fair valued under procedures established by the Board of Directors.<br />
<strong>The</strong> procedures may include reviewing available financial information about<br />
the company and reviewing the valuation of comparable securities and other<br />
factors on a regular basis. At March 31, 2012, the market value of fair valued<br />
securities amounted to $842,855 or 0.65% of total investments.<br />
(c) Illiquid security.<br />
(d) Security purchased pursuant to Regulation S under the Securities Act of 1933,<br />
which exempts from registration securities offered and sold outside of the<br />
United States. Such securities cannot be sold in the United States without<br />
either an effective registration statement filed pursuant to the Securities Act<br />
of 1933, or pursuant to an exemption from registration. At March 31, 2012,<br />
the market value of Regulation S securities amounted to $2,361,896 or 1.82%<br />
of total investments, which were valued under methods approved by the Board<br />
of Directors as follows:<br />
Acquisition<br />
Shares<br />
Acquisition<br />
Date<br />
Acquisition<br />
Cost<br />
03/31/12<br />
Carrying<br />
Value<br />
Per Unit<br />
Issuer<br />
222,440 Orascom Telecom<br />
Holding SAE, GDR..... 06/22/07 $ 1,249,360 $ 3.2180<br />
83,600 Sistema JSFC, GDR ...... 02/09/05 1,633,891 19.6900<br />
(e) At March 31, 2012, the <strong>Fund</strong> held an investment in a restricted security amounting<br />
to $68,988 or 0.05% of total investments, which was valued under methods<br />
approved by the Board of Directors as follows:<br />
Acquisition<br />
Shares<br />
Issuer<br />
Acquisition<br />
Date<br />
Acquisition<br />
Cost<br />
03/31/12<br />
Carrying<br />
Value<br />
Per Unit<br />
37,415,054 Cable & Wireless Jamaica<br />
Ltd................... 03/10/94 $ 499,070 $ 0.0018<br />
(f) Denoted in units.<br />
† Non-income producing security.<br />
ADR American Depositary Receipt<br />
GDR <strong>Global</strong> Depositary Receipt<br />
JSFC Joint Stock Financial Corporation<br />
OJSC Open Joint Stock Company<br />
SDR Swedish Depositary Receipt<br />
See accompanying notes to schedule of investments.<br />
4
<strong>The</strong> <strong>GAMCO</strong> <strong>Global</strong> <strong>Telecommunications</strong> <strong>Fund</strong><br />
Schedule of Investments (Continued) — March 31, 2012 (Unaudited)<br />
Geographic Diversification<br />
%of<br />
Market<br />
Value<br />
Market<br />
Value<br />
North America ................ 44.7% $ 58,143,753<br />
Europe. .................... 29.7 38,566,836<br />
Asia/Pacific .................. 10.1 13,118,372<br />
Latin America. ................ 9.8 12,724,120<br />
Japan ..................... 4.1 5,397,204<br />
Africa/Middle East .............. 1.6 2,024,809<br />
100.0% $129,975,094<br />
See accompanying notes to schedule of investments.<br />
5
<strong>The</strong> <strong>GAMCO</strong> <strong>Global</strong> <strong>Telecommunications</strong> <strong>Fund</strong><br />
Notes to Schedule of Investments (Unaudited)<br />
<strong>The</strong> <strong>Fund</strong>’s schedule of investments is prepared in accordance with U.S. Generally Accepted Accounting Principles<br />
(“GAAP”), which may require the use of management estimates and assumptions. Actual results could differ<br />
from those estimates. <strong>The</strong> following is a summary of significant accounting policies followed by the <strong>Fund</strong> in<br />
the preparation of its schedule of investments.<br />
Security Valuation. Portfolio securities listed or traded on a nationally recognized securities exchange or traded<br />
in the U.S. over-the-counter market for which market quotations are readily available are valued at the last<br />
quoted sale price or a market’s official closing price as of the close of business on the day the securities are<br />
being valued. If there were no sales that day, the security is valued at the average of the closing bid and asked<br />
prices or, if there were no asked prices quoted on that day, then the security is valued at the closing bid price<br />
on that day. If no bid or asked prices are quoted on such day, the security is valued at the most recently<br />
available price or, if the Board of Directors (the “Board”) so determines, by such other method as the Board<br />
shall determine in good faith to reflect its fair market value. Portfolio securities traded on more than one national<br />
securities exchange or market are valued according to the broadest and most representative market, as determined<br />
by <strong>Gabelli</strong> <strong>Fund</strong>s, LLC (the “Adviser”).<br />
Portfolio securities primarily traded on a foreign market are generally valued at the preceding closing values<br />
of such securities on the relevant market, but may be fair valued pursuant to procedures established by the<br />
Board if market conditions change significantly after the close of the foreign market, but prior to the close of<br />
business on the day the securities are being valued. Debt instruments with remaining maturities of sixty days<br />
or less that are not credit impaired are valued at amortized cost, unless the Board determines such amount<br />
does not reflect the securities’ fair value, in which case these securities will be fair valued as determined by<br />
the Board. Debt instruments having a maturity greater than sixty days for which market quotations are readily<br />
available are valued at the average of the latest bid and asked prices. If there were no asked prices quoted<br />
on such day, the security is valued using the closing bid price. U.S. government obligations with maturities<br />
greater than sixty days are normally valued using a model that incorporates market observable data such as<br />
reported sales of similar securities, broker quotes, yields, bids, offers, and reference data. Certain securities<br />
are valued principally using dealer quotations.<br />
Securities and assets for which market quotations are not readily available are fair valued as determined by<br />
the Board. Fair valuation methodologies and procedures may include, but are not limited to: analysis and review<br />
of available financial and nonfinancial information about the company; comparisons with the valuation and<br />
changes in valuation of similar securities, including a comparison of foreign securities with the equivalent U.S.<br />
dollar value ADR securities at the close of the U.S. exchange; and evaluation of any other information that<br />
could be indicative of the value of the security.<br />
<strong>The</strong> inputs and valuation techniques used to measure fair value of the <strong>Fund</strong>’s investments are summarized<br />
into three levels as described in the hierarchy below:<br />
• Level 1 — quoted prices in active markets for identical securities;<br />
• Level 2 — other significant observable inputs (including quoted prices for similar securities, interest<br />
rates, prepayment speeds, credit risk, etc.); and<br />
• Level 3 — significant unobservable inputs (including the <strong>Fund</strong>’s determinations as to the fair value<br />
of investments).<br />
6
<strong>The</strong> <strong>GAMCO</strong> <strong>Global</strong> <strong>Telecommunications</strong> <strong>Fund</strong><br />
Notes to Schedule of Investments (Unaudited) (Continued)<br />
A financial instrument’s level within the fair value hierarchy is based on the lowest level of any input both<br />
individually and in the aggregate that is significant to the fair value measurement. <strong>The</strong> inputs or methodology<br />
used for valuing securities are not necessarily an indication of the risk associated with investing in those securities.<br />
<strong>The</strong> summary of the <strong>Fund</strong>’s investments in securities by inputs used to value the <strong>Fund</strong>’s investments as of March<br />
31, 2012 is as follows:<br />
Valuation Inputs<br />
Level 1<br />
Quoted Prices<br />
Level 2 Other Significant<br />
Observable Inputs<br />
Level 3 Significant<br />
Unobservable Inputs<br />
Total Market Value<br />
at 3/31/12<br />
INVESTMENTS IN SECURITIES:<br />
ASSETS (Market Value):<br />
Common Stocks:<br />
DIVERSIFIED TELECOMMUNICATIONS<br />
SERVICES<br />
Asia/Pacific $ 5,762,958 $ 205,543 $550,750 $ 6,519,251<br />
Latin America 4,710,295 68,988 — 4,779,283<br />
North America 24,715,483 — 110 24,715,593<br />
Other Regions(a) 26,659,005 — — 26,659,005<br />
WIRELESS TELECOMMUNICATIONS<br />
SERVICES<br />
Africa/Middle East 1,100,640 266,928 — 1,367,568<br />
Latin America 7,591,461 — 0 7,591,461<br />
Other Regions(a) 29,493,889 — — 29,493,889<br />
OTHER<br />
Africa/Middle East 71 — 0 71<br />
Asia/Pacific 665,247 22,719 — 687,966<br />
Europe 3,927,717 — 768 3,928,485<br />
North America 22,311,515 517 0 22,312,032<br />
Other Regions(a) 821,549 — — 821,549<br />
Total Common Stocks 127,759,830 564,695 551,628 128,876,153<br />
Preferred Stocks(a) — 36,285 — 36,285<br />
Warrants(a) — 1,062,656 — 1,062,656<br />
TOTAL INVESTMENTS IN SECURITIES –<br />
ASSETS $127,759,830 $1,663,636 $551,628 $129,975,094<br />
(a)<br />
Please refer to the Schedule of Investments for the regional classifications of these portfolio holdings.<br />
<strong>The</strong> <strong>Fund</strong> did not have transfers between Level 1 and Level 2 during the period ended March 31, 2012. <strong>The</strong><br />
<strong>Fund</strong>’s policy is to recognize transfers among Levels as of the beginning of the reporting period.<br />
Additional Information to Evaluate Quantitative Information.<br />
General. <strong>The</strong> <strong>Fund</strong> uses recognized industry pricing services – approved by the Board and unaffiliated with<br />
the Adviser – to value most of its securities, and uses broker quotes provided by market makers of securities<br />
not valued by these and other recognized pricing sources. Several different pricing feeds are received to value<br />
domestic equity securities, international equity securities, preferred equity securities, and fixed income securities. <strong>The</strong><br />
data within these feeds is ultimately sourced from major stock exchanges and trading systems where these<br />
securities trade. <strong>The</strong> prices supplied by external sources are checked by obtaining quotations or actual transaction<br />
prices from market participants. If a price obtained from the pricing source is deemed unreliable, prices will be<br />
sought from another pricing service or from a broker/dealer that trades that security or similar securities.<br />
Fair Valuation. Fair valued securities may be common and preferred equities, warrants, options, rights, and<br />
fixed income obligations. Where appropriate, Level 3 securities are those for which market quotations are not<br />
7
<strong>The</strong> <strong>GAMCO</strong> <strong>Global</strong> <strong>Telecommunications</strong> <strong>Fund</strong><br />
Notes to Schedule of Investments (Unaudited) (Continued)<br />
available, such as securities not traded for several days, or for which current bids are not available, or which<br />
are restricted as to transfer. Among the factors to be considered to fair value a security are recent prices of<br />
comparable securities that are publicly traded, reliable prices of securities not publicly traded, the use of valuation<br />
models, current analyst reports, valuing the income or cash flow of the issuer, or cost if the preceding factors<br />
do not apply. <strong>The</strong> circumstances of Level 3 securities are frequently monitored to determine if fair valuation<br />
measures continue to apply.<br />
<strong>The</strong> Adviser reports quarterly to the Board the results of the application of fair valuation policies and procedures.<br />
<strong>The</strong>se include back testing the prices realized in subsequent trades of these fair valued securities to fair values<br />
previously recognized.<br />
Foreign Currency Translations. <strong>The</strong> books and records of the <strong>Fund</strong> are maintained in U.S. dollars. Foreign<br />
currencies, investments, and other assets and liabilities are translated into U.S. dollars at current exchange<br />
rates. Purchases and sales of investment securities, income, and expenses are translated at the exchange<br />
rate prevailing on the respective dates of such transactions. Unrealized gains and losses that result from changes<br />
in foreign exchange rates and/or changes in market prices of securities have been included in unrealized<br />
appreciation/depreciation on investments and foreign currency translations. Net realized foreign currency gains<br />
and losses resulting from changes in exchange rates include foreign currency gains and losses between trade<br />
date and settlement date on investment securities transactions, foreign currency transactions, and the difference<br />
between the amounts of interest and dividends recorded on the books of the <strong>Fund</strong> and the amounts actually<br />
received. <strong>The</strong> portion of foreign currency gains and losses related to fluctuation in exchange rates between<br />
the initial purchase trade date and subsequent sale trade date is included in realized gain/(loss) on investments.<br />
Foreign Securities. <strong>The</strong> <strong>Fund</strong> may directly purchase securities of foreign issuers. Investing in securities of<br />
foreign issuers involves special risks not typically associated with investing in securities of U.S. issuers. <strong>The</strong><br />
risks include possible revaluation of currencies, the inability to repatriate funds, less complete financial information<br />
about companies, and possible future adverse political and economic developments. Moreover, securities of<br />
many foreign issuers and their markets may be less liquid and their prices more volatile than securities of<br />
comparable U.S. issuers.<br />
Foreign Taxes. <strong>The</strong> <strong>Fund</strong> may be subject to foreign taxes on income, gains on investments, or currency repatriation,<br />
a portion of which may be recoverable. <strong>The</strong> <strong>Fund</strong> will accrue such taxes and recoveries as applicable, based<br />
upon its current interpretation of tax rules and regulations that exist in the markets in which it invests.<br />
Restricted and Illiquid Securities. <strong>The</strong> <strong>Fund</strong> may invest up to 15% of its net assets in securities for which<br />
the markets are illiquid. Illiquid securities include securities the disposition of which is subject to substantial<br />
legal or contractual restrictions. <strong>The</strong> sale of illiquid securities often requires more time and results in higher<br />
brokerage charges or dealer discounts and other selling expenses than does the sale of securities eligible for<br />
trading on national securities exchanges or in the over-the-counter markets. Restricted securities may sell at<br />
a price lower than similar securities that are not subject to restrictions on resale. Securities freely saleable<br />
among qualified institutional investors under special rules adopted by the SEC may be treated as liquid if they<br />
satisfy liquidity standards established by the Board. <strong>The</strong> continued liquidity of such securities is not as well<br />
assured as that of publicly traded securities, and accordingly the Board will monitor their liquidity. For the restricted<br />
and illiquid securities the <strong>Fund</strong> held as of March 31, 2012, refer to the Schedule of Investments.<br />
8
<strong>The</strong> <strong>GAMCO</strong> <strong>Global</strong> <strong>Telecommunications</strong> <strong>Fund</strong><br />
Notes to Schedule of Investments (Unaudited) (Continued)<br />
Derivative Financial Instruments. <strong>The</strong> <strong>Fund</strong> may engage in various portfolio investment strategies by investing<br />
in a number of derivative financial instruments for the purposes of hedging against changes in the value of its<br />
portfolio securities and in the value of securities it intends to purchase or hedging against a specific transaction<br />
with respect to either the currency in which the transaction is denominated or another currency. Investing in<br />
certain derivative financial instruments, including participation in the options, futures, or swap markets, entails<br />
certain execution, liquidity, hedging, tax, and securities, interest, credit, or currency market risks. Losses may<br />
arise if the Adviser’s prediction of movements in the direction of the securities, foreign currency, and interest<br />
rate markets is inaccurate. Losses may also arise if the counterparty does not perform its duties under a contract,<br />
or that, in the event of default, the <strong>Fund</strong> may be delayed in or prevented from obtaining payments or other<br />
contractual remedies owed to it under derivative contracts. <strong>The</strong> creditworthiness of the counterparties is closely<br />
monitored in order to minimize these risks. Participation in derivative transactions involves investment risks,<br />
transaction costs, and potential losses to which the <strong>Fund</strong> would not be subject absent the use of these strategies.<br />
<strong>The</strong> consequences of these risks, transaction costs, and losses may have a negative impact on the <strong>Fund</strong>’s<br />
ability to pay distributions.<br />
<strong>The</strong> <strong>Fund</strong>’s derivative contracts held at March 31, 2012, if any, are not accounted for as hedging instruments<br />
under GAAP and are disclosed in the Schedule of Investments together with the related counterparty.<br />
Tax Information. <strong>The</strong> <strong>Fund</strong> intends to continue to qualify as a regulated investment company under Subchapter<br />
M of the Internal Revenue Code of 1986, as amended.<br />
At December 31, 2011, the <strong>Fund</strong> had net capital loss carryforwards for federal income tax purposes which are<br />
available to reduce future required distributions of net capital gains to shareholders. Under the Regulated Investment<br />
Company Modernization Act of 2010, the <strong>Fund</strong> will be permitted to carry forward for an unlimited period capital<br />
losses incurred in years beginning after December 22, 2010. In addition, these losses must be utilized prior<br />
to the losses incurred in pre-enactment taxable years. As a result of the rule, pre-enactment capital loss carryforwards<br />
may have an increased likelihood of expiring unused. Additionally, post enactment capital losses that are carried<br />
forward will retain their character as either short-term or long-term capital losses rather than begin considered<br />
all short-term as under previous law.<br />
Capital Loss Carryforward Available through 2012............................. $3,314,655<br />
Capital Loss Carryforward Available through 2016............................. 250,132<br />
Capital Loss Carryforward Available through 2017............................. 4,306,785<br />
Total Capital Loss Carryforwards ............................................ $7,871,572<br />
We have separated the portfolio managers’ commentary from the financial statements and investment portfolio due to<br />
corporate governance regulations stipulated by the Sarbanes-Oxley Act of 2002. We have done this to ensure that the<br />
content of the portfolio managers’ commentary is unrestricted. <strong>The</strong> financial statements and investment portfolio are<br />
mailed separately from the commentary. Both the commentary and the financial statements, including the portfolio of<br />
investments, will be available on our website at www.gabelli.com.<br />
9
<strong>Gabelli</strong>/<strong>GAMCO</strong> <strong>Fund</strong>s and Your Personal Privacy.<br />
Who are we<br />
<strong>The</strong> <strong>Gabelli</strong>/<strong>GAMCO</strong> <strong>Fund</strong>s are investment companies registered with the Securities and Exchange<br />
Commission under the Investment Company Act of 1940. We are managed by <strong>Gabelli</strong> <strong>Fund</strong>s, LLC,<br />
which is affiliated with <strong>GAMCO</strong> Investors, Inc. <strong>GAMCO</strong> Investors, Inc. is a publicly held company that<br />
has subsidiaries that provide investment advisory or brokerage services for a variety of clients.<br />
What kind of non-public information do we collect about you if you become a fund shareholder<br />
If you apply to open an account directly with us, you will be giving us some non-public information<br />
about yourself. <strong>The</strong> non-public information we collect about you is:<br />
• Information you give us on your application form. This could include your name, address, telephone<br />
number, social security number, bank account number, and other information.<br />
• Information about your transactions with us, any transactions with our affiliates, and transactions with<br />
the entities we hire to provide services to you. This would include information about the shares that<br />
you buy or redeem. If we hire someone else to provide services — like a transfer agent — we will<br />
also have information about the transactions that you conduct through them.<br />
What information do we disclose and to whom do we disclose it<br />
We do not disclose any non-public personal information about our customers or former customers to<br />
anyone other than our affiliates, our service providers who need to know such information, and as<br />
otherwise permitted by law. If you want to find out what the law permits, you can read the privacy rules<br />
adopted by the Securities and Exchange Commission. <strong>The</strong>y are in volume 17 of the Code of Federal<br />
Regulations, Part 248. <strong>The</strong> Commission often posts information about its regulations on its website,<br />
www.sec.gov.<br />
What do we do to protect your personal information<br />
We restrict access to non-public personal information about you to the people who need to know that<br />
information in order to provide services to you or the fund and to ensure that we are complying with<br />
the laws governing the securities business. We maintain physical, electronic, and procedural safeguards<br />
to keep your personal information confidential.
______________________<br />
VALUE<br />
<strong>Gabelli</strong> Asset <strong>Fund</strong><br />
Seeks to invest primarily in a diversified portfolio of common<br />
stocks selling at significant discounts to their private market<br />
value. <strong>The</strong> <strong>Fund</strong>’s primary objective is growth of capital.<br />
(Multiclass)<br />
Team Managed<br />
<strong>Gabelli</strong> Dividend Growth <strong>Fund</strong> (formerly <strong>Gabelli</strong> Blue<br />
Chip Value <strong>Fund</strong>)<br />
Seeks to invest at least 80% of its net assets in dividend<br />
paying stocks. (Multiclass)<br />
Portfolio Manager: Barbara G. Marcin, CFA<br />
<strong>GAMCO</strong> Westwood Equity <strong>Fund</strong><br />
Seeks to invest primarily in the common stock of well<br />
seasoned companies that have recently reported positive<br />
earnings surprises and are trading below Westwood’s<br />
proprietary growth rate estimates. <strong>The</strong> <strong>Fund</strong>’s primary<br />
objective is capital appreciation.<br />
(Multiclass)<br />
Team Managed<br />
FOCUSED VALUE _________________<br />
<strong>Gabelli</strong> Focus Five <strong>Fund</strong> (formerly <strong>Gabelli</strong> Woodland<br />
Small Cap Value <strong>Fund</strong>)<br />
Seeks to invest up to 50% of its net assets in the equity<br />
securities of five companies with the remaining net assets<br />
invested in ten to twenty other companies or in short-term<br />
high grade investments or cash and cash equivalents.<br />
(Multiclass)<br />
Team Managed<br />
<strong>Gabelli</strong> Value <strong>Fund</strong><br />
Seeks to invest in securities of companies believed to be<br />
undervalued. <strong>The</strong> <strong>Fund</strong>’s primary objective is long-term<br />
capital appreciation. (Multiclass) Team Managed<br />
SMALL CAP ____________________<br />
<strong>Gabelli</strong> Small Cap Growth <strong>Fund</strong><br />
Seeks to invest primarily in common stock of smaller<br />
companies (market capitalizations at the time of investment<br />
of $2 billion or less) believed to have rapid revenue and<br />
earnings growth potential. <strong>The</strong> <strong>Fund</strong>’s primary objective<br />
is capital appreciation. (Multiclass)<br />
Portfolio Manager: Mario J. <strong>Gabelli</strong>, CFA<br />
<strong>GAMCO</strong> Westwood SmallCap Equity <strong>Fund</strong><br />
Seeks to invest primarily in smaller capitalization equity<br />
securities – market caps of $2.5 billion or less. <strong>The</strong> <strong>Fund</strong>’s<br />
primary objective is long-term capital appreciation.<br />
(Multiclass) Portfolio Manager: Nicholas F. Galluccio<br />
GROWTH _____________________<br />
<strong>GAMCO</strong> Growth <strong>Fund</strong><br />
Seeks to invest primarily in large cap stocks believed to<br />
have favorable, yet undervalued, prospects for earnings<br />
growth. <strong>The</strong> <strong>Fund</strong>’s primary objective is capital appreciation.<br />
(Multiclass) Portfolio Manager: Howard F. Ward, CFA<br />
<strong>GAMCO</strong> International Growth <strong>Fund</strong><br />
Seeks to invest in the equity securities of foreign issuers<br />
with long-term capital appreciation potential. <strong>The</strong> <strong>Fund</strong> offers<br />
investors global diversification.<br />
(Multiclass) Portfolio Manager: Caesar Bryan<br />
GABELLI/<strong>GAMCO</strong> FAMILY OF FUNDS<br />
______________<br />
AGGRESSIVE GROWTH<br />
<strong>GAMCO</strong> <strong>Global</strong> Growth <strong>Fund</strong><br />
Seeks capital appreciation through a disciplined investment<br />
program focusing on the globalization and interactivity of<br />
the world’s marketplace. <strong>The</strong> <strong>Fund</strong> invests in companies<br />
at the forefront of accelerated growth. <strong>The</strong> <strong>Fund</strong>’s primary<br />
objective is capital ____________________<br />
appreciation. (Multiclass)<br />
Team Managed<br />
MICRO-CAP<br />
<strong>GAMCO</strong> Westwood Mighty Mites SM <strong>Fund</strong><br />
Seeks to invest in micro-cap companies that have market<br />
capitalizations of $500 million or less. <strong>The</strong> <strong>Fund</strong>’s primary<br />
objective is long-term _________________<br />
capital appreciation. (Multiclass)<br />
Team Managed<br />
EQUITY INCOME<br />
<strong>Gabelli</strong> Equity Income <strong>Fund</strong><br />
Seeks to invest primarily in equity securities with above<br />
average market yields. <strong>The</strong> <strong>Fund</strong> pays monthly distributions<br />
and seeks a high level of total return with an emphasis on<br />
income. (Multiclass)Portfolio Manager: Mario J. <strong>Gabelli</strong>,<br />
CFA<br />
<strong>GAMCO</strong> Westwood Balanced <strong>Fund</strong><br />
Seeks to invest in a balanced and diversified portfolio of<br />
stocks and bonds. <strong>The</strong> <strong>Fund</strong>’s primary objective is both<br />
capital appreciation and current income. (Multiclass)<br />
Team Managed<br />
<strong>GAMCO</strong> Westwood Income <strong>Fund</strong><br />
Seeks to provide a high level of current income as well as<br />
long-term capital appreciation by investing in income<br />
producing equity and fixed income securities. (Multiclass)<br />
Portfolio ________________<br />
Manager: Barbara G. Marcin, CFA<br />
SPECIALTY EQUITY<br />
<strong>GAMCO</strong> Vertumnus <strong>Fund</strong><br />
Seeks to invest principally in bonds and preferred stocks<br />
which are convertible into common stock of foreign and<br />
domestic companies. <strong>The</strong> <strong>Fund</strong>’s primary objective is total<br />
return through a combination of current income and capital<br />
appreciation. (Multiclass)<br />
Portfolio Manager: Mario J. <strong>Gabelli</strong>, CFA<br />
<strong>GAMCO</strong> <strong>Global</strong> Opportunity <strong>Fund</strong><br />
Seeks to invest in common stock of companies which have<br />
rapid growth in revenues and earnings and potential for<br />
above average capital appreciation or are undervalued. <strong>The</strong><br />
<strong>Fund</strong>’s primary objective is capital appreciation. (Multiclass)<br />
Team Managed<br />
<strong>Gabelli</strong> SRI Green <strong>Fund</strong><br />
Seeks to invest in common and preferred stocks meeting<br />
guidelines for social responsibility (avoiding defense<br />
contractors and manufacturers of alcohol, abortifacients,<br />
gaming, and tobacco products) and sustainability (companies<br />
engaged in climate change, energy security and<br />
independence, natural resource shortages, organic living,<br />
and urbanization). <strong>The</strong> <strong>Fund</strong>’s primary objective is capital<br />
appreciation. _____________________<br />
(Multiclass)<br />
Team Managed<br />
SECTOR<br />
<strong>GAMCO</strong> <strong>Global</strong> <strong>Telecommunications</strong> <strong>Fund</strong><br />
Seeks to invest in telecommunications companies throughout<br />
the world – targeting undervalued companies with strong<br />
earnings and cash flow dynamics. <strong>The</strong> <strong>Fund</strong>’s primary<br />
objective is capital appreciation. (Multiclass)Team Managed<br />
<strong>Gabelli</strong> Gold <strong>Fund</strong> (formerly <strong>GAMCO</strong> Gold <strong>Fund</strong>)<br />
Seeks to invest in a global portfolio of equity securities of<br />
gold mining and related companies. <strong>The</strong> <strong>Fund</strong>’s objective<br />
is long-term capital appreciation. Investment in gold stocks<br />
is considered speculative and is affected by a variety of<br />
worldwide economic, financial, and political factors.<br />
(Multiclass) Portfolio Manager: Caesar Bryan<br />
<strong>Gabelli</strong> Utilities <strong>Fund</strong><br />
Seeks to provide a high level of total return through a<br />
combination of capital appreciation and current income.<br />
(Multiclass) Portfolio Manager: Mario J. <strong>Gabelli</strong>, CFA<br />
_____________<br />
MERGER AND ARBITRAGE<br />
<strong>Gabelli</strong> ABC <strong>Fund</strong><br />
Seeks to invest in securities with attractive opportunities<br />
for appreciation or investment income. <strong>The</strong> <strong>Fund</strong>’s primary<br />
objective is total return in various market conditions without<br />
excessive risk of capital loss. (No-load)<br />
Portfolio Manager: Mario J. <strong>Gabelli</strong>, CFA<br />
<strong>Gabelli</strong> Enterprise Mergers and Acquisitions <strong>Fund</strong><br />
Seeks to invest in securities believed to be likely acquisition<br />
targets within 12–18 months or in arbitrage transactions<br />
of publicly announced mergers or other corporate<br />
reorganizations. <strong>The</strong> <strong>Fund</strong>’s primary objective is capital<br />
appreciation. (Multiclass)<br />
___________________<br />
Portfolio Manager: Mario J. <strong>Gabelli</strong>, CFA<br />
CONTRARIAN<br />
<strong>GAMCO</strong> Mathers <strong>Fund</strong><br />
Seeks long-term capital appreciation in various market<br />
conditions without excessive risk of capital loss. (No-load)<br />
Portfolio Manager: Henry Van der Eb, CFA<br />
Comstock Capital Value <strong>Fund</strong><br />
Seeks capital appreciation and current income. <strong>The</strong> <strong>Fund</strong><br />
may use either long or short positions to achieve its objective.<br />
(Multiclass)<br />
Portfolio Managers: Charles L. Minter<br />
Martin Weiner, CFA<br />
FIXED INCOME __________________<br />
<strong>GAMCO</strong> Westwood Intermediate Bond <strong>Fund</strong><br />
Seeks to invest in a diversified portfolio of bonds with various<br />
maturities. <strong>The</strong> <strong>Fund</strong>’s primary objective is total return.<br />
(Multiclass) Portfolio Manager: Mark R. _______<br />
Freeman, CFA<br />
CASH MANAGEMENT-MONEY MARKET<br />
<strong>Gabelli</strong> U.S. Treasury Money Market <strong>Fund</strong><br />
Seeks to invest exclusively in short-term U.S. Treasury<br />
securities. <strong>The</strong> <strong>Fund</strong>’s primary objective is to provide high<br />
current income consistent with the preservation of principal<br />
and liquidity. (No-load)<br />
Co-Portfolio Managers: Judith A. Raneri<br />
Ronald S. Eaker<br />
An investment in the above Money Market <strong>Fund</strong> is neither<br />
insured nor guaranteed by the Federal Deposit Insurance<br />
Corporation or any government agency. Although the <strong>Fund</strong><br />
seeks to preserve the value of your investment at $1.00<br />
per share, it is possible to lose money by investing in the<br />
<strong>Fund</strong>.<br />
<strong>The</strong> <strong>Fund</strong>s may invest in foreign securities which involve<br />
risks not ordinarily associated with investments in domestic<br />
issues, including currency fluctuation, economic, and political<br />
risks.<br />
To receive a prospectus, call 800-GABELLI (800-422-3554). Investors should carefully consider the investment objectives, risks, charges, and expenses of a fund before investing.<br />
<strong>The</strong> prospectus contains more information about these and other matters and should be read carefully before investing. Distributed by G.distributors, LLC, One Corporate Center,<br />
Rye, NY 10580.
<strong>GAMCO</strong> <strong>Global</strong> Series <strong>Fund</strong>s, Inc.<br />
<strong>The</strong> <strong>GAMCO</strong> <strong>Global</strong> <strong>Telecommunications</strong><br />
<strong>Fund</strong><br />
One Corporate Center<br />
Rye, New York 10580-1422<br />
800-GABELLI<br />
800-422-3554<br />
fax: 914-921-5118<br />
website: www.gabelli.com<br />
e-mail: info@gabelli.com<br />
Net Asset Value per share available daily by calling<br />
800-GABELLI after 7:00 P.M.<br />
Board of Directors<br />
E<br />
M P PS<br />
V<br />
MANAGEMENT<br />
CASH FLOW<br />
R E S E A R C H<br />
Mario J. <strong>Gabelli</strong>, CFA<br />
Chairman and Chief<br />
Executive Officer,<br />
<strong>GAMCO</strong> Investors, Inc.<br />
John D. <strong>Gabelli</strong><br />
Senior Vice President,<br />
<strong>Gabelli</strong> & Company, Inc.<br />
E. Val Cerutti<br />
Chief Executive Officer,<br />
Cerutti Consultants, Inc.<br />
Anthony J. Colavita<br />
President,<br />
Anthony J. Colavita, P.C.<br />
Arthur V. Ferrara<br />
Former Chairman and<br />
Chief Executive Officer,<br />
Guardian Life Insurance<br />
Company of America<br />
Bruce N. Alpert<br />
President, Secretary, and<br />
Acting Chief<br />
Compliance Officer<br />
Officers<br />
Werner J. Roeder, MD<br />
Medical Director,<br />
Lawrence Hospital<br />
Anthonie C. van Ekris<br />
Chairman,<br />
BALMAC International, Inc.<br />
Salvatore J. Zizza<br />
Chairman,<br />
Zizza & Associates Corp.<br />
Agnes Mullady<br />
Treasurer<br />
Custodian, Transfer Agent, and Dividend<br />
Disbursing Agent<br />
State Street Bank and Trust Company<br />
Distributor<br />
G.distributors, LLC<br />
Legal Counsel<br />
Skadden, Arps, Slate, Meagher & Flom LLP<br />
<strong>The</strong><br />
<strong>GAMCO</strong><br />
<strong>Global</strong><br />
<strong>Telecommunications</strong><br />
<strong>Fund</strong><br />
This report is submitted for the general information of the shareholders<br />
of <strong>The</strong> <strong>GAMCO</strong> <strong>Global</strong> <strong>Telecommunications</strong> <strong>Fund</strong>. It is not authorized<br />
for distribution to prospective investors unless preceded or accompanied<br />
by an effective prospectus.<br />
GAB401Q112QR<br />
FIRST QUARTER REPORT<br />
MARCH 31, 2012