The Gabelli Global Telecommunications Fund
The Gabelli Global Telecommunications Fund
The Gabelli Global Telecommunications Fund

You also want an ePaper? Increase the reach of your titles
YUMPU automatically turns print PDFs into web optimized ePapers that Google loves.
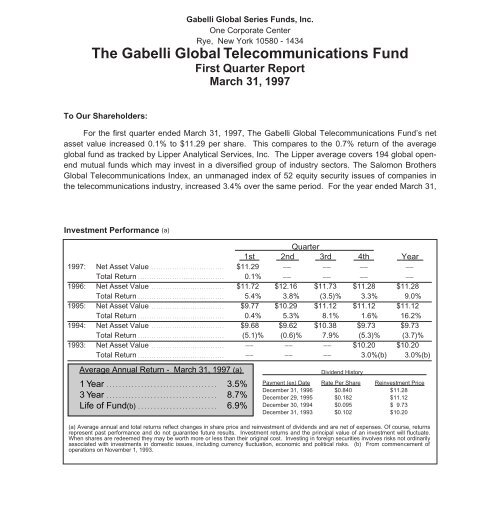
<strong>Gabelli</strong> <strong>Global</strong> Series <strong>Fund</strong>s, Inc.<br />
One Corporate Center<br />
Rye, New York 10580 - 1434<br />
<strong>The</strong> <strong>Gabelli</strong> <strong>Global</strong> <strong>Telecommunications</strong> <strong>Fund</strong><br />
First Quarter Report<br />
March 31, 1997<br />
To Our Shareholders:<br />
For the first quarter ended March 31, 1997, <strong>The</strong> <strong>Gabelli</strong> <strong>Global</strong> <strong>Telecommunications</strong> <strong>Fund</strong>’s net<br />
asset value increased 0.1% to $11.29 per share. This compares to the 0.7% return of the average<br />
global fund as tracked by Lipper Analytical Services, Inc. <strong>The</strong> Lipper average covers 194 global openend<br />
mutual funds which may invest in a diversified group of industry sectors. <strong>The</strong> Salomon Brothers<br />
<strong>Global</strong> <strong>Telecommunications</strong> Index, an unmanaged index of 52 equity security issues of companies in<br />
the telecommunications industry, increased 3.4% over the same period. For the year ended March 31,<br />
Investment Performance (a)<br />
Quarter<br />
1st 2nd 3rd 4th Year<br />
1997: Net Asset Value . . . . . . . . . . . . . . . . . . . . . . . . . . . . . . . . $11.29 __ __ __ __<br />
Total Return . . . . . . . . . . . . . . . . . . . . . . . . . . . . . . . . . . . . . . 0.1% __ __ __ __<br />
1996: Net Asset Value . . . . . . . . . . . . . . . . . . . . . . . . . . . . . . . . $11.72 $12.16 $11.73 $11.28 $11.28<br />
Total Return . . . . . . . . . . . . . . . . . . . . . . . . . . . . . . . . . . . . . . 5.4% 3.8% (3.5)% 3.3% 9.0%<br />
1995: Net Asset Value . . . . . . . . . . . . . . . . . . . . . . . . . . . . . . . . $9.77 $10.29 $11.12 $11.12 $11.12<br />
Total Return . . . . . . . . . . . . . . . . . . . . . . . . . . . . . . . . . . . . . . 0.4% 5.3% 8.1% 1.6% 16.2%<br />
1994: Net Asset Value . . . . . . . . . . . . . . . . . . . . . . . . . . . . . . . . $9.68 $9.62 $10.38 $9.73 $9.73<br />
Total Return . . . . . . . . . . . . . . . . . . . . . . . . . . . . . . . . . . . . . . (5.1)% (0.6)% 7.9% (5.3)% (3.7)%<br />
1993: Net Asset Value . . . . . . . . . . . . . . . . . . . . . . . . . . . . . . . .<br />
__ __ __ $10.20 $10.20<br />
Total Return . . . . . . . . . . . . . . . . . . . . . . . . . . . . . . . . . . . . . .<br />
__ __ __ 3.0%(b) 3.0%(b)<br />
Average Annual Return - March 31, 1997 (a)<br />
1 Year . . . . . . . . . . . . . . . . . . . . . . . . . . . . . . . . . . . 3.5%<br />
3 Year . . . . . . . . . . . . . . . . . . . . . . . . . . . . . . . . . . . 8.7%<br />
Life of <strong>Fund</strong>(b) . . . . . . . . . . . . . . . . . . . . . . . . . 6.9%<br />
Dividend History<br />
Payment (ex) Date Rate Per Share Reinvestment Price<br />
December 31, 1996 $0.840 $11.28<br />
December 29, 1995 $0.182 $11.12<br />
December 30, 1994 $0.095 $ 9.73<br />
December 31, 1993 $0.102 $10.20<br />
(a) Average annual and total returns reflect changes in share price and reinvestment of dividends and are net of expenses. Of course, returns<br />
represent past performance and do not guarantee future results. Investment returns and the principal value of an investment will fluctuate.<br />
When shares are redeemed they may be worth more or less than their original cost. Investing in foreign securities involves risks not ordinarily<br />
associated with investments in domestic issues, including currency fluctuation, economic and political risks. (b) From commencement of<br />
operations on November 1, 1993.
1997, the <strong>Fund</strong> increased 3.5%, versus 11.1% and 16.5% for the Lipper global fund average and the<br />
Salomon Brothers <strong>Global</strong> <strong>Telecommunications</strong> Index, respectively.<br />
Since inception on November 1,<br />
1993, through March 31, 1997, the<br />
<strong>Fund</strong> gained 25.7% which reflects an<br />
average annual rate of return of 6.9%<br />
assuming reinvestment of dividends.<br />
<strong>The</strong> Portfolio<br />
<strong>Global</strong> Allocation<br />
HOLDINGS BY GEOGRAPHIC REGION - 3/31/97<br />
United States<br />
43.8%<br />
Europe 21.8%<br />
Asia/Pacific<br />
Rim 11.0%<br />
<strong>The</strong> chart to the right represents<br />
the <strong>Fund</strong>’s holdings by geographic<br />
region as of March 31, 1997. <strong>The</strong><br />
geographic allocation will change<br />
based on current global market<br />
conditions. Countries and/or regions or companies represented in the chart and below may or may not<br />
be included in the <strong>Fund</strong>’s portfolio in the future.<br />
Our Approach<br />
Our approach is multifaceted. We purchase companies that are attractively valued relative to<br />
what we estimate a buyer would be willing to pay for the entire company in a private transaction.<br />
When the gap between a company’s Private Market Value (PMV) and public market value widens, our<br />
risk/reward parameters improve. To maximize returns, our decision process requires the expectation<br />
of a trigger that will promote a reduction in this gap. But we will not invest in just any “cheap”<br />
company. For most of our holdings, our selection is based on “bottom up” fundamental analysis, which<br />
requires strong cash flow and earnings power, positive industry dynamics and, certainly not least, good<br />
management with a track record of growing value for their shareholders.<br />
Portfolio Structure<br />
Other 4.2%<br />
Canada 8.6%<br />
Latin America<br />
10.6%<br />
We remain “bottom-up” focused, with roughly half the fund’s investment in the U.S.<br />
Internationally, the trend continues to be liberalization and privatization of the telecommunications<br />
sector. <strong>The</strong> result is an expanding universe of publicly-traded telecom companies poised for growth.<br />
Deutsche Telekom, the largest telecom company in Europe and the third-largest in the world,<br />
successfully completed its initial public offering in November 1996. Many other major telecom<br />
companies are expected to “go public” in the years ahead.<br />
Almost 22% of the <strong>Fund</strong> is invested in Europe, much of that in the UK. Key holdings are<br />
companies with a strong global presence and attractive valuations. Included are Cable & Wireless, the<br />
2
UK’s second-largest telecom group, and Vodafone, the biggest UK cellular service provider with<br />
attractive wireless investments on a global basis. Telefonica de Espana is another key investment in<br />
light of its strong telecom franchise and significant discount to its underlying asset value.<br />
Asia/Pacific Rim represents about 11.0% of the <strong>Fund</strong> and Latin America around 10.6%. <strong>The</strong>se<br />
regions are among the most rapidly growing in the world. <strong>Telecommunications</strong> forms the “information<br />
highways” necessary for strong economic development. Telebras, the Brazilian telephone company,<br />
and Telekom Malaysia, the primary provider of domestic and international telecom services in<br />
Malaysia, are key examples of attractively valued, rapidly growing investments.<br />
Competition, consolidation and convergence are occurring globally as companies seek economies<br />
of scale. Simply put, “bigger is better.” <strong>Telecommunications</strong> stocks are selling at large discounts to their<br />
estimated Private Market Values. Moreover, the stock price performance has not kept pace with the<br />
growth in value. Major forces — strong demand, open markets, technology, consolidation — should<br />
drive telecom stock prices toward their Private Market Values, thereby enhancing shareholder value.<br />
Commentary<br />
<strong>The</strong> Economy and the Stock Market: Too Much of a Good Thing<br />
Once again, the economy confounded the Wall Street economists by growing much faster than<br />
consensus expectations. Although inflation has not yet shown up in the Producer Price and Consumer<br />
Price inidices, Federal Reserve Chairman Alan Greenspan and bond investors decided to err on the<br />
side of caution by taking short- and long-term interest rates higher.<br />
We applaud Fed Chairman Greenspan’s preemptive strike against inflation. We believe he will<br />
continue to take the steps necessary to combat inflation and, in the process, provide confidence in Soft<br />
Landing - Part II. Over the short-term, this may not be pleasant for equities investors. However, with<br />
the elimination of some of the speculative excesses, the market will be on much better fundamental<br />
footing going forward. We do not believe this is the beginning of a secular bear market, but rather a<br />
healthy correction that is arguably long overdue.<br />
What can we expect over the balance of this year We should continue to see a volatile market as<br />
skittish investors wrestle with the latest economic data trying to determine if inflation is a real threat.<br />
While the jury may still be out on inflation, higher interest rates are a reality and will be problematic for<br />
stocks on several levels. Higher interest rates might trim the economy and restrain corporate earnings<br />
growth, putting consensus estimates of 9% to 10% gains for 1997 in jeopardy. Higher rates also boost<br />
the U.S. dollar, further crimping the U.S. dollar value of international earnings. Whether you are looking<br />
at stocks on the basis of asset values or using a dividend discount model, public prices of equities tend<br />
to decline as interest rates rise, all else constant. So, price/cash flow and price/earnings multiples would<br />
contract, should interest rates rise.<br />
3
<strong>The</strong> wild card will be how investors react to any sustained decline in stock prices. A tremendous<br />
amount of money has flowed into the equities market in the last three years. Will it back out at the first<br />
sign of serious trouble It may not be how the great unwashed public reacts, but rather how the great<br />
unwashed professional investors — those twenty and thirty something mutual fund managers who have<br />
never experienced even a substantial market correction — respond to the perceived crisis. Will they see<br />
the glass half empty or half full We don’t know.<br />
While we are dwelling on things on our watch list, we should also mention the strong dollar.<br />
Despite the enormous advances in the quality of American made goods in a wide variety of industries,<br />
the strong dollar will restrain exports and currency translation will have an adverse impact on the<br />
earnings of U.S. based multi-national companies. Longer term, we must also be sensitive to the fact<br />
that substantial cost reductions and productivity gains in American industry over the last five years may<br />
be close to running their course. In other words, profit margins are unlikely to advance further.<br />
We don’t view a market correction as bad news. In general, we are not exposed to those sectors<br />
and individual companies that have benefited most from investor euphoria and which are, therefore,<br />
most vulnerable to a dramatic change in investor sentiment. If anything, a market correction should<br />
provide a more level playing field for disciplined investors focusing on the fundamental value of<br />
individual stocks. We are just now emerging from a two year period in which fundamentals have<br />
mattered much less than market momentum. We are entering what may prove to be an extended<br />
period in which stock pickers excel.<br />
Must Carry<br />
In an upset rivaling the University of Arizona's victory over Kentucky in the 1997 NCAA basketball<br />
championship, the Supreme Court voted 5 to 4 to uphold the “must carry” provision for local broadcast<br />
companies. <strong>The</strong> must carry rule specified that cable television systems must make one-third of their<br />
channel capacity available free to local broadcasters. Led by Ted Turner, the cable television industry<br />
had challenged the rule on the grounds that it violated their first amendment rights. <strong>The</strong> industry’s<br />
economic goal was to free up channel capacity for new cable television networks providing more<br />
popular programming and paying the cable operator for channel space. <strong>The</strong> consensus of the lawyers<br />
on both sides of the issue was the cable guys would win. However, the Supreme Court decided that<br />
allowing cable operators to exclude local broadcast channels would create undue economic hardship<br />
for many broadcasters and threaten the survival of weaker independents.<br />
Who are the winners and losers <strong>The</strong> broadcasters, particularly those with extensive UHF<br />
properties get a renewed lease on life as they maintain and in some cases add to their cable audience.<br />
<strong>The</strong> entrenched cable television networks, like International Family Entertainment, Inc. (FAM -<br />
$20.375 - NYSE), BET Holdings, Inc. (BTV - $29.625 - NYSE), Gaylord Entertainment Company<br />
(GET - $21.50 - NYSE), HSN, Inc. (HSNI - $25.375 - NASDAQ) and Tele-Communications,<br />
Inc./Liberty Media Group (LBTYA - $19.9375 - NASDAQ) benefit because with cable channel capacity<br />
4
still restrained, the value of their “slots” with cable operators increase in value. For example, the<br />
prospective value of International Family Entertainment to a News Corporation Limited (NWS - $18.00 -<br />
NYSE), which is trying to expand distribution of its programming, increases substantially. <strong>The</strong> biggest<br />
losers are the cable television network wannabes who will have to wait until cable operators complete<br />
upgrades to their systems before channel space is available.<br />
<strong>Global</strong> Trends: Positioning the Portfolio for the New Millennium<br />
We have identified several global trends in telecommunications which should continue to surface<br />
values: a huge, rapidly growing market; exploding demand; deregulation; and digital technology. In<br />
1995, telecom services world-wide was a $600 billion industry. By 2000, it is projected to exceed a<br />
trillion dollars. Today, half the world’s population has never made a telephone call. Consumer desire<br />
for value-added communications is driving rapid growth in traditional land-line telephone and wireless<br />
services. Countries must build information highways for the 21st century.<br />
Around the world, countries are opening their telecom markets to competition. In the U.S., the<br />
<strong>Telecommunications</strong> Reform Act of 1996 removed regulatory barriers between industry segments (local<br />
telephone, long distance, and cable TV) to encourage competition and spur development. Europe<br />
plans to open its markets to competitive forces by 1998. Foreign governments in Asia and elsewhere<br />
are opening their markets, creating growth opportunities.<br />
Digital technology is facilitating new services like the Internet, satellites (e.g., DirecTV) and<br />
personal communications services (PCS). New technology means lower costs for communication<br />
companies and lower prices for consumers.<br />
Let’s Talk Stocks<br />
<strong>The</strong> following are stock specifics on selected holdings of our <strong>Fund</strong>. Favorable EBITDA prospects<br />
do not necessarily translate into higher stock prices, but they do express a positive trend which we<br />
believe will develop over time.<br />
AirTouch Communications Inc. (ATI - $23.00 - NYSE) is one of the premier players in global wireless<br />
communications. Operating in attractive cellular markets in the U.S. and overseas (including Germany,<br />
Japan, Portugal, Sweden, Belgium, Italy, Spain and South Korea), the company is well-positioned to<br />
participate in the world-wide expansion of wireless communications. Roughly half of the company’s<br />
current 8.5 million world-wide cellular customers are located in the U.S. Annual growth is estimated at<br />
30% to 40%. AirTouch is in the process of strengthening its cellular position in the U.S. with the<br />
acquisition of U.S. West Media Group’s cellular and personal communications services (PCS)<br />
properties previously held in a shared joint venture.<br />
BC TELECOM Inc. (BCT - $21.85 - TSE) is a full-service telecommunications company operating in<br />
British Columbia, Canada. Its major investor is GTE Corporation (GTE - $45.50 - NYSE), which owns<br />
5
52% of the company. We estimate the private market value of BCT to be $50 per share. Its basic<br />
telephone operations provide service to more than two million telephone lines and are growing at twice<br />
the Canadian industry average. BCT’s crown jewel is a rapidly growing cellular phone company which<br />
currently serves 324,850 subscribers. We expect BCT to take advantage of the deregulatory trend in<br />
Canada by entering new businesses in which they are now allowed to participate.<br />
Cable & Wireless, PLC (CWP - $23.75 - NYSE) is a United Kingdom-based company comprised of<br />
broad global telecommunications interests. CWP has bolstered its presence in the increasingly<br />
competitive U.K. communications market following a major restructuring. <strong>The</strong> company now owns 53%<br />
of a new, publicly-traded U.K. based company which owns 100% of Mercury Communications, the<br />
second largest provider of telecom services in Britain (after British <strong>Telecommunications</strong>), and a majority<br />
of U.K. Cable TV/Telco Companies including Bell Cable Media, Nynex CableComms and Videotron<br />
Holdings plc. Hong Kong Telecom (58% owned by CWP), the dominant telecom service provider in<br />
Hong Kong, remains the “crown jewel” of the CWP portfolio and represents approximately $18 per<br />
CWP share. Deducting CWP’s interest in Hong Kong Telecom at its public market value, we are<br />
paying about three times the EBITDA of CWP’s other assets. CWP is attractive based on its high rate<br />
of growth and reasonable stock market valuation.<br />
Comcast Corporation (CMCSA - $16.375 - NASDAQ) is the fourth-largest cable company in the U.S.,<br />
serving approximately 4.3 million subscribers. <strong>The</strong> company owns a cellular telephone business<br />
serving eight million “POP”s in the high traffic, mid-Atlantic region including parts of New Jersey,<br />
Pennsylvania and Delaware. In addition to its controlling ownership of QVC, the cable TV retailer,<br />
Comcast recently added to its programming investments by purchasing a controlling interest in the<br />
Philadelphia 76ers, Philadelphia Flyers and two arenas. We estimate Comcast’s PMV to be about $29<br />
per share.<br />
Tele-Communications, Inc. (TCOMA - $12.00 - NASDAQ), the largest cable TV operator in the U.S.,<br />
serving about 14 million subscribers, is guided by Dr. John C. Malone - one of the most shareholder<br />
sensitive managers we have found. Regulation has historically played a major role in the valuation of<br />
cable properties. We believe that the passage of the <strong>Telecommunications</strong> Reform Act of 1996,<br />
combined with the current deregulatory climate in Congress, could prove to be a significant catalyst for<br />
cable stocks. Strategically, TCOMA is a well-positioned industry leader, from its wireless telephony<br />
PCS venture with Sprint, Comcast and Cox, to its innovative Internet access business, dubbed<br />
“@Home”, to its 80% stake in Tele-Communications International, Inc. A major cost containment effort<br />
is beginning to show results, leading to substantial increases in operating cash flow.<br />
Telecomunicacoes Brasileiras SA (Telebras) (TBR - $102.375 - NYSE) is the Brazilian governmentcontrolled<br />
monopoly telecommunications holding company consisting of 28 subsidiaries serving more<br />
than 14 million telephone lines and two million cellular customers in a country with a population of 160<br />
million. <strong>The</strong> penetration rate is less than 9% for telephone and 1% for cellular. <strong>The</strong> stock is attractively<br />
priced at less than five times our estimate of 1997 cash flow. Future opportunities include the<br />
6
prospects of privatization, strong line growth and improvements in efficiency. <strong>The</strong> company is<br />
benefiting from an improved rate structure which allows the company to recoup inflation-related cost<br />
increases on a more consistent basis.<br />
Telefonica de Espana (TEF - $71.75 - NYSE) is a diversified telecommunications service provider<br />
offering services to more than 15 million lines. <strong>The</strong> company also services a fast growing cellular<br />
subscriber base which now exceeds two million subscribers. We consider TEF an ideal way to invest<br />
in Latin America, with a diversified portfolio of telecommunication operations in the region. Its portfolio<br />
of publicly-traded Latin American companies includes: Compania Telefonos Chile, Telefonica de<br />
Argentina S.A. and Compania Peruana de Telefonos. TEF also holds interests in non-public Latin<br />
American telecom operations in Mexico, Colombia, Puerto Rico, Uruguay and Venezuela. <strong>The</strong><br />
company’s long-term strategy is to create a Pan-American network, leveraging the Spanish-speaking<br />
world. TEF jump-started this effort with its decision to form a global alliance with British Telecom/MCI’s<br />
Concert plc, which is gaining momentum in the race to become the dominant provider of one-stop<br />
shopping for full-service, global telecommunications products.<br />
Vodafone Group plc (VOD - $44.125 - NYSE) is a U.K.-based global provider of wireless<br />
telecommunications services. <strong>The</strong> company’s major interests in the U.K. include cellular, paging and<br />
data transmission. 630,000 net new customers were added last year, to reach a subscriber base of<br />
2,450,000. Vodafone’s shares sell at one of the lowest multiples of EBITDA among the major wireless<br />
companies, despite a pristine balance sheet and prospects for 20% annual growth in earnings and<br />
cash flow. Management is highly respected and has positioned the company to share in the exciting<br />
and rapidly growing global market for wireless communications.<br />
Telephone and Data Systems, Inc (TDS - $38.375 - ASE) is oriented to create substantial shareholder<br />
value (as compared to focusing on near-term earnings per share). TDS is a domestic provider of local<br />
telephone service to about 493,000 mostly rural access lines and is the seventh largest cellular<br />
telephone company in the U.S. with a fast growing paging company. Consolidated operating cash flow<br />
rose 25% in 1996, driven mainly by internal growth in cellular telephone. Cellular telephone<br />
subscribers grew by almost 55% to over one million at year-end 1996. We expect strong growth at<br />
TDS to result in a private market value of $160 per share by 2000. TDS has been active in the PCS<br />
auctions and was the high bidder in eight markets with a combined population of 27 million. TDS’s<br />
investments in U.S. Cellular, American Portable Telephone and American Paging, at their current<br />
market prices, are worth $35 per TDS share.<br />
7
Minimum Initial Investment - $1,000<br />
Effective August 12, 1996 <strong>The</strong> <strong>Gabelli</strong> <strong>Global</strong> <strong>Telecommunications</strong> <strong>Fund</strong>’s minimum initial<br />
investment is $1,000 for all accounts. <strong>The</strong>re are no subsequent investment minimums. No initial<br />
minimum is required for those establishing an Automatic Investment Plan. <strong>The</strong> <strong>Gabelli</strong> <strong>Global</strong><br />
<strong>Telecommunications</strong> <strong>Fund</strong> and other <strong>Gabelli</strong> <strong>Fund</strong>s are available through the no-transaction fee<br />
programs at many major discount brokerage firms.<br />
Internet<br />
You can now visit us on the Internet. Our home page at http://www.gabelli.com contains<br />
information about <strong>Gabelli</strong> <strong>Fund</strong>s, Inc., the <strong>Gabelli</strong> Mutual <strong>Fund</strong>s, quarterly reports, closing prices, IRAs,<br />
401(k)s and other current news. You can also send us e-mail at info@gabelli.com.<br />
In Conclusion<br />
<strong>The</strong> <strong>Fund</strong>’s daily net asset value is available in the financial press and each evening after<br />
6:00 PM (Eastern Time) by calling 1-800-GABELLI (1-800-422-3554). <strong>The</strong> <strong>Fund</strong>’s NASDAQ symbol is<br />
GABTX. Please call us during the day for further information.<br />
Sincerely,<br />
Mario J. <strong>Gabelli</strong>, CFA<br />
President and Portfolio Manager<br />
Marc J. <strong>Gabelli</strong><br />
Associate Portfolio Manager<br />
May 1, 1997<br />
Ivan Arteaga, CPA<br />
Associate Portfolio Manager<br />
Top Ten Holdings<br />
March 31, 1997<br />
Telefonica de Espana<br />
Telecomunicacoes Brasileiras SA (Telebras)<br />
Telephone & Data Systems, Inc.<br />
Cable & Wireless plc<br />
AirTouch Communications Inc.<br />
Vodafone Group plc<br />
BC Telecom Inc.<br />
Cia De Telefonos Chile<br />
Comcast Corporation<br />
Tele-Communications, Inc.<br />
NOTE: <strong>The</strong> views expressed in this report reflect those of the portfolio manager only through the end<br />
of the period of this report as stated on the cover. <strong>The</strong> manager’s views are subject to change at any<br />
time based on market and other conditions.<br />
8
<strong>The</strong> <strong>Gabelli</strong> <strong>Global</strong> Telecommunication <strong>Fund</strong><br />
Portfolio of Investments Ì March 31, 1997 (Unaudited)<br />
Shares Value Shares Value<br />
COMMON STOCKS Ì 94.45% 20,000 Sprint Corporation ÏÏÏÏÏÏÏÏÏÏÏÏÏÏÏÏÏ $ 910,000<br />
Alternative Telecommunication Service<br />
4,000 Teleglobe Inc. ÏÏÏÏÏÏÏÏÏÏÏÏÏÏÏÏÏÏÏÏ 115,896<br />
500<br />
Providers Ì 1.70%<br />
Bouygues GroupÏÏÏÏÏÏÏÏÏÏÏÏÏÏÏÏÏÏÏ $ 49,681<br />
5,130,945<br />
4,000 Esprit Telecom Group Plc ÏÏÏÏÏÏÏÏÏÏÏ 47,500 Miscellaneous Ì 1.49%<br />
15,000 GST <strong>Telecommunications</strong> Inc.‰ ÏÏÏÏÏÏ 112,500 3,000 Lodgenet Entertainment Corporation‰ ÏÏ 31,500<br />
15,000 ICG Communications Inc. ÏÏÏÏÏÏÏÏÏÏÏ 170,625 6,000 Metromedia International Group Inc. ÏÏÏ 52,125<br />
1,000 Intermedia Communications Inc.‰ ÏÏÏÏÏ 16,625 10,000 News Corporation Limited ADR ÏÏÏÏÏÏÏ 180,000<br />
2,500 Mannesmann AG ÏÏÏÏÏÏÏÏÏÏÏÏÏÏÏÏÏÏ 951,493 10,000 Price Communications Corporation ÏÏÏÏ 97,500<br />
400 Teleport Communications Group Inc. 22,000 Time Warner Inc. ÏÏÏÏÏÏÏÏÏÏÏÏÏÏÏÏÏÏ 951,500<br />
Cl. A‰ ÏÏÏÏÏÏÏÏÏÏÏÏÏÏÏÏÏÏÏÏÏÏÏÏÏ 9,200 3,000 Veba AG ÏÏÏÏÏÏÏÏÏÏÏÏÏÏÏÏÏÏÏÏÏÏÏÏÏ 171,582<br />
15,000 WorldCom ÏÏÏÏÏÏÏÏÏÏÏÏÏÏÏÏÏÏÏÏÏÏÏ 330,000<br />
1,484,207<br />
1,687,624<br />
Publishing Ì 0.43%<br />
Aviation: Parts and Accessories Ì 0.71%<br />
14,000 Media General Inc. Class A ÏÏÏÏÏÏÏÏÏÏ 397,250<br />
13,000 General Motors Corporation Cl. H ÏÏÏÏÏ 705,250<br />
100,000 Seat Spa*ÏÏÏÏÏÏÏÏÏÏÏÏÏÏÏÏÏÏÏÏÏÏÏÏ 34,635<br />
431,885<br />
Cable Ì 10.32%<br />
Regional/Local Telephone Services Ì 13.71%<br />
50,000 Adelphia Communications Corporation<br />
44,000 Aliant Communications Inc. ÏÏÏÏÏÏÏÏÏ 726,000<br />
Cl. A‰ ÏÏÏÏÏÏÏÏÏÏÏÏÏÏÏÏÏÏÏÏÏÏÏÏÏ 268,750<br />
28,000 ALLTEL CorporationÏÏÏÏÏÏÏÏÏÏÏÏÏÏÏÏ 910,000<br />
32,000 Bell Cablemedia plc ADR‰ ÏÏÏÏÏÏÏÏÏÏÏ 504,000<br />
24,000 Ameritech Corporation ÏÏÏÏÏÏÏÏÏÏÏÏÏÏ 1,476,000<br />
30,000 Cablevision Systems Corporation Cl. A‰ 892,500<br />
38,000 Atlantic Tele-Network Inc.‰ ÏÏÏÏÏÏÏÏÏÏ 465,500<br />
65,000 Century Communications Corporation<br />
8,000 Bell Atlantic Corporation ÏÏÏÏÏÏÏÏÏÏÏÏ 487,000<br />
Cl. A‰ ÏÏÏÏÏÏÏÏÏÏÏÏÏÏÏÏÏÏÏÏÏÏÏÏÏ 300,625<br />
35,000 BellSouth Corporation ÏÏÏÏÏÏÏÏÏÏÏÏÏÏ 1,478,750<br />
110,000 Comcast Corporation Cl. A‰ ÏÏÏÏÏÏÏÏÏ 1,801,250<br />
9,000 Bruncor, Inc. ÏÏÏÏÏÏÏÏÏÏÏÏÏÏÏÏÏÏÏÏÏ 194,436<br />
42,000 Comcast U.K. Cable Partners Limited‰ 467,250<br />
1,000 Cincinnati Bell Inc. ÏÏÏÏÏÏÏÏÏÏÏÏÏÏÏÏ 56,500<br />
10,000 General Cable Corporation plc ADR‰ÏÏÏ 148,750<br />
62,000 C-TEC Corporation Cl. B ÏÏÏÏÏÏÏÏÏÏÏÏ 1,821,250<br />
42,200 International CableTel Incorporated‰ ÏÏÏ 891,475<br />
1,000 First PaciÑc Company Ltd. Spons. ADR 63,556<br />
18,500 NYNEX CableComms Group plc ADR‰ 307,563<br />
30,000 Frontier Corporation ÏÏÏÏÏÏÏÏÏÏÏÏÏÏÏÏ 536,250<br />
20,000 Rogers Communications, Inc. Cl. B ÏÏÏÏ 125,000<br />
38,000 GTE CorporationÏÏÏÏÏÏÏÏÏÏÏÏÏÏÏÏÏÏÏ 1,771,750<br />
75,000 Tele-Communications, Inc. Cl. A‰ ÏÏÏÏÏ 900,000<br />
15,000 Island Telephone Company LimitedÏÏÏÏ 287,211<br />
60,375 Tele-Communications, Inc./Liberty<br />
19,000 Maritime Telegraph and Telephone<br />
Media Group Cl. A‰ ÏÏÏÏÏÏÏÏÏÏÏÏÏÏ 1,203,727<br />
Company Limited ÏÏÏÏÏÏÏÏÏÏÏÏÏÏÏÏ 316,438<br />
35,000 <strong>Telecommunications</strong> International Inc.<br />
12,000 NewTel Enterprises Limited ÏÏÏÏÏÏÏÏÏÏ 209,827<br />
Cl. A‰ ÏÏÏÏÏÏÏÏÏÏÏÏÏÏÏÏÏÏÏÏÏÏÏÏÏ 450,625<br />
3,000 NYNEX Corporation ÏÏÏÏÏÏÏÏÏÏÏÏÏÏÏÏ 136,875<br />
6,000 Telewest Communications plc ADR‰ ÏÏÏ 104,250<br />
12,000 PaciÑc Telecom, Inc. ÏÏÏÏÏÏÏÏÏÏÏÏÏÏÏ 360,000<br />
90,000 United International Holdings Inc. Cl. A‰ 855,000<br />
3,000 PaciÑc Telesis Group Inc. ÏÏÏÏÏÏÏÏÏÏÏ 113,250<br />
55,000 US WEST Media Group‰ ÏÏÏÏÏÏÏÏÏÏÏÏ 1,024,375<br />
3,000 Peoples Telephone Company Inc.‰ ÏÏÏÏ 10,125<br />
10,245,140 10,000 Quebec-Telephone‰ ÏÏÏÏÏÏÏÏÏÏÏÏÏÏÏÏ 171,243<br />
10,000 SBC Communications, Inc. ÏÏÏÏÏÏÏÏÏÏ 526,250<br />
Long Distance Telephone Companies Ì 5.17%<br />
28,000 Southern New England<br />
25,000 AT&T Corp. ÏÏÏÏÏÏÏÏÏÏÏÏÏÏÏÏÏÏÏÏÏÏ 868,750<br />
<strong>Telecommunications</strong> Corporation ÏÏÏÏ 1,004,500<br />
25,000 Call-Net Enterprises Inc.‰ ÏÏÏÏÏÏÏÏÏÏÏ 388,367<br />
10,000 Telus CorporationÏÏÏÏÏÏÏÏÏÏÏÏÏÏÏÏÏÏ 154,624<br />
25,000 Cam-Net Communications Network<br />
10,000 US WEST Communications GroupÏÏÏÏÏ 340,000<br />
Inc.‰ ÏÏÏÏÏÏÏÏÏÏÏÏÏÏÏÏÏÏÏÏÏÏÏÏÏ 1,550<br />
13,617,335<br />
165 DDI Corporation ÏÏÏÏÏÏÏÏÏÏÏÏÏÏÏÏÏÏÏ 1,041,207<br />
5,000 Fonorola Inc.‰ ÏÏÏÏÏÏÏÏÏÏÏÏÏÏÏÏÏÏÏÏ 72,254 Satellite Ì 0.47%<br />
100,000 General Communication Inc. Cl. A‰ ÏÏÏÏ 668,750 1,000 British Sky Broadcasting Group ADRÏÏÏ 60,625<br />
6,500 Kokusai DenshinÏÏÏÏÏÏÏÏÏÏÏÏÏÏÏÏÏÏÏ 378,921 8,000 Echostar Communications Corporation<br />
5,000 LCI International Inc.‰ ÏÏÏÏÏÏÏÏÏÏÏÏÏÏ 83,750 Cl. A‰ ÏÏÏÏÏÏÏÏÏÏÏÏÏÏÏÏÏÏÏÏÏÏÏÏÏ 164,000<br />
6,000 MCI Communications Corporation ÏÏÏÏÏ 213,750 452 <strong>Global</strong>star Capital, Corp. ÏÏÏÏÏÏÏÏÏÏÏÏ 12,204<br />
66,000 P.D.L. Holdings Limited ÏÏÏÏÏÏÏÏÏÏÏÏÏ 387,750 2,000 PT Indonesia Satellite ÏÏÏÏÏÏÏÏÏÏÏÏÏÏ 53,500<br />
9
<strong>The</strong> <strong>Gabelli</strong> <strong>Global</strong> Telecommunication <strong>Fund</strong><br />
Portfolio of Investments (Continued) Ì March 31, 1997 (Unaudited)<br />
Shares Value Shares Value<br />
COMMON STOCKS (continued) 20,000 Singapore <strong>Telecommunications</strong><br />
Satellite (continued)<br />
Limited ÏÏÏÏÏÏÏÏÏÏÏÏÏÏÏÏÏÏÏÏÏÏÏÏ $ 41,522<br />
20,000 TCI Satellite Entertainment Cl A‰ ÏÏÏÏÏ $ 155,000<br />
28,000 STET SpA Ì Societa Financiaria<br />
2,000 U.S. Satellite Broadcasting Co.‰ ÏÏÏÏÏÏ 21,500<br />
Telfonica SpA ADRÏÏÏÏÏÏÏÏÏÏÏÏÏÏÏ 1,214,500<br />
8,000 Tele Danmark A/S ADRÏÏÏÏÏÏÏÏÏÏÏÏÏ 209,000<br />
466,829<br />
18,000 Telecom Argentina Stet Ì France<br />
<strong>Telecommunications</strong> (Other) Ì 0.28%<br />
Telecom S.A. ADR ÏÏÏÏÏÏÏÏÏÏÏÏÏÏÏ 828,000<br />
2,500 Great Nordic Stores ÏÏÏÏÏÏÏÏÏÏÏÏÏÏÏÏ 261,112<br />
326,086 Telecom Asia ÏÏÏÏÏÏÏÏÏÏÏÏÏÏÏÏÏÏÏÏÏ 555,401<br />
2,000 United Communication IndustryÏÏÏÏÏÏÏ 12,933<br />
2,000 Telecom Asia ADR ÏÏÏÏÏÏÏÏÏÏÏÏÏÏÏÏÏ 35,200<br />
19,000 Telecom Corporation of New Zealand<br />
274,045 Ltd. ADRÏÏÏÏÏÏÏÏÏÏÏÏÏÏÏÏÏÏÏÏÏÏÏ 1,349,000<br />
Telephone Equipment Ì 3.12%<br />
350,000 Telecom Italia SpA‰ ÏÏÏÏÏÏÏÏÏÏÏÏÏÏÏÏ 871,551<br />
60,000 Champion Technology Holdings ADR ÏÏ 45,300<br />
36,000 Telecomunicacoes Brasileiras<br />
4,400 Ericsson (L.M.) Telephone Company<br />
(Telebras) S.A. Spons. ADR ÏÏÏÏÏÏÏ 3,685,500<br />
ADR ÏÏÏÏÏÏÏÏÏÏÏÏÏÏÏÏÏÏÏÏÏÏÏÏÏÏ 148,775<br />
938,570 Telecomunicacoes de Sao Paulo SA<br />
10,000 General Instrument Corporation ÏÏÏÏÏÏÏ 228,750<br />
(Telesp)ÏÏÏÏÏÏÏÏÏÏÏÏÏÏÏÏÏÏÏÏÏÏÏ 234,864<br />
9,000 Lucent Technologies, Inc. ÏÏÏÏÏÏÏÏÏÏÏ 474,750<br />
4,000,000 <strong>Telecommunications</strong> of Jamaica ÏÏÏÏÏÏ 404,000<br />
500 Siemens AG Ì ADRÏÏÏÏÏÏÏÏÏÏÏÏÏÏÏÏ 26,942<br />
45,000 Telefonica de Argentina S.A. ADR ÏÏÏÏÏ 1,321,875<br />
2,500 Motorola, Inc. ÏÏÏÏÏÏÏÏÏÏÏÏÏÏÏÏÏÏÏÏ 150,938<br />
55,000 Telefonica de Espana ADRÏÏÏÏÏÏÏÏÏÏÏ 3,802,750<br />
25,000 Northern Telecom Limited ÏÏÏÏÏÏÏÏÏÏÏ 1,634,375<br />
50,000 Telefonos De Mexico S.A. Cl. L ADR ÏÏ 1,925,000<br />
10,000 ScientiÑc-Atlanta, Inc. ÏÏÏÏÏÏÏÏÏÏÏÏÏÏ 152,500<br />
190,000 Telekom Malaysia Berhad ÏÏÏÏÏÏÏÏÏÏÏ 1,479,225<br />
115,500 Time Engineering Berhad ÏÏÏÏÏÏÏÏÏÏÏÏ 239,946<br />
8,075 Thai Telephone & Telecom GDR ÏÏÏÏÏÏ 20,296<br />
3,102,276<br />
36,391,960<br />
Telephone Networks Ì 36.64% Wireless Communications Ì 20.41%<br />
110,000 BC TELECOM Inc. ÏÏÏÏÏÏÏÏÏÏÏÏÏÏÏÏÏ 2,404,263 40,000 ABC Communications Holdings Ltd. ÏÏÏ $ 9,292<br />
45,000 BCE Inc. ÏÏÏÏÏÏÏÏÏÏÏÏÏÏÏÏÏÏÏÏÏÏÏÏ 2,070,000 100,000 AirTouch Communications Inc.‰ ÏÏÏÏÏÏ 2,300,000<br />
3,000 BHI Corporation ÏÏÏÏÏÏÏÏÏÏÏÏÏÏÏÏÏÏÏ 58,125 73,000 Aerial Communications Inc.‰ ÏÏÏÏÏÏÏÏÏ 401,500<br />
3,000 British <strong>Telecommunications</strong> plc ADRÏÏÏ 210,000 2,000 American Mobile Satellite Corporation‰ 22,500<br />
120,000 Cable & Wireless plc ADR ÏÏÏÏÏÏÏÏÏÏÏ 2,850,000 72,000 American Paging, Incorporated‰ ÏÏÏÏÏÏ 252,000<br />
80,000 Compagnia Telefonos Chile S.A. ÏÏÏÏÏÏ 2,300,000 100 Asia Satellite Telcommunications<br />
30,000 CP Pokphand Spons. ADRÏÏÏÏÏÏÏÏÏÏÏ 241,965 Holdings Ltd. ÏÏÏÏÏÏÏÏÏÏÏÏÏÏÏÏÏÏÏ 2,563<br />
525,100 CPT Telefonica del Peru Cl. B ÏÏÏÏÏÏÏÏ 1,168,213 14,200 Associated Group, Inc. Cl. A‰ ÏÏÏÏÏÏÏÏ 536,050<br />
1,000 CPT Telefonica del Peru Cl. B ADRÏÏÏÏ 22,250 16,000 Associated Group, Inc. Cl. B‰ ÏÏÏÏÏÏÏÏ 580,000<br />
9,000 Deutsche Telecom AG‰ ÏÏÏÏÏÏÏÏÏÏÏÏÏ 196,875 14,000 BCE Mobile Communications Inc.‰ ÏÏÏÏ 424,855<br />
3,430 Hellenic <strong>Telecommunications</strong> 20,000 Cellular Communications International<br />
Organization S.A. (OTE) ÏÏÏÏÏÏÏÏÏÏ 74,139 Inc.‰ ÏÏÏÏÏÏÏÏÏÏÏÏÏÏÏÏÏÏÏÏÏÏÏÏÏ 555,000<br />
15,000 Hong Kong <strong>Telecommunications</strong> Ltd. 105,000 Centennial Cellular Corp. Cl. A‰ÏÏÏÏÏÏÏ 1,089,375<br />
ADR ÏÏÏÏÏÏÏÏÏÏÏÏÏÏÏÏÏÏÏÏÏÏÏÏÏÏ 245,625 30,000 Century Telephone Enterprises, Inc. ÏÏÏ 885,000<br />
8,000 PT Telekomunikasi Indonesia*ÏÏÏÏÏÏÏÏ 241,000 2,000 Commnet Cellular Inc.‰ ÏÏÏÏÏÏÏÏÏÏÏÏÏ 51,000<br />
1,000 Hungarian Telephone & Cable 50,000 COMSAT Corporation ÏÏÏÏÏÏÏÏÏÏÏÏÏÏÏ 1,218,750<br />
CorporationÏÏÏÏÏÏÏÏÏÏÏÏÏÏÏÏÏÏÏÏÏ 9,750 400 Omnipoint Corporation ÏÏÏÏÏÏÏÏÏÏÏÏÏÏ 3,900<br />
40 Japan Telecom Co. Ltd. ÏÏÏÏÏÏÏÏÏÏÏÏ 675,420 150,000 Technology Resources Industries ÏÏÏÏÏ 326,745<br />
8,000 MIDCOM Communications Inc.‰ ÏÏÏÏÏÏ 64,000 1,000 CoreComm Inc. ÏÏÏÏÏÏÏÏÏÏÏÏÏÏÏÏÏÏÏ 14,500<br />
167 Nippon Telegraph & Telephone 4,000 <strong>Global</strong>star <strong>Telecommunications</strong><br />
Corporation‰ÏÏÏÏÏÏÏÏÏÏÏÏÏÏÏÏÏÏÏÏ 1,176,075 Limited‰ ÏÏÏÏÏÏÏÏÏÏÏÏÏÏÏÏÏÏÏÏÏÏÏ 214,000<br />
10,000 Nippon Telegraph & Telephone 44,000 Grupo Iusacell S.A. ADR Ser. D‰ÏÏÏÏÏÏ 368,500<br />
Corporation ADR ÏÏÏÏÏÏÏÏÏÏÏÏÏÏÏÏ 358,750 26,000 Himachal(a)ÏÏÏÏÏÏÏÏÏÏÏÏÏÏÏÏÏÏÏÏÏÏ 32,933<br />
50,000 Nordictel Holdings AB‰ ÏÏÏÏÏÏÏÏÏÏÏÏÏ 1,029,938 24,000 Jasmine International(a) ÏÏÏÏÏÏÏÏÏÏÏÏ 33,718<br />
800 Pakistan <strong>Telecommunications</strong> GDR‰ ÏÏÏ 60,000 15,000 Loral Space & Communications Ltd.‰ 211,875<br />
26,900 Philippine Long Distance Telephone 5,300 Matrix <strong>Telecommunications</strong> Ltd.‰ ÏÏÏÏÏ 8,540<br />
Company ÏÏÏÏÏÏÏÏÏÏÏÏÏÏÏÏÏÏÏÏÏÏ 1,610,638 1,500 Metrocall, Inc.‰ ÏÏÏÏÏÏÏÏÏÏÏÏÏÏÏÏÏÏÏ 6,188<br />
12,000 Portugal Telecom S.A. ADR ÏÏÏÏÏÏÏÏÏÏ 441,000 8,000 Mobile Telecommunication<br />
25,000 Kominklijke PTT Nederland NV ADR ÏÏÏ 906,250 Technologies Corp.‰ ÏÏÏÏÏÏÏÏÏÏÏÏÏ 50,000<br />
10
<strong>The</strong> <strong>Gabelli</strong> <strong>Global</strong> Telecommunication <strong>Fund</strong><br />
Portfolio of Investments (Continued) Ì March 31, 1997 (Unaudited)<br />
Principal<br />
Amount<br />
or Shares Value Shares Value<br />
COMMON STOCKS (continued) Long Distance Telephone Companies Ì 0.69%<br />
Wireless Communications (continued)<br />
10,000 Philippine Long Distance Telephone<br />
$ Company 7.00% Cv. Pfd. Ser. 111 ÏÏ $ 550,000<br />
4,000 Sprint Corporation 8.25% Cv. Pfd. ÏÏÏÏ 137,500<br />
11,000<br />
8,000<br />
NEXTEL Communications, Inc. Cl. A‰ ÏÏ<br />
Palmer Wireless Inc. ÏÏÏÏÏÏÏÏÏÏÏÏÏÏÏ<br />
147,125<br />
98,000<br />
1,000 PanAmSat Corporation‰ÏÏÏÏÏÏÏÏÏÏÏÏÏ 28,750<br />
8,000 PittencrieÅ Communications, Inc.‰ ÏÏÏÏ 28,500<br />
687,500<br />
31,000 PriCellular Corporation ÏÏÏÏÏÏÏÏÏÏÏÏÏÏ 255,750 TELECOMMUNICATION Ì<br />
Wireless Communications Ì 0.36%<br />
Cl. B ÏÏÏÏÏÏÏÏÏÏÏÏÏÏÏÏÏÏÏÏÏÏÏÏÏÏ 790,124 6,222 AirTouch Communications, Inc. 6.00%<br />
1,000 Rural Cellular Corp. Cl. A‰ÏÏÏÏÏÏÏÏÏÏÏ 10,500 Cv. Pfd. Cl. B ÏÏÏÏÏÏÏÏÏÏÏÏÏÏÏÏÏÏÏ 159,439<br />
70,000 Securicor Group plc ÏÏÏÏÏÏÏÏÏÏÏÏÏÏÏÏ 336,363 3,000 AirTouch Communications, Inc. 4.25%<br />
5,001 360 Communications Company‰ 86,261 Cv. Pfd. Cl. C ÏÏÏÏÏÏÏÏÏÏÏÏÏÏÏÏÏÏÏ 131,250<br />
800,000 Telecom Italia Mobile SpA‰ ÏÏÏÏÏÏÏÏÏÏ 2,293,085 5,000 Mobile Telecommunication<br />
90,000 Telephone and Data Systems, Inc. ÏÏÏÏ 3,453,750 Technologies Corp 144 Ì A(a) ÏÏÏÏ 68,750<br />
2,000 Thyssen AG ÏÏÏÏÏÏÏÏÏÏÏÏÏÏÏÏÏÏÏÏÏÏ 451,343<br />
22,000 Total Access Communications plcÏÏÏÏÏ 95,156<br />
359,439<br />
43,000 Rogers Cantel Mobile Communications<br />
3,000 United States Cellular Corporation‰ÏÏÏÏ 74,625<br />
TOTAL CONVERTIBLE PREFERRED<br />
1,500 Vanguard Cellular Systems, Inc. Cl. A‰ 16,500<br />
1,000 Vimpel Communications‰ ÏÏÏÏÏÏÏÏÏÏÏ 32,000<br />
56,000 Vodafone Group plc ADRÏÏÏÏÏÏÏÏÏÏÏÏ 2,471,000<br />
STOCKS (Cost: $2,421,863)ÏÏÏÏÏÏÏ 2,196,439<br />
PREFERRED STOCKS Ì 0.54%<br />
20,267,616 Telephone Equipment Ì 0.12%<br />
2,000 Nokia Corp. ADR Ì A ÏÏÏÏÏÏÏÏÏÏÏÏÏÏ 116,500<br />
TOTAL COMMON STOCKS<br />
(Cost: $81,371,420) ÏÏÏÏÏÏÏÏÏÏÏÏÏ 93,805,112<br />
Wireless Communications Ì 0.42%<br />
Tel Rio de Janeiro Pfd. ÏÏÏÏÏÏÏÏÏÏÏÏÏ 416,374<br />
CONVERTIBLE CORPORATE BONDS Ì 2.12%<br />
TOTAL PREFERRED STOCKS<br />
Telephone Networks Ì 0.96%<br />
(Cost: $280,139) ÏÏÏÏÏÏÏÏÏÏÏÏÏÏÏ 532,874<br />
$1,000,000 Telekom Malaysia Berhad Sub. Deb. Cv.<br />
4.000%, 10/03/04(a)ÏÏÏÏÏÏÏÏÏÏÏÏ 951,250 TOTAL INVESTMENTS Ì 99.32%<br />
(Cost: $86,013,967) ÏÏÏÏÏÏÏÏÏÏÏÏÏ 98,643,261<br />
Wireless Communications Ì 1.16%<br />
300,000,000(b) Softe SA Unsub. Deb. Cv. 4.25%,<br />
Other Assets less liabilities Ì 0.68% 679,426<br />
07/30/98ÏÏÏÏÏÏÏÏÏÏÏÏÏÏÏÏÏÏÏÏÏÏ 360,086<br />
250,000 Technology Resources Industries Sub.<br />
NET ASSETS Ì 100.00% ÏÏÏÏÏÏÏÏÏÏÏ $99,322,687<br />
Deb. Cv. 2.75%, 11/28/04(a) ÏÏÏÏÏ 287,500<br />
500,000 Tele 2000 Sub. Deb. Cv. 9.75%,<br />
(Shares outstanding 8,794,773) ÏÏÏÏÏÏ $11.29<br />
04/14/97(a) ÏÏÏÏÏÏÏÏÏÏÏÏÏÏÏÏÏÏÏ 510,000<br />
1,157,586<br />
‰ Ì Non-income producing security<br />
ADR Ì American Depositary Receipt<br />
TOTAL CONVERTIBLE CORPORATE<br />
SDR Ì <strong>Global</strong> Depositary Receipt<br />
BONDS (Cost: $1,940,545) ÏÏÏÏÏÏÏ 2,108,836<br />
(a) Ì Security exempt from registration under Rule 144A of the<br />
CONVERTIBLE PREFERRED STOCKS Ì 2.21%<br />
Securities Act of 1933. <strong>The</strong>se securities may be resold in<br />
transactions exempt from registration., normally to qualiÑed<br />
Cable Ì 1.16%<br />
institutional buyers. At March 31, 1997, Rule 144A securities<br />
19,000 Tele-Communications, Inc. Cv. Pfd.<br />
amounted to $1,884,151 or 1.9% of net assets.<br />
Ser. E ÏÏÏÏÏÏÏÏÏÏÏÏÏÏÏÏÏÏÏÏÏÏÏÏÏ $ 1,149,500 (b) Ì Principal amount denoted in Italian Lira.<br />
11
<strong>Gabelli</strong> <strong>Global</strong> Series <strong>Fund</strong>s, Inc.<br />
<strong>The</strong> <strong>Gabelli</strong> <strong>Global</strong> <strong>Telecommunications</strong> <strong>Fund</strong><br />
One Corporate Center<br />
Rye, New York 10580-1434<br />
1-800-GABELLI<br />
®1-800-422-3554©<br />
fax: 1-914-921-5118<br />
http://www.gabelli.com<br />
e-mail: info@gabelli.com<br />
(Net Asset Value may be obtained daily by calling<br />
1-800-GABELLI after 6:00 P.M.)<br />
Board of Directors<br />
Mario J. <strong>Gabelli</strong>, CFA<br />
Chairman and Chief<br />
Investment OÇcer<br />
<strong>Gabelli</strong> <strong>Fund</strong>s, Inc.<br />
Karl Otto P ohl<br />
Former President<br />
Deutsche Bundesbank<br />
Felix J. Christiana<br />
Werner J. Roeder, MD<br />
Former Senior Vice President Director of Surgery<br />
Dollar Dry Dock Savings Bank Lawrence Hospital<br />
Anthony J. Colavita<br />
Anthonie C. van Ekris<br />
Attorney-at-Law Managing Director <strong>The</strong><br />
Anthony J. Colavita, P.C.<br />
BALMAC International, Inc.<br />
John D. <strong>Gabelli</strong><br />
Vice President<br />
<strong>Gabelli</strong> & Company, Inc.<br />
Mario J. <strong>Gabelli</strong>, CFA<br />
President<br />
Bruce N. Alpert<br />
Vice President and Treasurer<br />
James E. McKee<br />
Secretary<br />
OÇcers<br />
Distributor<br />
<strong>Gabelli</strong> & Company, Inc.<br />
Marc J. <strong>Gabelli</strong><br />
Associate Portfolio Manager<br />
Ivan Arteaga, CPA<br />
Associate Portfolio Manager<br />
<strong>Gabelli</strong><br />
<strong>Global</strong><br />
<strong>Telecommunications</strong><br />
<strong>Fund</strong><br />
Custodian, Transfer Agent and Dividend Agent<br />
State Street Bank and Trust Company<br />
Legal Counsel<br />
Skadden, Arps, Slate, Meagher & Flom LLP<br />
This report is submitted for the general information of the shareholders of<br />
<strong>The</strong> <strong>Gabelli</strong> <strong>Global</strong> <strong>Telecommunications</strong> <strong>Fund</strong>. It is not authorized for<br />
distribution to prospective investors unless preceded or accompanied by<br />
FIRST QUARTER REPORT<br />
an eÅective prospectus.<br />
MARCH 31, 1997