Broadband Quality Test Plan - LIRNEasia
Broadband Quality Test Plan - LIRNEasia
Broadband Quality Test Plan - LIRNEasia

Create successful ePaper yourself
Turn your PDF publications into a flip-book with our unique Google optimized e-Paper software.
<strong>Broadband</strong> <strong>Quality</strong> <strong>Test</strong> <strong>Plan</strong><br />
<strong>Broadband</strong> <strong>Quality</strong> <strong>Test</strong> <strong>Plan</strong><br />
Version 1.2<br />
December 2007<br />
Page 1
<strong>Broadband</strong> <strong>Quality</strong> <strong>Test</strong> <strong>Plan</strong><br />
Table of Contents<br />
1 EXPERIMENT DESIGN...................................................................................................................... 3<br />
1.1 METRICS.......................................................................................................................................... 3<br />
1.2 DESTINATIONS ................................................................................................................................4<br />
1.3 MEASUREMENT TECHNIQUES ......................................................................................................... 6<br />
2 TEST SETUP.......................................................................................................................................... 7<br />
2.1 ISPS AND PACKAGES ...................................................................................................................... 7<br />
2.2 TESTING METHODOLOGY................................................................................................................ 7<br />
2.2.1 Download Speed........................................................................................................................ 8<br />
2.2.2 Upload Speed............................................................................................................................. 9<br />
2.2.3 Round Trip Time (RTT) ............................................................................................................. 9<br />
2.2.4 Jitter......................................................................................................................................... 10<br />
2.2.5 Packet Loss.............................................................................................................................. 11<br />
2.2.6 Availability............................................................................................................................... 11<br />
2.3 EXPERIMENTAL METHOD.............................................................................................................. 11<br />
3 TESTING PERIOD ............................................................................................................................. 14<br />
Page 2
<strong>Broadband</strong> <strong>Quality</strong> <strong>Test</strong> <strong>Plan</strong><br />
1 Experiment Design<br />
We define several metrics and destinations.<br />
1.1 Metrics<br />
To measure the <strong>Broadband</strong> connection metrics from the subscriber perspective, we use<br />
the following metrics for our <strong>Broadband</strong> valuation:<br />
1. Download speed (kbps/Mbps): One of the key advertised metrics in broadband<br />
services is the download speed, which defines how much traffic a subscriber can<br />
receive to the maximum. Also the performance of many residential applications<br />
like Web-browsing, downloading content etc, depends on this metric. We will<br />
measure the actual download speed available to the subscriber.<br />
2. Upload Speed (kbps/Mbps): Upstream speed for the Internet connection. This<br />
metrics define the speed in which the subscriber can send traffic to Internet. Plays<br />
a significant role in responsiveness and real-time applications like VoIP etc.<br />
3. RTT (milli-sec): Round Trip Delay. Time taken for the traffic to reach a<br />
particular destination and return. Round-trip delay time is significant in systems<br />
that require two-way interactive communication, such as voice telephony, or<br />
ACK/NAK data systems where the round-trip time directly affects the throughput<br />
rate, such as the Transmission Control Protocol (TCP).<br />
4. Jitter (milli-sec): jitter is the fluctuation/variation of end-to-end delay from one<br />
packet to the next packet within the same packet stream/connection/flow. Jitter<br />
experienced by the packets is more relevant for Real-time traffic like VoIP.<br />
E.g. Radio quality voice requires less than 1 ms Jitter, toll-quality voice requires<br />
less than 20 ms jitter, normal VoIP requires jitter to be less than 30 ms. Beyond<br />
30 ms, VoIP performance will degrade.<br />
(Source:<br />
Connection Magazine, http://www.connectionsmagazine.com/articles/5/049.html,<br />
CISCO Press Article,<br />
http://www.ciscopress.com/articles/article.aspp=357102&rl=1)<br />
5. Packet-Loss (%): Number of packets (in percentage) which doesn’t reach the<br />
destination. Packet-loss can result in highly noticeable performance issues with<br />
Streaming Technologies, VOIP, Videoconferencing, etc, and will affect all other<br />
network applications to a degree.<br />
Page 3
<strong>Broadband</strong> <strong>Quality</strong> <strong>Test</strong> <strong>Plan</strong><br />
6. Availability (in %): <strong>Broadband</strong> availability, indicates the number of times we are<br />
able to access the <strong>Broadband</strong> services. Network non-availability can happen due<br />
to various reasons like line failure, AAA failure, backhaul failure etc. This<br />
metrics indicates the reliability of the <strong>Broadband</strong> service. During our testing if T<br />
attempts are made to connect to the Internet, and if F times the attempt failed,<br />
then Availability = (1–F/T) × 100%. An attempt is declared as failure, if we are<br />
not able to connect to Internet within 30 seconds.<br />
1.2 Destinations<br />
This section explains the destinations used with respect to <strong>Broadband</strong> Evaluation from<br />
India. This destinations needs to be changed, when conducting the test in other<br />
countries.<br />
The following destinations will be used in the evaluation (See Figure 1):<br />
1. ISP site: the website of the service provider<br />
2. National site: well-known sites within the country, preferably hosted by some<br />
other ISP (the one which we are not choosing for our tests)<br />
3. Global site: well-known global sites such as Google, Yahoo, etc. hosted outside<br />
the country<br />
Figure 1: <strong>Test</strong> setup showing local and remote websites<br />
Page 4
<strong>Broadband</strong> <strong>Quality</strong> <strong>Test</strong> <strong>Plan</strong><br />
A = <strong>Broadband</strong> ISP’s Website<br />
B = National Website<br />
C = Global Website<br />
Since some host filters ICMP traffic (Ping), we use different locations for<br />
upload/download and Ping related tests (As much as possible, we try to reuse the same<br />
location for both the tests).<br />
BSNL<br />
Airtel<br />
(Bharti)<br />
Table 1: <strong>Test</strong> Sites<br />
ISP Site National Site Global Site<br />
Upload/Download http://www.dataone.in http://www.zapak.com (or)<br />
http://www.indiatimes.com<br />
http://Mail.yahoo.com<br />
Ping www.Dataone.in www.zapak.com Mail.yahoo.com<br />
Upload/Download http://mail.airtelbroadband.in http://www.zapak.com (or) http://Mail.yahoo.com<br />
http://www.indiatimes.com<br />
Ping 61.95.227.165 www.zapak.com Mail.yahoo.com<br />
The location of the above sites is verified using IP-Locator service available at the<br />
following site (www.geobytes.com/IPLocator.htm). Also the ISP of the host is checked<br />
with the APNIC/ARIN Database through WHOIS service, this can be accessed from the<br />
www.geobytes.com/IPLocator.htm web-page by invoking the URL encircled in Blue<br />
color in Figure 2 : Screenshot of www.geobytes.com.<br />
Figure 2 : Screenshot of www.geobytes.com<br />
Page 5
<strong>Broadband</strong> <strong>Quality</strong> <strong>Test</strong> <strong>Plan</strong><br />
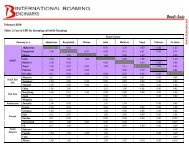
As per the information from www.geobytes.com and WHOIS database from APNIC and<br />
ARIN, the location and ISP of our test sites are:<br />
Table 2 : <strong>Test</strong> Sites and their Locations<br />
<strong>Test</strong> Site Location ISP/Organization<br />
61.95.227.165 Tamilnadu, India Bharti Infotel Ltd.<br />
Mail.airtelbroadband.in New Delhi, India Bharti Infotel Ltd.<br />
www.zapak.com Bangalore, India Reliance Communications Ltd<br />
Mail.yahoo.com California, USA Yahoo Inc.<br />
www.dataone.in Mumbai, India BSNL<br />
www.indiatimes.com<br />
(integra.indiatimes.com) 1 Mumbai, India VSNL<br />
1.3 Measurement Techniques<br />
For each of the destinations, some or all of the metrics are measured. These are shown in<br />
the Table 3.<br />
Table 3 : List of Experiments<br />
S.No. Destinations ISP National Global<br />
Metrics<br />
1 Download Yes Yes Yes<br />
2 Upload Yes Yes Yes<br />
3 RTT Yes Yes Yes<br />
4 Jitter Yes Yes Yes<br />
5 Loss Yes Yes Yes<br />
6 Availability Yes Yes Yes<br />
1<br />
www.indiatimes.com redirect to integra.indiatimes.com for mail services. Integra.indiatimes.com is in<br />
Mumbai, India.<br />
Page 6
<strong>Broadband</strong> <strong>Quality</strong> <strong>Test</strong> <strong>Plan</strong><br />
2 <strong>Test</strong> Setup<br />
2.1 ISPs and Packages<br />
In our testing will benchmark with two ISPs who offers similar Connection <strong>Plan</strong>. With<br />
each ISP the metrics will be collected by Residential-Package and Business-Package.<br />
Table 4: <strong>Broadband</strong> packages and operators (India)<br />
BSNL<br />
Airtel<br />
Business TBD TBD<br />
Residential 256 <strong>Plan</strong> 256 <strong>Plan</strong><br />
2.2 <strong>Test</strong>ing Methodology<br />
The metrics mentioned above are measured using commonly available tools like Ping,<br />
Web-browsers and Network monitoring tools. Brief descriptions of these tools are<br />
mentioned in this section.<br />
Bandwidth Monitor: Bandwidth Monitor tracks traffic of all network connections and<br />
displays real-time download and upload speeds in graphical and numerical forms (refer to<br />
screen shot below). The software logs traffic of all network connections and provides<br />
daily, weekly and monthly traffic reports. Bandwidth Monitor can also display download<br />
and upload speeds of multiple network connections on a computer at a time. For<br />
example, you can monitor bandwidth of mutiple network cards on your computer at the<br />
same time. This tool also offers useful built-in utilities: speeds stopwatch, transfer rates<br />
recorder, and bandwidth usage notification. Bandwidth Monitor works with the majority<br />
network connections including modem, ISDN, DSL, ADSL, cable modem, Ethernet<br />
cards, wireless, VPN, and more. It's compatible with Windows 98, Windows Me,<br />
Windows NT 4.0, Windows 2000, Windows XP, Windows 2003, and Windows Vista.<br />
In our testing we use the Free Download Version of Bandwidth Monitor for this research<br />
project. The download is available at http://www.bwmonitor.com/index.htm. For<br />
extended research and commercial application, the commercial version is available.<br />
Page 7
<strong>Broadband</strong> <strong>Quality</strong> <strong>Test</strong> <strong>Plan</strong><br />
Figure 3: Screenshot of Bandwidth Monitor<br />
Ping: Ping is a general tool available in Windows and most other OS to check the<br />
destination reachability.<br />
Other Tools: Apart from the above-mentioned tools, we use the standard Web browser<br />
(Internet Explore 6.0 or FireFox) to browse the test site and upload or download files.<br />
2.2.1 Download Speed<br />
Prerequisites:<br />
The respective E-Mail accounts in the ISP, National and Global sites are stored<br />
with a mail with 5 MB attachment file.<br />
<strong>Test</strong> Procedure:<br />
We measure the download speed by downloading a 5 MB file from the mail<br />
attachment using a standard Web browser, and calculate the average download<br />
bandwidth using a network measuring tools like BandwidthMonitor.<br />
Normally the downloading software will show the download speed, but this<br />
doesn’t include TCP/IP header and other overheads. Hence we use tools<br />
(BandwidthMonitor), which measures the bandwidth by snooping the raw packets<br />
that is getting transferred. (Note: The advertised download speed by the operator<br />
is a raw bandwidth).<br />
Page 8
<strong>Broadband</strong> <strong>Quality</strong> <strong>Test</strong> <strong>Plan</strong><br />
2.2.2 Upload Speed<br />
Prerequisites:<br />
The respective E-Mail accounts in the ISP, National and Global sites are ensured<br />
to have free space to upload a 5 MB attachment file.<br />
<strong>Test</strong> Procedure:<br />
With stand-alone application, we measure the upload speed by uploading a 5-MB<br />
file to YAHOO Mail application and calculate the average upload bandwidth<br />
using standard measuring tools like Bandwidth Monitor.<br />
We use standard tools (BandwidthMonitor), which measures the bandwidth by<br />
snooping packets for the same reason as stated for Download speed.<br />
2.2.3 Round Trip Time (RTT)<br />
Prerequisites:<br />
Ensure that the Ping traffic to our test-sites is not blocked by the local firewall and<br />
the sites are reachable.<br />
<strong>Test</strong> Procedure:<br />
Among the stand-alone application, ping is a very common tool to measure the<br />
RTT. The Ping application generates an ICMP packet with a timestamp; RTT is<br />
calculated finding the difference between the current time and the received packet<br />
time-stamp. We need to generate around 100 ICMP packets, to get a good average<br />
(A RTT ) on our measurement, with the interval of 1 second between packets.<br />
Also initial Ping packet will take more RTT due to delay in ARP resolution etc.<br />
But considering the speed of the Internet and our sampling base, this error will be<br />
insignificant.<br />
Page 9
<strong>Broadband</strong> <strong>Quality</strong> <strong>Test</strong> <strong>Plan</strong><br />
2.2.4 Jitter<br />
Prerequisites:<br />
Ensure that the Ping traffic to our test-sites is not blocked by the local firewall and<br />
the sites are reachable.<br />
<strong>Test</strong> Procedure:<br />
We use the same result as we got for the RTT using the Ping. The Result of the<br />
Ping output is saved in a file. M = A RTT is the average RTT, derived out of 100<br />
samples, and r 1 , r 2 … r 100 are the RTT for individual packets, then the Jitter is<br />
derived using the below formula.<br />
k = 100<br />
∑ | M – r k | / 100<br />
k = 1<br />
In the above formula, r k is extracted from the ping result stored in the file.<br />
Typically the output of the ping will be similar to the one shown in Figure 4<br />
Using a script the RTT value marked in red color in Figure 4 is extracted for<br />
each packet (each line), this will be the values for r 1 , r 2 … r 100 .<br />
>> ping 66.100.10.1<br />
Reply from 66.100.10.1: bytes=32 time=220ms TTL=228<br />
Reply from 66.100.10.1: bytes=32 time=211ms TTL=228<br />
Reply from 66.100.10.1: bytes=32 time=210ms TTL=228<br />
Reply from 66.100.10.1: bytes=32 time=210ms TTL=228<br />
Ping statistics for 66.100.10.1:<br />
Packets: Sent = 10, Received = 4, Lost = 6 (60% loss),<br />
Figure 4 : Ping Result<br />
Page 10
<strong>Broadband</strong> <strong>Quality</strong> <strong>Test</strong> <strong>Plan</strong><br />
2.2.5 Packet Loss<br />
Prerequisites:<br />
Ensure that the Ping traffic to our test-sites is not blocked by the local firewall and<br />
the sites are reachable.<br />
<strong>Test</strong> Procedure:<br />
Again we use ping to calculate the packet-loss. For the above two experiments we<br />
have been using Ping for calculating RTT and Jitter, at the end of the experiment,<br />
ping software summarizes the total number of packet transmitted, packet received<br />
and the packet loss in percentage (shown in Blue color in Figure 4 : Ping Result).<br />
2.2.6 Availability<br />
The network availability is measured by checking the accessibility to the Internet.<br />
As we discuss in this section, we will be running the experiment on each<br />
ISP/Packages for 6 times a day (If the net is not reachable, we may need to extend<br />
the experiment). Hence if T is the total number of times the experiment is done<br />
for a ISP/Package and F is the number of times internet is unreachable, then the<br />
Availability for that ISP/Package is calculated as follows.<br />
(1–F/T) × 100%.<br />
An attempt is declared as failed, if we are not able to connect to any of local,<br />
national or International site chosen within 30 seconds. On the contrary if any one<br />
of the site is reachable within 30 seconds, the attempt is declared success.<br />
2.3 Experimental Method<br />
This section explains the experimental method followed in our testing. Table 5 shows the<br />
test tools to be used for each experiment.<br />
Table 5: Experiment Tools<br />
S.No. Destinations ISP National Global<br />
Metrics<br />
1 Download BandwidthMonitor BandwidthMonitor BandwidthMonitor<br />
2 Upload BandwidthMonitor BandwidthMonitor BandwidthMonitor<br />
3 RTT Ping Ping Ping<br />
4 Jitter Ping Ping Ping<br />
5 Loss Ping Ping Ping<br />
6 Availability Ping Ping Ping<br />
Page 11
<strong>Broadband</strong> <strong>Quality</strong> <strong>Test</strong> <strong>Plan</strong><br />
In out testing process, we follow the guidelines mentioned below:<br />
Guideline 1. Run trace-route just before each experiment to record the route to the<br />
destination site. This will also ensure that the local DNS cache is primed with the<br />
IP address of the site, so that DNS lookup does not affect the subsequent<br />
measurements.<br />
Figure 5 : Traceroute <strong>Test</strong> Result<br />
Guideline 2. Ensure that no other applications, background tasks or viruses are<br />
running in the PC during the measurements. These may generate network traffic.<br />
Linux is preferable as Windows is more susceptible to viruses (It’s a suggestion<br />
and the experimenter can use any OS of his choice, provided the background<br />
tasks and viruses are controlled).<br />
Guideline 3. The duration of each upload/download must be at least 100 seconds to<br />
minimize timing errors. For upload and download, minimum file size should be<br />
2 MB (But 5 MB is recommended). The file size can be chosen based on the ISP<br />
package (e.g. for 64 Kbps link, 2 Mb would be sufficient, since the duration is<br />
longer).<br />
Guideline 4. To have a proper recording of the test results for future references, we<br />
recommend saving all test results (screen shots) of all measurement programs<br />
including ping, traceroute, bwmonitor, etc. Use a structured file name of the<br />
format:<br />
---. <br />
Page 12
<strong>Broadband</strong> <strong>Quality</strong> <strong>Test</strong> <strong>Plan</strong><br />
ISP ISP name, e.g. BSNL, Bharti, VSNL, Yahoo etc.<br />
<strong>Plan</strong> ISP plan which is tested, e.g 256-<strong>Plan</strong>, 500-<strong>Plan</strong> etc.<br />
DDMMYY Date in Day (DD), Month (MM) and Year (YY)<br />
HHmm Time in Hour (HH) and Minute (mm)<br />
Program The program result which is stored, e.g. Ping, Tracert, Upload, Dnload<br />
etc)<br />
Ext Appropriate extension of the file (e.g. jpg, doc, txt etc).<br />
E.g. a Ping result done on 6-Dec-07 at 9:30AM with BSNL, 256 <strong>Plan</strong> will be<br />
named as BSNL-256<strong>Plan</strong>-0612070930-ping.txt<br />
Guideline 5. Each measurement must be repeated for three times.<br />
Page 13
<strong>Broadband</strong> <strong>Quality</strong> <strong>Test</strong> <strong>Plan</strong><br />
3 <strong>Test</strong>ing Period<br />
The above-mentioned metrics are measured at different time of the day, as follows:<br />
Table 6: Times for repetition of experiments<br />
# Measuring Time Remarks<br />
1 08:05 AM Lean traffic time<br />
2 11:13 AM Peak business hour traffic<br />
3 03:07 PM Peak Business hour traffic<br />
4 06:16 PM Low business traffic and medium residential traffic<br />
5 08:23 PM Low business traffic and high residential traffic<br />
6 10:26 PM Medium-High Residential traffic<br />
The timings are chosen in such a way to analyze the quality from low usage period to<br />
heavily used period. The readings are tabulated for at least 4 working days and weekend<br />
days or national holidays spread over a 15-day period.<br />
Page 14