The Stellar Dynamo - Scientific American Digital
The Stellar Dynamo - Scientific American Digital
The Stellar Dynamo - Scientific American Digital
- No tags were found...

You also want an ePaper? Increase the reach of your titles
YUMPU automatically turns print PDFs into web optimized ePapers that Google loves.
COPYRIGHT 2004 SCIENTIFIC AMERICAN, INC.
<strong>The</strong><br />
<strong>Stellar</strong><br />
<strong>Dynamo</strong><br />
Sunspot cycles—on other stars—are helping<br />
astronomers study the sun’s variations and the<br />
ways they might affect Earth<br />
By Elizabeth Nesme-Ribes, Sallie L. Baliunas<br />
and Dmitry Sokoloff<br />
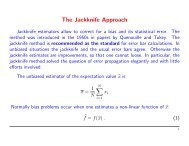
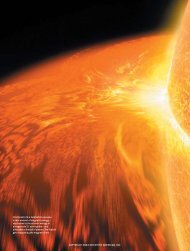
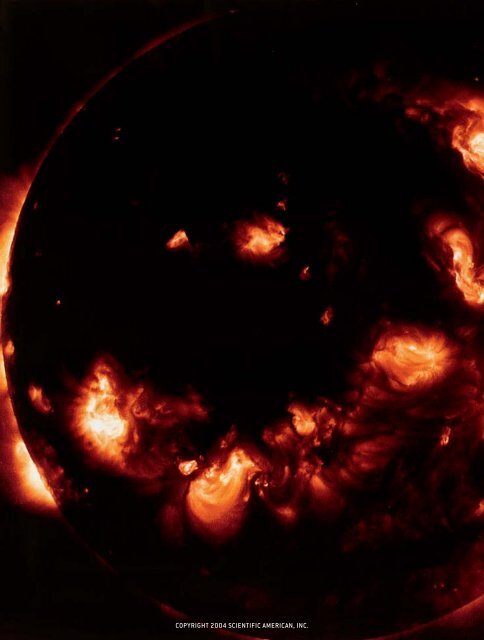
MAGNETIC FIELDS on the<br />
sun are rendered visible in<br />
this x-ray photograph by the<br />
curving contours of solar flares.<br />
<strong>The</strong> lines of magnetic fields erupt<br />
from the sun’s surface and heat the<br />
gases of the surrounding corona to up to<br />
25 million degrees C, causing them to glow.<br />
Flares are more frequent during sunspot maxima.<br />
In 1801, musing on the vagaries of English weather, astronomer William Herschel<br />
observed that the price of wheat correlated with the disappearance of sunspots. But<br />
the pattern soon vanished, joining what scientists at large took to be the mythology<br />
connecting earthly events with solar ones. That the sun’s brightness might possibly<br />
vary, and thereby affect Earth’s weather, remained speculative.<br />
Thus, in the mid-1980s, when three solar satellites—Solar Maximum Mission,<br />
Nimbus 7 and Earth Radiation Budget—reported that the sun’s radiance<br />
was declining, astronomers assumed that all three instruments were failing. But<br />
the readings then perked up in unison, an occurrence that could not be attributed<br />
to chance. <strong>The</strong> sun was cooling off and heating up; furthermore, the variation<br />
was connected with the number of spots on its face.<br />
In recent years one of us (Baliunas) has observed that other stars undergo rhythmic<br />
changes much like those of our sun. Such studies are helping refine our understanding<br />
of the “dynamo” that drives the sun and other stars. Moreover, they<br />
have revealed a strong link between “star spots” and luminosity, confirming the<br />
patterns discovered in our sun. And yet astrophysicists, including the three of us,<br />
are still debating the significance of the sun’s cycles and the extent to which they<br />
might influence Earth’s climate.<br />
Updated from the August 1996 issue 35<br />
COPYRIGHT 2004 SCIENTIFIC AMERICAN, INC.
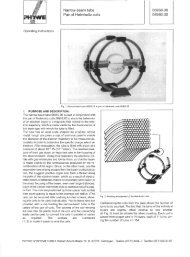
NATIONAL SOLAR OBSERVATORY/SACRAMENTO PEAK; NATIONAL SOLAR OBSERVATORIES/KITT PEAK (inset)<br />
SUNSPOTS are relatively cool regions formed where magnetic fields<br />
emerge from the sun, thereby suppressing the upwelling of hot gases<br />
from the interior. Elsewhere on the surface, tightly coiled cells of<br />
cyclonically flowing gases show up as granules. Near a sunspot the<br />
Sunspots<br />
THE EARLIEST KNOWN sunspot records<br />
are Chinese documents that go<br />
back 2,000 years, preserving observations<br />
made by the naked eye. From 1609<br />
to 1611 Johannes Fabricius, Thomas<br />
Harriot, Christoph Scheiner and Galileo<br />
Galilei, among others, began telescopic<br />
studies of sunspots. <strong>The</strong>se records, as<br />
German astronomer Samuel Heinrich<br />
Schwabe announced in 1843, displayed<br />
a prominent periodicity of roughly 10<br />
years in the number of observed sunspot<br />
groups. By the 20th century George<br />
magnetic fields organize the gaseous flow into lines resembling iron<br />
filings near a bar magnet. <strong>The</strong> magnetogram (inset) shows field lines<br />
emerging at one sunspot (yellow) and reentering at another (blue);<br />
such sunspot pairs are common.<br />
Ellery Hale of the Mount Wilson Observatory<br />
in California found those dark<br />
surface irregularities to be the seat of intense<br />
magnetic fields, with strengths of<br />
several thousand gauss. (Earth’s magnetic<br />
field is, on the average, half a gauss.)<br />
Sunspots appear dark because they<br />
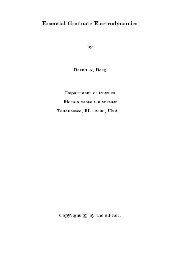
Sunspot Number<br />
Maunder minimum<br />
1620 1640 1660 1680 1700 1720 1740 1760 1780 1800 1820 1840 1860 1880<br />
MAXIMUM<br />
MINIMUM<br />
ELEVEN-YEAR CYCLES of sunspot activity were interrupted between 1645 and 1715<br />
by a period of quiescence. This dearth of sunspots, called the Maunder minimum,<br />
coincided with unusually cool temperatures across northern Europe, indicating that<br />
solar fluctuations influence Earth’s climate. <strong>The</strong> regular pulsing of the sun’s activity<br />
(right) was observed over one cycle at the Paris Observatory. <strong>The</strong>se photographs were<br />
taken in violet light emitted by ionized calcium; the technique that produced them is<br />
now used to study the magnetic activity of other stars.<br />
1979 1982 1986<br />
36 SCIENTIFIC AMERICAN THE SECRET LIVES OF STARS<br />
COPYRIGHT 2004 SCIENTIFIC AMERICAN, INC.
SUNSPOTS ARE 2,000 DEGREES C COOLER<br />
than the surrounding surface; they would<br />
GLOW ORANGE-RED AGAINST A NIGHT SKY.<br />
are 2,000 degrees Celsius cooler than the<br />
surrounding surface of the sun; they<br />
would glow orange-red if seen against<br />
the night sky. <strong>The</strong> spots form when<br />
strong magnetic fields suppress the flow<br />
of the surrounding gases, preventing<br />
them from carrying internal heat to the<br />
surface. Next to the sunspots are often<br />
seen bright areas called plages (after the<br />
French word for “beach”). <strong>The</strong> magnetic<br />
field lines tend to emerge from the surface<br />
at one spot to reenter the sun at another,<br />
linking the spots into pairs that resemble<br />
the two poles of a bar magnet<br />
that is oriented roughly east-west.<br />
At the start of each 11-year cycle,<br />
sunspots first appear at around 40 degrees<br />
latitude in both hemispheres; they<br />
form closer to the equator as the cycle<br />
progresses. At sunspot minimum, patches<br />
of intense magnetism, called active regions,<br />
are seen near the equator. Aside<br />
from the sunspots, astronomers have observed<br />
that the geographic poles of the<br />
sun have weak overall magnetic fields of<br />
a few gauss. This large-scale field has a<br />
“dipole” configuration, resembling the<br />
field of a bar magnet. <strong>The</strong> leading sunspot<br />
in a pair—the one that first comes<br />
into view as the sun rotates from west to<br />
east—has the same polarity as the pole of<br />
its hemisphere; the trailing sunspot has<br />
1920 1940 1960 1980 2000<br />
MAXIMUM<br />
1988 1990<br />
PARIS OBSERVATORY<br />
Sunspot Number<br />
NOAA; PETER SAMEK Slim Films<br />
the opposite polarity. Moreover, as Hale<br />
and Seth B. Nicholson had discovered by<br />
1925, the polarity patterns reverse every<br />
11 years, so that the total magnetic cycle<br />
takes 22 years to complete. But the sun’s<br />
behavior has not always been so regular.<br />
In 1667, when the Paris Observatory<br />
was founded, astronomers there began<br />
systematic observations of the sun, logging<br />
more than 8,000 days of observation<br />
over the next 70 years. <strong>The</strong>se records<br />
showed very little sunspot activity.<br />
This important finding did not raise<br />
much interest until the sunspot cycle was<br />
discovered, prompting Rudolf Wolf of<br />
Zürich Observatory to scrutinize the<br />
records. Although he rediscovered the<br />
sunspot lull, Wolf’s finding was criticized<br />
on the grounds that he did not use all the<br />
available documents.<br />
During the late 1880s, first Gustav<br />
F. W. Spörer and then E. Walter Maunder<br />
reported that the 17th-century solar<br />
anomaly coincided with a cold spell in<br />
Europe. That astonishing observation<br />
lay neglected for almost a century, with<br />
many astronomers assuming that their<br />
predecessors had not been competent<br />
enough to count sunspots. It was only in<br />
1976 that John A. Eddy of the High Altitude<br />
Observatory in Boulder, Colo., reopened<br />
the debate by examining the<br />
Paris archives and establishing the validity<br />
of what came to be known as the<br />
Maunder minimum.<br />
Minze Stuiver, while at Yale University,<br />
Hans Suess of the University of California<br />
at San Diego and others had discovered<br />
that the amount of carbon 14 in<br />
tree rings increased during the dearth of<br />
sunspots. This radioactive element is created<br />
when galactic cosmic rays transmute<br />
nitrogen in the upper atmosphere.<br />
<strong>The</strong>ir findings suggested that when the<br />
magnetic fields in the solar wind—the<br />
blast of particles and energy that flows<br />
from the sun—are strong, they shield<br />
Earth from cosmic rays, so that less carbon<br />
14 forms; the presence of excess carbon<br />
14 indicated a low level of magnetic<br />
activity on the sun during the Maunder<br />
phase. Eddy thus reinforced the connection<br />
between the paucity of sunspots and<br />
a lull in solar activity.<br />
Aside from the rarity of sunspots<br />
during the Maunder minimum, the Paris<br />
archives brought to light another oddity:<br />
from 1661 to 1705, the few sunspots<br />
that astronomers sighted were usually in<br />
the southern hemisphere. <strong>The</strong>y were also<br />
traveling much more slowly across the<br />
sun’s face than present-day sunspots do.<br />
Only at the beginning of the 18th century<br />
did the sun assume its modern appearance,<br />
having an abundance of<br />
sunspots rather evenly distributed between<br />
the two hemispheres.<br />
<strong>The</strong> Solar <strong>Dynamo</strong><br />
THE MAGNETIC ACTIVITY of the<br />
sun is believed to reside in its convective<br />
zone, the outer 200,000 kilometers where<br />
churning hot gases bring up energy from<br />
the interior. <strong>The</strong> fluid forms furious<br />
whorls of widely different sizes: the best<br />
known is an array of convective cells or<br />
granules, each 1,000 kilometers across<br />
at the surface but lasting only a few minutes.<br />
<strong>The</strong>re are also “supergranules” that<br />
are 30,000 to 50,000 kilometers across<br />
and even larger flows. Rotation gives rise<br />
to Coriolis forces that make the whorls<br />
flow counterclockwise in the northern<br />
hemisphere (if one is looking down at<br />
the surface) and clockwise in the southern<br />
hemisphere; these directions are called<br />
cyclonic.<br />
Whether similar cyclones exist underneath<br />
the surface is not known. Deep<br />
within, the convective zone gives way to<br />
the radiative zone, where the energy is<br />
transported by radiation. <strong>The</strong> core of the<br />
sun, where hydrogen fuses into helium<br />
to fuel all the sun’s activity, seems to rotate<br />
rigidly and slowly compared with<br />
the surface.<br />
www.sciam.com SCIENTIFIC AMERICAN 37<br />
COPYRIGHT 2004 SCIENTIFIC AMERICAN, INC.
a b c<br />
North<br />
Pole<br />
North<br />
Pole<br />
North<br />
Pole<br />
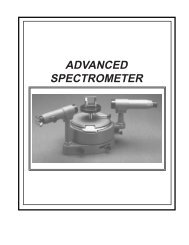
SOLAR DYNAMO generates the sun’s magnetic field and also causes it to change orientation every<br />
11 years. Suppose that the initial magnetic field (a) resembles that of a bar magnet with its north<br />
pole (+) near the sun’s geographic north pole. <strong>The</strong> magnetic field lines are carried along with the<br />
electrically charged gases. <strong>The</strong> faster flow at the equator therefore distorts the field lines (b) until<br />
they wrap tightly (c) around the sun. But the field lines then resist the stretching and unwind,<br />
QUADRUPOLE<br />
DIPOLE<br />
<strong>The</strong> first description of how the sun’s<br />
gases conspire to create a magnetic field<br />
was proposed in 1955 by Eugene N.<br />
Parker of the University of Chicago. Because<br />
of the high temperature, the atoms<br />
of hydrogen and helium lose their electrons,<br />
thereby giving rise to an electrically<br />
charged substance, or plasma. As<br />
the charged particles move, they generate<br />
magnetic fields. Recall that the lines<br />
describing magnetic fields form continuous<br />
loops, having no beginning or<br />
end—their density (how closely together<br />
the lines are packed) indicates the intensity<br />
of the magnetic field, whereas<br />
their orientation reveals the direction.<br />
Because plasma conducts electricity very<br />
efficiently, it tends to trap the field lines:<br />
if the lines were to move through the<br />
plasma, they would generate a large, and<br />
energetically expensive, electric current.<br />
Thus, the magnetic fields are carried<br />
along with the plasma and end up getting<br />
twisted. <strong>The</strong> entwined ropes wrap<br />
together fields of opposite polarity, which<br />
tend to cancel each other. But the sun’s<br />
rotation generates organizational forces<br />
that periodically sort out the tangles and<br />
create an overall magnetic field. This automatic<br />
engine, which generates magnetism<br />
from the flow of electricity, is the<br />
solar dynamo.<br />
<strong>The</strong> dynamo has two essential ingredients:<br />
the convective cyclones and the<br />
sun’s nonuniform rotation. During the<br />
mid-1800s, Richard C. Carrington, an<br />
English amateur astronomer, found that<br />
the sunspots near the equator rotate faster,<br />
by 2 percent, than those at midlatitudes.<br />
Because the spots are floating with<br />
the plasma, the finding indicates that the<br />
sun’s surface rotates at varying speeds.<br />
<strong>The</strong> rotation period is roughly 25 days at<br />
the equator, 28 days at a latitude of 45<br />
degrees and still longer at higher latitudes.<br />
This differential rotation should extend<br />
all the way through the convective zone.<br />
Now suppose that the initial shape of<br />
the sun’s field is that of a dipole oriented<br />
roughly north-south. <strong>The</strong> field lines get<br />
pulled forward at the equator by the<br />
faster rotation and are deformed in the<br />
east-west direction. Ultimately, they lie<br />
parallel to the equator and float to the<br />
surface, erupting as pairs of sunspots.<br />
But Coriolis forces tend to align the<br />
cyclones and thereby the sunspots, which<br />
are constrained to follow the plasma’s<br />
gyrations. <strong>The</strong> cyclones arrange the sunspots<br />
so that, for example, a trailing sunspot<br />
in the northern hemisphere lies at<br />
a slightly higher latitude than a leading<br />
one. As the equatorial field lines are<br />
stretched, they eventually unwind and<br />
drift outward. <strong>The</strong> trailing sunspot<br />
reaches the pole first, effectively reversing<br />
the magnetic field there. (Recall that<br />
the trailing spot has a polarity opposite<br />
that of the nearest pole.) Those field lines<br />
that initially extended far beyond the<br />
sun reconnect into loops and are blown<br />
away by the solar wind. In this manner,<br />
the overall magnetic field flips, and the<br />
cycle begins again.<br />
<strong>The</strong>re is, however, a caveat. This simple<br />
picture seems to be at odds with results<br />
from helioseismology, the science of<br />
sunquakes. <strong>The</strong> model requires the sun<br />
to rotate faster at the interior; in contrast,<br />
results from the Global Oscillation Network<br />
Group, an international collaboration<br />
of observatories, show that the rotation<br />
velocity near the equator decreases<br />
downward. Such experiments are<br />
providing accurate information on internal<br />
motions of the sun and thereby help-<br />
PETER SAMEK Slim Films<br />
38 SCIENTIFIC AMERICAN THE SECRET LIVES OF STARS<br />
COPYRIGHT 2004 SCIENTIFIC AMERICAN, INC.
d<br />
North<br />
Pole<br />
ing Mausumi Dikpati and Peter Gilman<br />
of the High Altitude Observatory and<br />
others to refine dynamo theory.<br />
But what happened during the Maunder<br />
minimum To explain this lull, two<br />
of us (Nesme-Ribes and Sokoloff) noted<br />
that apart from a dipole pattern, the<br />
magnetic field must also have a small<br />
quadrupole component, resembling the<br />
field of two bar magnets placed side by<br />
side. If the quadrupole oscillates at a<br />
North<br />
Pole<br />
moving up toward the surface and erupting as sunspot pairs (d). <strong>The</strong> sunspots drift toward the poles,<br />
with the trailing sunspot reaching first; as a result, the overall field flips (e). In addition to the dipole<br />
field above, the sun probably also has a “quadrupole” field (opposite page, red) whose “beating” with<br />
the dipole field was responsible for the Maunder minimum.<br />
e<br />
slightly different rate than the dipole, the<br />
sunspots in one hemisphere are produced<br />
slightly earlier than those in the other<br />
hemisphere—precisely what we observe<br />
now. Furthermore, over the past four<br />
centuries, a few solar cycles showed different<br />
numbers of sunspots in the northern<br />
and southern hemispheres. This pattern<br />
seems to repeat every century or so,<br />
exactly what one would expect if the dipole<br />
“beats” with a weak quadrupole.<br />
But suppose that the quadrupole<br />
field is as strong as the dipole. <strong>The</strong> equatorial<br />
field lines that result from stretching<br />
this combination will then cancel out<br />
in one hemisphere yet remain in the other.<br />
And the few spots that do appear will<br />
all be in one hemisphere, just as 17thcentury<br />
astronomers noted during the<br />
Maunder minimum.<br />
We can encapsulate the relation between<br />
the dipole and quadrupole fields<br />
in a “dynamo number” D. It is the product<br />
of the helicity, or spiraling motion,<br />
of the plasma and the local rate of<br />
change of rotation. When D is very<br />
small, the magnetic field tends to die<br />
out; as D increases, the quadrupole field<br />
shows up, with the dipole following. Beyond<br />
a critical value, both components<br />
of the field are steady. But as D increases<br />
further, the dynamo becomes periodic,<br />
increasing and decreasing; this is the<br />
regime in which the sun now lies. A<br />
weak quadrupole field, beating in phase<br />
with the dipole, leads to short and intense<br />
cycles; a stronger quadrupole field,<br />
if slightly out of phase with the dipole<br />
field, lengthens and weakens the sunspot<br />
cycle. Far beyond the critical dynamo<br />
number, chaos results.<br />
Dynamic Stars<br />
AS WE NOW KNOW, the sun’s brightness<br />
increases with the magnetic activity<br />
480<br />
Equator<br />
Rotation Frequency (nanohertz)<br />
440<br />
400<br />
30° latitude<br />
60° latitude<br />
CORE<br />
PETER SAMEK Slim Films<br />
360<br />
0.4 0.6 0.8 1<br />
Distance from Center/Solar Radius<br />
ROTATION of the sun’s surface is faster at the equator and slower near the<br />
poles. This differential rotation (as measured by means of sunquakes by<br />
the Global Oscillation Network Group) extends through the outer layers. <strong>The</strong><br />
sun’s core, in which fusion generates the energy that ultimately powers the<br />
dynamo, most likely rotates at a constant angular velocity, like a rigid body.<br />
0<br />
0.3<br />
0.7<br />
RADIATIVE ZONE<br />
CONVECTION ZONE<br />
DISTANCE/RADIUS<br />
1<br />
www.sciam.com SCIENTIFIC AMERICAN 39<br />
COPYRIGHT 2004 SCIENTIFIC AMERICAN, INC.
Intensity of Calcium Emission Lines<br />
0.4<br />
●<br />
0.35 ● ● ● ● ● ● ● ● ● ● ● ●<br />
● ●<br />
● ● ● ● ● ●<br />
●<br />
●<br />
● ● ●<br />
● ●<br />
● ● ● ● ● ● ● ● ●<br />
0.3<br />
0.3<br />
0.25<br />
0.2<br />
0.18<br />
0.16<br />
0.14<br />
●<br />
Young star, HD 20686, variable cycle<br />
Mature star, HD 4628, 8.6-year cycle<br />
● ● ●<br />
●<br />
● ● ● ●<br />
Mature star, HD 14376, flat<br />
● ● ●<br />
●<br />
●<br />
●<br />
●<br />
● ● ● ● ● ● ● ● ● ● ● ● ● ●<br />
● ●<br />
● ●<br />
● ● ● ●<br />
●<br />
●<br />
●<br />
● ●<br />
● ● ● ● ● ●<br />
● ●<br />
● ● ● ● ● ● ● ● ● ● ● ● ● ● ●<br />
● ● ● ● ● ● ●<br />
1966 1970 1975 1980<br />
1985 1990 1995 2000<br />
INTERANNUAL MAGNETIC VARIABILITY of stars over the years is detected by way of violet calcium<br />
emission lines. Here activity from three nearby stars reveals the likely states of our own sun: the<br />
variable magnetic cycles of a young star (top); the steady cycles of a star at an age comparable to<br />
our sun’s (middle); and the subsidence of a sunlike star into a Maunder-type minimum phase<br />
(bottom). <strong>The</strong> magnetic, and therefore sunspot, activity of other stars indicates that our sun is<br />
capable of far greater variability than it has shown in the past century.<br />
Year<br />
over a cycle: the bright plages overwhelm<br />
the dark sunspots. (Presumably,<br />
as the sun brightens and darkens, its total<br />
energy is temporarily channeled into<br />
different reservoirs—kinetic, magnetic,<br />
thermal or potential.) During the past 24<br />
years of satellite observations, the sun’s<br />
total energy output has varied roughly<br />
0.1 percent between a brighter, magnetically<br />
active phase and a fainter, quiet one.<br />
Because of the brevity of the satellite<br />
records, we do not know the variability<br />
of the sun’s brightness over decades.<br />
Richard Willson and his colleagues at<br />
Columbia University’s Center for Climate<br />
Systems Research recently found a<br />
slight, 0.05 percent increase in brightness<br />
at the observed solar minima in 1986<br />
and 1996. Finding a longer-term value<br />
for brightness variability, however, is vital<br />
to evaluating the sun’s influence on<br />
Earth. One possible way to answer this<br />
question is to examine “star spot” cycles<br />
on other stars.<br />
It is not easy to map the features on<br />
the surface of stars. But as magnetic<br />
fields heat the outer layers of a star’s atmosphere,<br />
they radiate the energy in certain<br />
spectral lines. For example, on our<br />
sun, the intensity of the two violet emission<br />
lines of calcium (having wavelengths<br />
of 396.7 and 393.4 nanometers)<br />
closely follows the strength and extent<br />
of the magnetic fields. Variations in<br />
these lines thus give us a measure of the<br />
changing surface magnetism of a star.<br />
At Mount Wilson Observatory in<br />
1966, Olin C. Wilson began a program<br />
of measuring the magnetic activity of<br />
roughly 100 so-called main-sequence<br />
stars—those that, like the sun, are burning<br />
hydrogen. (When the hydrogen runs<br />
out, a star expands into a red giant.)<br />
Most of these stars show obvious signs<br />
of magnetic activity, by way of variations<br />
in their violet calcium emission<br />
THE AUTHORS<br />
lines. <strong>The</strong> fluctuations vary greatly in<br />
amplitude and duration, depending primarily<br />
on the age and mass of the star.<br />
All these stars have a dynamo number,<br />
D, higher than the critical value required<br />
for sustaining magnetic fields. For<br />
a young star of one or two billion years,<br />
the rotation period is fast, roughly 10<br />
to 15 days. <strong>The</strong> resulting high value of<br />
D means that these young stars have erratic<br />
fluctuations in magnetic activity<br />
over intervals as short as two years and<br />
no well-defined cycles. <strong>The</strong> fluctuations<br />
sometimes repeat, however, having periods<br />
between two and 20 years or so<br />
that lengthen with age.<br />
But as a star ages, it slows down—<br />
because its angular momentum is carried<br />
off by the magnetic wind—and D falls.<br />
<strong>The</strong>n a consistent dynamo cycle begins<br />
to appear, with a period of about six to<br />
seven years and sometimes even with<br />
two independent periods. Later on—for<br />
an even lower D—one period starts to<br />
dominate, lengthening with age from<br />
eight to 14 years. In addition, there are<br />
occasional Maunder minima. If rotation<br />
were to slow further, in the very oldest<br />
stars, we predict that the magnetic field<br />
should be steady. <strong>The</strong> Wilson sample<br />
contains a few very old stars, but they<br />
still show cycles, indicating that the<br />
steady dynamo would not be reached in<br />
10 billion years—soon after which they<br />
will expand into red giants.<br />
To focus on the solar dynamo, Baliunas<br />
and her collaborators restricted<br />
Wilson’s broad sample of stars to those<br />
similar to our sun in mass and age. That<br />
group currently comprises 10- to 20-year<br />
records of 150 stars, depending on the<br />
criteria defining similarity to the sun.<br />
Many of these stars show prominent cycles<br />
similar in amplitude and period to<br />
those of the sun. About one quarter of<br />
ELIZABETH NESME-RIBES, SALLIE L. BALIUNAS and DMITRY SOKOLOFF all have been active<br />
in unraveling connections between the sun’s variations and Earth’s climate. Nesme-<br />
Ribes, who recently passed away, was an astronomer at the Paris Observatory and the National<br />
Center for <strong>Scientific</strong> Research in France. Apart from studying the solar dynamo, she<br />
conducted extensive searches into the 17th-century archives on sunspots at her home institution.<br />
Baliunas is a scientist at the Harvard-Smithsonian Center for Astrophysics in Cambridge,<br />
Mass. She observes the variations of sunlike stars at the Mount Wilson Observatory<br />
in Pasadena, Calif. Sokoloff is professor of mathematics in the department of physics at<br />
Moscow State University in Russia.<br />
MOUNT WILSON OBSERVATORY HK PROJECT; PETER SAMEK Slim Films<br />
40 SCIENTIFIC AMERICAN THE SECRET LIVES OF STARS<br />
COPYRIGHT 2004 SCIENTIFIC AMERICAN, INC.
cise photometric observations of some<br />
of the Wilson stars began at the Lowell<br />
and Sacramento Peak observatories.<br />
Since 1992 those of us at the Smithsonian<br />
Astrophysical Observatory and at<br />
Tennessee State University have used automated<br />
telescopes to observe some of<br />
these stars. Nearly all the older stars, like<br />
the sun, are brightest near the peak of<br />
the activity cycle. Some stars vary as little<br />
as our sun does—only 0.1 percent<br />
over the last 11-year cycle—but other<br />
sunlike stars have varied by as much as<br />
0.6 percent in a cycle. Thus, the sun’s<br />
current changes might be a poor indicator<br />
of the full range of fluctuations of<br />
which it is capable.<br />
Over the decades, researchers have<br />
inferred the evolutionary history of a<br />
sunlike star from the collection of stellar<br />
records. A young star has a relatively<br />
rapid rotation period of several days and<br />
high, irregular levels of surface magnetism.<br />
Changes in brightness of several<br />
percent accompany the magnetic variations.<br />
<strong>The</strong> young star is, however, darkest<br />
during the peak of magnetic activity,<br />
presumably because the dark spots are<br />
so large that they, not the plages, dominate.<br />
As the sunlike star ages, it rotates<br />
more slowly, and the magnetic activity<br />
decreases. Maunder minima appear in<br />
these “older” stars; furthermore, radiance<br />
now peaks at sunspot maximum,<br />
with fluctuations of 1 percent or less<br />
over a cycle.<br />
Influencing Earth<br />
THE STAR-SPOT RESULTS point to a<br />
change in brightness of at least 0.4 percent<br />
between the cyclic phase and the<br />
Maunder minimum phase. This value<br />
corresponds to a decrease in the sun’s<br />
net energy input of one watt per square<br />
meter at the top of Earth’s atmosphere.<br />
Simulations performed at the Laboratory<br />
of Dynamic Meteorology in Paris and<br />
elsewhere suggest that such a reduction,<br />
occurring over several decades, is capable<br />
of cooling Earth’s average temperature<br />
by 1 to 2 degrees C—enough to explain<br />
the observed cooling during the<br />
Maunder minimum.<br />
But greenhouse gases generated by<br />
human activity may be warming our<br />
planet, by trapping heat that would otherwise<br />
radiate into space. This warming<br />
is equivalent to Earth’s receiving radiation<br />
of two watts per square meter at the<br />
surface. <strong>The</strong> sun has apparently delivered<br />
to Earth no more or less than 0.5 to 1.0<br />
watt per square meter over the past few<br />
centuries. <strong>The</strong>refore, if direct heating is<br />
the only way in which the sun affects<br />
Earth’s climate and is presumed to act<br />
the same as the enhanced greenhouse effect,<br />
the added greenhouse gases should<br />
already be dominating the climate, washing<br />
out any correlation with the sun’s<br />
varying activity.<br />
<strong>The</strong> sun’s energy reaches Earth as radiation<br />
and particles and varies over<br />
many frequencies and periods. Yet the<br />
link between climate and solar magnetic<br />
activity seems rather persistent. <strong>The</strong><br />
length of the sunspot cycle, for example,<br />
correlates closely with global temperatures<br />
over the past 240 years. Minima in<br />
solar magnetism, as traced by radiocarbon<br />
dating in tree rings and beryllium 10<br />
in ice cores, coincide with roughly 1,500-<br />
year intervals of cooler climate, seen<br />
in environmental changes going back<br />
10,000 years. In addition, the sunspot<br />
cycle correlates with stratospheric wind<br />
patterns, for reasons not yet well understood.<br />
All these pieces of evidence induce<br />
UNRAVELING THE INFLUENCES OF THE SUN<br />
provides vital information on the role<br />
OUR STAR PLAYS IN CLIMATE CHANGE.<br />
the records show that the stars are in a<br />
dead calm, suggesting a phase similar to<br />
our sun’s Maunder minimum. This finding<br />
implies that sunlike stars spend a<br />
quarter of their lives in a lull—consistent<br />
with radiocarbon results.<br />
We may have captured one star, HD<br />
3651, in transition between the cyclic<br />
and Maunder minimum phases. HD<br />
3651’s cycles have weakened and<br />
lengthened dramatically (from 12 to 15<br />
years) as its surface activity has rapidly<br />
dropped to very low levels. Sunlike stars<br />
such as HD 3651, observed over a few<br />
decades, offer us “snapshots” of the<br />
range of variability that our sun—and<br />
we—might experience over a timescale<br />
of centuries.<br />
<strong>The</strong> brightness of these sunlike stars<br />
can also be compared with their magnetic<br />
activity. In 1984 thorough and pre-<br />
MORE TO EXPLORE<br />
some scientists, including us, to argue<br />
that the sun must be influencing Earth<br />
by powerful indirect routes as well as the<br />
obvious ones.<br />
Variations in the sun’s ultraviolet radiation,<br />
for example, may be changing<br />
the ozone content of our upper atmosphere,<br />
as well as its dynamics. Recent<br />
simulations also indicate that winds in<br />
the lower stratosphere can convey variations<br />
in solar radiance down to the troposphere,<br />
where they interact more directly<br />
with the weather system. Such<br />
matters are now the subject of vigorous<br />
debate. Unraveling the ways in which the<br />
sun warms Earth provides vital information<br />
concerning the role played by humankind—and<br />
the role played by the<br />
sun—in the process of climatic change.<br />
<strong>The</strong> Variable Sun. Peter V. Foukal in <strong>Scientific</strong> <strong>American</strong>, Vol. 262, No. 2, pages 34–41;<br />
February 1990.<br />
<strong>The</strong> Paradox of the Sun’s Hot Corona. Bhola N. Dwivedi and Kenneth J. H. Phillips in<br />
<strong>Scientific</strong> <strong>American</strong>, Vol. 284, No. 6, pages 40–47; June 2001.<br />
<strong>The</strong> Maunder Minimum and the Variable Sun-Earth Connection. Willie Wei-Hock Soon and<br />
Steven H. Yaskell. World <strong>Scientific</strong> Publishing, 2003.<br />
www.sciam.com SCIENTIFIC AMERICAN 41<br />
COPYRIGHT 2004 SCIENTIFIC AMERICAN, INC.