QUANTITATIVE ECONOMICS
1l4J48u
1l4J48u
- No tags were found...

You also want an ePaper? Increase the reach of your titles
YUMPU automatically turns print PDFs into web optimized ePapers that Google loves.
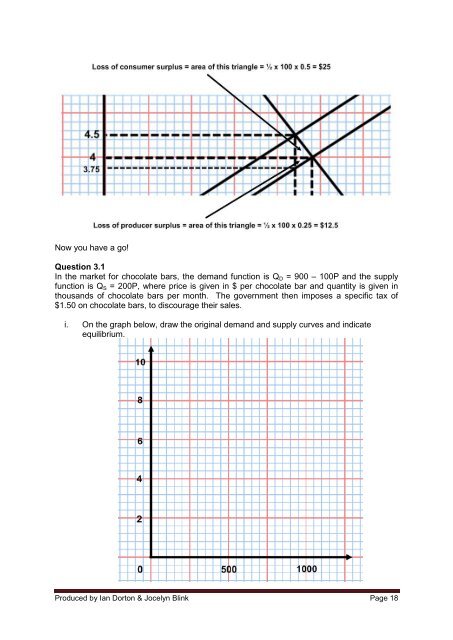
Now you have a go!<br />
Question 3.1<br />
In the market for chocolate bars, the demand function is Q D = 900 – 100P and the supply<br />
function is Q S = 200P, where price is given in $ per chocolate bar and quantity is given in<br />
thousands of chocolate bars per month. The government then imposes a specific tax of<br />
$1.50 on chocolate bars, to discourage their sales.<br />
i. On the graph below, draw the original demand and supply curves and indicate<br />
equilibrium.<br />
Produced by Ian Dorton & Jocelyn Blink Page 18