QUANTITATIVE ECONOMICS
1l4J48u
1l4J48u
- No tags were found...

You also want an ePaper? Increase the reach of your titles
YUMPU automatically turns print PDFs into web optimized ePapers that Google loves.
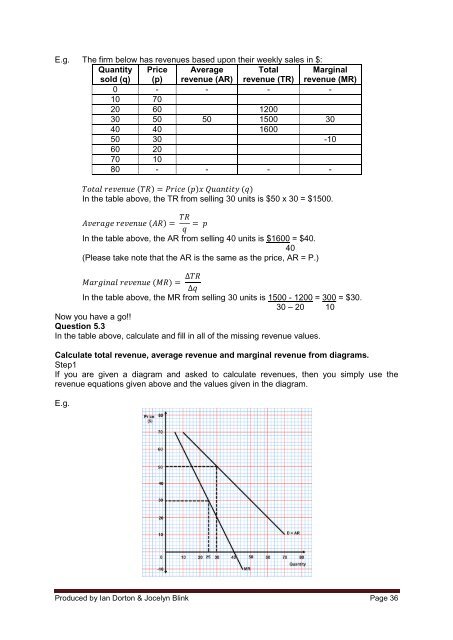
E.g. The firm below has revenues based upon their weekly sales in $:<br />
Quantity<br />
sold (q)<br />
Price<br />
(p)<br />
Average<br />
revenue (AR)<br />
Total<br />
revenue (TR)<br />
Marginal<br />
revenue (MR)<br />
0 - - - -<br />
10 70<br />
20 60 1200<br />
30 50 50 1500 30<br />
40 40 1600<br />
50 30 -10<br />
60 20<br />
70 10<br />
80 - - - -<br />
In the table above, the TR from selling 30 units is $50 x 30 = $1500.<br />
In the table above, the AR from selling 40 units is $1600 = $40.<br />
40<br />
(Please take note that the AR is the same as the price, AR = P.)<br />
In the table above, the MR from selling 30 units is 1500 - 1200 = 300 = $30.<br />
30 – 20 10<br />
Now you have a go!!<br />
Question 5.3<br />
In the table above, calculate and fill in all of the missing revenue values.<br />
Calculate total revenue, average revenue and marginal revenue from diagrams.<br />
Step1<br />
If you are given a diagram and asked to calculate revenues, then you simply use the<br />
revenue equations given above and the values given in the diagram.<br />
E.g.<br />
Produced by Ian Dorton & Jocelyn Blink Page 36