QUANTITATIVE ECONOMICS
1l4J48u
1l4J48u
- No tags were found...

You also want an ePaper? Increase the reach of your titles
YUMPU automatically turns print PDFs into web optimized ePapers that Google loves.
Step 3<br />
Calculate from the diagram the total amount that the government would have to pay<br />
buy up the surplus. This would be the excess supply times the minimum price.<br />
to<br />
E.g. The government would need to buy 600 units at $5 per unit = $3,000.<br />
Step 4<br />
Calculate the total income of the producers. This will come from sales to the<br />
and sales to the government.<br />
consumers<br />
E.g. The consumers will sell 1,600 units at a price of $5 = $8,000. They will receive<br />
$5,000 from the consumers (1000 units x $5) and $3,000 from the government (600<br />
units x $5).<br />
Now you have a go!<br />
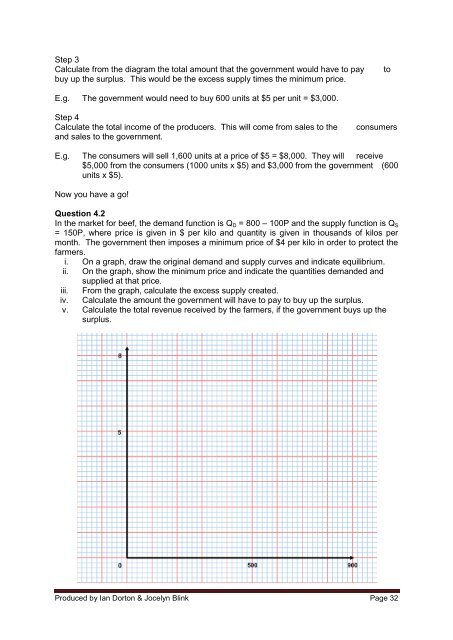
Question 4.2<br />
In the market for beef, the demand function is Q D = 800 – 100P and the supply function is Q S<br />
= 150P, where price is given in $ per kilo and quantity is given in thousands of kilos per<br />
month. The government then imposes a minimum price of $4 per kilo in order to protect the<br />
farmers.<br />
i. On a graph, draw the original demand and supply curves and indicate equilibrium.<br />
ii. On the graph, show the minimum price and indicate the quantities demanded and<br />
supplied at that price.<br />
iii. From the graph, calculate the excess supply created.<br />
iv. Calculate the amount the government will have to pay to buy up the surplus.<br />
v. Calculate the total revenue received by the farmers, if the government buys up the<br />
surplus.<br />
Produced by Ian Dorton & Jocelyn Blink Page 32