32. Draw a population pyramid
32. Draw a population pyramid
32. Draw a population pyramid
- No tags were found...

You also want an ePaper? Increase the reach of your titles
YUMPU automatically turns print PDFs into web optimized ePapers that Google loves.
WORKSHEET 32<br />
LOGICAL/MATHEMATICAL<br />
P<br />
<strong>Draw</strong> a<br />
<strong>population</strong> <strong>pyramid</strong><br />
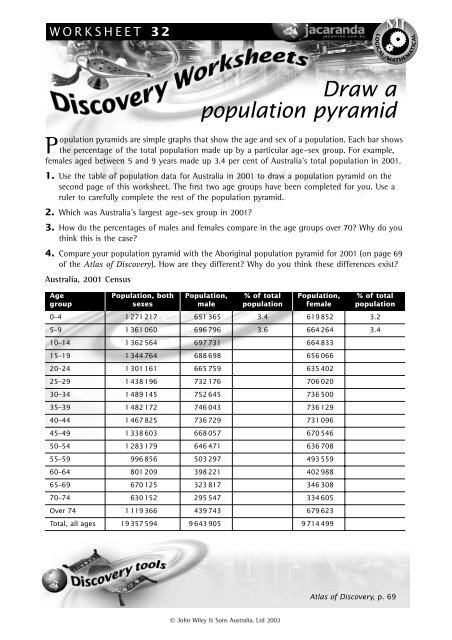
opulation <strong>pyramid</strong>s are simple graphs that show the age and sex of a <strong>population</strong>. Each bar shows<br />
the percentage of the total <strong>population</strong> made up by a particular age–sex group. For example,<br />
females aged between 5 and 9 years made up 3.4 per cent of Australia’s total <strong>population</strong> in 2001.<br />
1. Use the table of <strong>population</strong> data for Australia in 2001 to draw a <strong>population</strong> <strong>pyramid</strong> on the<br />
second page of this worksheet. The first two age groups have been completed for you. Use a<br />
ruler to carefully complete the rest of the <strong>population</strong> <strong>pyramid</strong>.<br />
2. Which was Australia’s largest age–sex group in 2001<br />
3. How do the percentages of males and females compare in the age groups over 70 Why do you<br />
think this is the case<br />
4. Compare your <strong>population</strong> <strong>pyramid</strong> with the Aboriginal <strong>population</strong> <strong>pyramid</strong> for 2001 (on page 69<br />
of the Atlas of Discovery). How are they different Why do you think these differences exist<br />
Australia, 2001 Census<br />
Age<br />
group<br />
Population, both<br />
sexes<br />
Population,<br />
male<br />
% of total<br />
<strong>population</strong><br />
Population,<br />
female<br />
% of total<br />
<strong>population</strong><br />
0–4 1 271 217 651 365 3.4 619 852 3.2<br />
5–9 1 361 060 696 796 3.6 664 264 3.4<br />
10–14 1 362 564 697 731 664 833<br />
15–19 1 344 764 688 698 656 066<br />
20–24 1 301 161 665 759 635 402<br />
25–29 1 438 196 732 176 706 020<br />
30–34 1 489 145 752 645 736 500<br />
35–39 1 482 172 746 043 736 129<br />
40–44 1 467 825 736 729 731 096<br />
45–49 1 338 603 668 057 670 546<br />
50–54 1 283 179 646 471 636 708<br />
55–59 996 856 503 297 493 559<br />
60–64 801 209 398 221 402 988<br />
65–69 670 125 323 817 346 308<br />
70–74 630 152 295 547 334 605<br />
Over 74 1 119 366 439 743 679 623<br />
Total, all ages 19 357 594 9 643 905 9 714 499<br />
Atlas of Discovery, p. 69<br />
© John Wiley & Sons Australia, Ltd 2003
WORKSHEET 32 • page 2<br />
LOGICAL/MATHEMATICAL<br />
Male<br />
Australia, 2001<br />
Age (years)<br />
over 74<br />
70–74<br />
65–69<br />
60–64<br />
55–59<br />
50–54<br />
45–49<br />
40–44<br />
35–39<br />
30–34<br />
25–29<br />
20–24<br />
15–19<br />
10–14<br />
5–9<br />
Female<br />
0–4<br />
8 7 6 5 4 3 2 1 0 0 1 2 3 4 5 6 7 8<br />
Percentage of total <strong>population</strong><br />
© John Wiley & Sons Australia, Ltd 2003