Package 'Heatplus'
Package 'Heatplus'
Package 'Heatplus'
- No tags were found...

You also want an ePaper? Increase the reach of your titles
YUMPU automatically turns print PDFs into web optimized ePapers that Google loves.
20 picketPlot<br />
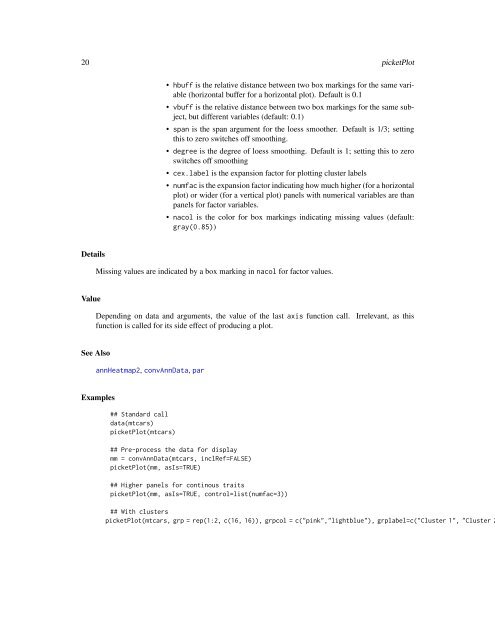
• hbuff is the relative distance between two box markings for the same variable<br />
(horizontal buffer for a horizontal plot). Default is 0.1<br />
• vbuff is the relative distance between two box markings for the same subject,<br />
but different variables (default: 0.1)<br />
• span is the span argument for the loess smoother. Default is 1/3; setting<br />
this to zero switches off smoothing.<br />
• degree is the degree of loess smoothing. Default is 1; setting this to zero<br />
switches off smoothing<br />
• cex.label is the expansion factor for plotting cluster labels<br />
• numfac is the expansion factor indicating how much higher (for a horizontal<br />
plot) or wider (for a vertical plot) panels with numerical variables are than<br />
panels for factor variables.<br />
• nacol is the color for box markings indicating missing values (default:<br />
gray(0.85))<br />
Details<br />
Missing values are indicated by a box marking in nacol for factor values.<br />
Value<br />
Depending on data and arguments, the value of the last axis function call.<br />
function is called for its side effect of producing a plot.<br />
Irrelevant, as this<br />
See Also<br />
annHeatmap2, convAnnData, par<br />
Examples<br />
## Standard call<br />
data(mtcars)<br />
picketPlot(mtcars)<br />
## Pre-process the data for display<br />
mm = convAnnData(mtcars, inclRef=FALSE)<br />
picketPlot(mm, asIs=TRUE)<br />
## Higher panels for continous traits<br />
picketPlot(mm, asIs=TRUE, control=list(numfac=3))<br />
## With clusters<br />
picketPlot(mtcars, grp = rep(1:2, c(16, 16)), grpcol = c("pink","lightblue"), grplabel=c("Cluster 1", "Cluster 2