Estimated Probability of Competing in Athletics Beyond High School
Estimated Probability of Competing in Athletics Beyond High School
Estimated Probability of Competing in Athletics Beyond High School
- No tags were found...

You also want an ePaper? Increase the reach of your titles
YUMPU automatically turns print PDFs into web optimized ePapers that Google loves.
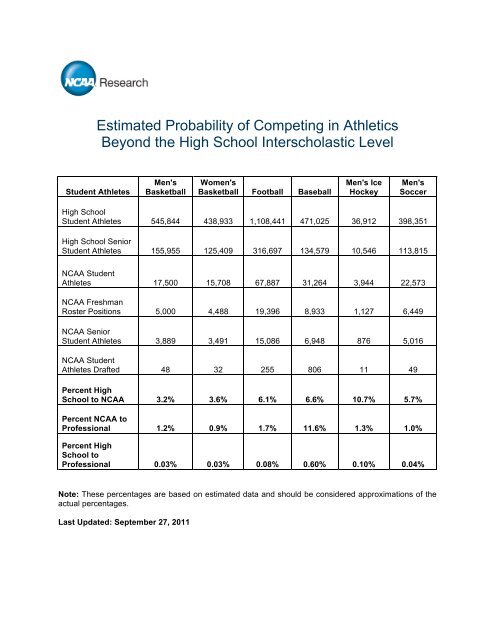
<strong>Estimated</strong> <strong>Probability</strong> <strong>of</strong> <strong>Compet<strong>in</strong>g</strong> <strong>in</strong> <strong>Athletics</strong><br />
<strong>Beyond</strong> the <strong>High</strong> <strong>School</strong> Interscholastic Level<br />
Student Athletes<br />
Men's<br />
Basketball<br />
Women's<br />
Basketball Football Baseball<br />
Men's Ice<br />
Hockey<br />
Men's<br />
Soccer<br />
<strong>High</strong> <strong>School</strong><br />
Student Athletes 545,844 438,933 1,108,441 471,025 36,912 398,351<br />
<strong>High</strong> <strong>School</strong> Senior<br />
Student Athletes 155,955 125,409 316,697 134,579 10,546 113,815<br />
NCAA Student<br />
Athletes 17,500 15,708 67,887 31,264 3,944 22,573<br />
NCAA Freshman<br />
Roster Positions 5,000 4,488 19,396 8,933 1,127 6,449<br />
NCAA Senior<br />
Student Athletes 3,889 3,491 15,086 6,948 876 5,016<br />
NCAA Student<br />
Athletes Drafted 48 32 255 806 11 49<br />
Percent <strong>High</strong><br />
<strong>School</strong> to NCAA 3.2% 3.6% 6.1% 6.6% 10.7% 5.7%<br />
Percent NCAA to<br />
Pr<strong>of</strong>essional 1.2% 0.9% 1.7% 11.6% 1.3% 1.0%<br />
Percent <strong>High</strong><br />
<strong>School</strong> to<br />
Pr<strong>of</strong>essional 0.03% 0.03% 0.08% 0.60% 0.10% 0.04%<br />
Note: These percentages are based on estimated data and should be considered approximations <strong>of</strong> the<br />
actual percentages.<br />
Last Updated: September 27, 2011
<strong>Estimated</strong> <strong>Probability</strong> <strong>of</strong> <strong>Compet<strong>in</strong>g</strong> <strong>in</strong> <strong>Athletics</strong><br />
<strong>Beyond</strong> the <strong>High</strong> <strong>School</strong> Interscholastic Level<br />
Men's Basketball<br />
• Less than one <strong>in</strong> 35, or approximately 3.1 percent, <strong>of</strong> high school senior boys play<strong>in</strong>g<br />
<strong>in</strong>terscholastic basketball will go on to play men's basketball at a NCAA member <strong>in</strong>stitution.<br />
• About one <strong>in</strong> 75, or approximately 1.2 percent, <strong>of</strong> NCAA male senior basketball players will get<br />
drafted by a National Basketball Association (NBA) team.<br />
• Three <strong>in</strong> 10,000, or approximately 0.03 percent <strong>of</strong> high school senior boys play<strong>in</strong>g<br />
<strong>in</strong>terscholastic basketball will eventually be drafted by an NBA team.<br />
Women's Basketball<br />
• Approximately three <strong>in</strong> 100, or 3.5 percent, <strong>of</strong> high school senior girls <strong>in</strong>terscholastic basketball<br />
players will go on to play women's basketball at a NCAA member <strong>in</strong>stitution.<br />
• Less than one <strong>in</strong> 100, or approximately 0.9 percent, <strong>of</strong> NCAA female senior basketball players<br />
will get drafted by a Women's National Basketball Association (WNBA) team.<br />
• One <strong>in</strong> 5,000, or approximately 0.03 percent <strong>of</strong> high school senior girls play<strong>in</strong>g <strong>in</strong>terscholastic<br />
basketball will eventually be drafted by a WNBA team.<br />
Football<br />
• About 6.0 percent, or less than one <strong>in</strong> 16, <strong>of</strong> all high school senior boys play<strong>in</strong>g <strong>in</strong>terscholastic<br />
football will go on to play football at a NCAA member <strong>in</strong>stitution.<br />
• Approximately one <strong>in</strong> 50, or 1.7 percent, <strong>of</strong> NCAA senior football players will get drafted by a<br />
National Football League (NFL) team.<br />
• Eight <strong>in</strong> 10,000, or approximately 0.08 percent <strong>of</strong> high school senior boys play<strong>in</strong>g<br />
<strong>in</strong>terscholastic football will eventually be drafted by an NFL team.<br />
Baseball<br />
• About three <strong>in</strong> 50, or about 6.4 percent, <strong>of</strong> high school senior boys <strong>in</strong>terscholastic baseball<br />
players will go on to play men's baseball at a NCAA member <strong>in</strong>stitution.<br />
• About n<strong>in</strong>e <strong>in</strong> 100, or about 8.9 percent, <strong>of</strong> NCAA senior male baseball players will get drafted<br />
by a Major League Baseball (MLB) team.<br />
• Approximately one <strong>in</strong> 200, or 0.44 percent <strong>of</strong> high school senior boys play<strong>in</strong>g <strong>in</strong>terscholastic<br />
baseball will eventually be drafted by an MLB team.<br />
Men's Ice Hockey<br />
• Approximately 11 <strong>in</strong> 100, or about 10.8 percent, <strong>of</strong> high school senior boys <strong>in</strong>terscholastic ice<br />
hockey players will go on to play men's ice hockey at a NCAA member <strong>in</strong>stitution.<br />
• One <strong>in</strong> 26, or about 3.8 percent, <strong>of</strong> NCAA senior male ice hockey players will get drafted by a<br />
National Hockey League (NHL) team.<br />
• Less than one <strong>in</strong> 300, or approximately 0.32 percent <strong>of</strong> high school senior boys play<strong>in</strong>g<br />
<strong>in</strong>terscholastic ice hockey will eventually be drafted by an NHL team.<br />
Men's Soccer<br />
• Less than three <strong>in</strong> 50, or about 5.6 percent, <strong>of</strong> high school senior boys <strong>in</strong>terscholastic soccer<br />
players will go on to play men's soccer at a NCAA member <strong>in</strong>stitution.<br />
• Less than one <strong>in</strong> 50, or about 1.6 percent, <strong>of</strong> NCAA senior male soccer players will be drafted<br />
by a Major League Soccer (MLS) team.<br />
• Approximately one <strong>in</strong> 1,250, or approximately 0.07 percent <strong>of</strong> high school senior boys play<strong>in</strong>g<br />
<strong>in</strong>terscholastic soccer will eventually be drafted by an MLS team.
<strong>Estimated</strong> <strong>Probability</strong> <strong>of</strong> <strong>Compet<strong>in</strong>g</strong> <strong>in</strong> <strong>Athletics</strong><br />
<strong>Beyond</strong> the <strong>High</strong> <strong>School</strong> Interscholastic Level<br />
Methodology<br />
To calculate the estimated probability <strong>of</strong> compet<strong>in</strong>g <strong>in</strong> athletics beyond the high school <strong>in</strong>terscholastic<br />
level, data from several sources were comb<strong>in</strong>ed. First, the estimated number <strong>of</strong> high school studentathletes<br />
participat<strong>in</strong>g <strong>in</strong>terscholastically <strong>in</strong> the sports hav<strong>in</strong>g a major pr<strong>of</strong>essional league <strong>in</strong> the United<br />
States was obta<strong>in</strong>ed from the National Federation <strong>of</strong> State <strong>High</strong> <strong>School</strong> Associations. To calculate the<br />
number <strong>of</strong> high school seniors participat<strong>in</strong>g <strong>in</strong>terscholastically <strong>in</strong> those sports, the total number <strong>of</strong> high<br />
school student-athletes participat<strong>in</strong>g was divided by 3.5. This figure was used because some high<br />
schools are three-year high schools while others are four-year high schools.<br />
The estimated number <strong>of</strong> NCAA student-athletes compet<strong>in</strong>g <strong>in</strong> the sports with major pr<strong>of</strong>essional leagues<br />
<strong>in</strong> the United States was obta<strong>in</strong>ed from the NCAA's 1982-11 Participation Statistics Report. To estimate<br />
the number <strong>of</strong> NCAA roster positions <strong>in</strong> these sports available to an <strong>in</strong>com<strong>in</strong>g freshmen class, the total<br />
number <strong>of</strong> NCAA student-athletes participat<strong>in</strong>g was divided by 3.5. This figure was used because current<br />
player attrition will leave more roster positions open than would be expected due to normal graduation. To<br />
estimate the number <strong>of</strong> NCAA senior student-athletes participat<strong>in</strong>g <strong>in</strong> those sports, the total number <strong>of</strong><br />
NCAA student-athletes participat<strong>in</strong>g was divided by 4.5. This figure was used because student-athletes<br />
participat<strong>in</strong>g <strong>in</strong> these sports <strong>of</strong>ten red shirt and therefore are on the team for five years. The number <strong>of</strong><br />
college student-athletes drafted by the major pr<strong>of</strong>essional sport leagues <strong>in</strong> the United States was<br />
calculated us<strong>in</strong>g the most recent draft data for each league.<br />
To calculate the probability <strong>of</strong> a high school senior go<strong>in</strong>g on to participate for a NCAA <strong>in</strong>stitution <strong>in</strong> these<br />
sports, the estimated number <strong>of</strong> open NCAA roster positions was divided by the estimated number <strong>of</strong> high<br />
school seniors participat<strong>in</strong>g <strong>in</strong>terscholastically <strong>in</strong> these sports. To calculate the probability <strong>of</strong> a NCAA<br />
senior student-athlete be<strong>in</strong>g drafted by a pr<strong>of</strong>essional team <strong>in</strong> these sports, the number <strong>of</strong> NCAA studentathletes<br />
drafted <strong>in</strong>to these pr<strong>of</strong>essional leagues was divided by the estimated number <strong>of</strong> NCAA senior<br />
student-athletes participat<strong>in</strong>g <strong>in</strong> these sports. To calculate the probability <strong>of</strong> a high school senior studentathlete<br />
eventually be<strong>in</strong>g drafted by a pr<strong>of</strong>essional team <strong>in</strong> these sports, the number <strong>of</strong> NCAA senior<br />
student-athletes drafted by a United States pr<strong>of</strong>essional league <strong>in</strong> these sports was divided by the<br />
estimated number <strong>of</strong> high school seniors participat<strong>in</strong>g <strong>in</strong>terscholastically <strong>in</strong> these sports. All probabilities<br />
were multiplied by 100 to convert them to percentages.<br />
Obviously, many assumptions and estimations are made <strong>in</strong> the process <strong>of</strong> calculat<strong>in</strong>g these figures.<br />
Therefore, the reader should not consider these figures to be exact, but <strong>in</strong>stead should view these figures<br />
as educated calculations.