1 mass balance and water quality in aquaculture tanks - The United ...
1 mass balance and water quality in aquaculture tanks - The United ...
1 mass balance and water quality in aquaculture tanks - The United ...

You also want an ePaper? Increase the reach of your titles
YUMPU automatically turns print PDFs into web optimized ePapers that Google loves.
PO Box 1390, Skulagata 4<br />
120 Reykjavik, Icel<strong>and</strong> F<strong>in</strong>al Project 2001<br />
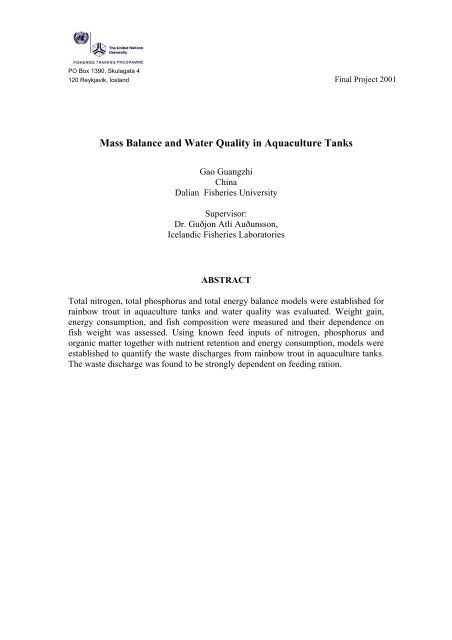
Mass Balance <strong>and</strong> Water Quality <strong>in</strong> Aquaculture Tanks<br />
Gao Guangzhi<br />
Ch<strong>in</strong>a<br />
Dalian Fisheries University<br />
Supervisor:<br />
Dr. Guðjon Atli Auðunsson,<br />
Icel<strong>and</strong>ic Fisheries Laboratories<br />
ABSTRACT<br />
Total nitrogen, total phosphorus <strong>and</strong> total energy <strong>balance</strong> models were established for<br />
ra<strong>in</strong>bow trout <strong>in</strong> <strong>aquaculture</strong> <strong>tanks</strong> <strong>and</strong> <strong>water</strong> <strong>quality</strong> was evaluated. Weight ga<strong>in</strong>,<br />
energy consumption, <strong>and</strong> fish composition were measured <strong>and</strong> their dependence on<br />
fish weight was assessed. Us<strong>in</strong>g known feed <strong>in</strong>puts of nitrogen, phosphorus <strong>and</strong><br />
organic matter together with nutrient retention <strong>and</strong> energy consumption, models were<br />
established to quantify the waste discharges from ra<strong>in</strong>bow trout <strong>in</strong> <strong>aquaculture</strong> <strong>tanks</strong>.<br />
<strong>The</strong> waste discharge was found to be strongly dependent on feed<strong>in</strong>g ration.
Gao Guangzhi<br />
TABLE OF CONTENTS<br />
1 INTRODUCTION.........................................................................................................................4<br />
2 MATERIALS AND METHODS .................................................................................................6<br />
2.1 PROCEDURE OF THE PROJECT .................................................................................................6<br />
2.2 FIELD TEST.............................................................................................................................6<br />
2.2.1 Test facilities.....................................................................................................................6<br />
2.2.2 Species <strong>and</strong> group<strong>in</strong>g of fish.............................................................................................7<br />
2.2.3 Feed<strong>in</strong>g <strong>and</strong> Sampl<strong>in</strong>g ......................................................................................................8<br />
2.3 ANALYSIS...............................................................................................................................9<br />
2.3.1 COD..................................................................................................................................9<br />
2.3.2 TN <strong>and</strong> TP.........................................................................................................................9<br />
2.3.3 DO ..................................................................................................................................10<br />
3 RESULTS ....................................................................................................................................11<br />
3.1 GROWTH ..............................................................................................................................11<br />
3.1.1 Weight ga<strong>in</strong>.....................................................................................................................11<br />
3.1.2 Growth curve for each group..........................................................................................12<br />
3.1.3 Growth curve for all fish.................................................................................................13<br />
3.2 CORRELATION ANALYSIS, ESTIMATION OF PARAMETERS......................................................14<br />
3.2.1 COD & fish size..............................................................................................................14<br />
3.3 TN, TP AND FISH SIZE ..........................................................................................................15<br />
3.3.1 DO consumption <strong>and</strong> fish size ........................................................................................16<br />
3.3.2 FR equation ....................................................................................................................18<br />
3.4 MASS BALANCE....................................................................................................................19<br />
3.4.1 Nitrogen budget ..............................................................................................................19<br />
3.4.2 Phosphorus budget .........................................................................................................21<br />
3.4.3 Energy budget.................................................................................................................22<br />
3.4.4 Physical forms of the waste ............................................................................................25<br />
4 CONCLUSION ...........................................................................................................................28<br />
ACKNOWLEDGEMENTS .................................................................................................................29<br />
REFERENCES .....................................................................................................................................30<br />
UNU-Fisheries Tra<strong>in</strong><strong>in</strong>g Programme 2
Gao Guangzhi<br />
LIST OF FIGURES<br />
Figure 1: Procedure of study........................................................................................6<br />
Figure 2: <strong>The</strong> experimental <strong>tanks</strong> with automatic feed<strong>in</strong>g mach<strong>in</strong>es on top (A). <strong>The</strong><br />
conveyer grid system collects faecal material from the tank (B)...........................7<br />
Figure 3: Correlation of length <strong>and</strong> weight...................................................................7<br />
Figure 4: Average temperature dur<strong>in</strong>g the experiment. ..............................................13<br />
Figure 5: Correlation of the relationship between average weight <strong>and</strong> average weight<br />
ga<strong>in</strong>.......................................................................................................................13<br />
Figure 6: Growth curve of fish <strong>in</strong> the experiment.....................................................14<br />
Figure 7: Correlation of COD <strong>and</strong> fish size................................................................15<br />
Figure 8: Correlation between DO consumption <strong>and</strong> fish size. ..................................16<br />
Figure 9: Average air saturation the last 15 days........................................................17<br />
Figure 10: Correlation of log- log regression relationship between FR <strong>and</strong> fish size.18<br />
Figure 11: Approach of the calculation for TN budget...............................................19<br />
Figure 12: Nitrogen <strong>balance</strong> budget...........................................................................20<br />
Figure 13: Phosphorus <strong>balance</strong> budget. ......................................................................22<br />
Figure 14: Energy <strong>balance</strong> budget. .............................................................................24<br />
LIST OF TABLES<br />
Table 1: Size <strong>and</strong> density at the start of the experiment. ..............................................8<br />
Table 2: Sampl<strong>in</strong>g scheme. ...........................................................................................8<br />
Table 3: Composition of the feed.................................................................................9<br />
Table 4: Growth rate <strong>and</strong> feed<strong>in</strong>g rate. .......................................................................11<br />
Table 5: Average weight of fish..................................................................................12<br />
Table 6: TN <strong>in</strong> <strong>and</strong> TN out of different FR..................................................................21<br />
Table 7: TP <strong>in</strong>put <strong>and</strong> TP output of different FR................................................................22<br />
Table 8: E <strong>in</strong> <strong>and</strong> E out of different FR..........................................................................24<br />
Table 9: TN <strong>and</strong> TP level <strong>in</strong> <strong>water</strong>..............................................................................25<br />
Table 10: Average feed<strong>in</strong>g ration (g d -1 ) on the sampl<strong>in</strong>g dates for <strong>water</strong>. ...............26<br />
Table 11: Comparison of different FR.......................................................................27<br />
UNU-Fisheries Tra<strong>in</strong><strong>in</strong>g Programme 3
Gao Guangzhi<br />
1 INTRODUCTION<br />
Aquaculture is the farm<strong>in</strong>g of aquatic organisms, <strong>in</strong>clud<strong>in</strong>g fish, molluscs, crustaceans<br />
<strong>and</strong> aquatic plants (FAO 2000). Aquaculture has been the world's fastest grow<strong>in</strong>g<br />
food production system because of <strong>in</strong>ternational dem<strong>and</strong> for luxury items <strong>and</strong> regional<br />
need for food, high dem<strong>and</strong> for fish products, decl<strong>in</strong><strong>in</strong>g wild stocks <strong>and</strong> decreased<br />
access to fisheries. Aquaculture production <strong>in</strong>creased from 7.4 million tons <strong>in</strong> 1980 to<br />
more than 42 million tons <strong>in</strong> 1999. <strong>The</strong> sector's production is grow<strong>in</strong>g at an average<br />
rate of more than 10% per year. Asian <strong>aquaculture</strong> farmers cont<strong>in</strong>ue to contribute<br />
about 90% of the world's <strong>aquaculture</strong> production. Projections of world fishery<br />
production <strong>in</strong> 2010 range between 107 <strong>and</strong> 144 million tons, of which about 30<br />
million tons will probably be reduced to fish meal <strong>and</strong> oil for non-food use. Most of<br />
the <strong>in</strong>crease <strong>in</strong> fish production is expected to come from <strong>aquaculture</strong>. Aquaculture has<br />
brought significant economic <strong>and</strong> employment benefits to both national economies<br />
<strong>and</strong> coastal people throughout the world (FAO 2001).<br />
Unfortunately, exist<strong>in</strong>g <strong>aquaculture</strong> operations can have a negative impact on the<br />
mar<strong>in</strong>e environment. Aquaculture systems can produce large quantities of pollut<strong>in</strong>g<br />
wastes, which are often released directly <strong>in</strong>to natural bodies of <strong>water</strong>. <strong>The</strong>se wastes<br />
consist primarily of uneaten fish feed, faecal material <strong>and</strong> other excretory wastes. <strong>The</strong><br />
waste is a source of nutrient pollution - carbon-based organic matter, nitrogen <strong>and</strong><br />
phosphorous compounds. High nutrient levels can stimulate blooms of<br />
photoplankton(Goldburg 1997). When algae die <strong>in</strong> large numbers, their subsequent<br />
degradation can drastically reduce oxygen levels <strong>in</strong> <strong>water</strong>, stress<strong>in</strong>g or kill<strong>in</strong>g fish <strong>and</strong><br />
other organisms. However, oxygen depletion may not be the most harmful effect of<br />
nutrient-stimulated photoplankton growth (Emerson 1999). Blooms of toxic algae<br />
species can produce huge fish kills, contam<strong>in</strong>ate shellfish, <strong>and</strong> potentially even pose a<br />
health hazard to humans. An example of toxic alga blooms is red tides. Prelim<strong>in</strong>ary<br />
evidence suggests that such blooms may be promoted by nutrient pollution from<br />
various sources.<br />
<strong>The</strong> environmental impact of mar<strong>in</strong>e fish-farm<strong>in</strong>g depends strongly on the system,<br />
species <strong>and</strong> the culture method (Edwards 1978). Aquaculture systems can be divided<br />
<strong>in</strong>to three types accord<strong>in</strong>g to the scale of operation. Extensive system: <strong>aquaculture</strong><br />
without no or little environmental modifications, such as abalone <strong>and</strong> sea cucumber,<br />
just put the fry <strong>in</strong>to the sea. Semi-<strong>in</strong>tensive system: pond <strong>aquaculture</strong>, the density is a<br />
little bit higher than the natural environment. Intensive system: usually l<strong>and</strong>-based,<br />
closed system <strong>aquaculture</strong>. <strong>The</strong> systems are open (flow-through <strong>water</strong>) or closed<br />
(recirculat<strong>in</strong>g <strong>water</strong>). <strong>The</strong>re are more than 100 species of aquatic organisms farmed <strong>in</strong><br />
the world. <strong>The</strong> studies on the environmental impact of <strong>aquaculture</strong> production have<br />
been carried out focus<strong>in</strong>g on different systems <strong>and</strong> different species.<br />
<strong>The</strong> ma<strong>in</strong> species where their impact on mar<strong>in</strong>e environment have been studied are:<br />
shrimp (Paez-Osuna et al. 1998, Paez-Osuna et al. 1999, Trott <strong>and</strong> Alongi 2000, Paez-<br />
Osuna 2001), Gilthead seabream (Sparus aurata) (Tovar et al. 2000), Channel catfish<br />
(Ictalurus punctatus)(Tucker et al. 1996), Sea bass (Dicentrarchus labrax)(Pag<strong>and</strong> et<br />
al. 2000), salmon- mussel(Troell <strong>and</strong> Norberg 1998). salmonid fishes (Young <strong>and</strong><br />
Bureau 1998). <strong>The</strong>se studies focused on the load<strong>in</strong>g of dissolved nutrients, suspended<br />
solids <strong>and</strong> organic matter <strong>and</strong> biochemical oxygen dem<strong>and</strong>. From the studies<br />
mentioned above, several <strong>mass</strong> <strong>balance</strong> models have been built up from which the<br />
UNU-Fisheries Tra<strong>in</strong><strong>in</strong>g Programme 4
Gao Guangzhi<br />
total nitrogen <strong>and</strong> phosphorous discharges <strong>in</strong>to receiv<strong>in</strong>g <strong>water</strong>s can be estimated.<br />
(Not mathematical models).<br />
Most of these studies are conducted on open systems. <strong>The</strong> common goal of these<br />
studies is to exam<strong>in</strong>e the environmental impacts of <strong>aquaculture</strong> <strong>and</strong> to relax or reduce<br />
the pressure, which is put on the mar<strong>in</strong>e environment by pollution from fish farm<strong>in</strong>g.<br />
<strong>The</strong> use of recirculat<strong>in</strong>g <strong>water</strong> systems is an approach that is used to limit the impact<br />
of <strong>aquaculture</strong> on the environment. Although the total quantity of nutrients released is<br />
similar <strong>in</strong> flow through <strong>and</strong> recirculation systems, the small volumes of concentrated<br />
effluent from the recirculation systems are easier to deal with (Pag<strong>and</strong> et al. 2000).<br />
Several approaches have been taken <strong>in</strong> order to reduce pollutants discharged <strong>in</strong>to the<br />
environment <strong>in</strong> flow-through systems. For example, <strong>in</strong> Ch<strong>in</strong>a, polyculture of scallops,<br />
sea cucumbers <strong>and</strong> kelp reduces eutrophication <strong>and</strong> the use of toxic antifoul<strong>in</strong>g<br />
compounds.<br />
Up to now, the most commonly used <strong>quality</strong> based environmental st<strong>and</strong>ards are <strong>water</strong><br />
<strong>quality</strong> st<strong>and</strong>ards (e.g. acceptable nitrogen, phosphorus, BOD, COD <strong>and</strong> oxygen<br />
concentration). Unfortunately, the application of the st<strong>and</strong>ards is sometimes limited<br />
because very little is known about the capacity of the receiv<strong>in</strong>g <strong>water</strong>s for pollutants.<br />
This is particularly the case <strong>in</strong> develop<strong>in</strong>g countries (FAO 2001). Ch<strong>in</strong>a is situated <strong>in</strong><br />
eastern Asia, bounded by the Pacific <strong>in</strong> the east. <strong>The</strong> coastl<strong>in</strong>e extends well over<br />
14,500 km with the <strong>water</strong>s of the Bohai, the Huanghai, the East Ch<strong>in</strong>a <strong>and</strong> the South<br />
Ch<strong>in</strong>a seas with the area of 103,300 square miles (NOAA 2001). Ch<strong>in</strong>a dom<strong>in</strong>ates<br />
global <strong>aquaculture</strong> with 63.4% of the world <strong>aquaculture</strong> production <strong>in</strong> 1995, which<br />
accounted for 70.4% of Asian production (FAO 2001). Between 1990 <strong>and</strong> 1995,<br />
Ch<strong>in</strong>ese fisheries production <strong>in</strong>creased 16.0%. <strong>The</strong> greater part of this <strong>in</strong>crease was<br />
due to <strong>aquaculture</strong> (18.5% compared to 12.7% for captures fisheries). <strong>The</strong><br />
contribution of <strong>aquaculture</strong> to Ch<strong>in</strong>ese fisheries <strong>in</strong>creased from 51.6% <strong>in</strong> the 1980´s to<br />
60.5% <strong>in</strong> 1995, an <strong>in</strong>crease of about 10 million tons.<br />
Bohai Sea is the <strong>in</strong>l<strong>and</strong> sea of Ch<strong>in</strong>a. <strong>The</strong> area is 2400 square nautical miles. Bohai<br />
Sea, also named "natural fishery", is a major fishery resource of Ch<strong>in</strong>a. Some<br />
traditional economic fish have disappeared <strong>in</strong> recent years. <strong>The</strong> stock of those<br />
traditional good-<strong>quality</strong> economic fishes positioned at higher levels of the food cha<strong>in</strong><br />
has been decl<strong>in</strong><strong>in</strong>g while the stock of those lower-<strong>quality</strong> fishes is <strong>in</strong>creas<strong>in</strong>g. S<strong>in</strong>ce<br />
the 1980´s the catch <strong>in</strong> Bohai Sea has been low. In contrast, <strong>aquaculture</strong> production<br />
has developed fast. Hence the <strong>aquaculture</strong> operations put much pressure on the mar<strong>in</strong>e<br />
environment. <strong>The</strong> mar<strong>in</strong>e biological environment is fac<strong>in</strong>g degradation (Ch<strong>in</strong>a.<br />
Mar<strong>in</strong>e Ecological Environment Protection 2001). Develop<strong>in</strong>g mar<strong>in</strong>e pastures <strong>in</strong> the<br />
Bohai Sea is one of the measures by which the mar<strong>in</strong>e biological environment is<br />
expected to be improved. Dalian Fisheries University is operat<strong>in</strong>g the project <strong>and</strong><br />
this study will contribute to that work. It is necessary <strong>and</strong> urgent to have a good<br />
underst<strong>and</strong><strong>in</strong>g of the environmental effect of <strong>aquaculture</strong>.<br />
<strong>The</strong> aims of this study are to study the <strong>mass</strong> <strong>balance</strong> of chemical oxygen dem<strong>and</strong><br />
(COD) <strong>and</strong> nutrients (TN, TP) <strong>in</strong> <strong>aquaculture</strong>, exam<strong>in</strong>e the tools required for<br />
modell<strong>in</strong>g material flow <strong>in</strong> <strong>aquaculture</strong>, study monitor<strong>in</strong>g <strong>and</strong> analytical methods for<br />
<strong>water</strong> <strong>quality</strong> exam<strong>in</strong>ations, <strong>and</strong> estimate <strong>and</strong> model different physical forms of waste<br />
from <strong>aquaculture</strong>.<br />
UNU-Fisheries Tra<strong>in</strong><strong>in</strong>g Programme 5
Gao Guangzhi<br />
2 MATERIALS AND METHODS<br />
2.1 Procedure of the project<br />
<strong>The</strong> project consisted of ma<strong>in</strong>ly three parts: field-tests, laboratory experiments <strong>and</strong><br />
data analysis. <strong>The</strong> procedure of study is shown <strong>in</strong> Figure1.<br />
Choice of species<br />
FIELD TEST<br />
Grad<strong>in</strong>g of fish<br />
Feed<strong>in</strong>g<br />
Sampl<strong>in</strong>g<br />
Determ<strong>in</strong>ation of methods<br />
LABORATORY<br />
EXPERIMENTS<br />
Sample conservation<br />
Sample analysis<br />
Correlation<br />
DATA ANALYSIS<br />
AND MASS<br />
BALANCE STUDIES<br />
Estimation of parameters<br />
Build up mathematical models<br />
Figure 1: Procedure of study<br />
2.2 Field test<br />
<strong>The</strong> experiment was conducted at Icel<strong>and</strong>ic Agriculture Research Institute -<br />
<strong>aquaculture</strong> station <strong>in</strong> December 2001 <strong>and</strong> January 2002 (6 weeks).<br />
2.2.1 Test facilities<br />
Indoor <strong>aquaculture</strong> facilities consist of eight 0.45 m 3 <strong>tanks</strong> (Figure 2). Cold <strong>water</strong><br />
(4°C) <strong>and</strong> warm <strong>water</strong> (18°C) tubes were connected to the <strong>tanks</strong>. Faeces were<br />
collected at the outlet of each tank. In the bottom of the tank an approximately 10-cm<br />
tube was put <strong>in</strong>to the <strong>water</strong> body. This made of the leftover feed accumulate <strong>in</strong> the<br />
bottom but also part of the faeces. In this way an actually separation of faeces <strong>and</strong><br />
leftover feed was collected. Water temperature was kept about 11°C <strong>and</strong> <strong>water</strong> flow<br />
was about 0.6 m 3 h -1 <strong>in</strong> the <strong>tanks</strong>. <strong>The</strong> dissolved oxygen of <strong>in</strong>flow <strong>water</strong> was > 95%.<br />
UNU-Fisheries Tra<strong>in</strong><strong>in</strong>g Programme 6
Gao Guangzhi<br />
A constant 24 hour artificial ambient light was applied. <strong>The</strong> tank open<strong>in</strong>gs were partly<br />
covered to h<strong>in</strong>der the fish jump<strong>in</strong>g out of the <strong>tanks</strong>.<br />
A<br />
B<br />
Figure 2: <strong>The</strong> experimental <strong>tanks</strong> with automatic feed<strong>in</strong>g mach<strong>in</strong>es on top (A). <strong>The</strong><br />
conveyer grid system collects faecal material from the tank (B).<br />
2.2.2 Species <strong>and</strong> group<strong>in</strong>g of fish<br />
Ra<strong>in</strong>bow trout (Oncorhynchus Mykiss) was used as the experimental fish. <strong>The</strong> length<br />
<strong>and</strong> weight of the fish was measured (Figure 3) <strong>and</strong> grouped <strong>in</strong>to four weight classes<br />
(Table 1). For this purpose the fish was put to sleep by add<strong>in</strong>g phenoxyethanol to the<br />
<strong>water</strong> <strong>in</strong> the ratio of 1-2ml per liter. <strong>The</strong> fish was kept asleep dur<strong>in</strong>g measurements.<br />
<strong>The</strong> fish was weighed to the nearest centigram (0.01) <strong>and</strong> total length was measured to<br />
the nearest mm.<br />
5,5<br />
5,0<br />
Ln(W) = 2,987xLn(L) - 4,3664<br />
r 2 = 0,9717, n=1525<br />
Ln(W, g)<br />
4,5<br />
4,0<br />
3,5<br />
3,0<br />
2,0 2,2 2,4 2,6 2,8 3,0 3,2 3,4<br />
Ln(L, cm)<br />
Figure 3: Correlation of length <strong>and</strong> weight.<br />
UNU-Fisheries Tra<strong>in</strong><strong>in</strong>g Programme 7
Gao Guangzhi<br />
Table 1: Size <strong>and</strong> density at the start of the experiment.<br />
Group Size (g) Initial F<strong>in</strong>al Average Density<br />
number of number of weight (g) (kg/m 3 )<br />
fish fish<br />
1 30 -50 194 191 42 19.3<br />
1 30-50 189 183 43 19.2<br />
2 90-110 124 140 96 28.4<br />
2 70 -90 152 130 81 28.5<br />
3 90-110 127 126 81 24.5<br />
3 90-110 133 122 78 24.6<br />
4 >110 66 63 123 19.3<br />
4 >110 63 64 129 19.4<br />
2.2.3 Feed<strong>in</strong>g <strong>and</strong> Sampl<strong>in</strong>g<br />
<strong>The</strong> experiment started on the 8th of December <strong>and</strong> was term<strong>in</strong>ated on January 15<br />
(total of 39 days). Sampl<strong>in</strong>g type <strong>and</strong> sampl<strong>in</strong>g frequency at each sampl<strong>in</strong>g occasion<br />
is shown <strong>in</strong> Table 2.<br />
Table 2: Sampl<strong>in</strong>g scheme.<br />
Date<br />
8 19 22 23 24 25 2 3 4 5 13 14 15<br />
December 2001 January 2002<br />
Weigh<strong>in</strong>g ♦ ♦ ♦ ♦<br />
Outflow of <strong>water</strong> ♦ ♦ ♦ ♦ ♦ ♦<br />
Left over feed 1 ♦ ♦ ♦ ♦ ♦ ♦<br />
faeces ♦ ♦ ♦ ♦ ♦ ♦<br />
Tray <strong>water</strong> 2 ♦ ♦ ♦ ♦ ♦ ♦<br />
DO 3 ♦ ♦ ♦ ♦ ♦ ♦ ♦ ♦<br />
1. Left over feed: uneaten feed accumulated <strong>in</strong> the bottom of each tank.<br />
2. Tray <strong>water</strong>: <strong>water</strong> of the feed <strong>and</strong> faeces were collected from this tray.<br />
3. DO: dissolved oxygen.<br />
Feed<strong>in</strong>g: <strong>The</strong> fish was fed with commercial dry, pelleted food <strong>and</strong> the chemical<br />
compositions of the food are shown <strong>in</strong> Table 3. <strong>The</strong> composition of the feed was the<br />
same throughout the experiment. Simple feed<strong>in</strong>g mach<strong>in</strong>es were used to feed fish<br />
automatically, twice per day. <strong>The</strong> <strong>in</strong>terval was about 6 hours. <strong>The</strong> daily ration of<br />
ra<strong>in</strong>bow trout depends on the <strong>water</strong> temperature, the size of fish <strong>and</strong> the type of food<br />
used (Anon. 1970). It was calculated as follows:<br />
Feed amount (g) = (TW + WG) * GR * FF (1)<br />
Where TW is the total weight of fish <strong>in</strong> each tank, WG is the predicted weight ga<strong>in</strong>,<br />
GR is the growth rate (wt % d -1 ) <strong>and</strong> FF is the feed factor (g feed/g weight ga<strong>in</strong>).<br />
UNU-Fisheries Tra<strong>in</strong><strong>in</strong>g Programme 8
Gao Guangzhi<br />
Table 3: Composition of the feed.<br />
Constituent<br />
Compositions<br />
Available/digestible energy 17 MJ/kg<br />
Total energy<br />
22MJ/kg<br />
Prote<strong>in</strong> 50%<br />
Fat 22%<br />
Water 9%<br />
Fibres 0.5%<br />
Ash 9%<br />
Carbohydrates 9.5%<br />
Weigh<strong>in</strong>g: Total weight of the fish from each tank was obta<strong>in</strong>ed 3 times dur<strong>in</strong>g the<br />
experiment (Table 2).<br />
Water samples: Water samples were collected three times (over a period of two days<br />
each time). <strong>The</strong> samples was a mixture of 3 samples taken one hour after feed<strong>in</strong>g, 6<br />
hours after feed<strong>in</strong>g <strong>and</strong> the next morn<strong>in</strong>g before feed<strong>in</strong>g.<br />
Solid samples (left over feed <strong>and</strong> faeces): Solid samples were collected 24 hours after<br />
<strong>water</strong> samples were taken.<br />
Tray <strong>water</strong>: Tray <strong>water</strong> was taken <strong>in</strong> the each tray for analys<strong>in</strong>g dissolved feed <strong>and</strong><br />
faces. Volume of each tray was determ<strong>in</strong>ed.<br />
Dissolved Oxygen (DO): Samples for DO were taken from the surface <strong>water</strong> <strong>and</strong> from<br />
the bottom <strong>water</strong> of the <strong>tanks</strong>. <strong>The</strong> <strong>tanks</strong> were cleaned carefully before sampl<strong>in</strong>g.<br />
Oxygen was fixed at the time of sampl<strong>in</strong>g (Chapter 2.5.3.).<br />
2.3 Analysis<br />
2.3.1 COD<br />
Analysis method of COD was based on st<strong>and</strong>ard methords for the exam<strong>in</strong>ation of<br />
<strong>water</strong> <strong>and</strong> waste<strong>water</strong> (APHA 1995). Potassiumhydrogenphthalate (KHP) was used to<br />
monitor whether the method was work<strong>in</strong>g properly. This was done by analys<strong>in</strong>g 0.0,<br />
1.0, 2.5, 5.0mL of the KHP-solution regularly (correspond<strong>in</strong>g to 1 mg O 2 /mL). 10 ml<br />
<strong>and</strong> 20 ml of outflow <strong>and</strong> <strong>in</strong>flow <strong>water</strong> samples were oxidised with 5.00 ml 0.00800M<br />
potassiumdichromate <strong>and</strong> 15 ml silversulphate-sulphuric acid. Heated to boil<strong>in</strong>g.<br />
Boil<strong>in</strong>g needs to start with<strong>in</strong> 10 - 15 m<strong>in</strong>utes <strong>and</strong> should be kept at boil<strong>in</strong>g for exactly<br />
2 hours (±5m<strong>in</strong>). After cool<strong>in</strong>g to room temperature, 2-3 drops of ferro<strong>in</strong> <strong>in</strong>dicator<br />
were added <strong>and</strong> the surplus of dichromate is determ<strong>in</strong>ed by titrat<strong>in</strong>g with 0.014M<br />
ferroammonium sulphate.<br />
<strong>The</strong> COD method for solid samples was almost the same as for aqueous solutions, but<br />
10 ml 0.04M dichromate <strong>and</strong> 0.07M ferroammonium sulphate were used. Left over<br />
feed <strong>and</strong> faeces <strong>and</strong> fish body (whole body) were m<strong>in</strong>ced to a homogenous <strong>mass</strong> <strong>and</strong><br />
diluted 5-times with anhydrous Na 2 SO 4 . Feed was diluted 11-times.<br />
2.3.2 TN <strong>and</strong> TP<br />
Water samples (30-60 ml) were treated with a 10 ml mixture of peroxydisulphate <strong>and</strong><br />
3% boric acid (w/v) <strong>and</strong> autoclaved for 30 m<strong>in</strong>. at 200 kP (120°C) (Valderrama 1981).<br />
TN was analysed by monitor<strong>in</strong>g the absorbance of samples <strong>in</strong> 1 cm quartz cell aga<strong>in</strong>st<br />
<strong>water</strong> at 220 nm <strong>and</strong> 275 nm, UV-lamp <strong>and</strong> 2.0 nm slit with nitrate as a st<strong>and</strong>ard<br />
(APHA 1995). For TP <strong>in</strong> <strong>water</strong>, samples were analysed by the molybden blue method<br />
UNU-Fisheries Tra<strong>in</strong><strong>in</strong>g Programme 9
Gao Guangzhi<br />
(APHA 1995), where colour was measured <strong>in</strong> a 1 cm glass cell aga<strong>in</strong>st a phosphorus<br />
st<strong>and</strong>ard at 630 nm. <strong>The</strong> solid samples were diluted with anhydrous sodium sulphate<br />
<strong>and</strong> digested with 6 ml of concentrated sulphuric acid <strong>and</strong> 15 ml of dropp<strong>in</strong>g<br />
hydrogen peroxide <strong>in</strong> a Hach-apparatus (Hach et al. 1987). <strong>The</strong> ammonia was<br />
analysed by the phenate method (APHA 1995) <strong>and</strong> phosphorus by the molybden blue<br />
method as before.<br />
2.3.3 DO<br />
Analysis of dissolved oxygen was based on Hansen 1999. Samples were collected by<br />
flush<strong>in</strong>g samples from the bottom of the sample flask by siphon<strong>in</strong>g through plastic<br />
tub<strong>in</strong>g. After press<strong>in</strong>g out the excessive <strong>water</strong> by the sample flask cap, 1 ml of the<br />
manganese solution <strong>and</strong> 1 ml of the alkal<strong>in</strong>e iodide solution was added slightly below<br />
the <strong>water</strong> surface <strong>in</strong> the sampl<strong>in</strong>g bottles. <strong>The</strong> density of the reagents made the<br />
additions fall to the bottom. About 20 ml of the clear supernatant was removed from<br />
the sample content <strong>in</strong> the flask tak<strong>in</strong>g care that no precipitate is removed or stirred up.<br />
2 ml of phosphoric acid <strong>and</strong> a magnetic stirr<strong>in</strong>g bar were added. <strong>The</strong> solution was<br />
stirred until all the precipitate has dissolved. As soon as possible <strong>and</strong> as fast as<br />
possible, the solution was titrated with concurrent stirr<strong>in</strong>g with the thiosulphate<br />
work<strong>in</strong>g solution from the brownish colour until fa<strong>in</strong>tly yellow/brownish. Five drops<br />
of the starch <strong>in</strong>dicator were added <strong>and</strong> the titration was cont<strong>in</strong>ued until the blue colour<br />
disappeared.<br />
UNU-Fisheries Tra<strong>in</strong><strong>in</strong>g Programme 10
Gao Guangzhi<br />
3 RESULTS<br />
3.1 Growth<br />
3.1.1 Weight ga<strong>in</strong><br />
<strong>The</strong> <strong>in</strong>itial average weight of fish (IAW), f<strong>in</strong>al average weight (FAW), average weight<br />
(AW), average weight ga<strong>in</strong> (AWG), feed<strong>in</strong>g rate (FR) <strong>and</strong> feed<strong>in</strong>g factor (FF) is<br />
shown <strong>in</strong> Table 4.<br />
Table 4: Growth rate <strong>and</strong> feed<strong>in</strong>g rate.<br />
Group<br />
Days of<br />
feed<strong>in</strong>g<br />
(DN)<br />
Initial<br />
average<br />
weight<br />
(g)<br />
(IW)<br />
F<strong>in</strong>al<br />
average<br />
weight (g)<br />
(FW)<br />
Average<br />
weight<br />
dur<strong>in</strong>g the<br />
experiment<br />
(g fish -1 )<br />
(AW)<br />
Average<br />
weight<br />
ga<strong>in</strong><br />
(g fish -1 d -1 )<br />
(AWG)<br />
Feed<strong>in</strong>g<br />
rate<br />
(g fish -1 d -1 )<br />
(FR)<br />
30-50g 39 42 81 63 1,00 1,96 1.96<br />
30-50g 39 43 85 65 1,07 2,01 1.88<br />
90-110g 39 96 141 114 1,42 3,24 2.85<br />
70-90g 39 81 136 111 1,41 3,22 2.28<br />
70-90g 39 81 152 117 1,82 3,15 1.73<br />
70-90g 39 78 147 116 1,76 3,14 1.78<br />
>110g 39 123 229 172 2,71 4,38 1.61<br />
>110g 39 129 226 173 2,48 4,34 1.75<br />
Feed<strong>in</strong>g<br />
factor<br />
(FF)<br />
IAW is calculated as the total weight divided by the number of fish at the beg<strong>in</strong>n<strong>in</strong>g<br />
of the experiment (Appendix 1). <strong>The</strong> calculation of FAW is done by the same way<br />
IAW. AW is the average value of the four weigh<strong>in</strong>gs (Table 4).<br />
AWG = (FAW - IAW)/DN (2)<br />
FR = Total feed<strong>in</strong>g amount (g d -1 )/ number of fish (3)<br />
FF = FR/AWG (4)<br />
AWG: <strong>The</strong> average weight ga<strong>in</strong> is as low as about 1.00 for small fish <strong>and</strong> the biggest<br />
weight ga<strong>in</strong> is 2.71 for the largest fish. Accord<strong>in</strong>g to Austreng et al. (1987), the<br />
growth rate of young ra<strong>in</strong>bow trout <strong>in</strong> fresh <strong>water</strong> is 2.3 -2.7 when <strong>water</strong> temperature<br />
is 10 - 12°C. <strong>The</strong> growth rate of big fish is very close to the higher level. This means<br />
the condition of this experiment was similar to normal practice of fish farm<strong>in</strong>g, <strong>and</strong><br />
the fish <strong>in</strong> this group adapted to the experimental environment faster than small fish.<br />
<strong>The</strong> ma<strong>in</strong> reason that bigger difference of the growth rate of fish of 70 -90g is<br />
because the fish size <strong>in</strong> these <strong>tanks</strong> was not very even.<br />
FR & FF: <strong>The</strong> scientific method by which FR is calculated is based on the<br />
requirement for energy (Young <strong>and</strong> Bureau 1998). Most of methods commonly used<br />
have been based on the body length <strong>in</strong>crease or live weight ga<strong>in</strong> but also based on<br />
experience. For this experiment feed<strong>in</strong>g amount was based on predicted weight ga<strong>in</strong><br />
<strong>and</strong> calculated as formula (1). An optimal FR should make FF equal about 0,85. That<br />
means all feed has been consumed by fish. Unfortunately the feed<strong>in</strong>g factor (FF) <strong>in</strong><br />
this experiment was higher than the values provided by most references. <strong>The</strong> reason<br />
UNU-Fisheries Tra<strong>in</strong><strong>in</strong>g Programme 11
Gao Guangzhi<br />
is that feed amount was not decreased when left over feed <strong>in</strong>creased because fish was<br />
supposed to grow as fast as possible.<br />
3.1.2 Growth curve for each group<br />
<strong>The</strong> fish was weighed four times dur<strong>in</strong>g the experiment <strong>and</strong> the average weight of<br />
each group were obta<strong>in</strong>ed from this operation (Table 5).<br />
Table 5: Average weight of fish.<br />
Day<br />
Group (g)<br />
30-50 30-50 70-90 70-90 90-110 90-110 >110 >110<br />
1st 42 43 96 81 81 78 123 129<br />
12th 59 59 89 99 107 110 161 160<br />
26th 71 72 127 120 129 133 181 179<br />
39th 81 85 141 136 152 147 229 226<br />
<strong>The</strong> growth rate of each group <strong>in</strong> the first period was higher than that of the later<br />
periods. Many factors <strong>in</strong>fluence the growth of fish: diet, size, photoperiod <strong>and</strong><br />
temperature. <strong>The</strong> most important reason for the fast growth <strong>in</strong> the first period is the<br />
fact that fish were starv<strong>in</strong>g for several days prior to the start of the experiment <strong>and</strong><br />
food consumption was therefore much greater than usual. It can be expla<strong>in</strong>ed us<strong>in</strong>g a<br />
simple growth model (From J <strong>and</strong> Rasmussen 1984):<br />
Growth = In - Out (5)<br />
Intake was greater than output <strong>in</strong> the first period so growth was fast. After this period<br />
the <strong>in</strong>crease of weight was more or less l<strong>in</strong>ear. <strong>The</strong> growth rate slowed when the fish<br />
had adapted to the new environment. Another reason of slower growth <strong>in</strong> the second<br />
period is because temperature genearlly decreased. Water temperature is important<br />
factor for determ<strong>in</strong><strong>in</strong>g how much food fish will eat (Edwards 1978). <strong>The</strong> average<br />
<strong>water</strong> temperature <strong>in</strong> the whole run of the experiment is given <strong>in</strong> Figure 4. Water<br />
temperature fluctuated between 10 <strong>and</strong> 12°C <strong>in</strong> the whole experiment but a general<br />
decrease is seen. It was seen that food left over <strong>in</strong> the second period was much more<br />
than that of the first period <strong>and</strong> this means food consumption of fish had decreased.<br />
<strong>The</strong> third reason is decreased oxygen saturation with time, see 3.3.1.<br />
UNU-Fisheries Tra<strong>in</strong><strong>in</strong>g Programme 12
Gao Guangzhi<br />
(°C)<br />
12,0<br />
11,8<br />
11,6<br />
11,4<br />
11,2<br />
11,0<br />
10,8<br />
10,6<br />
10,4<br />
10,2<br />
10,0<br />
0 5 10 15 20 25 30 35 40<br />
Day<br />
Figure 4: Average temperature dur<strong>in</strong>g the experiment.<br />
3.1.3 Growth curve for all fish<br />
3,0<br />
2,5<br />
AWG, g fish -1 d -1<br />
2,0<br />
1,5<br />
1,0<br />
y = 0,0153x<br />
r 2 = 0,9455<br />
0,5<br />
0,0<br />
0 20 40 60 80 100 120 140 160 180 200<br />
AW, g<br />
Figure 5: Correlation of the relationship between average weight <strong>and</strong> average weight<br />
ga<strong>in</strong>.<br />
<strong>The</strong> average weight of each group dur<strong>in</strong>g the experiment was calculated (Table 5).<br />
<strong>The</strong> result of regression analysis for AW <strong>and</strong> AWG is shown <strong>in</strong> Figure 5.<br />
<strong>The</strong> average weight ga<strong>in</strong> equation for all the groups is:<br />
AWG = 0,0153 AW, r 2 =0,94, n=8 (6)<br />
S<strong>in</strong>ce AWG is the weight ga<strong>in</strong> of each fish dur<strong>in</strong>g the experiment:<br />
UNU-Fisheries Tra<strong>in</strong><strong>in</strong>g Programme 13
Gao Guangzhi<br />
AWG = dAW/dt = 0,0153 AW<br />
d(AW)/ (AW) = 0,0153 dt<br />
<strong>The</strong> result of <strong>in</strong>tegration of this equation for weight 40 g at time 0 is as follows:<br />
AW = 40 e 0,0153t (7)<br />
One might have expected the relationship between the weight ga<strong>in</strong> <strong>and</strong> weight to be<br />
l<strong>in</strong>ear on a log-log scale. <strong>The</strong> reason for AWG to be l<strong>in</strong>ear with respect to weight <strong>in</strong><br />
this experiment is probably the short time length of the experiment <strong>and</strong> limited fish<br />
sizes. Besides, the growth did not occur under normal conditions especially regard<strong>in</strong>g<br />
oxygen saturation <strong>and</strong> <strong>in</strong>creased density of the fish <strong>in</strong> <strong>tanks</strong>.<br />
Correspond<strong>in</strong>g to this equation the growth curve for all the fish sizes is obta<strong>in</strong>ed<br />
(Figure 6). It is known from the growth curve that it will take 118 days for the fish<br />
grow from 40g to 227g, i.e. the smallest average fish <strong>in</strong> this experiment <strong>and</strong> the<br />
largest.<br />
300<br />
250<br />
200<br />
Weight, g<br />
150<br />
100<br />
50<br />
0<br />
0 20 40 60 80 100 120 140<br />
Time, d<br />
Figure 6: Growth curve of fish <strong>in</strong> the experiment.<br />
3.2 Correlation analysis, estimation of parameters<br />
3.2.1 COD & fish size<br />
Ten fishes were selected r<strong>and</strong>omly <strong>in</strong> each of the eight <strong>tanks</strong> <strong>and</strong> killed. <strong>The</strong> results of<br />
chemical analysis are given <strong>in</strong> Appendix 2. In order to decrease the variability, the<br />
average value of COD for each size class was applied <strong>in</strong> calculations. <strong>The</strong> correlation<br />
between COD <strong>and</strong> fish size is given <strong>in</strong> Figure 7.<br />
UNU-Fisheries Tra<strong>in</strong><strong>in</strong>g Programme 14
Gao Guangzhi<br />
LN (COD) mg O2/g<br />
6,43<br />
6,41<br />
6,39<br />
6,37<br />
y = 0,0472x + 6,151<br />
R 2 = 0,9701<br />
6,35<br />
4,00 4,50 5,00 5,50 6,00<br />
LN( AW ) g<br />
Figure 7: Correlation of COD <strong>and</strong> fish size.<br />
A correlation of fish size <strong>and</strong> COD is shown <strong>in</strong> figure 7 <strong>and</strong> given by the expression:<br />
with a = 6.15 <strong>and</strong> b = e 0.0507 ,<br />
COD (mg O 2 /g ) = a *(AW) b (8)<br />
COD (mg O 2 /g ) = 469 * (AW) 0.0472 (9)<br />
<strong>The</strong> result of regression analysis shows that COD <strong>in</strong>creased slightly with fish size.<br />
This result is more or less <strong>in</strong> l<strong>in</strong>e with compositions of ra<strong>in</strong>bow trout <strong>in</strong> the literature.<br />
<strong>The</strong> relation between carbon content of whole ra<strong>in</strong>bow trout <strong>and</strong> weight was given by<br />
Hall et al. 1990):<br />
(%C) = 0.55 * 17.4 * W 0.099 (10)<br />
COD (mg/g) * 0.375 = C (mg/g) (11)<br />
It is clear that COD <strong>in</strong>creases with the weight of the fish.<br />
3.3 TN, TP <strong>and</strong> fish size<br />
<strong>The</strong> results of regression analysis for TP <strong>and</strong> the average weight of fish have shown<br />
that the slope of the curve is small. This <strong>in</strong>dicates there is a slight trend that the total<br />
nitrogen <strong>in</strong> fish flesh decreases with fish size. <strong>The</strong> same result is obta<strong>in</strong>ed from the<br />
regression analysis for TP <strong>and</strong> fish size. <strong>The</strong> fish consist of <strong>water</strong>, prote<strong>in</strong>, fat, ash <strong>and</strong><br />
carbohydrate. Often carbohydrate <strong>in</strong> fish is excluded from bioenergistics as it is stated<br />
to constitute a relatively small part of the fish body (From J. <strong>and</strong> Rasmussen 1984).<br />
<strong>The</strong> amount of prote<strong>in</strong> was calculated from the amount of nitrogen <strong>in</strong> the samples.<br />
<strong>The</strong> amount of ash is reflected by the amount of TP. <strong>The</strong> total energy content of fish<br />
can be determ<strong>in</strong>ed by us<strong>in</strong>g energy content of prote<strong>in</strong> <strong>and</strong> fat. S<strong>in</strong>ce nitrogen is<br />
slightly decreas<strong>in</strong>g with size but carbon content is <strong>in</strong>creas<strong>in</strong>g fat content of fish must<br />
have <strong>in</strong>creased dur<strong>in</strong>g the experiment.<br />
UNU-Fisheries Tra<strong>in</strong><strong>in</strong>g Programme 15
Gao Guangzhi<br />
3.3.1 DO consumption <strong>and</strong> fish size<br />
If<br />
∆O 2 = consumption of DO, mg O 2 /fish<br />
then ∆O 2 = [O 2 (<strong>in</strong> <strong>in</strong>flow <strong>water</strong>) - O 2 (<strong>in</strong> outflow <strong>water</strong>)] *Q*24/n (12)<br />
Where Q is <strong>water</strong> flow (l hr -1 ) <strong>and</strong> n is the number of fish.<br />
DO of <strong>in</strong>flow <strong>and</strong> outflow is obta<strong>in</strong>ed by the average value of the surface <strong>and</strong> bottom<br />
<strong>water</strong> <strong>in</strong> the <strong>tanks</strong>. ∆O 2 of each group was calculated accord<strong>in</strong>g to formula 12. <strong>The</strong><br />
relationship between ∆O 2 <strong>and</strong> fish size is shown <strong>in</strong> Figure 8.<br />
7,5<br />
Ln (DO consumption)<br />
(mg/fish/day)<br />
7,0<br />
6,5<br />
6,0<br />
5,5<br />
y = 0,9907x + 1,5632<br />
5,0<br />
R 2 = 0,9143<br />
4,5<br />
Ln (AW) (g)<br />
4,0<br />
4,00 5,00 6,00<br />
Figure 8: Correlation between DO consumption <strong>and</strong> fish size.<br />
<strong>The</strong> relation between the amount of oxygen consumption of each fish <strong>and</strong> fish size<br />
can be expressed with the follow<strong>in</strong>g equation where the consumption of oxygen per<br />
fish is Oc:<br />
ln(Oc) = 1.5632 + 0.9907 ln (AW)<br />
Oc (mg fish -1 day -1 ) = e 1.5632 * (AW) 0.9907<br />
Oc (mg fish -1 day -1 ) = 4.7741 * (AW) 0.9907 (14)<br />
Water flow should have been <strong>in</strong>creased with the growth of fish <strong>and</strong> the saturation kept<br />
>95%. However, <strong>in</strong> this experiment <strong>water</strong> flow was kept the same from beg<strong>in</strong>n<strong>in</strong>g to<br />
the end. <strong>The</strong> air saturation was calculated for DO measurements <strong>and</strong> the results are<br />
shown <strong>in</strong> Figure 9.<br />
UNU-Fisheries Tra<strong>in</strong><strong>in</strong>g Programme 16
Gao Guangzhi<br />
70%<br />
60%<br />
60%<br />
50%<br />
% air saturation<br />
50%<br />
40%<br />
30%<br />
20%<br />
30-50g<br />
%air saturation<br />
40%<br />
30%<br />
20%<br />
70-90g<br />
10%<br />
10%<br />
0%<br />
Day<br />
60%<br />
20 25 30 35 40<br />
0%<br />
Day<br />
20 25 30 35 40<br />
70%<br />
%air satiration<br />
50%<br />
40%<br />
30%<br />
20%<br />
10%<br />
0%<br />
90-110g<br />
Day<br />
20 25 30 35 40<br />
Figure 9: Average air saturation the last 15 days.<br />
% air saturation<br />
60%<br />
50%<br />
40%<br />
30%<br />
20%<br />
10%<br />
0%<br />
>110g<br />
Day<br />
20 25 30 35 40<br />
<strong>The</strong> air saturation was lower than 60% after day 23 for all groups but 30-50g. <strong>The</strong><br />
level of air saturation was lower than the optimal value. It has been shown that<br />
limit<strong>in</strong>g DO levels appeared to be around 70% air saturation for the Channel catfish<br />
(Ictalurus punctatus). It has also been <strong>in</strong>dicted that similar results have been obta<strong>in</strong>ed<br />
with ra<strong>in</strong>bow trout when the DO fell below 60% air saturation. <strong>The</strong> reason of air<br />
saturation decreas<strong>in</strong>g was due to the <strong>in</strong>crease of the density of the fish. Not keep<strong>in</strong>g<br />
the same density dur<strong>in</strong>g the experiment is a failure of the study <strong>and</strong> the lower air<br />
saturation resulted <strong>in</strong> a higher feed<strong>in</strong>g factor. <strong>The</strong> reason that the growth rate<br />
decreased from second phase was decreas<strong>in</strong>g air saturation. <strong>The</strong> ideal value for FF is<br />
close to one <strong>and</strong> this is always the aim <strong>in</strong> <strong>aquaculture</strong>.<br />
UNU-Fisheries Tra<strong>in</strong><strong>in</strong>g Programme 17
Gao Guangzhi<br />
3.3.2 FR equation<br />
<strong>The</strong> regression result for AW <strong>and</strong> FR (Table 3) is given <strong>in</strong> figure 10.<br />
FR(g/fish/day)<br />
1,60<br />
1,40<br />
1,20<br />
1,00<br />
0,80<br />
y = 0,7935x - 2,6083<br />
0,60<br />
R 2 = 0,9945<br />
0,40<br />
0,20<br />
0,00<br />
4,00 5,00<br />
Size (g)<br />
Figure 10: Correlation of log- log regression relationship between FR <strong>and</strong> fish size.<br />
It is shown <strong>in</strong> figure 10 that the follow<strong>in</strong>g equation fits the data:<br />
ln (FR) = 0.7935ln (AW) - 2.6083<br />
FR = e -2.6083 *(AW) 0.7935<br />
FR = a * (AW) b (15)<br />
FR = dF/dt = e -2.6083 * (AW) 0.7935<br />
TF = e -2.6083 ∫ t 0 (AW) 0.7935 dt<br />
Where TF is the total feed amount that was put <strong>in</strong> dur<strong>in</strong>g the fish grow from 40g to<br />
227g.<br />
It is known from formula (7) that<br />
AW = 40 e 0,0153t , thus<br />
TF = e -2.6083 ∫ t 0 {40 e 0,0153t } 0.7935 dt<br />
TF = 113*(e 0,01214t -1) (16)<br />
UNU-Fisheries Tra<strong>in</strong><strong>in</strong>g Programme 18
Gao Guangzhi<br />
3.4 Mass <strong>balance</strong><br />
3.4.1 Nitrogen budget<br />
Approach of calculation (Figure 11):<br />
TN <strong>in</strong>put<br />
TN retention<br />
<strong>in</strong> fish body<br />
TN out<br />
Feed Faeces Dissolved (<strong>water</strong> sample)<br />
Figure 11: Approach of the calculation for TN budget.<br />
TN <strong>in</strong>put :<br />
TN <strong>in</strong>put = TF * TN feed (17)<br />
Where TN <strong>in</strong>put is the total nitrogen <strong>in</strong>put dur<strong>in</strong>g the experiment, TN feed is the TNcontent<br />
<strong>in</strong> feed (gram per gram).<br />
It is shown by formula 16:<br />
TF = 113*(e 0,01214t -1) (18)<br />
Accord<strong>in</strong>g to section 3.1.3, it should take 118 days for the fish grow from 40g to<br />
225g.<br />
t = 118 days.<br />
TN retention :<br />
TF = 118*(e 0,01214*113 -1)<br />
TF = 360g fish -1<br />
TN feed = 73.5(mg N/g) = 0.0735(g N g -1 )<br />
TN <strong>in</strong>put = 360 (g fish -1 )*0.0735 (g N fish -1 ) = 26.5(g N fish -1 )<br />
TN retention = ∫ Wt W0 C TN dW (19)<br />
For this experiment, as analysed as above, the C TN can be take as constant.<br />
TN retention = C TN ∫ Wt W0 dW = C TN (W t - W 0 )<br />
UNU-Fisheries Tra<strong>in</strong><strong>in</strong>g Programme 19
Gao Guangzhi<br />
TN retention = C TN (W t - W 0 ) = 28.3(mg g -1 )*185 = 5.24(g fish -1 )<br />
TN out<br />
TN out = TN <strong>in</strong>put - TN retention (20)<br />
TN out = 26.5 - 5.2 = 21.3 (g)<br />
This result shows that 19.6 % of TN was converted <strong>in</strong>to fish, the rest was discharged<br />
<strong>in</strong>to <strong>water</strong> dur<strong>in</strong>g growth of one fish from 40g to 225g <strong>in</strong> this experiment.<br />
Comparison of TN <strong>in</strong> <strong>and</strong> TN out for different FR:<br />
Accord<strong>in</strong>g to formula (4)<br />
FF = FR/AWG<br />
FF = TF/ TWG (21)<br />
⇒FF exp = 360 (g)/185(g) = 1.96<br />
which is the the average FF of the FFs <strong>in</strong> table 4 as expected.<br />
TN <strong>in</strong>put (FF=1)=(TF/ FF exp )* TN feed = 360/1.96*0.0735 (g N g -1 ) = 13.5 g N<br />
(TN <strong>in</strong>put ) dec % = (26.5 - 13.5)/26.5 *100 = 49%<br />
TN output = 13.5 - 5.2 = 8.3 g<br />
(TN output ) dec % = (13.5 - 5.2)/13.5 *100 = 76%<br />
<strong>The</strong> results are shown <strong>in</strong> Table 6 <strong>and</strong> Figure 12.<br />
TN g /fish<br />
40<br />
35<br />
30<br />
25<br />
20<br />
15<br />
10<br />
5<br />
0<br />
ITN RE out<br />
FR=1,00<br />
FR=1,96<br />
Figure 12: Nitrogen <strong>balance</strong> budget.<br />
UNU-Fisheries Tra<strong>in</strong><strong>in</strong>g Programme 20
Gao Guangzhi<br />
Table 6: TN <strong>in</strong> <strong>and</strong> TN out of different FR.<br />
TN g FR = 1.96 FR = 1.00 % TN decreased<br />
TN <strong>in</strong>put 26.5 13.5 49<br />
TN output 13.5 8.3 76<br />
This means TN output depends on FR. If FR can be reduced from 1.96 to 1, TN output<br />
would decrease by 76%.<br />
3.4.2 Phosphorus budget<br />
TP <strong>in</strong>put :<br />
TP <strong>in</strong>put = TF * TP feed (22)<br />
Where TP <strong>in</strong>put is the total nitrogen of <strong>in</strong>put dur<strong>in</strong>g the experiment, TP feed is the TN <strong>in</strong><br />
feed of per gram.<br />
It is known from formula 16:<br />
TF = 113*(e 0,01214t -1) (23)<br />
Accord<strong>in</strong>g to section 3.1.3, it should take 118 days for the fish grow from 40g to<br />
225g.<br />
t = 118 days.<br />
TF = 113*(e 0,01214t -1)<br />
TP retention :<br />
TF = 360g fish -1<br />
TP feed = 12.37 (mg P/g) = 0.0124(g P g -1 )<br />
TP <strong>in</strong>put = 360 (g fish -1 )*0.0124 (g P g -1 ) = 4.46(g P fish -1 )<br />
TP retantion = ∫ Wt W0 C TP dW (25)<br />
For this experiment, C TN can be take as constant, thus<br />
TP retention = C TP ∫ Wt W0 dW = C TP (W t - W 0 )<br />
TP retention = C TP (W t - W 0 ) = 4.57(mg g -1 )*185 = 0.85(g fish -1 )<br />
TP out :<br />
TP output = TP <strong>in</strong>put - TP retention<br />
TP output = 4.46 - 0.85. = 3.61g P<br />
UNU-Fisheries Tra<strong>in</strong><strong>in</strong>g Programme 21
Gao Guangzhi<br />
Comparison of TP <strong>in</strong>put <strong>and</strong> TP output for different FR:<br />
<strong>The</strong> approach of calculation is same with that of TN. <strong>The</strong> results are shown <strong>in</strong> Table 7<br />
<strong>and</strong> Figure 13.<br />
Table 7: TP <strong>in</strong>put <strong>and</strong> TP output of different FR.<br />
TP g FR = 1.96 FR = 1.00 % TP<br />
decreased<br />
TP <strong>in</strong>put 4.46 2.28 49<br />
TP output 3.61 1.43 60<br />
This means TP of output depends on the FR. If FR could be decreased from 1.96 to 1,<br />
TP output could be decreased 60%.<br />
TP g /fish<br />
7<br />
6<br />
5<br />
4<br />
3<br />
2<br />
1<br />
0<br />
ITP RE OUT<br />
FR=1,00<br />
FR=1,96<br />
Figure 13: Phosphorus <strong>balance</strong> budget.<br />
3.4.3 Energy budget<br />
Approach of calculation:<br />
E out = E <strong>in</strong> - (ME + RE) (26)<br />
ME<br />
RE<br />
Energy for respiration<br />
Energy retention<br />
Consumption of oxygen when the fish grows from 40 to 225g:<br />
<strong>The</strong> relation between the amount of oxygen consumption <strong>and</strong> fish size is expressed by<br />
formulae (13) <strong>and</strong> (14):<br />
Oc (mg fish -1 day -1 ) = a * (AW) b<br />
UNU-Fisheries Tra<strong>in</strong><strong>in</strong>g Programme 22
Gao Guangzhi<br />
Oc (mg O 2 fish -1 day -1 ) = 4.7741 * (AW) 0.9907<br />
This formula can be expressed as follows:<br />
dOc/dt = a * (AW) b (27)<br />
This is the relation between oxygen consumption <strong>and</strong> growth of fish. <strong>The</strong> total amount<br />
of oxygen consumed dur<strong>in</strong>g the fish growth from 40 to 225g can be expressed as<br />
follows:<br />
From formula (6):<br />
Oc (mg fish -1 day -1 ) = a ∫ t2 t1 (AW) b dt = a ∫ 118 0 (AW) b dt<br />
AW = 40 e 0,0153t<br />
Oc (mg fish -1 day -1 ) = 4,7741 ∫ 118 0 (40 e 0,0153t ) 0,9907 dt<br />
=184,5 ∫ 118 0 e 0,01515t dt<br />
Oc = 295.14 (mg fish -1 )<br />
Energy required when each fish grew from 40 to 225g for respiration (ME):<br />
<strong>The</strong> coefficient used to convert the oxygen consumption to energy is as follows (From<br />
<strong>and</strong> Rasmussen 1984):<br />
1 mg (oxygen) = 3.42 cal<br />
ME = 295.14 * 3.42 = 1009 cal<br />
This amount of energy was used for respiration of fish.<br />
Energy required when each fish grew from 40 to 225g for retention (RE):<br />
Accord<strong>in</strong>g to formula (8) for energy content of fish: COD (mg O 2 /g ) = 469 * (AW) 0.0472<br />
thus d(RE)=3,42*COD * d(AW) <strong>and</strong><br />
RE = 3.42* ∫ Wt W0 469 * (AW) 0.0472 d(AW) (29)<br />
With W t = 225 <strong>and</strong> W 0 = 40<br />
RE = 3.42*469*1/(0.0472+1) [ (225) 0.0472+1 - (40) 0.0472+1 ]<br />
RE = 372095cal ≅ 372 kcal<br />
Energy content <strong>in</strong> feed( E <strong>in</strong> ):<br />
UNU-Fisheries Tra<strong>in</strong><strong>in</strong>g Programme 23
Gao Guangzhi<br />
E <strong>in</strong> (cal) = 3.42 (cal mg -1 )*COD feed (mg g -1 ) * 360 g (31)<br />
s<strong>in</strong>ce the total amount of feed used <strong>in</strong> this experiment for one fish grow<strong>in</strong>g from 40 to<br />
225g was 360g. <strong>The</strong>refore,<br />
E <strong>in</strong> = 3.42*1320*360 =1625184 cal ≅ 1625 kcal<br />
Energy amount discharged dur<strong>in</strong>g fish growth from 40 to 225g (E out ):<br />
E out = E <strong>in</strong> - (ME + RE)<br />
E out = 1625184 - (372095 + 1009) = 1252080 cal ≅ 1252 kcal<br />
Comparison of E <strong>in</strong> <strong>and</strong> E out for different FR (Table 8 <strong>and</strong> Figure 14):<br />
Table 8: E <strong>in</strong> <strong>and</strong> E out of different FR.<br />
Energy(cal) FR = 1.96 FR = 1.00 % energy<br />
decreased<br />
E <strong>in</strong> 1625184 829176 49<br />
E out 1251080 456072 64<br />
1800<br />
1600<br />
1400<br />
1200<br />
1000<br />
800<br />
600<br />
400<br />
200<br />
0<br />
1 2 3 4<br />
Series1<br />
Series2<br />
Figure 14: Energy <strong>balance</strong> budget.<br />
UNU-Fisheries Tra<strong>in</strong><strong>in</strong>g Programme 24
Gao Guangzhi<br />
3.4.4 Physical forms of the waste<br />
TN <strong>and</strong> TP level <strong>in</strong> <strong>water</strong><br />
Accord<strong>in</strong>g to the results of chemical analysis the follow<strong>in</strong>g averages are given (Table<br />
9).<br />
Table 9: TN <strong>and</strong> TP level <strong>in</strong> <strong>water</strong>.<br />
Date TN(µg L -1 ) TP(µg L -1 )<br />
21/12 (01) 1019 ± 152 198±40<br />
03/01(02) 1076 ± 236 177±49<br />
13/01(02) 1185 ± 134 181±20<br />
General average (GAN) 1083 ± 187 185±38<br />
Inflow <strong>water</strong> 264 20<br />
It is clear that there is not a significant difference of TN <strong>and</strong> TP content <strong>in</strong> <strong>water</strong><br />
between the <strong>tanks</strong>. <strong>The</strong> reason is the high feed<strong>in</strong>g ration. Much left over feed<br />
dissolved <strong>in</strong> <strong>water</strong> <strong>and</strong> reached saturation <strong>in</strong> the <strong>water</strong>. <strong>The</strong> effect of TN <strong>and</strong> TP<br />
related to growth rate was hidden by the high feed<strong>in</strong>g ration <strong>and</strong> this resulted <strong>in</strong> the<br />
little change of TN <strong>and</strong> TP between the <strong>tanks</strong>.<br />
Contribution of dissolved TN <strong>and</strong> TP to total waste<br />
As mentioned above, there is no possibility for estimat<strong>in</strong>g the contribution of<br />
dissolved TN <strong>and</strong> TP related to growth rate to total waste through this study. What<br />
may be done to illustrate the amounts of dissolved nutrients <strong>in</strong> this experiment is to<br />
relate the TN <strong>and</strong> TP levels <strong>in</strong> <strong>water</strong> to the amounts of these nutrients <strong>in</strong> the feed<strong>in</strong>g<br />
ration on the dates when <strong>water</strong> samples were taken. <strong>The</strong> average value of feed<strong>in</strong>g<br />
ration for each tank correspond<strong>in</strong>g to <strong>water</strong> sampl<strong>in</strong>g dates is calculated from the data<br />
<strong>in</strong> appendix 2 (Table 10).<br />
Contribution of dissolved TN <strong>and</strong> TP to total waste is calculated as follows:<br />
If the ratio is η:<br />
η (%) = TN w / TN <strong>in</strong>put (32)<br />
TN w = C w(TN) *Q*24*10 -6 (g d -1 )<br />
where Q is <strong>water</strong> flow (l hr -6 ), C w(TN) is the concentration of dissolved TN <strong>in</strong> <strong>water</strong> (µg<br />
L -1 ),<br />
UNU-Fisheries Tra<strong>in</strong><strong>in</strong>g Programme 25
Gao Guangzhi<br />
Table 10: Average feed<strong>in</strong>g ration (g d -1 ) on the sampl<strong>in</strong>g dates for <strong>water</strong>.<br />
Tank<br />
Feed<strong>in</strong>g ration Feed<strong>in</strong>g ration Feed<strong>in</strong>g ration<br />
(21/12/2001) (03/01/2002) (13/01/2002)<br />
2 390±54 350±66 445±84<br />
3 390±54 349±66 443±84<br />
4 410±54 400±66 498±84<br />
5 409±54 403±66 501±84<br />
6 428±54 361±66 442±84<br />
7 436±54 362±66 448±84<br />
8 299±54 236±66 288±84<br />
9 300±54 237±66 290±84<br />
General average 383±54 337±66 419±84<br />
Gr<strong>and</strong> average 380<br />
C w(TN) = TN(outflow<strong>in</strong>g <strong>water</strong>) – TN(<strong>in</strong>flow<strong>in</strong>g <strong>water</strong>)=1083- 264 = 819 (µg L -1 ),<br />
TN <strong>in</strong>put = C f eed(TN) * 380 (g d -1 )<br />
η (%) = 819*600*24*10 -6 /(0.0735*380)<br />
η (%) = 42%<br />
This result means that the discharge of dissolved TN is about half of the TN of the<br />
feed used.<br />
Us<strong>in</strong>g the same approach the calculation for TP is given as follows:<br />
η (%) = TP w / TP <strong>in</strong>put ( 33 )<br />
TP w = C w(TP) *Q*24*10 -6 (g d -1 )<br />
where Q is <strong>water</strong> flow (L hr -1 ) <strong>and</strong> C w(TP) is the concentration of dissolved TP <strong>in</strong><br />
<strong>water</strong>,<br />
C w(TP) = 185- 60 = 165 (µg L -1 ) <strong>and</strong> TP <strong>in</strong>put = C f eed(TP) * 380 (g d -1 ) <strong>and</strong> thus<br />
η (%) = 165*600*24*10 -6 /0.0124*380<br />
η (%) = 50 %<br />
This result means that contribution of dissolved TP to total waste is about half of all<br />
the phosphorus <strong>in</strong> the feed used at the sampl<strong>in</strong>g date.<br />
Comparison of different FR (Table 11)<br />
<strong>The</strong> calculation result for different feed<strong>in</strong>g ration is given <strong>in</strong> table11.<br />
UNU-Fisheries Tra<strong>in</strong><strong>in</strong>g Programme 26
Gao Guangzhi<br />
Table 11: Comparison of different FR.<br />
FR (g d -1 ) TN w / TN <strong>in</strong>put (%) TP w / TP <strong>in</strong>put (%)<br />
FR=1.96 42 50<br />
FR=1.00 21 26<br />
% decreased 50 48<br />
<strong>The</strong> results show that the decreased feed<strong>in</strong>g rate will result <strong>in</strong> a significant decrease of<br />
contribution of dissolved TN <strong>and</strong> TP to the total waste. <strong>The</strong> ratio of dissolved waste<br />
<strong>and</strong> solid waste is important when the environmental effect of waste charge from<br />
<strong>aquaculture</strong> system should be estimated. <strong>The</strong> significant difference of the<br />
environmental effect between different forms of waste has been known clearly. For<br />
this experiment the weight of leftover feed was lost by mistake <strong>and</strong> so it is impossible<br />
to estimate the ratio of different forms of the waste accurately.<br />
UNU-Fisheries Tra<strong>in</strong><strong>in</strong>g Programme 27
Gao Guangzhi<br />
4 CONCLUSION<br />
1. Growth rate is dependent on the fish size.<br />
2. Oxygen consumption <strong>in</strong>creases with the weight of fish.<br />
3. Energy content of fish <strong>in</strong>creases slightly with fish size.<br />
4. Total nitrogen <strong>and</strong> total phosphorus content of fish is near to constant for different<br />
fish size<br />
5. <strong>The</strong> decrease of feed<strong>in</strong>g ration will result <strong>in</strong> a significant decrease of waste<br />
discharge from the experimental <strong>aquaculture</strong> system.<br />
UNU-Fisheries Tra<strong>in</strong><strong>in</strong>g Programme 28
Gao Guangzhi<br />
ACKNOWLEDGEMENTS<br />
<strong>The</strong> author would like to thank the supervisor of this project, Mr. Gudjon Atli<br />
Audunsson, he has given a scientific <strong>and</strong> practical direction for the project; the<br />
director of UNU - FTP, Mr. Tumi To<strong>mass</strong>on; the vice director, Mr. Thor Asgeirsson;<br />
Ms. Þuriður Petursdottir, she has provided convenient condition for the field tests; the<br />
staff of chemical laboratory; <strong>and</strong> all of person who have helped a lot for the<br />
completion of the project. And at last, I should thank, <strong>in</strong> particular, my husb<strong>and</strong>, Mr.<br />
Fuli Chen, he has provided much valuable <strong>in</strong>formation.<br />
UNU-Fisheries Tra<strong>in</strong><strong>in</strong>g Programme 29
Gao Guangzhi<br />
REFERENCES<br />
Anon 1970.. Council Directive 79/923/EEC of 30 October 1979. Official Journal of<br />
the European Communities L281, 47.<br />
APHA 1995. St<strong>and</strong>ard Methods for the Exam<strong>in</strong>ation of Water <strong>and</strong> Waste<strong>water</strong>. 19 th<br />
ed.<br />
Austreng, E., Storebakken, T. <strong>and</strong> Åsgård, T. 1987. Growth Rate Estimates for<br />
Cultured Atlantic Salmon <strong>and</strong> Ra<strong>in</strong>bow Trout. Aquaculture, 60:157-169.<br />
Ch<strong>in</strong>a. Mar<strong>in</strong>e Ecological Environment Protection.<br />
6. Nov. 2001. < http://www.coi.gov.cn/emanager/hyg123.htm><br />
Edwards, D.J. 1978. Salmon <strong>and</strong> Trout Farm<strong>in</strong>g <strong>in</strong> Norway. Great Brita<strong>in</strong>: Page Bros.<br />
Ltd<br />
Emerson, C. 1999. Aquaculture Impacts on the Environment. [28/10/01]<br />
<br />
FAO 2000. <strong>The</strong> State of World Fisheries <strong>and</strong> Aquaculture. Rome: Food <strong>and</strong><br />
Agriculture Organization of the <strong>United</strong> Nations .<br />
FAO 2001. World fisheries <strong>and</strong> <strong>aquaculture</strong> atlas. CD-ROM. Rome: Food <strong>and</strong><br />
Agriculture Organization of the <strong>United</strong> Nations (FAO).<br />
From, J. <strong>and</strong> Rasmussen, J. 1984. A growth model, gastric evacuation, <strong>and</strong> body<br />
composition <strong>in</strong> ra<strong>in</strong>bow trout, Salmo gairdneri Richardson, 1836,.<br />
Goldburg, R. 1997. Environmental Effects of Aquaculture <strong>in</strong> the <strong>United</strong> States. <strong>The</strong><br />
Environmental Defense Fund.<br />
Hach, C.C., Bowden, B.K., Kopelove, A.B. <strong>and</strong> Brayton, S.V. 1987. More Powerful<br />
Peroxide Kjeldahl Digestion Method. J. Assoc. of Anal. Chem. 70:783-787.<br />
Hall, P.O.J., Anderson, L.G., Holby, O., Kollberg, S. <strong>and</strong> Samuelsson, M.O. 1990.<br />
Chemical fluxes <strong>and</strong> <strong>mass</strong> <strong>balance</strong>s <strong>in</strong> amar<strong>in</strong>e fish cage farm. Mar<strong>in</strong>e Ecol. Prog.<br />
Ser., 61:61 -73.<br />
Hansen, H.P. 1999. Determ<strong>in</strong>ation of oxygen, In Methods of Sea<strong>water</strong> Analysis, K.<br />
Grasshoff, K. Kreml<strong>in</strong>g <strong>and</strong> M. Ehrhrdt eds. 3 rd ed. We<strong>in</strong>heim: Wiley-VCH.<br />
NOAA Central Library U.S. Department of Commerce. Ch<strong>in</strong>a Fishery Statistics.<br />
[23/10/01]< http://www.lib.noaa.gov/ch<strong>in</strong>a/statistics.htm><br />
Páez-Osuna F., Guerrero-Galván, S. <strong>and</strong> Ruiz-Fernández, A.C. 1998. <strong>The</strong><br />
Environmental Impact of Shrimp Aquaculture <strong>and</strong> the Coastal Pollution <strong>in</strong> Mexico.<br />
Mar<strong>in</strong>e Pollution Bullet<strong>in</strong>, 36(1):65-75.<br />
UNU-Fisheries Tra<strong>in</strong><strong>in</strong>g Programme 30
Gao Guangzhi<br />
Páez-Osuna, F., Guerrero-Galván, S. <strong>and</strong> Ruiz-Fernández, A.C. 1999. Discharge of<br />
Nutrients from Shrimp Farm<strong>in</strong>g to Coastal Waters of the Gulf of California, Mar<strong>in</strong>e<br />
Pollution Bullet<strong>in</strong>, 38(7):585-592.<br />
Paez-Osuna, F. 2001. <strong>The</strong> environmental impact of shrimp <strong>aquaculture</strong>: a global<br />
perspective, Environmental Pollution 112: 229 - 231.<br />
Pag<strong>and</strong>, P., Plancheton, J.P. <strong>and</strong> Casellas, C. 2000. A model for predict<strong>in</strong>g the<br />
quantities of dissolved <strong>in</strong>organic nitrogen released <strong>in</strong> effluents from a sea bass<br />
(Dicentrarchus Labrax) recalculat<strong>in</strong>g <strong>water</strong> system, Aquaculture Eng<strong>in</strong>eer<strong>in</strong>g<br />
22:137-153.<br />
Tovar, A., Moreno, C., Manuel-Vez, M.P. <strong>and</strong> Garcia-Vargas, M. 2000.<br />
Environmental Impacts Of Intensive Aquculture In Mar<strong>in</strong>e Waters, Water Resources<br />
34: 334- 342.<br />
Troell, M., <strong>and</strong> J. Norberg (1998). Modell<strong>in</strong>g output <strong>and</strong> retention of suspended solids<br />
<strong>in</strong> an <strong>in</strong>tegrated salmon- mussel culture. Ecological Modell<strong>in</strong>g 110: 65-77<br />
Trott L. A. <strong>and</strong> Alongi D. M. 2000. Impact of Shrimp Pond Effluent on Water Quality<br />
<strong>and</strong> Phytoplankton Bio<strong>mass</strong> <strong>in</strong> a Tropical Mangrove Estuary. Mar<strong>in</strong>e Pollution<br />
Bullet<strong>in</strong>, 40(11):947-951.<br />
Tucker, C.S., K<strong>in</strong>gsbury, S.K., Pote, J.W. <strong>and</strong> Wax, C.L. 1996. Effects of <strong>water</strong><br />
management practices on discharge of nutrients <strong>and</strong> organic matter from channel<br />
catfish (Ictalurus punctatus) ponds, Aquaculture 147(1-2):57-69.<br />
Young C.C. <strong>and</strong> Bureau, D.P. 1998. Development of bioenergetic models <strong>and</strong> the<br />
Fish-PrFEQ software to estimate production, feed<strong>in</strong>g ration <strong>and</strong> waste output <strong>in</strong><br />
<strong>aquaculture</strong>, Aquatic Liv<strong>in</strong>g Resources 11(4):199-210.<br />
Valderrama, J.C. 1981. <strong>The</strong> Simulaneous Analysis of Total Nitrogen <strong>and</strong> Total<br />
Phosphorus <strong>in</strong> Natural Waters. Mar. Chem. 10:109-122.<br />
UNU-Fisheries Tra<strong>in</strong><strong>in</strong>g Programme 31