Quality Indicators of Northern Shrimp (Pandalus borealis)
Quality Indicators of Northern Shrimp (Pandalus borealis)
Quality Indicators of Northern Shrimp (Pandalus borealis)

You also want an ePaper? Increase the reach of your titles
YUMPU automatically turns print PDFs into web optimized ePapers that Google loves.
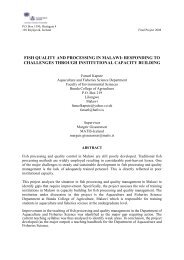
Final Project 2003<strong>Quality</strong> <strong>Indicators</strong> <strong>of</strong> <strong>Northern</strong> <strong>Shrimp</strong> (<strong>Pandalus</strong> <strong>borealis</strong>) Storedunder Different Cooling ConditionsZeng Qingzhuqingzhuzeng@yahoo.com.cnDalian Fisheries University, Heishijiao 52, DaLian, 116023, CHINASupervisors: Kristín Anna Thórarinsdóttir & Guðrún Ólafsdóttirkristin@rf.is & gudrun@rf.isIcelandic Fisheries Laboratories, ICELANDABSTRACTThe quality changes <strong>of</strong> northern shrimp, stored in ice, liquid-ice or salt-water ice at either-1.5 o C or 1.5 o C, were evaluated by using sensory assessment, chemical analysis,bacteriological test and physical methods. The main objective <strong>of</strong> this study was toidentify freshness and quality indicators <strong>of</strong> <strong>Northern</strong> shrimp (<strong>Pandalus</strong> <strong>borealis</strong>) and toevaluate the efficiency <strong>of</strong> different cooling conditions. The total volatile nitrogen (TVB-N) level in shrimp stored in liquid ice decreased during the first day <strong>of</strong> storage, and TVB-N formation was delayed at least for 3 days for shrimp in liquid ice stored at -1.5 o C. Inother shrimp stored in ice or salt-water ice, the TVB-N level increased with the time <strong>of</strong>storage. The trimethylamine (TMA) value increased gradually with storage time in allsamples, except for the one stored in liquid ice at -1.5 o C during the first day <strong>of</strong> storage.The salt content increased rapidly in shrimp stored in liquid ice at -1.5 o C and increasedslowly in other storage conditions, except for the iced shrimp where the salt contentdecreased slowly during the storage period. Water content increased gradually for allsamples during storage. Texture showed only minor changes. Total viable counts (TVC)showed that bacteria grew most quickly in shrimp stored in ice and in salt-water ice,followed by those in liquid ice at 1.5 o C and -1.5 o C, respectively, throughout the storageperiod. Liquid ice storage at -1.5 o C gave the longest shelf-life <strong>of</strong> shrimp based on sensoryanalysis. Statistical analyses, principal component analysis (PCA) and analysis <strong>of</strong>variance (ANOVA), shows good correlation between, TVB-N, TMA, TVC, pH, NH 3response <strong>of</strong> electronic nose and sensory evaluation.Keywords: <strong>Northern</strong> shrimp (<strong>Pandalus</strong> <strong>borealis</strong>); freshness; spoilage; sensory evaluation;liquid ice; superchilling; electronic nose.
QingzhuTABLE OF CONTENTSList <strong>of</strong> Tables ...................................................................................................................... 3List <strong>of</strong> Figures..................................................................................................................... 31 INTRODUCTION ...................................................................................................... 52 LITERATURE REVIEW ........................................................................................... 62.1 <strong>Quality</strong> deterioration <strong>of</strong> shrimp.................................................................................62.2 Chilling and superchilling storage <strong>of</strong> raw seafood....................................................72.3 Assessment methods <strong>of</strong> freshness and quality ..........................................................82.3.1 Sensory evaluation...................................................................................... 82.3.2 Chemical analysis ....................................................................................... 82.3.3 Microbiological methods ............................................................................ 92.3.4 Physical measurements ............................................................................... 93 MATERIAL AND METHODS................................................................................ 113.1 Raw material and experimental design ...................................................................113.2 Sensory evaluation ..................................................................................................133.3 Protein measurement...............................................................................................133.4 Salt measurement ....................................................................................................143.5 Fat measurement .....................................................................................................143.6 Water measurement.................................................................................................143.7 Water-holding capacity (WHC) measurement........................................................143.8 TVB-N and TMA measurement..............................................................................143.9 pH measurement .....................................................................................................153.10 Texture measurement..............................................................................................153.11 Electronic Nose measurement.................................................................................153.12 Bacteriological test..................................................................................................163.13 Data analysis ...........................................................................................................174 RESULTS ................................................................................................................. 184.1 Basic characteristics <strong>of</strong> the sample and temperature change during storage ..........184.2 Sensory evaluation ..................................................................................................184.3 TVB-N and TMA....................................................................................................204.4 pH measurement .....................................................................................................224.5 Water content ..........................................................................................................234.6 Salt content..............................................................................................................244.7 Water-holding capacity (WHC) ..............................................................................254.8 Texture measurement..............................................................................................264.9 Electronic nose measurement..................................................................................284.10 Bacteriological test..................................................................................................304.11 Correlation between indicators ...............................................................................304.12 PCA (principal component analysis) analysis.........................................................325 DISCUSSIONS......................................................................................................... 345.1 Sensory evaluation ..................................................................................................345.2 TVB-N and TMA change .......................................................................................345.3 Change in pH <strong>of</strong> whole shrimp ...............................................................................355.4 CO and NH 3 responses <strong>of</strong> electronic nose measurement ........................................355.5 Total viable count (TVC)........................................................................................365.6 Correlation analysis.................................................................................................375.7 PCA analysis...........................................................................................................376 CONCLUSIONS....................................................................................................... 38UNU-Fisheries Training Programme 2
QingzhuACKNOWLEDGEMENTS.............................................................................................. 40List <strong>of</strong> REFERENCES...................................................................................................... 41APPENDIX....................................................................................................................... 45LIST OF TABLESTable 1: Latent heat <strong>of</strong> fusion (∆H f ) <strong>of</strong> the different cooling agent, the minimum quantityneeded to cool the shrimp and keep it chilled (Mi total) and the quantity used for 15kg <strong>of</strong> shrimp (Mi used). ............................................................................................ 12Table 2: Experimental groups and sampling plan............................................................ 12Table 3: Score sheet for quality grading scheme <strong>of</strong> whole shrimp (IFL 2003). .............. 13Table 4: Correlation (r) <strong>of</strong> between parameters for quality assessment <strong>of</strong> shrimp.......... 31LIST OF FIGURESFigure 1: A typical texture pr<strong>of</strong>ile analysis (TPA) curve ( Malcolm 2002). ................... 11Figure 2: Texture analyzer (TA-XT2I Texture Analyzer) used to measure texture changein shrimp. .................................................................................................................. 15Figure 3: Electronic nose FreshSense used to measure quality change <strong>of</strong> shrimp. ......... 16Figure 4: The center temperature in each bin holding sample during storage. ICE/+: flackice at 1.5 o C; LIQ/+: liquid ice at 1.5 o C; S-ICE/-: salt-water + ice -1.5 o C; LIQ/-:liquid ice at -1.5 o C. ................................................................................................... 18Figure 5: Sensory scores <strong>of</strong> shrimp stored in different cooling conditions. ICE/+: flackice at 1.5 o C; LIQ/+: liquid ice at 1.5 o C; S-ICE/-: salt-water + ice -1.5 o C; LIQ/-:liquid ice at -1.5 o C. ................................................................................................... 19Figure 6: Appearance <strong>of</strong> shrimp stored in different cooling conditions on the day 6 th <strong>of</strong>storage. PIC (ICE/+): flake ice at 1.5 o C; PLD (LIQ/+): liquid ice at 1.5 o C; MSI (S-ICE/-): salt-water + ice -1.5 o C; MLD (LIQ/-): liquid ice at -1.5 o C. ......................... 20Figure 7: Total volatile basic nitrogen (TVB-N) (mgN/100g) formation <strong>of</strong> shrimp storedin different cooling conditions during 6 days storage period. ICE/+: flack ice at1.5 o C; LIQ/+: liquid ice at 1.5 o C; S-ICE/-: salt-water + ice -1.5 o C; LIQ/-: liquid iceat -1.5 o C. ................................................................................................................... 21Figure 8: Trimethylamine (TMA) (mgN/100g) formation <strong>of</strong> shrimp stored in differentcooling conditions during 6 days storage period. ICE/+: flack ice at 1.5 o C; LIQ/+:liquid ice at 1.5 o C; S-ICE/-: salt-water + ice -1.5 o C; LIQ/-: liquid ice at -1.5 o C. .... 21Figure 9: Changes <strong>of</strong> pH value <strong>of</strong> the shrimp stored in different conditions. ICE/+: flackice at 1.5 o C; LIQ/+: liquid ice at 1.5 o C; S-ICE/-: salt-water + ice -1.5 o C; LIQ/-:liquid ice at -1.5 o C. ................................................................................................... 22Figure 10: Changes <strong>of</strong> water content <strong>of</strong> shrimp stored in different conditions during thestorage period. ICE/+: flack ice at 1.5 o C; LIQ/+: liquid ice at 1.5 o C; S-ICE/-: saltwater+ ice -1.5 o C; LIQ/-: liquid ice at -1.5 o C.......................................................... 23Figure 11: Changes <strong>of</strong> salt content <strong>of</strong> shrimp stored in different conditions during thestorage period. ICE/+: flack ice at 1.5 o C; LIQ/+: liquid ice at 1.5 o C; S-ICE/-: saltwater+ ice -1.5 o C; LIQ/-: liquid ice at -1.5 o C.......................................................... 24UNU-Fisheries Training Programme 3
QingzhuFigure 12: Changes <strong>of</strong> water-holding capacity <strong>of</strong> shrimp stored in different conditionsduring the storage period. ICE/+: flack ice at 1.5 o C; LIQ/+: liquid ice at 1.5 o C; S-ICE/-: salt-water + ice -1.5 o C; LIQ/-: liquid ice at -1.5 o C........................................ 25Figure 13: Hardness (N) <strong>of</strong> shrimp stored in different conditions. ICE/+: flack ice at1.5 o C; LIQ/+: liquid ice at 1.5 o C; S-ICE/-: salt-water + ice -1.5 o C; LIQ/-: liquid iceat -1.5 o C. ................................................................................................................... 26Figure 14: Springiness (%) <strong>of</strong> shrimp stored in different conditions. ICE/+: flack ice at1.5 o C; LIQ/+: liquid ice at 1.5 o C; S-ICE/-: salt-water + ice -1.5 o C; LIQ/-: liquid iceat -1.5 o C. ................................................................................................................... 27oFigure 15: Resilience <strong>of</strong> shrimp stored in different conditions. ICE/+: flack ice at 1.5 C;ooLIQ/+: liquid ice at 1.5 C; S-ICE/-: salt-water + ice -1.5 C; LIQ/-: liquid ice at -o1.5 C. ......................................................................................................................... 27Figure 16: Cohesiveness <strong>of</strong> shrimp stored in different conditions. ICE/+: flack ice at1.5 o C; LIQ/+: liquid ice at 1.5 o C; S-ICE/-: salt-water + ice -1.5 o C; LIQ/-: liquid iceat -1.5 o C. ................................................................................................................... 28Figure 17: Responses <strong>of</strong> CO sensors to the shrimp stored in different condition. ICE/+:flack ice at 1.5 o C; LIQ/+: liquid ice at 1.5 o C; S-ICE/-: salt-water + ice -1.5 o C; LIQ/-:liquid ice at -1.5 o C. ................................................................................................... 29Figure 18: Responses <strong>of</strong> NH 3 sensors to the shrimp stored in different condition. ICE/+:flack ice at 1.5 o C; LIQ/+: liquid ice at 1.5 o C; S-ICE/-: salt-water + ice -1.5 o C; LIQ/-:liquid ice at -1.5 o C. ................................................................................................... 29Figure 19: Changes in total viable counts (TVC) in shrimp during storage. ICE/+: flackice at 1.5 o C; LIQ/+: liquid ice at 1.5 o C; S-ICE/-: salt-water + ice -1.5 o C; LIQ/-:liquid ice at -1.5 o C. ................................................................................................... 30Figure 20: Bi-plot for PCA <strong>of</strong> measured main data. Sample scores are labeled with thestorage condition and days <strong>of</strong> storage (ICE/+: flack ice at 1.5 o C; LIQ/+: liquid ice at1.5 o C; S-ICE/-: salt-water + ice -1.5 o C; LIQ/-: liquid ice at -1.5 o C). Loadings <strong>of</strong>variables include TVB-N, TMA, TVC, pH, sensory score and FreshSenSemeasurements (CO and NH 3 ).................................................................................... 32Figure 21: Bi-plot for PCA <strong>of</strong> all the measured data. Sample scores are labeled with thestorage condition and days <strong>of</strong> storage (ICE/+: flack ice at 1.5 o C; LIQ/+: liquid ice at1.5 o C; S-ICE/-: salt-water + ice -1.5 o C; LIQ/-: liquid ice at -1.5 o C). Loadings <strong>of</strong>variables include TVB-N, TMA, TVC, pH, water, salt, texture (hardness, springiness,resilience, cohesiveness), sensory score and FreshSense measurements (CO andNH 3 ). ......................................................................................................................... 33UNU-Fisheries Training Programme 4
Qingzhu1 INTRODUCTIONThe northern shrimp (<strong>Pandalus</strong> <strong>borealis</strong>) is primarily harvested in Newfoundland andLabrador and it is estimated that 20,000 tons were landed in 2001 (Project summary,2002). Iceland is a major producer <strong>of</strong> cold water shrimp (<strong>Pandalus</strong> <strong>borealis</strong>). From 1989to 1997 the annual catch <strong>of</strong> this species increased from 27,000 to over 80,000 tons. Most<strong>of</strong> the shrimp is iced on board the vessels and processed in factories around the countrywithin 5-7 days from the time <strong>of</strong> catch (Valdimarsson et al., 1998).<strong>Shrimp</strong> is a perishable product. Its shelf life and wholesomeness during refrigeratedstorage and shipping is greatly influenced by both enzymatic and microbiologicalchanges. Shellfish spoil more rapidly than fish for a number <strong>of</strong> reasons. Firstly, they aresmaller, and small fish spoil more rapidly than larger ones. Secondly and moreimportantly, the gut is usually not removed immediately after capture, hence postmortemautolytic changes will occur faster. A third reason is that the chemical composition <strong>of</strong>shellfish tissue is different and it contains a lot <strong>of</strong> non-protein nitrogenous compoundsthat encourage more rapid spoilage (Aitken et al. 1982, Shamshad et al. 1990). Blackspot, or melanosis, a discoloration indicative <strong>of</strong> spoilage always occurs in shrimp (Jeonget al 1991). Therefore, it is important for the shrimp processing industry to develop astorage method to maintain high quality and freshness <strong>of</strong> shrimp.Fish and shellfish are highly perishable and the quality deterioration <strong>of</strong> raw seafood isusually dominated by microbial activity. This deterioration is highly temperaturedependent and can be reduced by low storage temperature. Raw seafood deterioration hastwo forms: microbiological and non-microbiological. Non-microbial deteriorations, bothenzymatic and non enzymatic also contribute to the spoilage changes. Micro-organismsare present on the external surfaces and in the gut and head <strong>of</strong> shrimp. Upon death, themicro-organisms or the enzymes they secrete are free to invade or diffuse into the fleshwhere they react with the complex mixture <strong>of</strong> natural substances present (Lee andUm1995).Due to the perishability <strong>of</strong> such a product, freezing is <strong>of</strong>ten used in fisheries industry andfrozen products are most common in many processing companies. However, deterioration<strong>of</strong> texture and flavour is a frequent problem for frozen products. Fresh seafood productsstored in ice, including fresh shrimp, has always been the consumer’s primary choice.Preservation methods for fresh shrimp have been applied to extend shelf- life and toavoid health hazards. Such methods include chilled storage in ice (Shamshad et al. 1990,Rogério et al 2001, Lakshmanan et al. 2002), in liquid ice (Huidobro et al 2002),modified ice storage (Jiang and Lee 1988), superchilled storage at 0 o C ~ -4 o C (Aleman etal. 1982, Fatima et al. 1988), modified atmospheres packaging storage in ice (Baka et al.1999; Lopez-Caballero et al.2002), gamma radiation (Yeh and Hau 1988), and treatmentwith organic acids and their salts (Benner et al. 1994, Mosffer 1999). Liquid ice hasrecently been introduced as a successful method for the rapid chilling <strong>of</strong> seafood productsand a way <strong>of</strong> reducing the temperature <strong>of</strong> products below those attained with traditionalice. Traditional iced storage presents some undesirable attributes, e.g. injury and bruising<strong>of</strong> the products (Huidobro et al. 2002).UNU-Fisheries Training Programme 5
QingzhuThe evaluation <strong>of</strong> quality and shelf-life <strong>of</strong> seafood is based on sensory, chemical andmicrobiological tests. Chemical test, for example tritmethylamine (TMA), total volatilenitrogen (TVB-N), K value and acid-TBA, etc. are commonly employed (Botta 1995,Jackson et al. 1997, Nielsen 1997). However, chemical methods and some physicalmethods need laboratory facilities and trained staff. Moreover, these methods aredestructive, i.e. seafood once examined cannot then be sold.There is little information on the quality deterioration <strong>of</strong> the shrimp stored in liquid-ice orsalt-water ice at subzero temperatures, which is one <strong>of</strong> the most efficient ways <strong>of</strong> chillingstorage. A comprehensive study is needed to identify freshness and quality indicators <strong>of</strong>shrimp stored at zero and subzero iced, liquid-iced and in salt-water iced storage. For thisreason, quality change and shelf-life <strong>of</strong> shrimp stored under different cooling conditionsusing ice, liquid-ice or salt-water ice was investigated by sensory, chemical,microbiological, physical methods. It is necessary to find out a method that is practicaland accurate for evaluating the freshness and quality changes <strong>of</strong> shrimp.2 LITERATURE REVIEW2.1 <strong>Quality</strong> deterioration <strong>of</strong> shrimpMost important factors in raw seafood are freshness and quality. Upon death, there arepronounced changes in the appearance, texture, chemistry, and redox potential <strong>of</strong> themuscle. In postmortem muscle, the conversion <strong>of</strong> ATP to ADP, ADP to AMP, and AMPto IMP usually takes place within 24 h or less. These changes are thought to be totallyautolytic since, in most instances, insufficient time has elapsed to allow the proliferation<strong>of</strong> spoilage microorganisms. Several factors can affect the rate <strong>of</strong> IMP accumulation,including temperature, species, and handling. The initial loss <strong>of</strong> the attributescharacterising freshness in seafood results primarily from catabolic changes innucleotides and carbohydrates, which are rapidly followed by degradative reactions <strong>of</strong>nitrogenous compounds as well as hydrolysis and peroxidation <strong>of</strong> lipids. These reactionsare catalyzed mainly by endogenous enzymes during further chilling <strong>of</strong> the catch andbacterial activity contributes to the quality deterioration (Norman and Benjamin 2000).It has been known for many years that both bacterial and enzymatic changes areresponsible for fish spoilage. Uchiyama and Ehira (1974) reported that for cod andyellowtail tuna, enzymatic changes related to fish freshness preceded and were unrelatedto changes influenced by microbial activity. In shellfish, the freshness deterioration isadditionally related to enzymatic discolorations known as blackspot (Jeong et al. 1991).After catch, the enzyme, especially polyphenoloxidase (PPO), is responsible for theformation <strong>of</strong> melanins causing darkening <strong>of</strong> the meat and shell. These black spots occuron raw and undercooked prawns (Norman and Benjamin 2000). Reducing the activity <strong>of</strong>endogenous enzymes and preventing PPO action slows down the rate <strong>of</strong> deteriorationduring storage <strong>of</strong> shrimp. Various techniques and methods have been developed over theyears to prevent PPO action, and to reduce the activity <strong>of</strong> endogenous enzymes in seafood.These methods and techniques include processing, utilizing heat treatment, refrigeration,freezing, dehydration, irradiation, high-pressure, and the use <strong>of</strong> browning inhibitor.UNU-Fisheries Training Programme 6
Qingzhu2.3 Assessment methods <strong>of</strong> freshness and quality2.3.1 Sensory evaluationSensory evaluation is an important method for the assessment <strong>of</strong> freshness and quality,and is commonly used in the fish sector and fish inspection services (Martinsdottir 1997,Luten and Martinsdottir 1997). Sensory evaluation can be applied to all species <strong>of</strong> fishand laboratory facilities are not necessary. The evaluation is quick and non-destructiveunless the sample is being cooked, and moreover, the results <strong>of</strong>ten reflect the criteria theconsumer uses in evaluating acceptability (Connell 1990). Therefore, when chemical andphysical methods are being used for assessing the quality <strong>of</strong> fish, sensory evaluationshould be conducted to ensure that the results <strong>of</strong> the instrumental (objective) tests are inagreement with sensory analysis and thus indicating consumer perception (Alasalvar et al.2001). The quickest way, used by buyers and inspectors on the market, is to look at theappearance <strong>of</strong> the fish products, particularly the colour, luster <strong>of</strong> the shrimp. Thedisadvantages are that the evaluations <strong>of</strong> inspectors are difficult to standardize and theresults can be subject to the personal whims and biases <strong>of</strong> the assessors. However, mosttrade is based on sensory assessments, although measurements are not always objectiveand documented. The <strong>Quality</strong> Index Method (QIM), which as a method <strong>of</strong> sensoryevaluation, is a grading system based on adding demerit points for sensory attributes usedfor estimating the freshness and quality <strong>of</strong> seafood. The QIM has been demonstrated tobe rapid and more objective than sensory classification schemes <strong>of</strong>ten used by theindustry. QIM schemes have recently been developed for a number <strong>of</strong> fish speciesincluding: fresh herring, cod, red fish, Atlantic mackerel, mackerel, European sardine,brill, dab, haddock, pollock, sole, turbot, shrimp and farmed Atlantic salmon(Sveinsdottir et al. 2003).2.3.2 Chemical analysisSeveral chemical tests for freshness such as determination <strong>of</strong> amines, particularlytrimethylamine (TMA), and determination <strong>of</strong> hypoxanthine have been used for the pastdecades (Aitken et al. 1982). The former is related to bacterial activity while the latter isa measure <strong>of</strong> enzymic change. These two methods complement each other and havedifferent ranges <strong>of</strong> applicability and usefulness. A chemical test does not measurefreshness directly but the two are associated because the concentration <strong>of</strong> chemicalsmeasured is dependent on storage time and temperature, as freshness is.Trimethylamine, TMA, is formed in spoiling fish by the action <strong>of</strong> certain species <strong>of</strong>bacteria on the substance trimethylamine oxide, TMAO. Therefore determination <strong>of</strong>TMA content is a measure <strong>of</strong> bacterial activity and spoilage (Aitken et al. 1982). Increasein TMA during iced storage is similar to the increase in bacterial numbers. TMAO is notonly an important compound for maintenance <strong>of</strong> physiological functions in fish andshellfish but it is also a key substance in the spoilage <strong>of</strong> raw or processed seafood(Norman and Benjamin 2000). The TMAO content in the muscle <strong>of</strong> crustaceans is 9-28(mmole/kg wet weight) (Konosu and Yamagushi 1982).UNU-Fisheries Training Programme 8
QingzhuElectronic nose measurements: Recently, electronic noses have been introduced asalternative rapid techniques to supplement or replace traditional quality controltechniques in the food industry. Electronic nose systems have been designed to be usedfor quality control <strong>of</strong> raw and manufactured products; process, freshness and maturitymonitoring; shelf-life investigation; microbial pathogen detection, etc. (Schaller et al.1998). The electronic nose is promising for application in food industries where rapidmeasurements with no sample preparation are needed to detect microbial spoilage(Olafsdottir et al. 2002). An electronic nose FreshSense based on electrochemical gassensors (CO, SO 2 and NH 3 ) has been used for freshness monitoring <strong>of</strong> various species <strong>of</strong>fish i.e. haddock, capelin, redfish and cod (Olafsdottir and Jonsdottir 2003). Thesensitivity <strong>of</strong> the sensors towards different compounds is different, for example, COsensor has high response to the production <strong>of</strong> alcohols and NH3 can detect the formation<strong>of</strong> amines etc. (Olafsdottir et al. 2002). The responses <strong>of</strong> the electrochemical sensorscorrelate well with classical methods to evaluate freshness and spoilage <strong>of</strong> seafood, i.e.TVB measurements and sensory analysis, for capelin (Olafsdottir et al. 1997a, 2000)herring and fresh roe (Olafsdottir et al. 1997b), and whole or peeled shrimp (Högnadottir,1999).Texture measurements: Some characteristics in shrimp that result in the decline <strong>of</strong>freshness and quality are mainly related to structure, appearance (including colour), odour,water-holding capacity, etc. Texture is a very important property <strong>of</strong> fish product whetherit is raw or cooked. Texture measurement can be used to determine structural changes.The four principal quality factors in food are the appearance (comprising colour, shape,size, gloss), flavour (comprising taste and odour), texture, and nutrition (Malcoim 2002).Texture <strong>of</strong> raw fish can be measured by different methods using mechanical food testingequipment. The main techniques applied for fish are puncture, compression, shear, andtensile stress. Among them, the shearing force and compression methods arerecommended for use with fresh fish (Sigurgisladottir et al. 1999). When the texture <strong>of</strong>raw fish is measured, hardness and springiness are <strong>of</strong>ten the major variables (Botta 1991).Hardness was defined as the maximum force during the first compression cycle (first bite)and has <strong>of</strong>ten been substituted by the term firmness. Its units are N (force). Resilience is ameasurement <strong>of</strong> how the sample recovers from deformation both in terms <strong>of</strong> speed andforce derived. It is taken as the ratio <strong>of</strong> areas from the first probe reversal point to thecrossing <strong>of</strong> the x-axis and the areas produced from the first compression cycle. It is not aparameter from the original Texture Pr<strong>of</strong>ile Analysis (TPA) work but instead has beendeveloped from looking more closely at the elastic recovery <strong>of</strong> the sample. Springiness(originally called elasticity) is related to the height that the food recovers during the timethat elapses between the end <strong>of</strong> the first bite and the start <strong>of</strong> the second bite. There is nounit for this parameter. Cohesiveness is defined as the ratio <strong>of</strong> the positive force areaduring the second compression to that during the first compression. Tensile strength is amanifestation <strong>of</strong> cohesiveness. This parameter is unitless.Figure 1 shows a typical TPA curve generated by the G. F. Texturometer. The height <strong>of</strong>the force peak on the first compression cycle (first bite) was defined as hardness(Malcoim 2002). In Figure 1, A is the beginning <strong>of</strong> the first compression and B is thebeginning <strong>of</strong> the second compression. The ratio <strong>of</strong> the positive force areas under the firstand second compressions (A 2 /A 1 ) defines cohesiveness. The distance that the sampleUNU-Fisheries Training Programme 10
Qingzhurecovered its height during the time that elapsed between the end <strong>of</strong> the first bite and thestart <strong>of</strong> the second bite (BC) was defined as springiness (originally called elasticity).Texture pr<strong>of</strong>ile analysis (TPA) is an objective method <strong>of</strong> sensory analysis pioneered bySzczesniak (1963), who defined the texture parameters first used in this method <strong>of</strong>analysis. Later, Bourne (1978) adapted the Instron to perform TPA by compressingstandard-sized samples <strong>of</strong> food twice. TPA is based on the recognition <strong>of</strong> texture as amulti-parameter attribute. For research purpose, a texture pr<strong>of</strong>ile in terms <strong>of</strong> severalparameters determined on a small homogenous sample is desirable.Figure 1: A typical texture pr<strong>of</strong>ile analysis (TPA) curve ( Malcolm 2002).3 MATERIAL AND METHODS3.1 Raw material and experimental design<strong>Northern</strong> shrimp (<strong>Pandalus</strong> <strong>borealis</strong>), was caught in Arnarfjordur (Westfjords, Iceland)on the 2nd <strong>of</strong> December 2003 and stored in isothermic boxes containing crushed ice,followed by truck transport to the IFL laboratories in Reykjavik two days after catch. Thetemperature <strong>of</strong> shrimp was 4.5 o C and the ice had melted in the boxes holding the shrimpwhen they arrived at the laboratory.The shrimp was randomly divided into 4 groups that were kept under different conditions.The groups were stored in ice at 1.5 o C <strong>of</strong> ambient temperature (room temperature)(ICE/+), in liquid-ice at 1.5 o C (LIQ/+), in liquid-ice at -1.5 o C (LIQ/-) and in salt-waterice at -1.5 o C (S-ICE/-), respectively (Table 2). A thin layer <strong>of</strong> liquid ice and ice were putin the bottom <strong>of</strong> the bin, then a layer <strong>of</strong> shrimp, about 5 cm height, was laid into the binand covered with liquid ice and ice again. This was repeated until the bin was filled up(the layers <strong>of</strong> shrimp kept in each bin were five). All the bins were covered by liquid-ice,ice, or salt-water ice on top and kept at temperature <strong>of</strong> 1.5 o C (ICE/+ and LIQ/+ groups) or-1.5 o C (S-ICE/- and LIQ/- groups). The centre temperature <strong>of</strong> every storage bin wasUNU-Fisheries Training Programme 11
Qingzhumeasured with 1 h intervals using automatic record-meter inserted in the four bins.Temperature <strong>of</strong> the cold chamber was also monitored. The liquid ice was supplied byOptimar (Company, in Iceland) with initial salt content <strong>of</strong> 3.5% and ice content <strong>of</strong>27%~30%. The flack ice was made <strong>of</strong> potable water at the laboratory.The ratio <strong>of</strong> ice to shrimp had been theoretically calculated taking into account how muchice was needed to chill the shrimp down from 4-5°C to 0°C and how much ice to keep theshrimp chilled for 10 days (Table 1). The mass <strong>of</strong> ice used (M i used) was 5-6 times thecalculated minimum value the mass (M i total) determined theoretically. This was done tomake sure that there would be enough ice for the during the whole storage period.Table 1: Latent heat <strong>of</strong> fusion (∆H f ) <strong>of</strong> the different cooling agent, the minimumquantity needed to cool the shrimp and keep it chilled (Mi total) and the quantityused for 15 kg <strong>of</strong> shrimp (Mi used).Type <strong>of</strong>cooling agentMs * Cps * ∆T Ratio <strong>of</strong> ice(kg)*(kcal/kg°C)*(°C) (%)∆Hf(kcal/kg)Mc for chilling(kg)Mc for storage(kg)Mi total(kg)Flake ice 15*0,8*10=120 100 80 1,5 2,3 3,8 15,0Liquid ice 15*0,8*10=120 30 24 5,0 7,5 12,5 43,5Mi used(kg)Salt-water +ice15*0,8*10=120 70 56 2,1 3,2 5,4 22,5M c for chilling (from 10 to 0°C) = ( M s * Cp s * ∆T) / H f = (15*0,762*(20-0))/80,M c for storage = (1,5%*M s *10 days * 80kcal/kg) * ratio <strong>of</strong> ice in the cooling agent,M c = mass <strong>of</strong> cooling agent (kg), M s = mass <strong>of</strong> shrimp (15 kg),Cp s = specific heat used for shrimp (80 kcal/kg), ∆T = 10°C, ∆H f = latent heat <strong>of</strong> fusionOn days 0, 1, 4 and 6 <strong>of</strong> storage, corresponding to days 3, 4, 7 and 9 after catch, duplicatesamples were taken from each lot <strong>of</strong> the four different groups <strong>of</strong> shrimp stored in thedifferent conditions. The samples were submitted to microbiological, chemical, physicaland sensory analysis.Table 2: Experimental groups and sampling plan.Group Type <strong>of</strong> ice Ratio <strong>of</strong> Draining Storage temp. Sampling daysshrimp to ice during storage 0 1 4 6ICE/+ Flake ice 1:1.5 Yes 1.5±0.4 o C Day0 ICE/+1 ICE/+4 ICE/+6LIQ/+ Liquid ice 1:2.9 Yes 1.5±0.4 o C Day0 LIQ/+1 LIQ/+4 LIQ/+6S-ICE/- Salt-water (30%)+ ice (70%) 1:1.5 No -1.5±0.3 o C Day0 S-ICE/-1 S-ICE/-4 S-ICE/-6LIQ/- Liquid ice 1:2.9 No -1.5±0.3 o C Day0 LIQ/-1 LIQ/-4 LIQ/-6UNU-Fisheries Training Programme 12
Qingzhu3.2 Sensory evaluationA <strong>Quality</strong> Grading Scheme was used to evaluate the quality <strong>of</strong> whole shrimp (Table 3).Duplicate samples from each <strong>of</strong> the four storage conditions were taken at regular intervals(on days 0, 1, 4 and 6 <strong>of</strong> storage) for each group and placed in two clean transparent glasscontainers, after 20 min the assessment was carried out under room temperature andadequate fluorescent light. The samples were coded with a random three digit number.The panalists were not aware <strong>of</strong> the number <strong>of</strong> storage days <strong>of</strong> the shrimp and did notknow which two containers were the same group prior to assessment. The panelconstituted <strong>of</strong> eight members who had been trained in evaluating quality <strong>of</strong> shrimp andthe characteristic sensory attributes.Table 3: Score sheet for quality grading scheme <strong>of</strong> whole shrimp (IFL 2003).Score / GradingDescription5 Excellent Colour is dark red to bright pink. Roes are blue-green (copper). Strong seaweedy,marine odour. Strong sweet shrimp taste.4 Good Colour is natural light pink. Roes are blue-green (copper). Weak characteristicshrimp odour. Weak sweet shrimp taste.3 Moderate Marine/shrimp odour is diminishing, weak “fishy odour”, even slight ammonia.Colour is natural light pink with grey-greenish or yellowish discoloration.Roes are light green. Taste is natural not sweet to weak “fishy taste”.2 Borderline----Clearly not FreshWeak ammonia odour. Colour is natural light pink with grey-greenish oryellowish discoloration. Roes are discoloured. Blackening on the head canbe spotted. Distinct fishy taste with bitter aftertaste.1 Unfit Spoiled Ammonia odour. Colour is natural light pink with grey-greenish or yellowishdiscoloration. Roes are Dark. The blackening on the head is extensive.Spoiled, taste with strong, bitter aftertaste.3.3 Protein measurementProtein content in shrimp meat was determined by the Kjeldahl method (ISO 1997). Asample <strong>of</strong> 5.00 g was digested in sulphuric acid in presence <strong>of</strong> copper as a catalyst.Thereafter, the sample was placed in distillation unit, 2400 Kjeltec Auto Sample System.The acid solution was made alkaline by a sodium hydroxide solution. The ammonia wasdistilled into boric acid and the acid was simultaneously titrated with diluted H 2 SO 4 . Thenitrogen content was multiplied by the factor 6.25 to get the ratio <strong>of</strong> crude protein.UNU-Fisheries Training Programme 13
Qingzhu3.4 Salt measurementSalt content in the shrimp meat was determined using the potentiometric method (AOAC1995). Soluble chloride was extracted from the sample with water containing nitric acid.The chloride content <strong>of</strong> the solution was titrated with silver nitrate and the end point wasdetermined potentiometrically.3.5 Fat measurementFat content in shrimp meat was determined by the method <strong>of</strong> AOCS Official Method Ba-3-38 (1997). The sample was extracted with petroleum ether, boiling range 40-60°C. Theextraction apparatus was 2025 Soxtec Avanti Automatic System.3.6 Water measurementWater content in shrimp meat was determined according to the method ISO 6496 (1999).The sample was heated in a heating oven at 103°C +/- 2°C for four hours. Watercorresponds to the weight loss.3.7 Water-holding capacity (WHC) measurementWater-holding capacity (WHC) <strong>of</strong> peeled whole shrimp was measured by modifiedcentrifuge method reported by Eide et al. (1982). Water removed during centrifuge wasdrained through the nylon membrane in the sample holder, and collected in the bottom <strong>of</strong>the centrifuge tube (50ml). The conditions were: around 3.5 g sample (the individualnumbers <strong>of</strong> peeled whole shrimp was 2 or 3); centrifuge time, 5 min at 3500 rpm; at10 °C. The sample holder was weighed before and after centrifuge for determination <strong>of</strong>weight loss <strong>of</strong> the sample. The water-holding capacity was expressed as following:Water-holding capacity (%) = ((weight <strong>of</strong> the sample × water content % <strong>of</strong> the sample - weightloss <strong>of</strong> the sample) / (weight <strong>of</strong> the sample × water content % <strong>of</strong> the sample)) × 100.3.8 TVB-N and TMA measurementTotal volatile basic nitrogen (TVB-N) and trimethylamine (TMA) were determined usingsteam distillation in the minced shrimp tissue, followed by titration method (AOAC1990). The TVB-N was performed through direct distillation into boric acid using aKjeldahl-type distillatory (Struer TVN) (Malle and Poumeyrol, 1989), the acid wastitrated with diluted H 2 SO 4 solution. To determine TMA the same method was used as forTVB-N but adding 20 ml <strong>of</strong> 35% formaldehyde to the distillation flask to block theprimary and secondary aminess, an alkaline binding mono-and di-amine, TMA being theonly volatile and measurable amine (Malle and Poumeyrol 1989). The TVB-N and TMAcontent was expressed in mgN/100g shrimp tissue.UNU-Fisheries Training Programme 14
Qingzhu3.9 pH measurementpH was measured using a calomel electrode (SE 104) pH meter (Knick-Portamess 913 (X)pH meter, Germany, Berlin). Glass calomel electrode was dipped into minced shrimpmeat at room temperature.3.10 Texture measurementA compression test was carried out. The sample was placed on the baseplate andcompressed two times by a platen attached to the drive system using a texture analyzer(TA-XT2I Texture Analyzer, Stable Micro Systems) as seen in Figure 2. The textureanalyzer equipped with a 75 mm diameter rounded head probe and a 5 kN load cell wasused; the cross speed was set at 0.80 mm/s, the post test speed was 10.00 mm/s, and a 100g constant force. In order to ensure no cracking <strong>of</strong> sample, the compression was limited to50% <strong>of</strong> the sample height on the basis <strong>of</strong> preliminary trials. The trigger force was set at 5g and the registration rate to 200 PPS (registrations s). Five measurements in fiveindividuals from each lot were carried out.Figure 2: Texture analyzer (TA-XT2I Texture Analyzer) used to measure texturechange in shrimp.3.11 Electronic Nose measurementElectronic nose measurements were performed using an electronic nose calledFreshSense (Figure 3), developed by the Icelandic Fisheries Laboratories (IFL) andBodvaki (Maritech, Iceland) (Olafsdottir et al. 2002). The instrument consists <strong>of</strong> a glasscontainer closed with a plastic lid, an aluminum sensor box fastened to the lid, and apersonal computer running a measurement program. The sensor box contains fourUNU-Fisheries Training Programme 15
Qingzhudifferent electrochemical gas sensors (Dräger, Germany, CO, H 2 S, and SO 2 ; CityTechnology, U.K., NH 3 ) and a temperature sensor. Electronic, and A/D converter, and amicroprocessor to read the measurements and send them to the computer are also in thebox. A fan is positioned in the container to ensure gas circulation. The measurementtechnique was reported earlier by Olafsdottir et al. (1997a). 500 g. <strong>of</strong> shrimp wereanalyzed; the measurement time was 5 min and temperature was 7-9 o C during themeasurements.Figure 3: Electronic nose FreshSense used to measure quality change <strong>of</strong> shrimp.3.12 Bacteriological testThe total viable counts (TVC) was performed according to the Compendium <strong>of</strong> Methodsfor the Microbiological Examination <strong>of</strong> foods published by the American Public HealthAssociation (APHA 1992). The samples <strong>of</strong> whole shrimp for bacteriological analysis toestimate total viable counts (TVC) were first minced. This procedure was then followedby weighing 25 g <strong>of</strong> each the minced sample, homogenizing it in 225 g <strong>of</strong> dilution buffer.1 ml <strong>of</strong> the primary 1/10 suspension was then withdrawn and decimal dilutions wereprepared in dilution buffer. Total viable counts were done on agar containing 0.5% NaClby pour plate and incubated at 22°C for 72 hrs for psycrotrophic bacteria. Theconventional "pour-plate" method was used. Plates showing colony numbers <strong>of</strong> 25 to 250were then selected for counting. The number <strong>of</strong> colonies counted thus constituted thetotal viable counts (TVC).UNU-Fisheries Training Programme 16
Qingzhu3.13 Data analysisThe data, including instrumental texture parameters, sensory score and water-holdingcapacity value, was tested using analysis <strong>of</strong> variance (ANOVA) to analyze if a differenceexisted within a group and among groups during the storage time, and to show theDuncan’s Multiple-Comparison Test. Linear equation and the correlation coefficients (R)<strong>of</strong> some indicators such as total volatile bases nitrogen (TVB-N), trimethylamine (TMA),total viable counts (TVC), water content, salt content and electronic nose measurementparameters were calculated. Principal component analysis (PCA), which was conductedin the statistical program Unscrambler (Version 7.5, CAMO ASA, Oslo, Norway), wasperformed to study the main tendencies <strong>of</strong> the variation among the measurement variableand to evaluate if the various analytical techniques applied were comparable to evaluatequality. In all cases, significance levels were set at 95% (P
Qingzhu4 RESULTS4.1 Basic characteristics <strong>of</strong> the sample and temperature change during storageUpon its arrival at the laboratory, the size and proximate composition <strong>of</strong> the shrimp weremeasured. The mean weight and length <strong>of</strong> the shrimp were 5.1±0.6g and 9.2±0.7cm,respectively. The moisture 81.1%; crude protein 17.4%; crude fat 0.4%; salt (NaCl) 0.7%.The average temperature <strong>of</strong> the cold storage room, in which the two liquid iced groupswere stored, was -1.5±0.3 o C. Another cold storage room, in which the two iced groupswere stored, was <strong>of</strong> 1.5±0.4 o C. The centre temperature in each bin holding sample duringstorage is shown in Figure 4.Temperature in the center <strong>of</strong> bin (°C)0.60.40.20.0-0.2-0.4-0.6-0.8-1.0-1.2-1.4-1.6-1.8-2.0-2.2-2.4-2.6-2.8LIQ/+0 24 48 72 96 120ICE/+S-ICE/-LIQ/-Storage time (hours)Figure 4: The centre temperature in each bin holding sample during storage. ICE/+:flack ice at 1.5 o C; LIQ/+: liquid ice at 1.5 o C; S-ICE/-: salt-water + ice -1.5 o C; LIQ/-:liquid ice at -1.5 o C.Compared to traditional ice storage, the liquid ice could maintain lower temperature andchill shrimp more rapidly. A gradual increase <strong>of</strong> centre temperature was found in thegroup LIQ/+, which may be explained by the decrease <strong>of</strong> liquid ice with time because themelted ice was drained continuously. The increase in temperature was also noticed withstorage time for the traditional ice storage ICE/+. The melted ice was also drained forthat sample and the influence <strong>of</strong> the higher storage temperature <strong>of</strong> the cooling room isobvious for these two groups LIQ/+ and ICE/+.4.2 Sensory evaluationThe average sensory score calculated for each sample formed a linear relationship withstorage time for each group/lot (Figure 5). The shrimp stored in liquid ice at -1.5 o Cscored significantly higher (P
QingzhuThe lowest score was awarded to the shrimp group (ICE/+) stored in ice at 1.5 o Cthroughout the whole storage period. The appearance <strong>of</strong> the four sample groups <strong>of</strong> shrimpon the 6 th day <strong>of</strong> storage, are shown in Figure 6.Sensory scores5.004.504.003.503.002.502.001.501.000.50Rejection limit <strong>of</strong> acceptability-3 -2 -1 0 1 2 3 4 5 6 7Days <strong>of</strong> storageCatch dayICE/+LIQ/+LIQ/-S-ICE/-Linear (LIQ/-)Linear (LIQ/+)Linear (S-ICE/-)Linear (ICE/ +)Figure 5: Sensory scores <strong>of</strong> shrimp stored in different cooling conditions. ICE/+:flack ice at 1.5 o C; LIQ/+: liquid ice at 1.5 o C; S-ICE/-: salt-water + ice -1.5 o C; LIQ/-:liquid ice at -1.5 o C.UNU-Fisheries Training Programme 19
QingzhuFigure 6: Appearance <strong>of</strong> shrimp stored in different cooling conditions on the day 6 th<strong>of</strong> storage. PIC (ICE/+): flake ice at 1.5 o C; PLD (LIQ/+): liquid ice at 1.5 o C; MSI (S-ICE/-): salt-water + ice -1.5 o C; MLD (LIQ/-): liquid ice at -1.5 o C.These pictures show the differences in appearance <strong>of</strong> shrimp among groups. The largerthe black discoloration on the surface <strong>of</strong> shrimp, the lower the quality <strong>of</strong> the shrimp. Asseen on the figure the sample labelled PIC (ICE/+) appears to have the highest proportion<strong>of</strong> discoloration. This is in agreement with the sensory analysis showing this sample hadthe lowest Grading Scheme scores for freshness evaluation throughout the storage.4.3 TVB-N and TMATotal volatile basic nitrogen (TVB-N) value <strong>of</strong> 33.5 mg/100g whole shrimp wasmeasured at the beginning <strong>of</strong> storage and on day 1,4 and 6 (Figure 7). The effect <strong>of</strong>different storage type and conditions on TMA formation in shrimp is shown in Figure 8.UNU-Fisheries Training Programme 20
QingzhuTVB-N mgN/100g120100806040200-3 -2 -1 0 1 2 3 4 5 6 7Catch dayDaysFigure 7: Total volatile basic nitrogen (TVB-N) (mgN/100g) formation <strong>of</strong> shrimpstored in different cooling conditions during 6 days storage period. ICE/+: flack iceat 1.5 o C; LIQ/+: liquid ice at 1.5 o C; S-ICE/-: salt-water + ice -1.5 o C; LIQ/-: liquidice at -1.5 o C.On day 1 the TVB-N values for LIQ/- and LIQ/+ had lowered from day 0. The values forICE/+ and S-ICE/- changed very little during day 1. Then the TVB-N value started toincrease but TVB-N for LIQ/- was always the lowest. However in the other two groups,ICE/+ and S-ICE/- that showed the highest TVB-N value, the TVB-N value increased tomore than 70 mg/100g the fourth day <strong>of</strong> storage.TMA mgN/100g3530252015105ICE/+S-ICE/-LIQ/+LIQ/-S-ICE/-ICE/+LIQ/-LIQ/+0-3 -2 -1 0 1 2 3 4 5 6 7Catch dayDaysFigure 8: Trimethylamine (TMA) (mgN/100g) formation <strong>of</strong> shrimp stored indifferent cooling conditions during 6 days storage period. ICE/+: flack ice at 1.5 o C;LIQ/+: liquid ice at 1.5 o C; S-ICE/-: salt-water + ice -1.5 o C; LIQ/-: liquid ice at -1.5 o C.UNU-Fisheries Training Programme 21
QingzhuInitial TMA value <strong>of</strong> the sample was 0.5 mgN/100g on day 0 when the shrimp arrived atlaboratory (Figure 8). TMA formation gradually increased over the storage period withthe exception <strong>of</strong> liquid ice group (LIQ/-) at lower temperature (-1.5 o C) where TMA wasreduced to 0 mgN/100g on day 1 and then a short lag period before TMA began toincrease steadily in the following storage days.4.4 pH measurementMean pH measurements over the period <strong>of</strong> iced or liquid iced storage are shown in Figure9. The initial pH <strong>of</strong> the shrimp was 7.41 upon its arrival. Results show that the increases<strong>of</strong> pH value were rapid in the two samples that had been stored in ice at 1.5 o C and in saltwaterice at -1.5 o C, and reached 8.26 and 8.20, respectively (Figure 9). However, thechanges were small in samples stored in liquid ice at -1.5 o C. In the end <strong>of</strong> storage the pHwas 7.98.pH8.48.38.28.1ICE/+S-ICE/-LIQ/+8.0LIQ/-7.97.87.77.67.57.4-3 -2 -1 0 1 2 3 4 5 6 7DaysCatch dayFigure 9: Changes <strong>of</strong> pH value <strong>of</strong> the shrimp stored in different conditions. ICE/+:flack ice at 1.5 o C; LIQ/+: liquid ice at 1.5 o C; S-ICE/-: salt-water + ice -1.5 o C; LIQ/-:liquid ice at -1.5 o C.UNU-Fisheries Training Programme 22
Qingzhu4.5 Water contentThe effects <strong>of</strong> storage type and storage time on the changes in absolute water contentduring the storage period <strong>of</strong> whole shrimp are shown in Figure 10.Water/dry material without salt7.00LIQ/-6.506.005.50S-ICE/-ICE/+LIQ/+5.004.504.00-3 -2 -1 0 1 2 3 4 5 6 7daysCatch dayFigure 10: Changes <strong>of</strong> water content <strong>of</strong> shrimp stored in different conditions duringthe storage period. ICE/+: flack ice at 1.5 o C; LIQ/+: liquid ice at 1.5 o C; S-ICE/-:salt-water + ice -1.5 o C; LIQ/-: liquid ice at -1.5 o C.Although no significant increases were found in relative moisture content between eachgroup, the results show that the water content increased gradually with storage time frominitial 81.1% gradually to around 85% in all the groups during the storage period (datanot shown). The findings were similar to the report that presented an increase in theweight <strong>of</strong> headed cod in fluid ice by 3% to 6% over a 10-h period (Huidobro et al. 2002.UNU-Fisheries Training Programme 23
Qingzhu4.6 Salt contentThe results from the salt (NaCl) content analysis <strong>of</strong> shrimp muscle under various storagetypes are shown in Figure 11.3.0Salt content (%)2.5LIQ/-2.01.51.0S-ICE/-0.5LIQ/+ICE/+0.0-3 -2 -1 0 1 2 3 4 5 6 7daysCatch dayFigure 11: Changes <strong>of</strong> salt content <strong>of</strong> shrimp stored in different conditions duringthe storage period. ICE/+: flack ice at 1.5 o C; LIQ/+: liquid ice at 1.5 o C; S-ICE/-:salt-water + ice -1.5 o C; LIQ/-: liquid ice at -1.5 o C.The salt content increased slowly in shrimp that were stored in LIQ/+ or S-ICE/-. A rapidincrease in salt content for the sample group stored in liquid ice at -1.5 o C was found.However, the salt content in iced shrimp decreased slowly during the storage period.UNU-Fisheries Training Programme 24
Qingzhu4.7 Water-holding capacity (WHC)The water-holding capacity <strong>of</strong> the shrimp is shown in Figure 12. It is evident that thewater-holding capacity <strong>of</strong> the shrimp after storage is lower than that for the raw shrimpbefore storage.94.093.0Water-holding capacity (%)92.091.090.089.088.087.0LIQ/-S-ICE/-LIQ/+ICE/+86.0-3 -2 -1 0 1 2 3 4 5 6 7Catch dayFigure 12: Changes <strong>of</strong> water-holding capacity <strong>of</strong> shrimp stored in differentconditions during the storage period. ICE/+: flack ice at 1.5 o C; LIQ/+: liquid ice at1.5 o C; S-ICE/-: salt-water + ice -1.5 o C; LIQ/-: liquid ice at -1.5 o C.daysThe water-holding capacity for each lot decreased with the storage time. No significantdifferences in water-holding capacity were found between the four groups and betweeneach lot within two groups that were the S-ICE/- and LIQ/+. The ICE/+ group had asignificant difference (P
Qingzhu4.8 Texture measurementThe hardness, springiness, cohesiveness and resilience measured by Texture Analyzer areshown in Figure 13-16, respectively. The results <strong>of</strong> texture measurement and fromvariance analysis (ANOVA) show that the variation <strong>of</strong> texture parameters, includinghardness, springiness, resilience and cohesiveness, was small for the various storagegroups or storage times.1210Hardness (N)864ICE/+LIQ/+S-ICE/-LIQ/-200 1 4 6Storage time (days)Figure 13: Hardness (N) <strong>of</strong> shrimp stored in different conditions. ICE/+: flack ice at1.5 o C; LIQ/+: liquid ice at 1.5 o C; S-ICE/-: salt-water + ice -1.5 o C; LIQ/-: liquid iceat -1.5 o C.No evident differences <strong>of</strong> hardness were found during storage between the groups andlots in each group (Appendix). It seems that hardness is not influenced by the storagetype and time.UNU-Fisheries Training Programme 26
QingzhuSpringiness (N)0.80.70.60.50.40.30.20.100 1 4 6Storage time (days)Figure 14: Springiness (%) <strong>of</strong> shrimp stored in different conditions. ICE/+: flack iceat 1.5 o C; LIQ/+: liquid ice at 1.5 o C; S-ICE/-: salt-water + ice -1.5 o C; LIQ/-: liquidice at -1.5 o C.0.40.35Resilience (N)0.30.250.20.150.10.05ICE/+LIQ/+S-ICE/-LIQ/-ICE/+LIQ/+S-ICE/-LIQ/-00 1 4 6Storage time (days)Figure 15: Resilience <strong>of</strong> shrimp stored in different conditions. ICE/+: flack ice at1.5 o C; LIQ/+: liquid ice at 1.5 o C; S-ICE/-: salt-water + ice -1.5 o C; LIQ/-: liquid iceat -1.5 o C.UNU-Fisheries Training Programme 27
QingzhuCohesiveness (N)0.450.400.350.300.250.200.150.100.050.000 1 4 6Storage time (days)ICE/+LIQ/+S-ICE/-LIQ/-Figure 16: Cohesiveness <strong>of</strong> shrimp stored in different conditions. ICE/+: flack ice at1.5 o C; LIQ/+: liquid ice at 1.5 o C; S-ICE/-: salt-water + ice -1.5 o C; LIQ/-: liquid iceat -1.5 o C.Although some incidental individual significant differences existed in some groups or lots,there were no obvious regular trends in the changes in the springiness, resilience andcohesiveness <strong>of</strong> the shrimp stored under different conditions. In general, springiness andcohesiveness decreased at the beginning <strong>of</strong> storage and increased again later, although theextent and step <strong>of</strong> changes were different in the four groups. Therefore, it is necessary todevelop better methods. Similar results were shown by Huidobro et al. (2001) whoreported no differences between compression tests applied on gilthead seabream killed byimmersion in liquid ice and by immersion in ice plus water.4.9 Electronic nose measurementThe responses <strong>of</strong> CO and NH 3 sensors were highest and most sensitive among the sensors<strong>of</strong> the electronic nose, for the samples stored at different conditions (Figure 17 and 18).The responses <strong>of</strong> the H 2 S and SO 2 sensors were not accounted for in the report due totheir low responses towards all the sample groups during storage. This indicates that thedevelopment <strong>of</strong> sulfur compounds is <strong>of</strong> little importance during storage <strong>of</strong> shrimp underthese conditions.UNU-Fisheries Training Programme 28
Qingzhu250S-ICE/-200Current (nA) ----CO15010050LIQ/-LIQ/+ICE/+0-3 -2 -1 0 1 2 3 4 5 6 7Catch dayDays <strong>of</strong> storageFigure 17: Responses <strong>of</strong> CO sensors to the shrimp stored in different condition.ICE/+: flack ice at 1.5 o C; LIQ/+: liquid ice at 1.5 o C; S-ICE/-: salt-water + ice -1.5 o C;LIQ/-: liquid ice at -1.5 o C.The CO formation in S-ICE/- was very rapid but the other treatments (LIQ/-, LIQ/+,ICE/+) showed less CO formation. The highest CO value was measured at about 230 nA.Current (nA)----NH3700600500400300200100LIQ/+LIQ/-S-ICE/-ICE/+0-3 -2 -1 0 1 2 3 4 5 6 7Catch dayDays <strong>of</strong> storageFigure 18: Responses <strong>of</strong> NH 3 sensors to the shrimp stored in different condition.ICE/+: flack ice at 1.5 o C; LIQ/+: liquid ice at 1.5 o C; S-ICE/-: salt-water + ice -1.5 o C;LIQ/-: liquid ice at -1.5 o C.The NH 3 formation was different from CO formation where S-ICE/- and ICE/+ showedmuch higher values than LIQ/- and LIQ/+. The NH 3 value on day 1 decreased for ICE/+,LIQ/- and LIQ/+ but started to increased after day 1.UNU-Fisheries Training Programme 29
Qingzhu4.10 Bacteriological testBacteriological changes as monitored during storage are shown in Figure 19. TVC inshrimp in S-ICE/- and ICE/+ lots increased steadily. The microbiological growth rate inshrimp chilled in ice is faster than in the other three groups during the storage period.From the initial level <strong>of</strong> 2.4×10 5 cfu/g (TVC) increased to 3×10 8 cfu/g in the samplestored in ice at 1.5 o C by the end <strong>of</strong> the storage period when TVC was 10 6 cfu/g in thesample stored in liquid ice at -1.5 o C and the TVC levels in other lots were 1.7×10 7 cfu/gand 6.4×10 7 cfu/g, respectively.9.0TVC (log) cfu/g8.5ICE/+8.0S-ICE/-7.5LIQ/+7.06.56.0LIQ/-5.55.04.5-3 -2 -1 0 1 2 3 4 5 6 7Days <strong>of</strong> storageCatch dayFigure 19: Changes in total viable counts (TVC) in shrimp during storage. ICE/+:flack ice at 1.5 o C; LIQ/+: liquid ice at 1.5 o C; S-ICE/-: salt-water + ice -1.5 o C; LIQ/-:liquid ice at -1.5 o C.4.11 Correlation between indicatorsTable 4 shows the correlation coefficients between the parameters measured i.e. saltcontent, water content, pH, TMA, TVB-N, TVC, electronic nose (CO and NH 3responses) , sensory score, texture (H, S, C, R), water-holding capacity (WHC) and W/D.The yellow colour highlights where good correlations are found. The texture parametersdo not show any correlations to the other quality indicators measured.UNU-Fisheries Training Programme 30
QingzhuTable 4: Correlation (r) between parameters for quality assessment <strong>of</strong> shrimp.Salt Water pH TMATVB-NTPC CO NH3SensoryscoreH S C R WHC W/DSalt 1.00Water 0.08 1.00pH -0.12 0.93 1.00TMA -0.16 0.72 0.84 1.00TVB-N -0.46 0.65 0.81 0.92 1.00TPC -0.57 0.67 0.78 0.84 0.95 1.00CO -0.14 0.56 0.65 0.81 0.75 0.71 1.00NH3 -0.25 0.66 0.80 0.94 0.94 0.86 0.83 1.00Sensoryscore0.35 -0.82 -0.94 -0.89 -0.90 -0.88 -0.71 -0.85 1.00H -0.25 0.03 0.22 0.31 0.27 0.15 0.05 0.25 -0.28 1.00S 0.51 -0.36 -0.42 -0.16 -0.25 -0.35 0.09 -0.07 0.41 -0.50 1.00C -0.36 -0.41 -0.34 -0.07 0.08 0.01 -0.14 -0.03 0.13 0.17 0.17 1.00R -0.32 -0.40 -0.33 -0.09 0.03 -0.04 -0.14 -0.06 0.13 0.35 0.11 0.95 1.00WHC -0.05 -0.87 -0.76 -0.44 -0.37 -0.45 -0.23 -0.35 0.61 -0.08 0.63 0.48 0.47 1W/D 0.58 0.85 0.69 0.53 0.31 0.27 0.40 0.43 -0.49 -0.16 0.02 -0.49 -0.49 -0.71 1H: Hardness; S: Springiness; C: Cohesiveness; R: Resilience; W/D: water/dry material;WHC: water-hold capacityUNU-Fisheries Training Programme 31
Qingzhu4.12 PCA (principal component analysis) analysisThe data from the various measurements used to monitor quality in shrimp stored underdifferent conditions was analyzed by principal component analysis (PCA) as shown inFigures 20-21.1.0PC2Bi-plotCOS-ICE/-6Day 00.50LIQ/-1LIQ/+1S-ICE/-1LIQ/-4ICE/+1SensoryscoreLIQ/-6NH3TMATVB-NTPC (log) LIQ/+6S-ICE/-4Spoilage-0.5LIQ/+4pHICE/+4ICE/+6-1.0-0.8 -0.6 -0.4 -0.2 0 0.2 0.4 0.6 0.8 1.0RESULT2, X-expl: 86%,6%PC1Figure 20: Bi-plot for PCA <strong>of</strong> measured main data. Sample scores are labeled withthe storage condition and days <strong>of</strong> storage (ICE/+: flack ice at 1.5 o C; LIQ/+: liquidice at 1.5 o C; S-ICE/-: salt-water + ice -1.5 o C; LIQ/-: liquid ice at -1.5 o C). Loadings <strong>of</strong>variables include TVB-N, TMA, TVC, pH, sensory score and FreshSenSemeasurements (CO and NH 3 ).UNU-Fisheries Training Programme 32
Qingzhu1.0PC2Bi-plotResilience CohesivenessDay00.5LIQ/-1LIQ/+1HardnessICE/+4TPCTVB-NICE/+60Sensory scoreICE /+1SpringinessLIQ/+4LIQ/+6CONH3TMApHS-ICE/-4S-ICE/-6-0.5S-ICE/-1WaterSaltLIQ/-6-1.0LIQ/-4-1.0 -0.8 -0.6 -0.4 -0.2 0 0.2 0.4 0.6 0.8 1.0RESULT5, X-expl: 50%,20%Figure 21: Bi-plot for PCA <strong>of</strong> all the measured data. Sample scores are labelledwith the storage condition and days <strong>of</strong> storage (ICE/+: flack ice at 1.5 o C; LIQ/+:liquid ice at 1.5 o C; S-ICE/-: salt-water + ice -1.5 o C; LIQ/-: liquid ice at -1.5 o C).Loadings <strong>of</strong> variables include TVB-N, TMA, TVC, pH, water, salt, texture(hardness, springiness, resilience, cohesiveness), sensory score and FreshSensemeasurements (CO and NH 3 ).PC1Figure 20 shows the PCA scores and loadings plots <strong>of</strong> all samples and data from TVB-N,TMA, TVC, pH, sensory scores and CO, NH 3 response <strong>of</strong> electronic nose FreshSensemeasurement. The X-axis is the first principal component (PC1) that explains 86% <strong>of</strong> thevariance in the data set and PC2 explains 6%, a total <strong>of</strong> 92% <strong>of</strong> the variation in the dataset is explained by the model. The x axis is explaining the spoilage level <strong>of</strong> the samplesand when the salt and water content and the texture parameters are added less variation inthe data set is explained by the model as shown in Figure 21.Figure 21 shows the PCA for the same samples and variables as Figure 20 but alsoincludes the water and salt content and the texture parameters. The first principalcomponent (PC1) explains 50% <strong>of</strong> the variation in the data set and PC2 explains 20%.This shows that the texture parameters and the salt and water content do not provideadditional information to the model to explain the variation in the spoilage level <strong>of</strong> thesamples.UNU-Fisheries Training Programme 33
Qingzhu5 DISCUSSIONS5.1 Sensory evaluationSensory analysis <strong>of</strong> whole shrimp revealed that significant differences (P
Qingzhu<strong>of</strong> the main spoilage-causing microorganism was restrained by the liquid ice. Similarresults were shown by the bacteria measurements (Figure 19).A comparison <strong>of</strong> the rates <strong>of</strong> TMA formation during 6 days <strong>of</strong> storage revealed that saltwatericed group (S-ICE/-) and iced group (ICE/+), in which TMA values exceeded10 mgN/100g, spoiled earlier than other two groups where TMA level remained below10 mgN/100g until day four <strong>of</strong> storage. The extent <strong>of</strong> increase in TVB-N and TMA <strong>of</strong>shrimp stored in liquid ice at -1.5 o C were considerably smaller than for sample groupsstored under other conditions (S-ICE/-, ICE/+).5.3 Change in pH <strong>of</strong> whole shrimpThe pH <strong>of</strong> shrimp meat gives some valuable information about its quality change.Significant differences were noticed from Figure 9 and the results <strong>of</strong> statistical analysis.There was a continued increase in pH for all sample groups, probably due metabolism <strong>of</strong>microorganisms producing alkaline compounds like amines formed by deamination <strong>of</strong>amino acids (Huss, 1988, Jackson et al. 1997). The initial post mortem pH varies withspecies, catching ground and season. Usually pH decreases during anaerobic formation <strong>of</strong>lactic acids during the first hours after death, but microbial metabolism leads to anincrease in pH during storage time. This is in good agreement with Krishnakumar et al.(1985) who showed reduction <strong>of</strong> total nitrogen in fish stored in ice sea-water and icebecause some compounds contained nitrogen were leached out. The pH changes, showedgood correlation with sensory and microbiological results. The pH changes also reflectedTVB-N and TMA accumulation and indicated the spoilage progress.5.4 CO and NH 3 responses <strong>of</strong> electronic nose measurementResults from electronic nose measurements indicate that response <strong>of</strong> NH 3 sensor can beused to evaluate the shrimp quality in a similar way as TVB-N, TMA and TVC (Table 4).The rapid onset <strong>of</strong> NH 3 production at low bacterial cell densities indicates that autolysismay be causing the production during the first day <strong>of</strong> storage and the rapid increase in therate <strong>of</strong> production during following days <strong>of</strong> storage indicates a bacterial contribution asreported by Lakshmanan et al. (2002), who found that the amine-forming bacterialpopulation in fresh shrimp was slightly higher (10 2 cfu.g -1 ) than in fish. Olafsdottir et al.(1997a, 2002) reported that the NH 3 response <strong>of</strong> electronic nose measurement gave thebest prediction <strong>of</strong> TVB in capelin raw material and was similar to the informationprovided by TMA for redfish. The CO sensor showed lower responses than the NH 3sensor, but similar overall trends for all the storage groups except for the group stored inICE/+ on day 6. It can be speculated that the decline in the CO sensor could be explainedby specific spoilage flora utilizing different substrates for their growth and thus formdifferent volatile degradation compounds. It is well known that the development <strong>of</strong>microbial metabolites changes because <strong>of</strong> competition <strong>of</strong> the micr<strong>of</strong>lora for availablesubstrates. However, this can not be confirmed because only one measurement was done.The lower responses <strong>of</strong> the CO sensor indicating lower spoilage level <strong>of</strong> samples <strong>of</strong>shrimp stored in ice is not in accordance with results from other indicators that were TVC,TVB-N and TMA in the trial. This should be studied further in combination withUNU-Fisheries Training Programme 35
Qingzhumicrobial studies to identify the specific spoilage bacteria in shrimp under theseconditions.5.5 Total viable count (TVC)Figure 19 shows the log TVC observed during the storage period for the four groups <strong>of</strong>shrimp. Initial TVC <strong>of</strong> the shrimp was 2.4×10 5 cfu/g (Figure 19). A decrease in bacterialtotal numbers to 7.2×10 4 cfu/g and 2.0×10 5 cfu/g was observed in the two groups storedin liquid ice at -1.5 o C and at 1.5 o C respectively after one day <strong>of</strong> storage. The initialreduction in the total bacteria can be explained because <strong>of</strong> cold shock (Ingram 1951). Thegrowth was first resumed after a lag phase <strong>of</strong> at least 24 h, and the slowest bacterialgrowth was found in the sample stored in liquid ice at -1.5 o C compared to other groups.The results are in good agreement with the report presented by Lakshmanan et al. (2002).After 6 days <strong>of</strong> storage, total viable counts in the shrimp stored in ice at 1.5 o C (ICE/+)were two logarithmic units higher than the group LIQ/- stored in liquid ice at -1.5 o C. TheTVC exceeded spoilage level <strong>of</strong> 10 7 cfu/g (Capell et al. 1997) with the exception <strong>of</strong> thegroup stored in liquid ice at -1.5 o C at the end <strong>of</strong> the trial. Actually, the extension <strong>of</strong> shelflife<strong>of</strong> the shrimp stored in liquid ice at -1.5 o C was attributed to delayed microbial growth.Other reports have shown that liquid ice can flow freely and surround the entire sampleresulting in rapid cooling and less damage <strong>of</strong> the samples. Bacterial growth was hinderedand high quality was maintained (Optimar 2003). Similar studies performed by theCanadian Centre for Fisheries Innovation (CCFI) show that liquid ice (Optim-Ice)performed better than regular icing methods when icing Snow Crab (Optimar 2003).Shewan (1961) has shown that TVC was lower in fish stored in ice sea-water than in icestored fish, and explained his results by faster initial cooling and lower storagetemperature during the ice sea-water storage. During storage microbiological growth ratein shrimp in LIQ/- group is the lowest in all these groups. It may be affected by rapidcooling and lower storage temperature (below 0°C) and better covering in shrimp inliquid ice. Similar results were seen in the Optimar (2003) information.UNU-Fisheries Training Programme 36
Qingzhu5.6 Correlation analysisThe correlation coefficients between sensory score and other parameters are minus valuebecause the sensory scores have decreasing values with storage while the values for theother quality parameters are increasing with storage. The fact that there are very goodcorrelations between these parameters such as pH, TMA, TVB-N, TVC, NH 3 and sensoryscore illustrates that pH, NH 3 response <strong>of</strong> electronic nose measurement and sensoryevaluation, which are rapid and practical methods, can be used as quality indicators <strong>of</strong>northern shrimp. Among pH, NH 3 response <strong>of</strong> electronic nose measurement and sensoryevaluation, NH 3 response <strong>of</strong> electronic nose measurement is the best feasible qualityindicator for the shrimp because <strong>of</strong> its simple and rapid operation. Followed by pHbecause <strong>of</strong> its simple and rapid measurement although slight lower veracity. The last oneis sensory evaluation which has advantage <strong>of</strong> assessing quality with no facilities.However, the assessors who had been trained in evaluating quality <strong>of</strong> shrimp and thecharacteristic sensory attributes are needed.5.7 PCA analysisPrincipal component analysis (PCA) for all <strong>of</strong> the samples, which was conducted in thestatistical program Unscrambler (Version 7.5, CAMO ASA, Oslo, Norway), wasperformed to study the main tendencies <strong>of</strong> the variation among the measurement variableand to evaluate if the various analytical techniques applied were comparable to evaluatequality. PCA was also done to study the main trend in the data and to illustrate the effect<strong>of</strong> the different storage types on the quality and spoilage level <strong>of</strong> shrimp. Most <strong>of</strong> thelatent variables methods used in multivariate data analysis are in one way or anotherbased on PCA (Wold et al. 1987). The PCA method provides a simple and efficient wayfor graphically describing systematic variation in complex data structures. Principalcomponent analysis (PCA) is a tool for identifying relationships in complex analyticaldata by comparing data in more than one dimension. The main objective is to detectstructure in the relationship between measured parameters and experimental factors. Ithas been used to transform a number <strong>of</strong> possibly correlated variables into a (smaller)number <strong>of</strong> uncorrelated variables called principal components. The first componentexplains as much <strong>of</strong> the variability in the data as possible, then the second componentwill account for as much <strong>of</strong> the remaining variability as possible, etc.It can be seen that the first PC1 represents the quality spoilage level <strong>of</strong> the sample withthe increasing storage time from left to right along PC1 (Figure 20, 21). Group ICE/+6and S-ICE/-6, even ICE/+4 and S-ICE/-4 are located to the right in the diagram, whileLIQ/-6 is just located to the middle. The result indicates that the shrimp stored in LIQ/-tend to spoil later than the other groups, the shrimp stored in ICE/+ spoil first, and theshrimp stored in S-ICE/- spoil sooner than the others. The sample LIQ/-6 had highloadings for the salt which indicate high level <strong>of</strong> salt content in the sample. The sampleICE/+4 and ICE/+6 had high loadings for the TVC and pH value. The texture parametersmeasured in shrimp contribute very little to PC1 and do not appear to change with storagetime (Figure 21). The NH 3 response, TMA, TVB-N and TVC are located close to eachother on the plot (Figure 20, 21), illustrating that these indicators keep high correlationand give the similar information that can indicate the quality <strong>of</strong> the shrimp, the findingsUNU-Fisheries Training Programme 37
Qingzhuare in agreement with the results from analysis <strong>of</strong> variance (r=0.84 ~ 0.94, Table 4).Olafsdottir et al. (2002) reported that the CO response was highly correlated to thesensory score (QIM) for redfish under all storage conditions, and that the response <strong>of</strong> theNH 3 sensor and TMA measurement give similar information and have very goodcorrelation for redfish stored in ice. It is interesting that both the CO and NH 3 sensorsshow higher responses towards the S-ICE/- group compared with the ICE/+ group whichis in agreement with the result <strong>of</strong> TMA analysis showing higher values for the S-ICE/-group.This should be studied further in combination with microbial studies to identify thespecific spoilage bacteria in shrimp under these conditions. These results suggest thatmetabolites from TMA producing bacteria contribute to the responses <strong>of</strong> the CO and NH 3sensors. These could be Pseudomonas species that are known to also produce volatileketones, aldehyde and esters that the CO sensor can detect (Huss 1995). The PCA plot(Figure 20) shows that the loading <strong>of</strong> the CO sensor appears to contribute to thepositioning <strong>of</strong> the S-ICE/- group on the upper half <strong>of</strong> the plot indicating a differentspoilage pattern for that group, perhaps because <strong>of</strong> conditions that favour the growth <strong>of</strong> adifferent specific spoilage bacteria compared with the other groups.6 CONCLUSIONSComparison <strong>of</strong> sensory, chemical, microbiological and physical quality parameters <strong>of</strong>shrimp, stored in ice at 1.5 o C (ICE/+), in liquid-ice at 1.5 o C (LIQ/+), in liquid-ice at1.5 o C (LIQ/-), and in salt-water ice at -1.5 o C (S-ICE/-), showed that S-ICE/- did notextend the shelf-life <strong>of</strong> shrimp as compared to ICE/+, whereas LIQ/+ and LIQ/- with therapid cooling and lower temperature and better covering delayed the rate <strong>of</strong> qualitydeterioration and extended the shelf-life, especially LIQ/- gave the longest shelf-life andthe best quality shrimp.Application <strong>of</strong> liquid ice storage decreased the rate <strong>of</strong> TVB-N and TMA formation anddelayed the growth <strong>of</strong> microorganism compared to salt-water iced or iced storage. Rate <strong>of</strong>production <strong>of</strong> both TVB-N or TMA and total viable counts (TVC) in shrimp stored in iceor in salt-water ice was always higher than other two groups, which were stored in liquidice. The shelf-life <strong>of</strong> shrimp stored in liquid ice at -1.5 o C was extended compared toothers storage conditions according to the indicators which were TVB-N, TMA, pH, TVC,NH 3 response <strong>of</strong> electronic nose measurement and sensory evaluation. <strong>Shrimp</strong> stored inliquid ice at -1.5 o C showed higher sensory score and indicated higher quality than othericed types throughout the storage period, although a slight loss <strong>of</strong> the characteristic colourwas observed.Good correlation existed between TVB-N and TMA (r=0.92), TVB-N and NH 3 (r=0.94),NH 3 and TMA (r=0.94) and TVB-N and sensory evaluation (r=0.90). Good correleationwas also found between TVC and the following parameters TVB-N (r=0.95), TMA(r=0.84), NH3 (r=0.86), sensory evaluation (r=0.88) and between pH and sensoryevaluation (r=0.94).UNU-Fisheries Training Programme 38
QingzhuNH 3 response <strong>of</strong> electronic nose measurement correlates well with traditional qualityevaluation technique (TVB-N, TMA and TVC) and the CO sensor may give furtherinformation about the presence <strong>of</strong> specific spoilage bacteria. This indicates thatelectronic nose measurements can be used effectively to monitor quality and onset <strong>of</strong>spoilage <strong>of</strong> shrimp.UNU-Fisheries Training Programme 39
QingzhuACKNOWLEDGEMENTSI would like to thank my supervisors Guðrún Ólafsdóttir and Kristín Anna Thórarinsdóttirfor their active guidance, enthusiastic assistance and valuable advice to me. I am gratefulto Dr. Tumi Tomasson, Director <strong>of</strong> the Fisheries Training Programme at the UnitedNations University for making it possible for me to attend this programme and his helpand support during stay in Iceland. I would also like to thank Mr. Thor Asgeirsson,Deputy Director <strong>of</strong> the Fisheries Training Programme for his general assistance. EmilíaMartinsdóttir was thanked for her guidance in sensory evaluation. Thanks to all thepeople who performed the sensory evaluation and contributed and helped me to succeedin this project.UNU-Fisheries Training Programme 40
QingzhuLIST OF REFERENCESAitken, A., Mackie, I.M., Merritt, J.H. & Windsor M.L. 1982. Fish handling &processing (Second edition). London: Ministry <strong>of</strong> Agriculture, Fisheries & Food.Alasalvar, C., Taylor, K.D.A., Oksuz, A. and Garthwaite, T. 2001. Freshness assessment<strong>of</strong> cultured sea bream by chemical, physical and sensory methods. Food Chemistry72:33-40.Aleman, M.P., K. Kaluda, and H. Uchiyama 1982. Partial freezing as a means <strong>of</strong> keepingfreshness <strong>of</strong> fish. Bull. Tokai Reg. Fish. Res. Lab. (106):11-26.AOAC, 1990. Official Methods <strong>of</strong> Analysis, 15th no 920.03. Determination <strong>of</strong> TotalVolatile Nitrogen by distillation method.AOAC, 1995. Official Methods <strong>of</strong> Analysis 16th no 976.18. Determination <strong>of</strong> salt(chlorine as sodium chloride) in seafood potentiometric method.AOCS 1997. Official Method Ba 3-38, Sampling and analysis <strong>of</strong> oil seed by-products.(with modification according to application note tecator no AN 301)American Public Health Association (APHA) 1992. Compendium <strong>of</strong> Methods for theMicrobiological Examination <strong>of</strong> Foods. 3rd edition.Baka, L.S., Andersen, A.B., Andersen, E.M. and Bertelsen, G. 1999. Effect <strong>of</strong> modifiedatmosphere packaging on oxidative changes in frozen stored cold water shrimp(<strong>Pandalus</strong> <strong>borealis</strong>). Food Chemistry 64:169-175.Benner, R.A., R. Miget, G. Finne, and G.R. Acuff, 1994. Lactic acid/melanosis inhibitorsto improve shelf life <strong>of</strong> brown shrimp (Penaeus aztecus). J. Food Sci. 59:242-250.Botta, J. R., 1995. Evaluation <strong>of</strong> seafood freshness quality. New York: VCH Publishers.Botta, J. R. 1991. Instrument for non-destructive texture measurement <strong>of</strong> raw Atlanticcod (Gadus morhua). Journal <strong>of</strong> Food Science 65, 962-968.Bourne, M.C. 1978. Texture pr<strong>of</strong>ile analysis. Food Technol. 32(7):62-66,72.Capell, C., Vaz-Pires, P. and Kirby, R. 1997. Use <strong>of</strong> counts <strong>of</strong> hydrogen sulphideproducing bacteria to estimate remaining shelf life. In: Methods to determine thefreshness <strong>of</strong> fish in research and industry. Proceeding <strong>of</strong> the final meeting <strong>of</strong> theconcerted action ‘Evaluation <strong>of</strong> fish freshness’ pp:175-182. AIR3C94, 2283, Nantes,12–14 November 1997. Paris, France: International Institute <strong>of</strong> Refrigeration.Connell, J.J. 1990. Control <strong>of</strong> fish quality (Third edition). London: Fishing News Books.Dalgaard, P., L. Gram, and H.H. Huss, 1993. Spoilage and shelf life <strong>of</strong> cod fillets packedin vacuum or modified atmospheres. Int. J. Food Microbiol 19: 283-294.Eide, O., Borresent, T. & Strom, T., 1982. Minced fish production from capelin (Mallotusvillosus). Journal <strong>of</strong> Food Science 47:347-354.Fatima, R., M.A. Khan, and R.B. Qadri, 1988. Shelf life <strong>of</strong> shrimp (Penaeus merguiensis)stored in ice (0°C) and partially frozen (-3°C). J. Sci. Food Agric. 42: 235-247.Gill TA. 1990. Objective analysis <strong>of</strong> seafood quality. Food Rev. Int. 6(4):681-714.Hognadottir, A. 1999. Application <strong>of</strong> a electronic nose in the fish industry. MS thesis.Department <strong>of</strong> Food Science, University <strong>of</strong> iceland.Huidobro, A., Lopez-Caballero, M.E. and Mendes, R. 2002. Onboard processing <strong>of</strong>deepwater pink shrimp (Parapenaeus longirostris) with liquid ice: Effect on quality.European Food Research and Technology 214 (6): 469-475.UNU-Fisheries Training Programme 41
QingzhuHuidobro, A., Mendes, R.and Nunes, M.L. 2001. Slaughtering <strong>of</strong> gilthead seabream(Sparus aurata) in liquid ice: influence on fish quality. Eur Food Res Technol 213:267-272.Huss, H.H. 1988. Fresh fish - <strong>Quality</strong> and quality Changes Training Manual. Rome:United Nations, FAO/DANIDA.Huss, H.H. 1995. <strong>Quality</strong> and quality changes in fresh fish. FAO Fisheries TechnologyPaper, Rome, pp:51-64.IFL 2003. <strong>Quality</strong> grading scheme for Icelandic shrimp industry.Ingram, M. 1951. The effect <strong>of</strong> cold on microorganisms in relation to food. Proc. Soc.Appl. Bacteriol. 14:243-249.ISO 1983. 6496 - Determination <strong>of</strong> water content. Geneva, Switzerland: TheInternational Organization for Standardization.ISO 6496:1999. Determination <strong>of</strong> moisture and other volatile matter content. Geneva,Switzerland: The International Organization for Standardization.ISO 5983:1997(E). Determination <strong>of</strong> nitrogen content and calculation <strong>of</strong> crude proteincontent - Kjeldahl method. Geneva, Switzerland: The International Organization forStandardization.Jackson, T.C., Acuff, G.R. and Dickson, J.S. 1997. Meat, poultry, and seafood. In: Doyle,M.P.; Beuchat, L.R.; Montville, T.J. eds. Food microbiology-fundamentals andfrontiers. ASM, Washington.Jeong, J. W., Jo, J. H., Lim, S. D., and Kang, T. S. 1991. Change in quality <strong>of</strong> frozenbreaded raw shrimp by storage temperature fluctuation. Korean Journal <strong>of</strong> FoodScience and Technology 23: 532–537.Jiang, S.T. and T.C. Lee 1988. Effect <strong>of</strong> modified ice storage on the quality andprevention <strong>of</strong> darkening discoloration <strong>of</strong> shrimp (Solencera prominentis). Bull. Jpn. Soc.Fish 54:1415-1422.Jorgensen, B.R., D.M. Gibson and H.H. Huss (1988). Microbiological quality and shelflife prediction <strong>of</strong> chilled fish. Int. J. Food Microbiol. 6: 295-307.Konosu, S. and Yamagushi, K. 1982. The flavor components in fish and plain shellfish. In:RE Martin, GJ Flick, CE Hebard, DR Ward, eds. Chemistry and biochemistry <strong>of</strong> marinefood products. Westport, CT:AVI Publ. comp.Krishnakumar, S., Hiremath, G.G. and Mennon, N.R. 1985. Fish technical paper 22: 126.Lakshmanan, R., Jeya S.R. and Jeyasekaran, G. 2002. Survival <strong>of</strong> amine-forming bacteriaduring the ice storage <strong>of</strong> fish and shrimp. Food Microbiology 19: 617-625.Lee, Y. C. and Um, Y. S. 1995. <strong>Quality</strong> determination <strong>of</strong> shrimp (Penaeus japonicus)during iced and frozen storage. Korean Journal <strong>of</strong> Food Science and Technology 27:520–524.Lee, C.M. and Toledo, R.T. 1984. Comparison <strong>of</strong> shelf life and quality <strong>of</strong> mullet stored atzero and subzero temperature. Journal <strong>of</strong> Food Science 49:317-344.Liston, J. 1980. Microbiology in fishery science. In: Connell, J.J. ed. Advances in fisheryscience and technology. Fishing News Books Ltd., Farnham, England.Lopez-Caballero, M.E., Goncalves, A. and Nunes, M.L. 2002. Effect <strong>of</strong> CO2/O-2-containing deepwater pink shrimp modified atmospheres on packed (Parapenaeuslongirostris). European Food Research and Technology 214 (3): 192-197.Luten, J. B.and Martinsdottir, E. 1997. QIM – A European tool for fish freshnessevaluation in the fishery chain. In G. Olafsdottir, J. Luten, P. Dalgaard, M. Careche, V.Verrez-Bagnis, E. Martinsdottir, and K. Heida eds., Methods to determine the freshnessUNU-Fisheries Training Programme 42
Qingzhu<strong>of</strong> fish in research and industry. Proceedings <strong>of</strong> the Final Meeting <strong>of</strong> the ConcertedAction “Evaluation <strong>of</strong> fish freshness” AIR3CT94 2283. Nantes Conference, France. 12-14 November 1997. International Institute <strong>of</strong> Refrigeration.Malle, P. and Poumeyrol, M . 1989. A New Chemical criterion for the <strong>Quality</strong> Control <strong>of</strong>Fish: Trimetylamine/Total Volatile Basic Nitrogen (%). Journal <strong>of</strong> Food Protection52(6):419-423.Martínez, I., Jacobsen Friis, T., y Careche, M. 2001. Post mortem muscle proteindegradation during ice-storage <strong>of</strong> Arctic (<strong>Pandalus</strong> <strong>borealis</strong>) and troICE/+al (Penaeusjaponicus and Penaeus monodon) shrimps: a comparative electrophoretic andimmunological study. J. Sci. Food Agri. 81:1199-1208.Martinsdottir, E. 1997. Sensory evaluation in research <strong>of</strong> fish freshness. In G. Olafsdottir,J. Luten, P. Dalgaard, M. Careche, V. Verrez-Bagnis, E. Martinsdottir, and K. Heia eds.,Methods to determine the freshness <strong>of</strong> fish in research and industry. Proceedings <strong>of</strong> theFinal Meeting <strong>of</strong> the Concerted Action “Evaluation <strong>of</strong> fish freshness” AIR3CT94 2283.Nantes Conference, France. 12-14 November 1997. International Institute <strong>of</strong>Refrigeration.Malcoim, C Bourne CM 2002. Food Texture and Viscosity: Concept and Measurement.Academic Press (2 nd edition), An Elsevier Imprint, London, UK.Mosffer, M., AL-Dagal, and Wael A.A. 1999. Extension <strong>of</strong> shelf life <strong>of</strong> whole and peeledshrimp with organic acid salts and bifidobacteria. Journal <strong>of</strong> Food Protction. 62(1):51-56.Murray, C.K. and J.M. Shewan, 1979. The microbial spoilage <strong>of</strong> fish with specialreference to the role <strong>of</strong> psychrotrophs. In: Russell, A.D. and R. Fuller eds. Cold tolerantmicrobes in spoilage and the environment. Academic Press.Nielsen, J. 1997. Sensory analysis <strong>of</strong> fish. In: Methods to determine the freshness <strong>of</strong> fishin research and industry. Proceedings <strong>of</strong> the final meeting <strong>of</strong> the concerted action‘Evaluation <strong>of</strong> fish freshness’ AIR3CT94 2283. Nantes, 12–14 November 1997. Paris,France: International Institute <strong>of</strong> Refrigeration.Norman, F.H. and Benjamin, K.S. 2000. Seafood Enzymes Utilization and Influence onPostharvest Seafood <strong>Quality</strong>. Marcel Dekker, Inc., New York.Olafsdottir,G. and Jonsdottir, R. 2003. Detection <strong>of</strong> volatile compounds by an electronicnose to monitor freshness <strong>of</strong> haddock stored in ice. First joint trains-Atlantic fisheriestechnology conference (FAFT) 33 rd WEFTA meeting and 48 th Atlantic fisheriestechnology conference. 11-14 June 2003, Reykjavik-Iceland.Olafsdottir,G., Xiuchen L., Lauzon, H. and Jonsdottir, R. 2002. Precision and application<strong>of</strong> electronic nose for freshness monitoring <strong>of</strong> whole redfish stored in ice and modifiedatmosphere bulk storage. Journal <strong>of</strong> Aquatic Food Prodct Technology 11(3/4):229-249.Olafsdottir,G., Martinsdottir, E., and Jonsson,E.H. 1997a. Rapid gas sensor measurementto determine spoilage <strong>of</strong> capelin (Mallotus villosus). J. Agric. Food Chem. 45(7):2654-2659.Olafsdottir,G., Hognadottir, A., and Martinsdottir,E. 1997b. Application <strong>of</strong> gas sensors toevaluate freshness and spoilage <strong>of</strong> various seafoods. In: Methods to Determine theFreshness <strong>of</strong> Fish in Research and Industry; IIR/IIF. Paris, France.Olafsdottir,G., Hognadottir, A., Martinsdottir, E., and Jonsdottir, H. 2000. Application <strong>of</strong>an electronic nose to predict total volatile bases in capelin (Mallotus villosus) forfishmeal production. J. Agric. Food Chem. 48(6):2353-2359.UNU-Fisheries Training Programme 43
QingzhuOlafsdottir,G., Martinsdottir, E., Oehlenschlager, J., Dalgaard, P., Jensen, B., Undeland,J., Mackie, I.M., Henehan, G., Nielsen, J., and Nilsen, H. 1997c. Methods to evaluatefish freshness in research and industry. Trends in Food Sci. & Tech. 8:258-265.Optimar: http://www.optimar.is. (28 th October, 2003).Project Summary, FDP 421-2, 2002. Canada: Product and Market Development <strong>of</strong> under55 count <strong>Shrimp</strong> (<strong>Pandalus</strong> <strong>borealis</strong>).Rogério, M., Ricardo, Q., Maria L.N. 2001. Changes in baseline levels <strong>of</strong> nucleotidesduring ice storage <strong>of</strong> fish and crustaceans from the Portuguese coast. Eur Food ResTechnol 212 :141–146.Schaller, E., Bosset, J.O., and Escher, F. 1998. Electronic noses and their application t<strong>of</strong>ood. Lebensm. - Wiss. U. - Technol., 31:305-316.Shamshad, S.I., K. Nisa, M.Riaz, R. Zuberi, 1990. Shelf life <strong>of</strong> shrimp (Penaeusmerguiensis) stored at different temperatures. J. Food Sci. 55:1201-1205.Shewan, J.M. 1961. The microbiology <strong>of</strong> sea water fish. In Borgstrum, G. ed. Fish asFood 1:487-9.Sigurgisladottir, S., Torrissen, O., Lie, O., Thomassen, M., and Hafsteinsson, H. 1997.Salmon quality: methods to determine the quality parameters. Reviews in FisheriesScience 5:1-30.Sivertsvik, M., Sosnes, J.T. and Kleiberg G.H. 2003. Effect <strong>of</strong> modified atmospherepackaging and superchilled storage on the microbial and sensory quality <strong>of</strong> Atlanticsalmon (Salmo salar) fillets. Journal <strong>of</strong> Food Science 68(4):1467-1472.Sveinsdottir, K., Hyldig, G., Martinsdottir, E., Jorgensen, B., Kristbergsson, K. 2003.<strong>Quality</strong> Index Method scheme developed for farmed salmon (Salmo salar). Food<strong>Quality</strong> and Preference 14:237-245.Szczesniak, A.S. 1963. Classification <strong>of</strong> texture characteristics. J. Food Sci 28:385-389.Uchiyama, H. and S. Ehira 1974. Relation between freshness and acid-solublenucleotides in aseptic cod and yellowtail muscles during ice storage. Bull. Tokai Reg.Fish. Lab. 78:23-31.Valdimarsson, G., Einarsson, H., Gudbjörnsdottir, B., and Magnusson, H. 1998.Microbiological quality <strong>of</strong> Icelandic cooked-peeled shrimp (<strong>Pandalus</strong> <strong>borealis</strong>).International Journal <strong>of</strong> Food Microbiology 45:157-161.Wold, S., Esbensen, K. and Geladi, P. 1987. Principal component analysis. Chemometricand Intelligent Laboratory Systems 2: 27-52.Yeh, L.T., L.B. Hau, 1988. Preservation <strong>of</strong> grass shrimp by low dosage radiation. J.Chinese Agric. Chem. Soc. 26:92-102.UNU-Fisheries Training Programme 44
QingzhuAPPENDIXAnalysis <strong>of</strong> Variance Report (Term significant at 95%, α=0.05)1. WHC: Analysis <strong>of</strong> Variance TableSource Sum <strong>of</strong> Mean Prob PowerTerm DF Squares Square F-Ratio Level(Alpha=0,05)A: Group 3 20,81317 6,937723 1,50 0,265172 0,298529S(A) 12 55,58823 4,632352Total (Adjusted) 15 76,40139Total 16Means and Effects SectionTerm Count Mean Standard Error EffectAll 16 90,10438 22,52609A: GroupLIQ/-1 4 91,5875 1,076145 69,06141S-ICE/-1 4 90,5075 1,076145 67,98141ICE/+1 4 88,4325 1,076145 65,9064LIQ/+1 4 89,89 1,076145 67,36391Duncan's Multiple-Comparison TestGroup Count Mean Different From GroupsICE/+1 4 88,4325LIQ/+1 4 89,89S-ICE/-1 4 90,5075LIQ/-1 4 91,58752. Sensory score: Analysis <strong>of</strong> Variance TableSource Sum <strong>of</strong> Mean Prob PowerTerm DF Squares Square F-Ratio Level(Alpha=0,05)A: Group 3 5,65625 1,885417 12,90 0,000018* 0,999388S(A) 28 4,09375 0,1462054Total (Adjusted) 31 9,75Total 32Means and Effects SectionTerm Count Mean Standard Error EffectAll 32 3,68750,4609375A: GroupLIQ/-1 8 4,28125 0,1351875 3,820313S-ICE/-1 8 3,65625 0,1351875 3,195313ICE/+1 8 3,09375 0,1351875 2,632813LIQ/+1 8 3,71875 0,1351875 3,257813Duncan's Multiple-Comparison TestGroup Count Mean Different From GroupsICE/+1 8 3,09375 S-ICE/-1, LIQ/+1, LIQ/-1S-ICE/-1 8 3,65625 ICE/+1, LIQ/-1LIQ/+1 8 3,71875 ICE/+1, LIQ/-1LIQ/-1 8 4,28125 ICE/+1, S-ICE/-1, LIQ/+13. WHC: Analysis <strong>of</strong> Variance TableSource Sum <strong>of</strong> Mean Prob PowerUNU-Fisheries Training Programme 45
QingzhuTerm DF Squares Square F-Ratio Level(Alpha=0,05)A: Groupxx 3 5,293719 1,764573 0,21 0,885434 0,079315S(A) 12 99,38853 8,282377Total (Adjusted) 15 104,6822Total 16Means and Effects SectionTerm Count Mean Standard Error EffectAll 16 89,03812 22,25953A: GroupxxLIQ/-4 4 89,0325 1,438956 66,77297S-ICE/-4 4 89,7775 1,438956 67,51797ICE/+4 4 88,1675 1,438956 65,90797LIQ/+4 4 89,175 1,438956 66,91547Duncan's Multiple-Comparison TestGroup Count Mean Different From GroupsICE/+4 4 88,1675LIQ/-4 4 89,0325LIQ/+4 4 89,175S-ICE/-4 4 89,77754. Sensory score: Analysis <strong>of</strong> Variance TableSource Sum <strong>of</strong> Mean Prob PowerTerm DF Squares Square F-Ratio Level(Alpha=0,05)A: Groupxx 3 18,81836 6,272787 35,97 0,000000* 1,000000S(A) 28 4,882813 0,1743862Total (Adjusted) 31 23,70117Total 32Means and Effects SectionTerm Count Mean Standard Error EffectAll 32 2,1640630,2705078A: GroupxxLIQ/-4 8 3,46875 0,1476424 3,198242S-ICE/-4 8 1,53125 0,1476424 1,260742ICE/+4 8 1,71875 0,1476424 1,448242LIQ/+4 8 1,9375 0,1476424 1,666992Duncan's Multiple-Comparison TestGroup Count Mean Different From GroupsS-ICE/-4 8 1,53125 LIQ/-4ICE/+4 8 1,71875 LIQ/-4LIQ/+4 8 1,9375 LIQ/-4LIQ/-4 8 3,46875 S-ICE/-4, ICE/+4, LIQ/+45. Hardness: Analysis <strong>of</strong> Variance TableSource Sum <strong>of</strong> Mean Prob PowerTerm DF Squares Square F-Ratio Level(Alpha=0,05)A: Groupxx 3 11,29872 3,766239 1,98 0,155272 0,419554S(A) 17 32,3389 1,902288Total (Adjusted) 20 43,63762Total 21Means and Effects SectionTerm Count Mean Standard Error EffectAll 21 8,057905 1,534598A: GroupxxLIQ/-4 5 6,8256 0,6168125 5,291002S-ICE/-4 5 8,7538 0,6168125 7,219202UNU-Fisheries Training Programme 46
QingzhuICE/+4 5 8,564 0,6168125 7,029402LIQ/+4 6 8,083167 0,5630702 6,548568Duncan's Multiple-Comparison TestGroup Count Mean Different From GroupsLIQ/-4 5 6,8256LIQ/+4 6 8,083167ICE/+4 5 8,564S-ICE/-4 5 8,75386. Springiness: Analysis <strong>of</strong> Variance TableSource Sum <strong>of</strong> Mean Prob PowerTerm DF Squares Square F-Ratio Level(Alpha=0,05)A: Groupxx 3 7,101219E-03 2,367073E-03 3,31 0,045426* 0,647164S(A) 17 1,217173E-02 7,159843E-04Total (Adjusted) 20 1,927295E-02Total 21Means and Effects SectionTerm Count Mean Standard Error EffectAll 21 0,63595240,1211651A: GroupxxLIQ/-4 5 0,6618 1,196649E-020,5406349S-ICE/-4 5 0,6408 1,196649E-020,5196349ICE/+4 5 0,6092 1,196649E-020,4880349LIQ/+4 6 0,6326666 1,092386E-020,5115016Duncan's Multiple-Comparison TestGroup Count Mean Different From GroupsICE/+4 5 0,6092 LIQ/-4LIQ/+4 6 0,6326666S-ICE/-4 5 0,6408LIQ/-4 5 0,6618 ICE/+47. Cohesiveness: Analysis <strong>of</strong> Variance TableSource Sum <strong>of</strong> Mean Prob PowerTerm DF Squares Square F-Ratio Level(Alpha=0,05)A: Groupxx 3 3,317738E-03 1,105913E-03 8,00 0,001529* 0,967328S(A) 17 0,0023495 1,382059E-04Total (Adjusted) 20 5,667238E-03Total 21Means and Effects SectionTerm Count Mean Standard Error EffectAll 21 0,32080956,108095E-02A: GroupxxLIQ/-4 5 0,3054 5,257488E-030,2443191S-ICE/-4 5 0,3138 5,257488E-03 0,252719ICE/+4 5 0,34 5,257488E-03 0,278919LIQ/+4 6 0,3235 4,799407E-03 0,262419Duncan's Multiple-Comparison TestGroup Count Mean Different From GroupsLIQ/-4 5 0,3054 ICE/+4S-ICE/-4 5 0,3138 ICE/+4UNU-Fisheries Training Programme 47
QingzhuLIQ/+4 6 0,3235 ICE/+4ICE/+4 5 0,34 LIQ/-4, S-ICE/-4, LIQ/+48. Resilience: Analysis <strong>of</strong> Variance TableSource Sum <strong>of</strong> Mean Prob PowerTerm DF Squares Square F-Ratio Level(Alpha=0,05)A: Groupxx 3 4,226805E-03 1,408935E-03 5,13 0,010413* 0,846469S(A) 17 4,668433E-03 2,746137E-04Total (Adjusted) 20 8,895238E-03Total 21Means and Effects SectionTerm Count Mean Standard Error EffectAll 21 0,30080955,722699E-02A: GroupxxLIQ/-4 5 0,279 7,410988E-03 0,221773S-ICE/-4 5 0,2968 7,410988E-03 0,239573ICE/+4 5 0,3178 7,410988E-03 0,260573LIQ/+4 6 0,3081667 6,765276E-030,2509397Duncan's Multiple-Comparison TestGroup Count Mean Different From GroupsLIQ/-4 5 0,279 LIQ/+4, ICE/+4S-ICE/-4 5 0,2968LIQ/+4 6 0,3081667 LIQ/-4ICE/+4 5 0,3178 LIQ/-49. WHC: Analysis <strong>of</strong> Variance TableSource Sum <strong>of</strong> Mean Prob PowerTerm DF Squares Square F-Ratio Level(Alpha=0,05)A: Groupx 3 9,205869 3,068623 0,59 0,634139 0,137715S(A) 12 62,57483 5,214569Total (Adjusted) 15 71,78069Total 16Means and Effects SectionTerm Count Mean Standard Error EffectAll 16 88,13937 22,03484A: GroupxLIQ/-6 4 87,46 1,141772 65,42516S-ICE/-6 4 89,1425 1,141772 67,10766ICE/+6 4 87,3525 1,141772 65,31766LIQ/+6 4 88,6025 1,141772 66,56766Duncan's Multiple-Comparison TestGroup Count Mean Different From GroupsICE/+6 4 87,3525LIQ/-6 4 87,46LIQ/+6 4 88,6025S-ICE/-6 4 89,142510. Sensory score: Analysis <strong>of</strong> Variance TableSource Sum <strong>of</strong> Mean Prob PowerTerm DF Squares Square F-Ratio Level(Alpha=0,05)A: Groupx 3 12,59961 4,19987 19,83 0,000000* 0,999998S(A) 28 5,929688 0,2117746UNU-Fisheries Training Programme 48
QingzhuTotal (Adjusted) 31 18,5293Total 32Means and Effects SectionTerm Count Mean Standard Error EffectAll 32 1,5703130,1962891A: GroupxLIQ/-6 8 2,5625 0,1627016 2,366211S-ICE/-6 8 1,0625 0,16270160,8662109ICE/+6 8 1 0,16270160,8037109LIQ/+6 8 1,65625 0,1627016 1,459961Duncan's Multiple-Comparison TestGroup Count Mean Different From GroupsICE/+6 8 1 LIQ/+6, LIQ/-6S-ICE/-6 8 1,0625 LIQ/+6, LIQ/-6LIQ/+6 8 1,65625 ICE/+6, S-ICE/-6, LIQ/-6LIQ/-6 8 2,5625 ICE/+6, S-ICE/-6, LIQ/+611. Hardness: Analysis <strong>of</strong> Variance TableAnalysis <strong>of</strong> Variance TableSource Sum <strong>of</strong> Mean Prob PowerTerm DF Squares Square F-Ratio Level(Alpha=0,05)A: Groupx 3 2,752417 0,9174722 1,18 0,342413 0,266855S(A) 19 14,72837 0,7751772Total (Adjusted) 22 17,48079Total 23Means and Effects SectionTerm Count Mean Standard Error EffectAll 23 7,297131 1,265981A: GroupxLIQ/-6 5 6,8714 0,3937454 5,605419S-ICE/-6 6 7,594167 0,3594387 6,328186ICE/+6 6 7,656 0,3594387 6,390019LIQ/+6 6 6,996 0,3594387 5,730019Duncan's Multiple-Comparison TestGroup Count Mean Different From GroupsLIQ/-6 5 6,8714LIQ/+6 6 6,996S-ICE/-6 6 7,594167ICE/+6 6 7,65612. Springiness: Analysis <strong>of</strong> Variance TableSource Sum <strong>of</strong> Mean Prob PowerTerm DF Squares Square F-Ratio Level(Alpha=0,05)A: Groupx 3 2,749613E-03 9,165377E-04 0,48 0,702833 0,128182S(A) 19 0,0366003 1,926332E-03Total (Adjusted) 22 3,934991E-02Total 23Means and Effects SectionTerm Count Mean Standard Error EffectAll 23 0,65078260,1132623A: GroupxLIQ/-6 5 0,6622 0,01962820,5489377UNU-Fisheries Training Programme 49
QingzhuS-ICE/-6 6 0,6618333 1,791801E-02 0,548571ICE/+6 6 0,6376666 1,791801E-020,5244043LIQ/+6 6 0,6433333 1,791801E-02 0,530071Duncan's Multiple-Comparison TestGroup Count Mean Different From GroupsICE/+6 6 0,6376666LIQ/+6 6 0,6433333S-ICE/-6 6 0,6618333LIQ/-6 5 0,662213. Cohesiveness: Analysis <strong>of</strong> Variance TableSource Sum <strong>of</strong> Mean Prob PowerTerm DF Squares Square F-Ratio Level(Alpha=0,05)A: Groupx 3 1,192286E-03 3,974285E-04 1,45 0,259706 0,321569S(A) 19 5,207367E-03 2,740719E-04Total (Adjusted) 22 6,399652E-03Total 23Means and Effects SectionTerm Count Mean Standard Error EffectAll 23 0,33243485,772899E-02A: GroupxLIQ/-6 5 0,3206 7,403674E-03 0,262871S-ICE/-6 6 0,334 6,758599E-03 0,276271ICE/+6 6 0,3413333 6,758599E-030,2836044LIQ/+6 6 0,3318333 6,758599E-030,2741044Duncan's Multiple-Comparison TestGroup Count Mean Different From GroupsLIQ/-6 5 0,3206LIQ/+6 6 0,3318333S-ICE/-6 6 0,334ICE/+6 6 0,341333314. Resilience: Analysis <strong>of</strong> Variance TableSource Sum <strong>of</strong> Mean Prob PowerTerm DF Squares Square F-Ratio Level(Alpha=0,05)A: Groupx 3 1,705619E-03 5,685396E-04 1,13 0,360434 0,256766S(A) 19 9,524033E-03 5,012649E-04Total (Adjusted) 22 1,122965E-02Total 23Means and Effects SectionTerm Count Mean Standard Error EffectAll 23 0,31056520,0538942A: GroupxLIQ/-6 5 0,2944 1,001264E-020,2405058S-ICE/-6 6 0,3145 9,140249E-030,2606058ICE/+6 6 0,317 9,140249E-030,2631058LIQ/+6 6 0,3136667 9,140249E-030,2597724Duncan's Multiple-Comparison TestUNU-Fisheries Training Programme 50
QingzhuGroup Count Mean Different From GroupsLIQ/-6 5 0,2944LIQ/+6 6 0,3136667S-ICE/-6 6 0,3145ICE/+6 6 0,31715. WHC: Analysis <strong>of</strong> Variance TableSource Sum <strong>of</strong> Mean Prob PowerTerm DF Squares Square F-Ratio Level(Alpha=0,05)A: Groupxxx 3 95,053 31,68433 4,89 0,019068* 0,785394S(A) 12 77,7713 6,480942Total (Adjusted) 15 172,8243Total 16Means and Effects SectionTerm Count Mean Standard Error EffectAll 16 89,3725 22,34312A: GroupxxxDay0 4 93,5375 1,272885 71,19437ICE/+1 4 88,4325 1,272885 66,08938ICE/+4 4 88,1675 1,272885 65,82437ICE/+6 4 87,3525 1,272885 65,00938Duncan's Multiple-Comparison TestGroup Count Mean Different From GroupsICE/+6 4 87,3525 Day0ICE/+4 4 88,1675 Day0ICE/+1 4 88,4325 Day0Day0 4 93,5375 ICE/+6, ICE/+4, ICE/+116. Sensory-score: Analysis <strong>of</strong> Variance TableSource Sum <strong>of</strong> Mean Prob PowerTerm DF Squares Square F-Ratio Level(Alpha=0,05)A: Groupxxx 3 52,84961 17,61654 215,49 0,000000* 1,000000S(A) 28 2,289063 8,175223E-02Total (Adjusted) 31 55,13867Total 32Means and Effects SectionTerm Count Mean Standard Error EffectAll 32 2,5390630,3173828A: GroupxxxDay0 8 4,34375 0,1010892 4,026367ICE/+1 8 3,09375 0,1010892 2,776367ICE/+4 8 1,71875 0,1010892 1,401367ICE/+6 8 1 0,10108920,6826172Duncan's Multiple-Comparison TestGroup Count Mean Different From GroupsICE/+6 8 1 ICE/+4, ICE/+1, Day0ICE/+4 8 1,71875 ICE/+6, ICE/+1, Day0ICE/+1 8 3,09375 ICE/+6, ICE/+4, Day0Day0 8 4,34375 ICE/+6, ICE/+4, ICE/+117. Hardness: Analysis <strong>of</strong> Variance TableSource Sum <strong>of</strong> Mean Prob PowerUNU-Fisheries Training Programme 51
QingzhuTerm DF Squares Square F-Ratio Level(Alpha=0,05)A: Groupxxx 3 9,176114 3,058705 2,27 0,111335 0,489230S(A) 20 26,92393 1,346196Total (Adjusted) 23 36,10004Total 24Means and Effects SectionTerm Count Mean Standard Error EffectAll 24 7,485833 1,257639A: GroupxxxDay0 8 7,029125 0,4102128 5,771486ICE/+1 5 6,9342 0,5188827 5,676561ICE/+4 5 8,564 0,5188827 7,306362ICE/+6 6 7,656 0,4736729 6,398362Duncan's Multiple-Comparison TestGroup Count Mean Different From GroupsICE/+1 5 6,9342Day0 8 7,029125ICE/+6 6 7,656ICE/+4 5 8,56418. Springiness: Analysis <strong>of</strong> Variance TableSource Sum <strong>of</strong> Mean Prob PowerTerm DF Squares Square F-Ratio Level(Alpha=0,05)A: Groupxxx 3 2,292863E-02 7,642875E-03 4,61 0,013137* 0,817213S(A) 20 3,317721E-02 1,65886E-03Total (Adjusted) 23 5,610583E-02Total 24Means and Effects SectionTerm Count Mean Standard Error EffectAll 24 0,64808330,1070684A: GroupxxxDay0 8 0,689375 1,439992E-020,5823066ICE/+1 5 0,6334 1,821461E-020,5263316ICE/+4 5 0,6092 1,821461E-020,5021316ICE/+6 6 0,6376666 1,662759E-020,5305983Duncan's Multiple-Comparison TestGroup Count Mean Different From GroupsICE/+4 5 0,6092 Day0ICE/+1 5 0,6334ICE/+6 6 0,6376666 Day0Day0 8 0,689375 ICE/+4, ICE/+619. Cohesiveness: Analysis <strong>of</strong> Variance TableSource Sum <strong>of</strong> Mean Prob PowerTerm DF Squares Square F-Ratio Level(Alpha=0,05)A: Groupxxx 3 3,149667E-03 1,049889E-03 3,89 0,024302* 0,741699S(A) 20 5,396833E-03 2,698417E-04Total (Adjusted) 23 0,0085465Total 24Means and Effects SectionTerm Count Mean Standard Error EffectUNU-Fisheries Training Programme 52
QingzhuAll 24 0,345750,0572743A: GroupxxxDay0 8 0,36125 5,807771E-030,3039757ICE/+1 5 0,332 7,346314E-030,2747257ICE/+4 5 0,34 7,346314E-030,2827257ICE/+6 6 0,3413333 6,706237E-03 0,284059Duncan's Multiple-Comparison TestGroup Count Mean Different From GroupsICE/+1 5 0,332 Day0ICE/+4 5 0,34ICE/+6 6 0,3413333Day0 8 0,36125 ICE/+120. Resilience: Analysis <strong>of</strong> Variance TableSource Sum <strong>of</strong> Mean Prob PowerTerm DF Squares Square F-Ratio Level(Alpha=0,05)A: Groupxxx 3 2,639333E-03 8,797778E-04 1,48 0,249922 0,330939S(A) 20 0,01188 0,000594Total (Adjusted) 23 1,451933E-02Total 24Means and Effects SectionTerm Count Mean Standard Error EffectAll 24 0,32116675,321667E-02A: GroupxxxDay0 8 0,335 8,616844E-030,2817833ICE/+1 5 0,3074 1,089954E-020,2541833ICE/+4 5 0,3178 1,089954E-020,2645833ICE/+6 6 0,317 9,949874E-030,2637833Duncan's Multiple-Comparison TestGroup Count Mean Different From GroupsICE/+1 5 0,3074ICE/+6 6 0,317ICE/+4 5 0,3178Day0 8 0,33521. WHC: Analysis <strong>of</strong> Variance TableSource Sum <strong>of</strong> Mean Prob PowerTerm DF Squares Square F-Ratio Level(Alpha=0,05)A: Groupxxxx 3 59,18652 19,72884 3,27 0,058965 0,596759S(A) 12 72,36945 6,030787Total (Adjusted) 15 131,556Total 16Means and Effects SectionTerm Count Mean Standard Error EffectAll 16 90,30125 22,57531A: GroupxxxxDay0 4 93,5375 1,227883 70,96219LIQ/+1 4 89,89 1,227883 67,31469UNU-Fisheries Training Programme 53
QingzhuLIQ/+4 4 89,175 1,227883 66,59969LIQ/+6 4 88,6025 1,227883 66,02719Duncan's Multiple-Comparison TestGroup Count Mean Different From GroupsLIQ/+6 4 88,6025LIQ/+4 4 89,175LIQ/+1 4 89,89Day0 4 93,537522. Sensory score: Analysis <strong>of</strong> Variance TableSource Sum <strong>of</strong> Mean Prob PowerTerm DF Squares Square F-Ratio Level(Alpha=0,05)A: Groupxxxx 3 41,81836 13,93945 62,37 0,000000* 1,000000S(A) 28 6,257813 0,2234933Total (Adjusted) 31 48,07617Total 32Means and Effects SectionTerm Count Mean Standard Error EffectAll 32 2,9140630,3642578A: GroupxxxxDay0 8 4,34375 0,1671426 3,979492LIQ/+1 8 3,71875 0,1671426 3,354492LIQ/+4 8 1,9375 0,1671426 1,573242LIQ/+6 8 1,65625 0,1671426 1,291992Duncan's Multiple-Comparison TestGroup Count Mean Different From GroupsLIQ/+6 8 1,65625 LIQ/+1, Day0LIQ/+4 8 1,9375 LIQ/+1, Day0LIQ/+1 8 3,71875 LIQ/+6, LIQ/+4, Day0Day0 8 4,34375 LIQ/+6, LIQ/+4, LIQ/+123. Hardness: Analysis <strong>of</strong> Variance TableSource Sum <strong>of</strong> Mean Prob PowerTerm DF Squares Square F-Ratio Level(Alpha=0,05)A: Groupxxxx 3 9,41386 3,137954 1,38 0,275680 0,313014S(A) 21 47,67176 2,270084Total (Adjusted) 24 57,08562Total 25Means and Effects SectionTerm Count Mean Standard Error EffectAll 25 7,55028 1,220724A: GroupxxxxDay0 8 7,029125 0,5326918 5,808401LIQ/+1 5 8,4098 0,6738077 7,189076LIQ/+4 6 8,083167 0,6150994 6,862443LIQ/+6 6 6,996 0,6150994 5,775276Duncan's Multiple-Comparison TestGroup Count Mean Different From GroupsLIQ/+6 6 6,996Day0 8 7,029125LIQ/+4 6 8,083167LIQ/+1 5 8,409824. Springiness: Analysis <strong>of</strong> Variance TableUNU-Fisheries Training Programme 54
QingzhuSource Sum <strong>of</strong> Mean Prob PowerTerm DF Squares Square F-Ratio Level(Alpha=0,05)A: Groupxxxx 3 1,939442E-02 6,464806E-03 4,66 0,011938* 0,826195S(A) 21 2,911174E-02 1,386273E-03Total (Adjusted) 24 4,850616E-02Total 25Means and Effects SectionTerm Count Mean Standard Error EffectAll 25 0,65056 0,103359A: GroupxxxxDay0 8 0,689375 1,316374E-02 0,586016LIQ/+1 5 0,6186 1,665097E-02 0,515241LIQ/+4 6 0,6326666 1,520018E-020,5293077LIQ/+6 6 0,6433333 1,520018E-020,5399743Duncan's Multiple-Comparison TestGroup Count Mean Different From GroupsLIQ/+1 5 0,6186 Day0LIQ/+4 6 0,6326666 Day0LIQ/+6 6 0,6433333 Day0Day0 8 0,689375 LIQ/+1, LIQ/+4, LIQ/+625. Cohesiveness: Analysis <strong>of</strong> Variance TableSource Sum <strong>of</strong> Mean Prob PowerTerm DF Squares Square F-Ratio Level(Alpha=0,05)A: Groupxxxx 3 5,655607E-03 1,885202E-03 9,83 0,000298* 0,991853S(A) 21 4,028633E-03 1,918397E-04Total (Adjusted) 24 9,68424E-03Total 25Means and Effects SectionTerm Count Mean Standard Error EffectAll 25 0,340525,419133E-02A: GroupxxxxDay0 8 0,36125 4,896934E-030,3070587LIQ/+1 5 0,3382 6,194186E-030,2840087LIQ/+4 6 0,3235 5,654492E-030,2693087LIQ/+6 6 0,3318333 5,654492E-03 0,277642Duncan's Multiple-Comparison TestGroup Count Mean Different From GroupsLIQ/+4 6 0,3235 Day0LIQ/+6 6 0,3318333 Day0LIQ/+1 5 0,3382 Day0Day0 8 0,36125 LIQ/+4, LIQ/+6, LIQ/+126. Resilience: Analysis <strong>of</strong> Variance TableSource Sum <strong>of</strong> Mean Prob PowerTerm DF Squares Square F-Ratio Level(Alpha=0,05)A: Groupxxxx 3 2,883193E-03 9,610644E-04 2,78 0,066118 0,585438S(A) 21 7,252167E-03 3,453413E-04Total (Adjusted) 24 1,013536E-02Total 25UNU-Fisheries Training Programme 55
QingzhuMeans and Effects SectionTerm Count Mean Standard Error EffectAll 25 0,320845,115333E-02A: GroupxxxxDay0 8 0,335 6,57021E-030,2838467LIQ/+1 5 0,322 8,310732E-030,2708467LIQ/+4 6 0,3081667 7,586625E-030,2570133LIQ/+6 6 0,3136667 7,586625E-030,2625133Duncan's Multiple-Comparison TestGroup Count Mean Different From GroupsLIQ/+4 6 0,3081667LIQ/+6 6 0,3136667LIQ/+1 5 0,322Day0 8 0,33527. WHC: Analysis <strong>of</strong> Variance TableSource Sum <strong>of</strong> Mean Prob PowerTerm DF Squares Square F-Ratio Level(Alpha=0,05)A: Groupxxxxx 3 45,43388 15,14462 3,11 0,066611 0,573514S(A) 12 58,3797 4,864975Total (Adjusted) 15 103,8136Total 16Means and Effects SectionTerm Count Mean Standard Error EffectAll 16 90,74125 22,68531A: GroupxxxxxDay0 4 93,5375 1,102834 70,85219S-ICE/-1 4 90,5075 1,102834 67,82219S-ICE/-4 4 89,7775 1,102834 67,09219S-ICE/-6 4 89,1425 1,102834 66,45718Duncan's Multiple-Comparison TestGroup Count Mean Different From GroupsS-ICE/-6 4 89,1425S-ICE/-4 4 89,7775S-ICE/-1 4 90,5075Day0 4 93,537528. Sensory score: Analysis <strong>of</strong> Variance TableSource Sum <strong>of</strong> Mean Prob PowerTerm DF Squares Square F-Ratio Level(Alpha=0,05)A: Groupxxxxx 3 61,22461 20,4082 157,30 0,000000* 1,000000S(A) 28 3,632813 0,1297433Total (Adjusted) 31 64,85742Total 32Means and Effects SectionTerm Count Mean Standard Error EffectAll 32 2,6484380,3310547A: GroupxxxxxDay0 8 4,34375 0,1273496 4,012695S-ICE/-1 8 3,65625 0,1273496 3,325195S-ICE/-4 8 1,53125 0,1273496 1,200195UNU-Fisheries Training Programme 56
QingzhuS-ICE/-6 8 1,0625 0,12734960,7314453Duncan's Multiple-Comparison TestGroup Count Mean Different From GroupsS-ICE/-6 8 1,0625 S-ICE/-4, S-ICE/-1, Day0S-ICE/-4 8 1,53125 S-ICE/-6, S-ICE/-1, Day0S-ICE/-1 8 3,65625 S-ICE/-6, S-ICE/-4, Day0Day0 8 4,34375 S-ICE/-6, S-ICE/-4, S-ICE/-129. Hardness: Analysis <strong>of</strong> Variance TableSource Sum <strong>of</strong> Mean Prob PowerTerm DF Squares Square F-Ratio Level(Alpha=0,05)A: Groupxxxxx 3 11,72916 3,90972 2,30 0,106552 0,498799S(A) 21 35,66951 1,698548Total (Adjusted) 24 47,39867Total 25Means and Effects SectionTerm Count Mean Standard Error EffectAll 25 7,4824 1,211704A: GroupxxxxxDay0 8 7,029125 0,4607804 5,817421S-ICE/-1 6 6,9155 0,5320633 5,703796S-ICE/-4 5 8,7538 0,5828462 7,542096S-ICE/-6 6 7,594167 0,5320633 6,382463Duncan's Multiple-Comparison TestGroup Count Mean Different From GroupsS-ICE/-1 6 6,9155Day0 8 7,029125S-ICE/-6 6 7,594167S-ICE/-4 5 8,753830. Springiness: Analysis <strong>of</strong> Variance TableSource Sum <strong>of</strong> Mean Prob PowerTerm DF Squares Square F-Ratio Level(Alpha=0,05)A: Groupxxxxx 3 1,029595E-02 3,431984E-03 1,71 0,196072 0,380698S(A) 21 4,221101E-02 2,010048E-03Total (Adjusted) 24 5,250696E-02Total 25Means and Effects SectionTerm Count Mean Standard Error EffectAll 25 0,662040,1054203A: GroupxxxxxDay0 8 0,689375 1,585106E-020,5839547S-ICE/-1 6 0,6435 1,830322E-020,5380797S-ICE/-4 5 0,6408 2,005018E-020,5353796S-ICE/-6 6 0,6618333 1,830322E-02 0,556413Duncan's Multiple-Comparison TestGroup Count Mean Different From GroupsS-ICE/-4 5 0,6408S-ICE/-1 6 0,6435S-ICE/-6 6 0,6618333Day0 8 0,689375UNU-Fisheries Training Programme 57
Qingzhu31. Cohesiveness: Analysis <strong>of</strong> Variance TableSource Sum <strong>of</strong> Mean Prob PowerTerm DF Squares Square F-Ratio Level(Alpha=0,05)A: Groupxxxxx 3 1,192711E-02 3,975702E-03 10,46 0,000205* 0,994635S(A) 21 7,985134E-03 3,802445E-04Total (Adjusted) 24 1,991224E-02Total 25Means and Effects SectionTerm Count Mean Standard Error EffectAll 25 0,332485,268867E-02A: GroupxxxxxDay0 8 0,36125 6,894241E-030,3085613S-ICE/-1 6 0,3081667 7,960783E-03 0,255478S-ICE/-4 5 0,3138 8,720601E-030,2611113S-ICE/-6 6 0,334 7,960783E-030,2813113Duncan's Multiple-Comparison TestGroup Count Mean Different From GroupsS-ICE/-1 6 0,3081667 Day0S-ICE/-4 5 0,3138 Day0S-ICE/-6 6 0,334 Day0Day0 8 0,36125 S-ICE/-1, S-ICE/-4, S-ICE/-632. Resilience: Analysis <strong>of</strong> Variance TableSource Sum <strong>of</strong> Mean Prob PowerTerm DF Squares Square F-Ratio Level(Alpha=0,05)A: Groupxxxxx 3 9,486627E-03 3,162209E-03 4,64 0,012203* 0,823901S(A) 21 1,431913E-02 6,818635E-04Total (Adjusted) 24 2,380576E-02Total 25Means and Effects SectionTerm Count Mean Standard Error EffectAll 25 0,310644,928533E-02A: GroupxxxxxDay0 8 0,335 9,232169E-030,2857147S-ICE/-1 6 0,2858333 1,066039E-02 0,236548S-ICE/-4 5 0,2968 1,167787E-020,2475147S-ICE/-6 6 0,3145 1,066039E-020,2652147Duncan's Multiple-Comparison TestGroup Count Mean Different From GroupsS-ICE/-1 6 0,2858333 Day0S-ICE/-4 5 0,2968 Day0S-ICE/-6 6 0,3145Day0 8 0,335 S-ICE/-1, S-ICE/-433. WHC: Analysis <strong>of</strong> Variance TableSource Sum <strong>of</strong> Mean Prob PowerUNU-Fisheries Training Programme 58
QingzhuTerm DF Squares Square F-Ratio Level(Alpha=0,05)A: Groupxxxxxx 3 87,07057 29,02352 10,75 0,001020* 0,987920S(A) 12 32,38662 2,698885Total (Adjusted) 15 119,4572Total 16Means and Effects SectionTerm Count Mean Standard Error EffectAll 16 90,40437 22,60109A: GroupxxxxxxDay0 4 93,5375 0,8214142 70,93641LIQ/-1 4 91,5875 0,8214142 68,9864LIQ/-4 4 89,0325 0,8214142 66,4314LIQ/-6 4 87,46 0,8214142 64,85891Duncan's Multiple-Comparison TestGroup Count Mean Different From GroupsLIQ/-6 4 87,46 LIQ/-1, Day0LIQ/-4 4 89,0325 LIQ/-1, Day0LIQ/-1 4 91,5875 LIQ/-6, LIQ/-4Day0 4 93,5375 LIQ/-6, LIQ/-434. Sensory score: Analysis <strong>of</strong> Variance TableSource Sum <strong>of</strong> Mean Prob PowerTerm DF Squares Square F-Ratio Level(Alpha=0,05)A: Groupxxxxxx 3 16,75586 5,585287 19,08 0,000001* 0,999996S(A) 28 8,195313 0,2926897Total (Adjusted) 31 24,95117Total 32Means and Effects SectionTerm Count Mean Standard Error EffectAll 32 3,6640630,4580078A: GroupxxxxxxDay0 8 4,34375 0,1912752 3,885742LIQ/-1 8 4,28125 0,1912752 3,823242LIQ/-4 8 3,46875 0,1912752 3,010742LIQ/-6 8 2,5625 0,1912752 2,104492Duncan's Multiple-Comparison TestGroup Count Mean Different From GroupsLIQ/-6 8 2,5625 LIQ/-4, LIQ/-1, Day0LIQ/-4 8 3,46875 LIQ/-6, LIQ/-1, Day0LIQ/-1 8 4,28125 LIQ/-6, LIQ/-4Day0 8 4,34375 LIQ/-6, LIQ/-435. Hardness: Analysis <strong>of</strong> Variance TableSource Sum <strong>of</strong> Mean Prob PowerTerm DF Squares Square F-Ratio Level(Alpha=0,05)A: Groupxxxxxx 3 6,048713 2,016238 0,75 0,536361 0,180822S(A) 20 53,92981 2,696491Total (Adjusted) 23 59,97852Total 24Means and Effects SectionTerm Count Mean Standard Error EffectAll 24 7,215 1,199991A: GroupxxxxxxDay0 8 7,029125 0,5805698 5,829134LIQ/-1 6 8,073667 0,6703843 6,873675UNU-Fisheries Training Programme 59
QingzhuLIQ/-4 5 6,8256 0,7343692 5,625608LIQ/-6 5 6,8714 0,7343692 5,671409Duncan's Multiple-Comparison TestGroup Count Mean Different From GroupsLIQ/-4 5 6,8256LIQ/-6 5 6,8714Day0 8 7,029125LIQ/-1 6 8,07366736. Springiness: Analysis <strong>of</strong> Variance TableSource Sum <strong>of</strong> Mean Prob PowerTerm DF Squares Square F-Ratio Level(Alpha=0,05)A: Groupxxxxxx 3 3,35215E-03 1,117383E-03 0,74 0,538245 0,180146S(A) 20 3,002547E-02 1,501274E-03Total (Adjusted) 23 3,337763E-02Total 24Means and Effects SectionTerm Count Mean Standard Error EffectAll 24 0,6736250,1118906A: GroupxxxxxxDay0 8 0,689375 1,369888E-020,5774844LIQ/-1 6 0,672 0,01581810,5601094LIQ/-4 5 0,6618 1,732786E-020,5499094LIQ/-6 5 0,6622 1,732786E-020,5503094Duncan's Multiple-Comparison TestGroup Count Mean Different From GroupsLIQ/-4 5 0,6618LIQ/-6 5 0,6622LIQ/-1 6 0,672Day0 8 0,68937537. Cohesiveness: Analysis <strong>of</strong> Variance TableSource Sum <strong>of</strong> Mean Prob PowerTerm DF Squares Square F-Ratio Level(Alpha=0,05)A: Groupxxxxxx 3 1,129356E-02 3,764519E-03 12,04 0,000101* 0,998023S(A) 20 0,0062534 3,1267E-04Total (Adjusted) 23 1,754696E-02Total 24Means and Effects SectionTerm Count Mean Standard Error EffectAll 24 0,33670835,544792E-02A: GroupxxxxxxDay0 8 0,36125 0,00625170,3058021LIQ/-1 6 0,3435 7,218841E-030,2880521LIQ/-4 5 0,3054 7,907844E-030,2499521LIQ/-6 5 0,3206 7,907844E-030,2651521Duncan's Multiple-Comparison TestUNU-Fisheries Training Programme 60
QingzhuGroup Count Mean Different From GroupsLIQ/-4 5 0,3054 LIQ/-1, Day0LIQ/-6 5 0,3206 LIQ/-1, Day0LIQ/-1 6 0,3435 LIQ/-4, LIQ/-6Day0 8 0,36125 LIQ/-4, LIQ/-638. Resilience: Analysis <strong>of</strong> Variance TableSource Sum <strong>of</strong> Mean Prob PowerTerm DF Squares Square F-Ratio Level(Alpha=0,05)A: Groupxxxxxx 3 0,0141613 4,720433E-03 12,19 0,000093* 0,998223S(A) 20 7,742033E-03 3,871017E-04Total (Adjusted) 23 2,190333E-02Total 24Means and Effects SectionTerm Count Mean Standard Error EffectAll 24 0,31483335,180139E-02A: GroupxxxxxxDay0 8 0,335 6,956127E-030,2831986LIQ/-1 6 0,3348333 8,032244E-030,2830319LIQ/-4 5 0,279 8,798882E-030,2271986LIQ/-6 5 0,2944 8,798882E-030,2425986Duncan's Multiple-Comparison TestGroup Count Mean Different From GroupsLIQ/-4 5 0,279 LIQ/-1, Day0LIQ/-6 5 0,2944 LIQ/-1, Day0LIQ/-1 6 0,3348333 LIQ/-4, LIQ/-6Day0 8 0,335 LIQ/-4, LIQ/-639. Hardness: Analysis <strong>of</strong> Variance TableSource Sum <strong>of</strong> Mean Prob PowerTerm DF Squares Square F-Ratio Level(Alpha=0,05)A: Group 3 9,63923 3,213077 0,84 0,488271 0,196269S(A) 18 68,63681 3,813156Total (Adjusted) 21 78,27604Total 22Means and Effects SectionTerm Count Mean Standard Error EffectAll 22 7,575227 1,37878A: GroupLIQ/-1 6 8,073667 0,7971989 6,694886S-ICE/-1 6 6,9155 0,7971989 5,53672ICE/+1 5 6,9342 0,8732876 5,55542LIQ/+1 5 8,4098 0,8732876 7,03102Duncan's Multiple-Comparison TestGroup Count Mean Different From GroupsS-ICE/-1 6 6,9155ICE/+1 5 6,9342LIQ/-1 6 8,073667LIQ/+1 5 8,409840. Springiness: Analysis <strong>of</strong> Variance TableUNU-Fisheries Training Programme 61
QingzhuSource Sum <strong>of</strong> Mean Prob PowerTerm DF Squares Square F-Ratio Level(Alpha=0,05)A: Group 3 8,482873E-03 2,827624E-03 2,06 0,141994 0,439110S(A) 18 0,0247539 1,375217E-03Total (Adjusted) 21 3,323677E-02Total 22Means and Effects SectionTerm Count Mean Standard Error EffectAll 22 0,64331820,1167045A: GroupLIQ/-1 6 0,672 1,513944E-020,5552955S-ICE/-1 6 0,6435 1,513944E-020,5267954ICE/+1 5 0,6334 1,658443E-020,5166954LIQ/+1 5 0,6186 1,658443E-020,5018954Duncan's Multiple-Comparison TestGroup Count Mean Different From GroupsLIQ/+1 5 0,6186ICE/+1 5 0,6334S-ICE/-1 6 0,6435LIQ/-1 6 0,67241. Cohesiveness: Analysis <strong>of</strong> Variance TableSource Sum <strong>of</strong> Mean Prob PowerTerm DF Squares Square F-Ratio Level(Alpha=0,05)A: Group 3 4,309821E-03 1,436607E-03 2,83 0,067395 0,579530S(A) 18 9,125133E-03 5,069518E-04Total (Adjusted) 21 1,343495E-02Total 22Means and Effects SectionTerm Count Mean Standard Error EffectAll 22 0,33004556,008485E-02A: GroupLIQ/-1 6 0,3435 9,191952E-030,2834151S-ICE/-1 6 0,3081667 9,191952E-030,2480818ICE/+1 5 0,332 1,006928E-020,2719151LIQ/+1 5 0,3382 1,006928E-020,2781152Duncan's Multiple-Comparison TestGroup Count Mean Different From GroupsS-ICE/-1 6 0,3081667ICE/+1 5 0,332LIQ/+1 5 0,3382LIQ/-1 6 0,343542. Resilience: Analysis <strong>of</strong> Variance TableSource Sum <strong>of</strong> Mean Prob PowerUNU-Fisheries Training Programme 62
QingzhuTerm DF Squares Square F-Ratio Level(Alpha=0,05)A: Group 3 7,839906E-03 2,613302E-03 2,94 0,061190 0,596667S(A) 18 1,600887E-02 8,893815E-04Total (Adjusted) 21 2,384877E-02Total 22Means and Effects SectionTerm Count Mean Standard Error EffectAll 22 0,31231825,682121E-02A: GroupLIQ/-1 6 0,3348333 1,217498E-020,2780121S-ICE/-1 6 0,2858333 1,217498E-020,2290121ICE/+1 5 0,3074 1,333703E-020,2505788LIQ/+1 5 0,322 1,333703E-020,2651788Duncan's Multiple-Comparison TestGroup Count Mean Different From GroupsS-ICE/-1 6 0,2858333ICE/+1 5 0,3074LIQ/+1 5 0,322LIQ/-1 6 0,3348333UNU-Fisheries Training Programme 63