Toronto Hydro - Ontario Energy Board
Toronto Hydro - Ontario Energy Board
Toronto Hydro - Ontario Energy Board

Create successful ePaper yourself
Turn your PDF publications into a flip-book with our unique Google optimized e-Paper software.
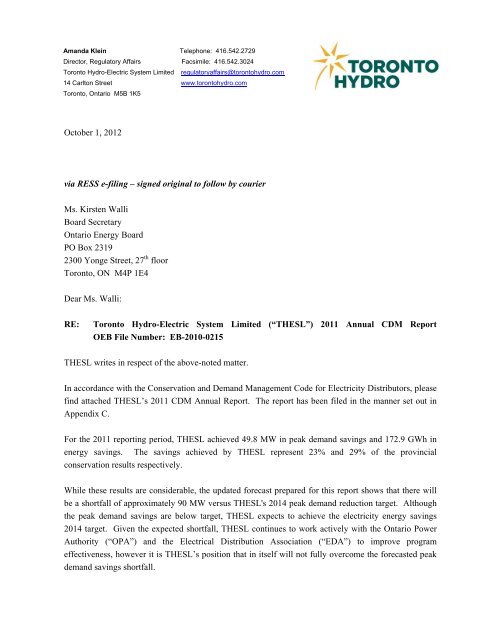
Amanda Klein Telephone: 416.542.2729<br />
Director, Regulatory Affairs Facsimile: 416.542.3024<br />
<strong>Toronto</strong> <strong>Hydro</strong>-Electric System Limited regulatoryaffairs@torontohydro.com<br />
14 Carlton Street www.torontohydro.com<br />
<strong>Toronto</strong>, <strong>Ontario</strong> M5B 1K5<br />
October 1, 2012<br />
via RESS e-filing – signed original to follow by courier<br />
Ms. Kirsten Walli<br />
<strong>Board</strong> Secretary<br />
<strong>Ontario</strong> <strong>Energy</strong> <strong>Board</strong><br />
PO Box 2319<br />
2300 Yonge Street, 27 th floor<br />
<strong>Toronto</strong>, ON M4P 1E4<br />
Dear Ms. Walli:<br />
RE:<br />
<strong>Toronto</strong> <strong>Hydro</strong>-Electric System Limited (“THESL”) 2011 Annual CDM Report<br />
OEB File Number: EB-2010-0215<br />
THESL writes in respect of the above-noted matter.<br />
In accordance with the Conservation and Demand Management Code for Electricity Distributors, please<br />
find attached THESL’s 2011 CDM Annual Report. The report has been filed in the manner set out in<br />
Appendix C.<br />
For the 2011 reporting period, THESL achieved 49.8 MW in peak demand savings and 172.9 GWh in<br />
energy savings. The savings achieved by THESL represent 23% and 29% of the provincial<br />
conservation results respectively.<br />
While these results are considerable, the updated forecast prepared for this report shows that there will<br />
be a shortfall of approximately 90 MW versus THESL's 2014 peak demand reduction target. Although<br />
the peak demand savings are below target, THESL expects to achieve the electricity energy savings<br />
2014 target. Given the expected shortfall, THESL continues to work actively with the <strong>Ontario</strong> Power<br />
Authority (“OPA”) and the Electrical Distribution Association (“EDA”) to improve program<br />
effectiveness, however it is THESL’s position that in itself will not fully overcome the forecasted peak<br />
demand savings shortfall.
As the 2011-2014 program term end date is approaching, THESL submits to the <strong>Board</strong> that the peak<br />
demand savings shortfall will need to be addressed quickly through the introduction of new programs in<br />
2012 and consideration be given to an extension of the program delivery timeframe.<br />
In presenting its results and revising its savings forecast, THESL has analyzed various options that<br />
could help reduce its shortfall and mitigate the risk of failing to achieve the peak demand savings target.<br />
THESL would be pleased to discuss these options with the OEB.<br />
If further information regarding the Annual Report is required or the OEB wishes to discuss the options<br />
mentioned above please contact Mr. Chris Tyrrell, Vice-President, Customer Care and Chief<br />
Conservation Officer directly at 416-542-3143 or at ctyrrell@torontohydro.com.<br />
Sincerely,<br />
[original signed by]<br />
Amanda<br />
Director, Regulatory Affairs<br />
<strong>Toronto</strong> <strong>Hydro</strong>-Electric System Limited<br />
regulatoryaffairs@torontohydro.com<br />
Klein<br />
:AK/TP/acc<br />
cc:<br />
Chris Tyrrell, Vice-President, Customer Care<br />
page 2
<strong>Toronto</strong> <strong>Hydro</strong>-Electric System Limited<br />
Conservation and Demand Management<br />
2011 Annual Report<br />
Submitted to:<br />
<strong>Ontario</strong> <strong>Energy</strong> <strong>Board</strong><br />
Submitted on September 30, 2012
TABLE OF CONTENTS<br />
BACKGROUND .................................................................................................................... 2<br />
EXECUTIVE SUMMARY ........................................................................................................ 3<br />
1 BOARD-APPROVED CDM PROGRAMS ........................................................................ 6<br />
1.1 INTRODUCTION ..................................................................................................... 6<br />
1.2 TOU IMPLEMENTATION ......................................................................................... 6<br />
2 OPA-CONTRACTED PROVINCE-WIDE CDM PROGRAMS ............................................. 8<br />
2.1 CONSUMER PROGRAM – RESIDENTIAL MARKET ................................................... 9<br />
2.2 BUSINESS PROGRAM – COMMERCIAL AND INSTITUTIONAL MARKETS ................... 13<br />
2.3 INDUSTRIAL PROGRAM – INDUSTRIAL MARKET .................................................... 18<br />
2.4 HOME ASSISTANCE PROGRAM – INCOME QUALIFIED RESIDENTIAL MARKET ........ 22<br />
3 SUMMARY OF INITIATIVE PENETRATION AND RESULTS ............................................. 24<br />
3.1 PROGRAM PARTICIPATION .................................................................................. 24<br />
3.2 PROGRAM SPENDING ......................................................................................... 25<br />
3.3 SAVINGS RESULTS ............................................................................................. 26<br />
4 COMBINED CDM REPORTING ELEMENTS ................................................................. 27<br />
4.1 PROGRESS TOWARDS CDM TARGETS ................................................................ 27<br />
4.2 THESL’S CDM OUTLOOK (2012-2014).............................................................. 28<br />
4.3 CDM STRATEGY MODIFICATIONS ........................................................................ 28<br />
4.4 CONCLUSION ...................................................................................................... 29<br />
APPENDIX A: EVALUATION FINDINGS FOR THE OPA PROGRAMS ................................... 30
Background<br />
On March 31, 2010, the Minister of <strong>Energy</strong> and Infrastructure of <strong>Ontario</strong>, under the guidance of<br />
sections 27.1 and 27.2 of the <strong>Ontario</strong> <strong>Energy</strong> <strong>Board</strong> Act, 1998, directed the <strong>Ontario</strong> <strong>Energy</strong> <strong>Board</strong><br />
(”OEB”) to establish Conservation and Demand Management (“CDM”) targets to be met by local<br />
electricity distributors (“LDCs”). Accordingly, on November 12, 2010, the OEB amended the<br />
distribution licence of <strong>Toronto</strong> <strong>Hydro</strong>-Electric System Limited (“THESL”) requiring THESL, as a<br />
condition of its licence, to achieve 286 MW of net annual peak demand savings and 1,304 GWh of net<br />
cumulative electricity energy savings, over the period beginning January 1, 2011 and ending<br />
December 31, 2014.<br />
In accordance with the same Minister’s directive, on September 16, 2010 the OEB issued the<br />
Conservation and Demand Management Code for Electricity Distributors (the “CDM Code”). The CDM<br />
Code sets out the obligations and requirements with which LDCs must comply in relation to the CDM<br />
targets set out in their licences. As part of the CDM Code an LDC is required to file an annual report.<br />
This Annual Report is prepared accordingly and covers the period from January 1, 2011 to December<br />
31, 2011.<br />
THESL 2011 CDM Annual Report<br />
09/30/2012 2
Executive Summary<br />
This 2011 Annual Report details THESL’s CDM savings progress to date, the achievements and<br />
highlights of programs implemented in 2011, the challenges and mitigation measures considered<br />
during the course of program implementation, and discusses modifications to its CDM Strategy in<br />
order to attempt to meet its mandated targets as of 2014.<br />
THESL’s CDM Strategy -THESL’s CDM Strategy was filed with the OEB on October 22, 2010. It<br />
served to provide guidance as to its planned program delivery in 2011 and over the remaining years of<br />
the term. THESL’s CDM strategy was based on its extensive knowledge and familiarity with its<br />
customer base as well as the experience gained from implementing CDM programs since 2005 and<br />
contemplated the deployment of both OPA-Contracted Province-Wide programs (“OPA programs”)<br />
and OEB <strong>Board</strong>-Approved programs to achieve the assigned targets. The original savings forecast is<br />
provided in Table 1 below:<br />
Table 1: THESL CDM Strategy<br />
2011 2012 2013 2014 Total<br />
OPA‐Contracted Province‐Wide Programs<br />
MW 42.9 56.7 63.5 56.0 219.0<br />
GWh 267.2 291.4 301.5 280.7 1,140.8<br />
Potential <strong>Board</strong>‐Approved CDM Programs<br />
Grand Total for All CDM Programs<br />
MW 6.7 13.4 20.1 26.8 67.0<br />
GWh 17.6 35.2 52.9 70.5 176.2<br />
MW 49.6 70.1 83.6 82.8 286.0<br />
GWh 284.8 326.6 354.4 351.1 1,317.0<br />
THESL’s 2011 Activities - In 2011, THESL began executing its 4-year CDM Strategy and undertook<br />
the following activities:<br />
• Launched all available OPA Programs immediately following their release by the <strong>Ontario</strong><br />
Power Authority (“OPA”);<br />
• Designed and launched an aggressive marketing campaign to educate consumers in all<br />
sectors;<br />
• Developed and delivered a series of training seminars and workshops geared to educate<br />
industry stakeholders about new OPA Programs, the use of the online application system, new<br />
processes and program rules as well as program monitoring and verification requirements;<br />
• Designed and applied to the OEB for approval for eight <strong>Board</strong>-Approved CDM programs<br />
(<strong>Board</strong> File No. EB-2011-0011). The deployment of these programs was subsequently pursued<br />
through the OPA;<br />
• Recruited a large group of professional CDM resources, including front, middle and back office<br />
personnel experienced in the design, delivery and management of all aspects of CDM;<br />
• Actively participated in all Electrical Distribution Association (“EDA”), LDC and OPA working<br />
groups in order to improve and simplify the existing programs and processes; and<br />
• Transitioned pre-2011 projects into 2011.<br />
THESL 2011 CDM Annual Report<br />
09/30/2012 3
2011 CDM Results - Table 2 below summarizes THESL’s 2011 CDM results as verified by the OPA.<br />
Detailed results by program initiative are provided in Section 3.<br />
Table 2: Summary of Results for 2011<br />
Achievements Strategy Targets<br />
Program<br />
Spending<br />
MW GWh MW GWh<br />
OPA Programs $ 14,099,155 49.8 172.9 42.9 267.2<br />
<strong>Board</strong>‐Approved Programs $ ‐ ‐ ‐ 6.7 17.6<br />
Total $ 14,099,155 49.8 172.9 49.6 284.8<br />
Results as a % of Total Province<br />
23% 29%<br />
The summer peak demand savings for 2011 are 49.8 MW, which is consistent with THESL’s CDM<br />
Strategy target of 49.6 MW. The annual 2011 energy savings are 172.9 GWh, which is unfavourable<br />
to the CDM strategy target by 40% due to the large number of demand response projects which did<br />
not result in significant electricity savings. The pre-2011 projects (i.e. projects that were in-flight in late<br />
2010 but completed in 2011), represented 36% of the demand savings and 55% of the energy savings<br />
achieved in 2011. The 2011 results represent 23% of the provincial demand savings and 29% of the<br />
provincial energy savings. These results compare favourably to THESL’s 20% share of total provincial<br />
energy consumption.<br />
2012 - 2014 Outlook - The savings projection from THESL CDM Strategy has been reforecast to<br />
incorporate THESL’s experience with the OPA Programs after they have been in market for one year.<br />
Given the current available OPA Programs and the end date of December 31, 2014, THESL forecasts<br />
that it will achieve 197 MW of summer peak demand savings and 1,323 GWh of electricity savings.<br />
Based on this projection, THESL expects to be 90 MW below the demand target and 19 GWh above<br />
the electricity savings target.<br />
Demand Savings - The demand savings shortfall is due to a number of factors, including but not<br />
limited to: the delay in the launch of the OPA Programs, the governance structure, slower economy,<br />
disallowance of planned for OEB <strong>Board</strong>-Approved programs (67 MW), lengthy capital investment<br />
cycles in large commercial and industrial sectors, and market saturation of certain program measures.<br />
Some of the shortfall was offset by the inclusion of pre-2011 CDM project results.<br />
Electricity Savings - The energy consumption savings are predicted to be favourable to target due<br />
mainly to the number of pre-2011 CDM projects and a number of future OPA Program projects<br />
focussed exclusively on high energy savings.<br />
Early observations of the OPA Program results suggest there is a growing risk of not achieving the<br />
2014 demand savings target which needs to be addressed. THESL has analyzed its market potential<br />
with respect to the existing OPA Programs and presents its savings projection outlook in Section 4.2.<br />
Strategy Modifications - THESL has modified its strategy for 2012 – 2014 and will now be reliant<br />
entirely on OPA Programs. The commercial, institutional and industrial sectors remain the key markets<br />
with the potential to deliver the greatest share of conservation gains. A number of market tactics will<br />
be implemented going forward to extend the successful market activities to date. Section 4.3 provides<br />
further details on the market strategy and OPA Program delivery enhancements. THESL will continue<br />
to collaborate with the OPA, the EDA and other LDCs to enhance existing OPA Program initiatives<br />
and develop new initiatives to improve the outcome.<br />
THESL 2011 CDM Annual Report<br />
09/30/2012 4
Conclusions – With the current slate of available OPA Programs, and the current forecast of<br />
implementation and projected savings, THESL expects to meet its energy consumption target but will<br />
struggle to meet its demand savings target. Despite considerable collaboration between the OPA,<br />
EDA, and LDC to improve existing programs and overcome operational and structural issues that are<br />
limiting program effectiveness, THESL submits that additional program initiatives will be required.<br />
Even with new programs THESL expects that they on their own will be insufficient to achieve the<br />
demand savings target due to the limited timeframe remaining prior to the end of 2014 and the lengthy<br />
time period required to bring new programs to market.<br />
THESL 2011 CDM Annual Report<br />
09/30/2012 5
1 <strong>Board</strong>-Approved CDM Programs<br />
1.1 Introduction<br />
In its Decision and Order concerning the CDM Code and CDM Targets dated November 12 2010 (EB-<br />
2010-0215 & EB-2010-0216), the OEB directed that, (to meet the mandatory CDM targets), “Each<br />
licensed electricity distributor must, as a condition of its licence, deliver <strong>Board</strong>-Approved CDM<br />
Programs, OPA-Contracted Province-Wide CDM Programs, or a combination of the two”.<br />
On January 10, 2011, THESL filed an application with the OEB seeking approval of funding for eight<br />
CDM programs. On July 12, 2011, the OEB issued its decision regarding THESL’s CDM programs. In<br />
its decision, the OEB approved, with significant modifications, two of the eight programs, and<br />
disallowed the other six programs as they were considered duplicative of existing CDM programs<br />
already funded by the OPA.<br />
On August 3, 2011, THESL informed the OEB that due to the substantially modified terms and nature<br />
of the two approved programs, they became uneconomic, and therefore THESL requested that the<br />
OEB approve the withdrawal of their implementation. THESL proposed, and the OEB approved, that it<br />
continue to work with the OPA to introduce the previously proposed OEB programs as OPA Programs.<br />
At the time of this report, the implementation of Time-of-Use (“TOU”) pricing is the only <strong>Board</strong>-<br />
Approved CDM program that has been offered in THESL’s service area.<br />
1.2 TOU Implementation<br />
Customer Type(s):<br />
Objectives:<br />
Description:<br />
Delivery:<br />
Residential and small business customers (up to 250,000 kWh per year).<br />
TOU pricing is designed to encourage conservation and demand shifting of<br />
energy usage from “on-peak” periods when electricity demand is high to “offpeak”<br />
periods when electricity demand is low.<br />
In August of 2010, the OEB issued a final determination to mandate TOU pricing<br />
for Regulated Price Plan (“RPP”) customers by June 2011, in order to support<br />
the Government’s expectation for 3.6 million RPP consumers to be on TOU<br />
pricing by June 2011, and to ensure that smart meters funded at ratepayer<br />
expense are being used for their intended purpose. The RPP TOU price is<br />
adjusted twice annually by the OEB.<br />
The OEB sets the TOU rates; LDCs install and maintain smart meters; LDCs<br />
convert and enrol customers to TOU billing.<br />
THESL implemented TOU rates starting in June 2009 which was substantially<br />
complete by the end of the same year. A great deal of consumer communication<br />
and education promoting TOU has been undertaken including:<br />
• Advertising – online & newspaper promoting the ‘Two Extra Hours’ change<br />
• Direct mail – TOU Tool Kit with discount coupons; reminder email/letters<br />
• Event outreach at community events<br />
• On bill messaging / ‘Guide to first TOU’ bill inserts<br />
• Statement messaging website promoting use of TOU portal<br />
• Social Media – Face Book, Twitter, OMNI ethnic television vignettes<br />
• Multilingual advertising campaign; OMNI – ethnic television vignettes<br />
• Public Relations – media releases (prior to statutory holidays for off-peak);<br />
Councillor outreach<br />
• Developed a TOU portal – 115,000 registered (as of end of 2011)<br />
THESL 2011 CDM Annual Report<br />
09/30/2012 6
Participation: 622,613 customers (end of 2011)<br />
Spending:<br />
Delivery and implementation of TOU was not OPA funded - it is subject to<br />
OEB funding approval.<br />
Results & Evaluation: In the CDM Guidelines the OEB recognized that a portion of the aggregate<br />
electricity demand target was intended to be attributable to savings achieved<br />
through the implementation of TOU. The CDM Guidelines further state that any<br />
evaluations of savings from TOU pricing should be conducted by the OPA for<br />
the province, and then allocated to LDCs. As of September 2012, the OPA has<br />
not released its preliminary results of TOU savings to LDCs, so THESL is not<br />
able to provide any verified savings related to THESL’s TOU program at this<br />
time.<br />
THESL 2011 CDM Annual Report<br />
09/30/2012 7
2 OPA-Contracted Province-Wide CDM Programs<br />
THESL executed a Master Agreement with the OPA on February 2, 2011 to deliver the following OPA<br />
Programs in THESL’s service area from January 1, 2011 to December 31, 2014:<br />
• Consumer Program<br />
• Business Program<br />
• Industrial Program, and<br />
• Home Assistance Program<br />
Each of the above OPA Programs includes various initiatives as defined by the corresponding<br />
schedules. Where possible THESL mobilized in advance of registration to help expedite the market<br />
launch and immediately registered for all initiatives as soon as they became available through the<br />
OPA. In addition, THESL also delivered projects from pre-2011 programs which were completed in<br />
2011.<br />
OPA Program funding is provided by the OPA as detailed in Section 3.2 by type of expense and by<br />
initiative.<br />
A summary of the 2011 results is presented in table 3 below. Detailed results at the program initiative<br />
level are provided in Section 3.<br />
Table 3: Summary of Savings for 2011 OPA Programs<br />
Program<br />
Consumer Program Total<br />
Business Program Total<br />
Industrial Program Total<br />
Pre‐2011 Programs completed in 2011 Total<br />
Total OPA Programs<br />
Net Savings<br />
Incremental<br />
Peak Demand<br />
Savings (kW)<br />
Incremental<br />
<strong>Energy</strong> Savings<br />
(kWh)<br />
7,184 19,097,886<br />
14,369 55,765,683<br />
10,545 3,605,917<br />
17,727 94,450,215<br />
49,825 172,919,701<br />
The following sections provide a detailed description of each of the OPA Program initiatives that were<br />
offered in THESL’s service area in 2011. Additional information is available on OPA’s saveONenergy<br />
website: https://www.saveonenergy.ca/ or THESL’S website: www.torontohydro.com.<br />
The details reported for each program are provided in accordance with the templates provided in the<br />
appendices to the CDM Code. THESL further provides additional OPA Program context common to<br />
many of the individual initiatives, highlights of achievements including operational challenges, and<br />
current and possible risk mitigation activities.<br />
THESL 2011 CDM Annual Report<br />
09/30/2012 8
2.1 Consumer Program – Residential Market<br />
As referenced in the 2011 Yearbook of Electricity Distributors released by the OEB on September 13,<br />
2012, there were 629,049 residential single family accounts within THESL’s jurisdiction representing<br />
5,204 GWh in electricity consumption or 21% of all energy consumed in <strong>Toronto</strong>.<br />
The Consumer Program has a number of initiatives that are designed specifically to meet the<br />
requirements of the residential sector and encourage uptake of energy efficient devices and generally<br />
promote a culture of conservation. The following initiatives were launched immediately following OPA<br />
availability:<br />
• Appliance Retirement<br />
• Appliance Exchange<br />
• HVAC Incentives<br />
• Conservation Instant Coupon Booklet<br />
• Bi-Annual Retailer Event<br />
• Retailer Co-op<br />
• Residential and Small Commercial Demand Response<br />
• Residential New Construction<br />
The following initiatives have not yet been made available by the OPA:<br />
• Midstream Electronics<br />
• Midstream Pool Equipment<br />
• Home <strong>Energy</strong> Audit Tool<br />
To-Market Strategy: THESL’s “to-market” strategy for the Consumer Program is<br />
a mass marketing and communications plan. The diversity and size of <strong>Toronto</strong>’s<br />
population requires a comprehensive integrated marketing plan including social<br />
media channels, events, sponsorships and advertising with relevant and qualified<br />
messaging that resonate with particular target groups coordinated with OPA’s<br />
media timetable. In order to assure consistency of messaging across the<br />
province, advertising and marketing standards including a new province-wide<br />
conservation brand were developed in cooperation with the OPA.<br />
Beginning in spring 2011, THESL reached out to its consumer sector to promote<br />
OPA’s saveONenergy programs as follows:<br />
• Advertisements using local print media, digital, radio and cinema<br />
• Public relations campaign launching programs and ongoing features with<br />
famous <strong>Toronto</strong>nians promoting conservation (“Easy to Conserve”)<br />
• Direct mail (spring and fall) to targeted customers promoting key programs<br />
• Bill inserts and on bill messages<br />
• Powerwise and Econnect newsletters<br />
• Events – local community events and festivals<br />
• Sponsorship through Maple Leaf Sports and Entertainment<br />
• Company website pages and social media – Face Book, YouTube and<br />
Twitter<br />
Consumer Program Highlights and Observations:<br />
• Featured a centralized media strategy directed by the OPA and augmented<br />
by THESL’s local media tactics<br />
• Low initial saveONenergy brand awareness in comparison to the higher<br />
awareness of local legacy programs led to intense marketing of new branding<br />
THESL 2011 CDM Annual Report<br />
09/30/2012 9
• Rapid in-house development of marketing materials under OPA guidelines leveraging broad array<br />
of past marketing tactics to increase conservation awareness in the marketplace as soon as<br />
initiatives became available<br />
• THESL worked closely with the OPA in developing core messaging in a manner supportive of<br />
THESL local marketplace requirements<br />
• peaksaver® extension was helpful to keep initiative top of mind and help bridge time until the new<br />
peaksaver PLUS initiative was in market<br />
2.1.1 Appliance Retirement<br />
Objectives: To permanently decommission older, inefficient refrigeration appliances.<br />
Description: Offers consumers free pick-up and decommissioning of old inefficient<br />
refrigerators, freezers, room air conditioners (RACs) and portable dehumidifiers.<br />
Delivery:<br />
The OPA centrally contracted for province-wide marketing, call centre,<br />
appliance pick-up and decommissioning. LDC provided local marketing and<br />
coordination with municipal pick-up where available.<br />
Participation: 6,088 Appliances<br />
Spending: $772,370<br />
Results & Evaluation: Net peak demand savings = 349 kW<br />
<strong>Energy</strong> savings<br />
= 2,343,820 kWh<br />
Additional Comments:<br />
Previously called “The Great Refrigerator Round-Up” and offered by THESL<br />
since 2007, this initiative has achieved significant results in the past and is<br />
approaching market saturation. Appliances have a natural life cycle and the<br />
initiative cannot be expected to continually deliver high penetration in perpetuity.<br />
2.1.2 Appliance Exchange<br />
Objective:<br />
To remove and permanently decommission inefficient RACs and dehumidifiers.<br />
Description: Appliance exchange events were held at local retail locations and customers<br />
were encouraged to bring in their old inefficient RAC and dehumidifiers in<br />
exchange for coupons/discounts towards the purchase of new energy efficient<br />
equipment.<br />
Delivery:<br />
The OPA contracted with participating retailers for the collection of eligible units.<br />
THESL promoted the initiative as part of the integrated marketing plan but did<br />
not have an in-store presence.<br />
Participation: 549 Appliances<br />
Spending: $102,210<br />
Results & Evaluation: Net peak demand savings = 52 kW<br />
<strong>Energy</strong> savings<br />
= 57,879 kWh<br />
Additional Comments:<br />
Savings, compared to previous years, did not materialize due to under<br />
promotion of the initiative. OPA’s provincial marketing campaign focussed<br />
primarily on dehumidifiers, while there are more RACs in <strong>Toronto</strong> than<br />
dehumidifiers. Mitigation - THESL will seek to gain greater autonomy to design<br />
marketing campaigns that suit their specific market conditions and maximize the<br />
effectiveness.<br />
THESL 2011 CDM Annual Report<br />
09/30/2012 10
2.1.3 HVAC Incentives<br />
Objective:<br />
To encourage the replacement of existing heating, ventilation and air<br />
conditioning (“HVAC”) systems with high efficiency ENERGY STAR® systems<br />
and products.<br />
Description: The initiative offers rebates for the replacement of inefficient heating and cooling<br />
systems with high efficiency ENERGY STAR® systems and products installed<br />
by approved Heating, Refrigeration, and Air Conditioning Institute (“HRAI”)<br />
qualified contractors.<br />
Delivery:<br />
The OPA contracted centrally for delivery of the initiative and THESL marketed<br />
this initiative as part of the integrated marketing plan.<br />
Participation: 19,907 HVAC units<br />
Spending: $849,530<br />
Results & Evaluation: Net peak demand savings = 5,674 kW<br />
<strong>Energy</strong> savings<br />
= 10,493,166 kWh<br />
Additional Comments:<br />
The OPA centrally managed, tracked and reported results. THESL did not have<br />
visibility to actively manage the effectiveness of this initiative. Mitigation – the<br />
OPA has agreed to work with LDCs to provide more timely reports throughout<br />
the OPA Program term to actively manage the initiative.<br />
2.1.4 Conservation Instant Coupon Booklet<br />
Objective:<br />
To encourage households to purchase energy efficient products by offering<br />
coupon discounts.<br />
Description: This initiative offers customers coupons towards the purchase of a variety of low<br />
cost, easy to install ENERGY STAR® energy efficient products. Booklets are<br />
directly mailed to customers, available at point-of-purchase or downloadable<br />
coupons at www.saveonenergy.ca and <strong>Toronto</strong> <strong>Hydro</strong> web page.<br />
Delivery:<br />
The OPA contracted centrally for the distribution of the coupon booklets across<br />
<strong>Ontario</strong>. LDCs marketed and distributed coupons at local events. The OPA<br />
entered into agreements with retailers to honour the coupons.<br />
Participation: 65,268 products<br />
Spending: $448,855<br />
Results & Evaluation: Net peak demand savings = 150 kW<br />
<strong>Energy</strong> savings<br />
= 2,439,881 kWh<br />
Additional Comments:<br />
This initiative has been in market since 2008 and the product list has not<br />
significantly changed since initially launched. Mitigation – Expand the list of<br />
products, including new products (e.g. LED lighting and review incentive levels<br />
for the coupon initiatives to increase participation).<br />
2.1.5 Bi-Annual Retailer Events<br />
Objectives:<br />
Description:<br />
To offer customers instant point of purchase discounts at participating retailers<br />
for a variety of energy efficient products.<br />
Twice a year (spring and fall), participating retailers host month-long rebate<br />
events. Customers are encouraged to visit participating retailers where they can<br />
THESL 2011 CDM Annual Report<br />
09/30/2012 11
find coupons redeemable for instant rebates towards a variety of low cost, easy<br />
to install energy efficient measures.<br />
Delivery:<br />
The OPA enters into arrangements with participating retailers to promote the<br />
discounted products. LDCs also refer retailers to the OPA.<br />
Participation: 111,384 products<br />
Spending: $66,293<br />
Results & Evaluation: Net peak demand savings = 215 kW<br />
<strong>Energy</strong> savings<br />
= 3,760,986 kWh<br />
Additional Comments: As noted in Section 2.1.4 - Conservation Instant Coupon Booklet.<br />
2.1.6 Retailer Co-op<br />
Objectives: To hold promotional events to encourage customers to purchase energy<br />
efficiency measures.<br />
Description: The initiative provides LDCs with the opportunity to work with retailers in their<br />
distribution area by holding special events at retail locations. These events are<br />
typically special promotions that encourage customers to purchase energy<br />
efficiency measures (and go above-and-beyond the traditional Bi-Annual<br />
Coupon Events).<br />
Delivery:<br />
Retailers apply to the OPA for co-op funding to run special promotions that<br />
promote energy efficiency to customers in their stores. LDCs can refer retailers<br />
to the OPA. The OPA provides each LDC with a list of retailers who are<br />
qualified for co-op funding as well as details of the proposed special events.<br />
Participation: 13 products<br />
Spending: $0<br />
Results & Evaluation: Net peak demand savings = 0 kW<br />
<strong>Energy</strong> savings<br />
= 230 kWh<br />
Additional Comments: THESL did not participate in 2011 and results were allocated by the OPA<br />
2.1.7 Residential and Small Commercial Demand Response (“DR”)<br />
Objectives:<br />
Description:<br />
Delivery:<br />
Control residential and small commercial electrical end use loads, including air<br />
conditioners, pool pumps and electric water heaters, to make available for<br />
dispatch during IESO demand response events.<br />
Customers enrol in peaksaver PLUS (previously, peaksaver), which includes<br />
the installation of a load control device (“LCD”) on one or more of the end use<br />
loads noted above and/or a free In-home Display (“IHD”) that allows customers<br />
to view their energy use and associated price on a real time basis.<br />
Due to the delay in initiative launch, LDCs including THESL did not launch the<br />
new peaksaver PLUS initiative in 2011. However, as an interim measure<br />
THESL continued to offer the standard peaksaver initiative with a $25 bill credit<br />
for the first eight months of 2011.This extension is referred to as the peaksaver<br />
Extension. After August 2011, the peaksaver Extension ended and the<br />
initiative, including marketing for the follow-on initiative was suspended until<br />
OPA released the new initiative.<br />
THESL procures LCDs and IHDs directly and contracts the installation of the<br />
devices via a third party. THESL actively markets within its service territory<br />
THESL 2011 CDM Annual Report<br />
09/30/2012 12
using targeted market tactics (bill inserts, direct mail, outbound calling, and<br />
radio and newspaper ads) to promote the initiative.<br />
Participation: 1,364 units (36 units for Small Commercial DR)<br />
Spending: $603,951<br />
Results & Evaluation: Net DR Capacity = 766 kW (23 kW for Small Commercial DR)<br />
<strong>Energy</strong> savings = 2,008 kWh (84 kWh for Small Commercial DR)<br />
Additional Comments:<br />
i) The delay in introducing the new initiative resulted in a loss of in-market<br />
momentum and market participation. Mitigation – As an interim measure, a<br />
peaksaver Extension was deployed; ii) A large provincial scale roll-out of the<br />
IHD was problematic due to the number of manufacturers and variations in<br />
smart meters. Consequently this added further delay as a number of possible<br />
technical solutions needed to be investigated. Mitigation – THESL thoroughly<br />
researched the potential technologies and manufacturers to provide a cost<br />
effective solution that worked with THESL’s installed meter base.<br />
2.1.8 Residential New Construction<br />
Objectives: To promote the construction of energy efficient residential homes in the new<br />
home construction market.<br />
Description: This initiative offers incentives to homebuilders who construct new energy<br />
efficient homes. Incentives are offered for two categories: 1) incentives for the<br />
installation of electricity efficiency measures as determined by a prescriptive list<br />
or via a custom option; and 2) incentives for homes that meet or exceed<br />
aggressive efficiency standards using the EnerGuide performance rating<br />
system.<br />
Delivery:<br />
Local engagement of builders is the responsibility of the LDC and is supported<br />
by the OPA marketing air coverage driving builders to their LDC for additional<br />
information.<br />
Participation: No participation<br />
Spending: $240,481<br />
Results & Evaluation: Net peak demand savings = 0 kW<br />
<strong>Energy</strong> savings<br />
= 0 kWh<br />
Additional Comments:<br />
i) Due to the lengthy and cumbersome application process coupled with low<br />
incentive amounts, only five builders provincially participated in the initiative.<br />
Mitigation – This is being addressed by the residential working group with a<br />
request to simplify the process. Improvements are planned for 2012. ii)<br />
Subdivisions are required to submit one application per new home adding<br />
significant administration for minimal incentive levels. Consequently, the<br />
administration has deterred builders from participating. Mitigation - This is being<br />
addressed by the residential working group and improvements are planned for<br />
2012.<br />
2.2 Business Program – Commercial and Institutional Markets<br />
As referenced in the OEB’s 2011 Yearbook, there were 80,274 general service accounts and large<br />
users within THESL’s jurisdiction representing 19,352 GWh in electricity consumption or 79% of all<br />
energy consumed in <strong>Toronto</strong>.<br />
THESL 2011 CDM Annual Report<br />
09/30/2012 13
The schedules relating to the Business Program were finalized in early 2011 but required time for<br />
customers, contractors and supply chain stakeholders to acclimatize to the new rules and learn new<br />
processes. As a result, uptake of new initiatives was gradual and required significant outreach efforts<br />
to educate the customer and supply chain network.<br />
THESL’s 2011 Business Program results include the City of <strong>Toronto</strong> and the Building Owners and<br />
Managers Association (“BOMA”) pre-2011 programs.<br />
THESL is facing an interesting challenge in <strong>Toronto</strong>. The conservation marketplace is more mature<br />
since 2005 and saturation of certain conservation measures is becoming a limiting factor for some key<br />
segments. Development of new initiatives to satisfy next generation projects (including THESL’s<br />
<strong>Board</strong>-Approved program submission and its eventual incorporation into the OPA Programs) is crucial<br />
to help THESL achieve its mandated savings targets.<br />
Based on observations since 2005, there have been an increasing number of smaller project<br />
applications yielding decreasing kW per application combined with longer sales cycle. This suggests<br />
that greater administrative effort can be expected moving forward. Also, this observation supports<br />
THESL’s Applicant Representative Initiative (“ARI”) in seeking to engage the supply chain as channel<br />
partners working with THESL to increase volume and spread the effort in helping to submit<br />
applications.<br />
The following initiatives were launched immediately following OPA availability:<br />
• Efficiency: Equipment Replacement Incentive Initiative (“ERII”)<br />
• Direct Install Lighting<br />
• Existing Building Commissioning Incentive<br />
• New Construction and Major Renovation Incentive<br />
• <strong>Energy</strong> Audit<br />
The Direct Service Space Cooling Initiative was not made available by the OPA.<br />
To-Market Strategy: The business marketing strategy included the use of<br />
media, customer outreach and specific marketing tactics with cross-program<br />
messaging. A key component of the plan relied heavily on building a strong<br />
channel and ally partner network to help supplement THESL’s sales activities.<br />
Tactics included:<br />
• Multimedia mass marketing to build awareness in all sectors<br />
• “Soft Launch” of new CDM programs through “<strong>Energy</strong> Into Action” event<br />
• Trade/vertical publications<br />
• Online ad units on consumer business publications sites and commercial<br />
trade sites<br />
• Mobile ads<br />
• Targeted e-newsletters to specific lists<br />
• Radio<br />
• Direct mail<br />
• Bill inserts<br />
• Press releases<br />
• Outreach activities at top industry events<br />
• Ally/channel sessions and training<br />
• Marketing materials to support sales and partners/channel/allies (includes<br />
sale sheets, press releases, presentations, website)<br />
THESL 2011 CDM Annual Report<br />
09/30/2012 14
Business Program Highlights and Observations:<br />
• THESL invested considerable effort in training workshops, seminars, and<br />
promotional activities beginning early in 2011 to highlight and promote OPA<br />
Programs while engaging third party channel partners with local experience<br />
to accelerate uptake<br />
• Developed a 2012 incentive based supply channel initiative to assist in the<br />
outreach and delivery of program solutions while sharing the administrative<br />
burden in managing a larger number of smaller projects<br />
• Actively participated in OPA Program working groups to address operational<br />
issues and program enhancements<br />
• Achieved high level of savings due to the transition of pre-2011 programs<br />
2.2.1 Equipment Replacement Incentive Initiative<br />
Objectives: To offer incentives to business customers to encourage investment in more<br />
energy efficient equipment including lighting, space cooling, ventilation, controls<br />
and various other measures.<br />
Description: Incentives are offered for projects where equipment and systems will be<br />
replaced with more efficient alternatives. Typical target segments for this<br />
initiative include commercial, retail, hospitality and entertainment, municipal,<br />
academic, health care, and multi-residential facilities. Applications can be<br />
submitted using one of three possible incentive streams.<br />
Delivery:<br />
THESL developed a comprehensive front, middle and back office to support this<br />
initiative. Technical energy consultants were hired to target all market sectors<br />
promoting ERII and assisting customers to identify energy savings opportunities<br />
and submit applications. THESL also contracted with the City of <strong>Toronto</strong> Better<br />
Buildings Partnership as its channel in the municipal, academic, social and<br />
health care sectors to leverage long standing relationships in those markets.<br />
Participation: 614 completed projects (32 projects for Industrial ERII)<br />
Spending: $1,965,122<br />
Results & Evaluation: Net peak demand savings = 8,049 kW (522 kW for Industrial ERII; 13 kW per<br />
project)<br />
<strong>Energy</strong> savings = 46,024,564 kWh (3,017,532 kWh for Industrial ERII)<br />
Additional Comments:<br />
i) In March 2011, the new iCon application and tracking system was launched<br />
by the OPA however, was unstable causing customer frustration. Mitigation –<br />
THESL streamlined all LDC related processes and aggressively implemented<br />
training and outreach sessions to educate and prepare participants, consultants,<br />
and contractors on issues. THESL developed a number of workarounds until the<br />
system was stabilized; ii) The “Change Management” process has proven time<br />
consuming such that potential program enhancements take longer to reach<br />
market. Mitigation – THESL, other LDCs and the OPA are collaborating to<br />
improve the Change Management process. iii) The “Head Office” model<br />
THESL 2011 CDM Annual Report<br />
09/30/2012 15
2.2.2 Direct Install Lighting<br />
imposed a heavy administrative burden on to the lead LDC without any<br />
offsetting benefit or advantage. Mitigation – Worked closely with OPA to<br />
leverage OPA resources to assist LDCs in back office administrative duties.<br />
Objectives: Offer up to $1000 for the installation of eligible lighting and water heating<br />
measures in commercial, institutional, agricultural and multi-family buildings.<br />
Description: The Initiative offers turn-key lighting and electric hot water insulation measures<br />
with a value of up to $1,000 at no cost to qualifying small businesses. In<br />
addition, standard prescriptive incentives are available for eligible equipment<br />
beyond the $1,000 limit.<br />
Delivery:<br />
Participants enrol directly with a THESL contacted representative who manages<br />
the audit, installations and incentive administration. This initiative is reaching<br />
market saturation as it has been in market, albeit under a different name, for<br />
three years and was well received by the market. Because most eligible<br />
participants have already been contacted, or have participated in the initiative,<br />
the numbers are expected to decline. THESL has been working with the OPA<br />
and other LDCs to refine the legal definition of eligible participant to include<br />
those inadvertently excluded, and to increase the incentive cap to attract more<br />
participants.<br />
Participation: 3,946 completed projects<br />
Spending: $4,858,344<br />
Results & Evaluation: Net peak demand savings = 4,903 kW<br />
<strong>Energy</strong> savings<br />
= 12,683,558 kWh<br />
Additional Comments:<br />
i) This initiative was a continuation of Power Savings Blitz initiative (“PSB”)<br />
offered by THESL from 2008 to 2010. Early adopters have been serviced so<br />
the remaining eligible participants require greater effort, which led to a<br />
corresponding reduction in new participants. Mitigation – Working with the OPA<br />
and Commercial and Institutional (“C&I”) working group to increase incentive<br />
levels and develop new markets for the initiative. ii) The measures list and<br />
associated pricing have not been updated since initiative launch, which is<br />
problematic due to the increase in lighting equipment cost. Mitigation - To<br />
address these issues, the LDCs have been working with the OPA through<br />
Change Management to address pricing.<br />
2.2.3 Existing Building Commissioning Incentive<br />
Objective:<br />
Description:<br />
Delivery:<br />
To offer incentives for optimizing (but not replacing) existing chilled water<br />
systems for space cooling in non-residential facilities for the purpose of<br />
achieving implementation phase energy savings, implementation phase<br />
demand savings, or both.<br />
This initiative offers participants incentives for the following phases of<br />
commissioning 1) scoping study; 2) investigation and analysis; 3)<br />
implementation; and 4) hand off/completion.<br />
LDC delivered. THESL launched the initiative through THESL front-line<br />
technical energy consultants to large commercial and institutional segments,<br />
however customer response and participation was limited. THESL received<br />
three applications in 2011 with no progression beyond the scoping phase in<br />
2011.<br />
THESL 2011 CDM Annual Report<br />
09/30/2012 16
Participation: No projects completed.<br />
Spending: $428,070<br />
Results & Evaluation: Net peak demand savings = 0 kW<br />
<strong>Energy</strong> savings<br />
= 0 kWh<br />
Additional Comments:<br />
i) Scoping study requirement was limited to space cooling which has contributed<br />
to the lack of participation. Mitigation – Non-cooling systems and measures<br />
should be considered to increase interest. Issue is to be discussed amongst the<br />
OPA working group. ii) Customer feedback indicates that the initiative is<br />
administratively complex relative to potential incentive available. Mitigation -<br />
Issue to be discussed amongst the OPA working group.<br />
2.2.4 New Construction and Major Renovation Incentive<br />
Objectives: To encourage builders of commercial, institutional, and industrial buildings<br />
(including multi-family buildings and agricultural facilities) to design and build<br />
new buildings with more energy-efficient equipment and systems for lighting,<br />
space cooling, ventilation and other measures.<br />
Description: The initiative provides incentives for new buildings to exceed existing codes and<br />
standards for energy efficiency. The initiative uses both a prescriptive and<br />
custom approach.<br />
Delivery:<br />
LDC delivers to customers and design decision makers. This initiative was a<br />
continuation of the High Performance New Construction initiative previously<br />
delivered by the City of <strong>Toronto</strong> under contract with the OPA, which ended in<br />
December 2010. THESL re-contracted with the City’s Better Buildings<br />
Partnership as its delivery channel; however, due to the market hiatus, results<br />
are not expected until 2012 and beyond considering the length of time required<br />
to apply, build and commission new buildings.<br />
Participation: No projects completed<br />
Spending: $451,592<br />
Results & Evaluation: Net peak demand savings = 0 kW<br />
<strong>Energy</strong> savings<br />
= 0 kWh<br />
Additional Comments:<br />
Development and construction cycles are very long for these types of buildings<br />
(4 to 5 years) and do not align with CDM funding periods causing developers to<br />
be reluctant to enrol and invest in CDM. If there is no certainty of incentive<br />
funding, new projects from 2012 onward will be very limited. Mitigation -<br />
Program continuity and a 2014 transition plan is needed to allow for incentive<br />
funding post 2014.<br />
2.2.5 <strong>Energy</strong> Audit<br />
Objectives:<br />
Description:<br />
Offer incentives to owners and lessees of commercial, institutional, multi-family<br />
buildings and agricultural facilities to undertake energy audit assessments to<br />
identify all possible energy saving opportunities to help reduce demand and<br />
consumption.<br />
This Initiative provides participants incentives for the completion of facility<br />
energy audits of electricity consuming equipment. <strong>Energy</strong> audits include<br />
development of energy baselines, use assessments and performance<br />
monitoring and reporting.<br />
THESL 2011 CDM Annual Report<br />
09/30/2012 17
Delivery:<br />
LDC delivered. The initiative was fully marketed through THESL front-line<br />
technical energy consultants. Primary target was large commercial and multiresidential<br />
customers.<br />
Participation: 60 Audits<br />
Spending: $504,139<br />
Results & Evaluation: Results not applicable - This initiative is designed to enable other initiatives e.g.<br />
ERII<br />
Additional Comments: N/A<br />
2.2.6 Pre-2011 Programs Completed in 2011<br />
Description: The <strong>Toronto</strong> Comprehensive was a pre-2011 initiative offered in <strong>Toronto</strong>.<br />
THESL, the City of <strong>Toronto</strong> and BOMA each contracted with OPA in 2007 to<br />
deliver the following programs:<br />
• THESL: Business Incentive Program (“BIP”) and Data Centre Incentive<br />
Program (“DCIP”)<br />
• City of <strong>Toronto</strong>: High Performance New Construction (“HPNC”), Better<br />
Building Partnership (“BBP”) and Multifamily <strong>Energy</strong> Efficiency Rebates<br />
(“MEER”)<br />
• BOMA CDM Program<br />
Delivery:<br />
See above description<br />
Participation: 684 projects<br />
Spending:<br />
$1,853,496 (participant incentives paid in 2011 only)<br />
Results & Evaluation: Net peak demand savings = 17,727 kW (average 25.9 kW per project)<br />
<strong>Energy</strong> savings<br />
= 94,450,215 kWh<br />
Additional Comments:<br />
The results from these initiatives demonstrate the importance of CDM continuity<br />
and alignment with business cycles.<br />
2.3 Industrial Program – Industrial Market<br />
As referenced in THESL’s CDM Strategy, the industrial sector represents approximately 610 MW of<br />
peak summer load and consumes approximately 3,284 GWh of electricity, which is 14% of the total<br />
electricity consumption in <strong>Toronto</strong>. The key types of manufacturing in this sector are plastics/rubber<br />
chemical and food that together comprise 47% of the peak demand and 51% of the electricity<br />
consumption in the industrial sector.<br />
The Industrial Program has a number of initiatives, that are designed specifically to meet the<br />
requirements of the industrial sector including stringent investment criteria (i.e. short payback periods),<br />
lack of resources and limited understanding of energy use within industrial facilities. After extensive<br />
efforts by the OPA and participating LDCs, the program schedules were released and signed May 31,<br />
2011. Of the initiatives, Demand Response 3 was in market prior to the launch of the schedules, as<br />
this program existed prior to the OPA Programs and is delivered by the OPA via existing contracts<br />
with load aggregators. Unfortunately, there were also delays in the main Process and Systems<br />
Upgrade Initiative (“PSUI”) initiative, as a “Technical Reviewer” was not contracted until November<br />
2011, effectively delaying projects in the PSUI initiative.<br />
The initiatives in this sector are:<br />
• Process & System Upgrades Initiative<br />
THESL 2011 CDM Annual Report<br />
09/30/2012 18
• Monitoring and Targeting (“M&T”)<br />
• <strong>Energy</strong> Manager<br />
• Demand Response 1<br />
• Demand Response 3<br />
To-Market Strategy<br />
Although there was a delay in program availability, THESL did a soft launch of the Industrial Program<br />
in conjunction with other LDCs in November 2010 to start the process. In addition, marketing and key<br />
account efforts were launched in advance of the Industrial Program availability to initiate customer<br />
engagement by educating them on the upcoming programs. These efforts were part of the larger<br />
THESL CDM business marketing strategy (please refer to the preceding section for more details).<br />
Targeted marketing was done via email and letters to the industrial target base to address specific<br />
program information and to highlight the important capability building initiatives (Embedded <strong>Energy</strong><br />
Managers) and key enabling initiatives like M&T. The main focus of THESL’s efforts in this sector was<br />
on a key account strategy, which involves dealing directly with the industrial customer base. This<br />
strategy is appropriate for this sector because of the limited size of the customer base.<br />
Industrial Program Highlights and Observations:<br />
• Capability funding for Embedded <strong>Energy</strong> Managers has met with strong<br />
customer interest<br />
• LDCs are applying for roving energy managers and Key Account Managers to<br />
bolster their forces that serve this sector<br />
• Demand Response 3 contributed significantly to the 2011 results<br />
With the launch of the Industrial Program, particularly in a market segment where<br />
there had not been extensive past conservation efforts, the first year has raised<br />
challenges that will need to be addressed to help ensure success in this important<br />
market segment.<br />
The main challenge has been customer acceptance of the legal agreements with the<br />
feedback being that they are not acceptable because of onerous long term<br />
commitments for reporting and project performance. Customer feedback has also<br />
indicated that many participants would prefer a lower level of incentives to go<br />
through the ERII initiative, as an offset versus the longer term requirements.<br />
THESL, as part of the industrial working group, has been working with the OPA to<br />
have the requirements streamlined for industrial projects and allow the customer<br />
flexibility to apply under the ERII initiative for specific projects.<br />
2.3.1 Process & System Upgrades Initiative (“PSUI”)<br />
Objectives: Offer capital and enabling incentives to assist with CDM investment in large<br />
complex and capital intensive projects as well as increase the capability of<br />
customers to implement energy management and system optimization projects.<br />
Description: PSUI is an energy management initiative that includes preliminary engineering<br />
study (“PES”), detailed engineering study (“DES”), and project incentive. The<br />
incentives are available to large customers with projects that are expected to<br />
generate at least 350 MWh of annualized electricity savings or, in the case of<br />
Micro-Projects, 100 MWh of annualized electricity savings.<br />
Delivery:<br />
LDC delivered with key account management support in some cases. This<br />
initiative was fully marketed through THESL front-line technical energy<br />
consultants. Soon after the launch of the Industrial Program, a marketing<br />
campaign was launched to promote the industrial initiatives.<br />
Participation: There were no projects completed under this initiative in 2011.<br />
THESL 2011 CDM Annual Report<br />
09/30/2012 19
Spending: $148,159<br />
Results & Evaluation: Net peak demand savings = 0 kW<br />
<strong>Energy</strong> savings<br />
= 0 kWh<br />
Additional Comments:<br />
i) Customers generally cannot commit to contracts that require performance for<br />
up to 10 years in the future preventing the initiative from being effective.<br />
Mitigation – THESL is working with the industrial working group and OPA to<br />
simplify participant agreements and create customer choice for programs; ii)<br />
The initiative relied on a technical reviewer which was not contracted by the<br />
OPA until November 2011. This delay made it impossible to achieve any<br />
savings in 2011, and as a result, LDCs lost out on a full year of potential<br />
cumulative energy savings from PSUI projects. Mitigation – THESL worked with<br />
the OPA to create a short term solution involving OPA technical staff performing<br />
the technical review role; iii) The initiative targets large customers that are<br />
undertaking large capital projects. There is typically a long internal approval<br />
process and then a long project development cycle. As such, results from PSUI<br />
did not appear in 2011. Mitigation – THESL has been marketing and using<br />
available resources made available through the initiative to make participants<br />
aware of the initiatives so they can incorporate this into the project planning<br />
process. However, consideration should be given to providing means of<br />
transitioning programs beyond 2014. iv) Given the size of the projects involved,<br />
the contract required for PSUI was a lengthy and complicated document.<br />
Mitigation - Attempts are being made through Change Management in 2012 to<br />
simplify the document.<br />
2.3.2 Monitoring and Targeting (“M&T”)<br />
Objectives: Offers access to funding for the installation of M&T systems in order to deliver a<br />
minimum savings target at the end of 24 months to be sustained for the term of<br />
the M&T Agreement.<br />
Description: Targeted at industrial processes and large commercial/institutional chilled water<br />
systems (>15 GWh), this initiative offers customers funding for the installation of<br />
M&T systems to help understand how their energy consumption might be<br />
reduced. A facility energy manager, who regularly oversees energy usage, will<br />
be able to use historical energy consumption performance to analyze and set<br />
targets.<br />
Delivery:<br />
LDC delivered with key account management support, in some cases.<br />
Participation: There were no projects completed under this initiative in 2011.<br />
Spending: $40,521<br />
Results & Evaluation: Net peak demand savings = 0 kW<br />
<strong>Energy</strong> saving<br />
= 0 kWh<br />
Additional Comments:<br />
The M&T initiative is targeted to larger customers with the capacity to review<br />
and utilize the M&T data. This review requires the customer facility to employ an<br />
<strong>Energy</strong> Manager, or a person with equivalent qualifications, which has been a<br />
barrier for some customers. Mitigation - Changes need to be made in 2012 to<br />
both the M&T schedule and ERII to allow smaller facilities to employ M&T<br />
systems.<br />
THESL 2011 CDM Annual Report<br />
09/30/2012 20
2.3.3 <strong>Energy</strong> Manager<br />
Objectives: To provide customers and LDCs the opportunity to access funding for the<br />
engagement of energy managers in order to help deliver a minimum annual<br />
savings target.<br />
Description: Targeted at large industrial customers (typically > 5 MW in aggregate), this<br />
initiative provides customers the opportunity to access funding to engage an onsite,<br />
full time embedded energy manager (“EEM”), or an off-site roving energy<br />
manager (“REM”) who is engaged by the LDC. The role of the EEM is to take<br />
control of the facility’s energy use by monitoring performance, leading<br />
awareness programs, and identifying opportunities for energy consumption<br />
improvement, and spearheading projects. Participants are funded 80% of the<br />
EEM’s salary plus 80% of the EEM actual reasonable expenses incurred. Each<br />
EEM has an annual target of 300 kW of demand reduction from one or more<br />
facilities.<br />
Delivery:<br />
LDC delivered with key account management support, in some cases. THESL<br />
was the first LDC to apply for REM and EEM funding and worked with the OPA<br />
on the allocation methodology. THESL applied for 6 REMs, had 10 EEMs, but<br />
did not receive approval until late 2011 to hire these resources.<br />
Participation: No participation – Considered a mobilization period.<br />
Spending: $14,790<br />
Results & Evaluation: Results not applicable - This initiative is designed to enable other initiatives.<br />
Additional Comments: Customers appreciate dealing with a single contact to interface with an LDC, a<br />
resource that has both the technical and business background who can<br />
communicate easily with the customer and the LDC. Finding this type of skill<br />
set has been difficult resulting in longer lead times to acquire the right resource.<br />
2.3.4 Demand Response (“DR”) 1<br />
Objectives: To achieve maximum costs effective peak demand reduction and energy<br />
savings, increase conservation awareness and contribute to the creation of a<br />
culture of conservation in <strong>Ontario</strong><br />
Description: DR 1 is a demand response initiative for commercial and industrial customers to<br />
help reduce the amount of power being used during certain periods of the year.<br />
This initiative has a schedule of 1,600 hours per year where activations of up to<br />
100 hours may occur with no obligation on customers to participate. This<br />
initiative makes payments for actual load reduction only.<br />
Delivery:<br />
The initiative is managed by third-party administrators and intended to be a<br />
“lead-in” to DR 3, which will allow potential DR 3 participants the opportunity to<br />
participate in demand response without the contractual obligations required<br />
under DR 3.<br />
Participation: No participation.<br />
Spending: $125,709<br />
Results & Evaluation: Results not applicable - This initiative is designed to enable other initiatives.<br />
Additional Comments:<br />
Aggregators have been unwilling to promote this initiative as it interferes with<br />
the more lucrative DR 3 initiative and customer interest has been marginal as<br />
the incentive levels are too low. Mitigation – discuss options for making this<br />
THESL 2011 CDM Annual Report<br />
09/30/2012 21
2.3.5 Demand Response (“DR”) 3<br />
initiative more attractive or removing it from the marketplace is being discussed<br />
in the industrial working group.<br />
Objectives:<br />
Description:<br />
Delivery:<br />
To provide payment to DR 3 participants to compensate them for making<br />
available electricity demand response during a demand response event.<br />
The DR 3 initiative is a contractual resource that is an economic alternative to<br />
procurement of new generation capacity. DR 3 comes with specific contractual<br />
obligations requiring participants to reduce their use of electricity relative to a<br />
baseline when called upon to do so by the OPA. This initiative makes payments<br />
for participants to be on standby and payments for the actual demand reduction<br />
provided during a demand response event. Participants are required to be on<br />
standby for approximately 1,600 hours per calendar year for possible dispatch<br />
of up to 100 hours or 200 hours within that year depending on the contract.<br />
DR 3 is delivered by DR aggregators, under contract to the OPA. The OPA<br />
administers contracts with all DRPs and direct participants that provide in<br />
excess of 5 MW of demand response capacity. OPA provides administration<br />
including settlement, EM&V, and dispatch. LDCs are responsible for outreach<br />
and marketing efforts.<br />
Participation: 43 facilities are enrolled with aggregators (26 facilities for Commercial DR 3)<br />
Spending: $240,956<br />
Results & Evaluation: Net DR capacity = 11,939 kW (1,915 kW for Commercial DR 3)<br />
<strong>Energy</strong> savings = 663,395 kWh (75,010 kWh for Commercial DR 3)<br />
Additional Comments:<br />
The inclusion of significant demand response targets within the program<br />
portfolio is problematic for LDCs when they have no ability to influence<br />
participation, particularly when, LDCs do not have customer data due to<br />
contractual terms between the OPA and the aggregators. This has limited<br />
THESL’s ability to effectively market to prospective participants. Mitigation –<br />
THESL conducted negotiations with all aggregators to establish a co-promotion<br />
and information sharing agreement. Negotiations were not concluded in 2011<br />
due to a number of factors, namely the reluctance of aggregators to share<br />
information with LDCs due to their contractual obligations with the OPA.<br />
2.4 Home Assistance Program – Income Qualified Residential Market<br />
Objectives:<br />
To offer free installation of energy efficiency measures to income qualified<br />
households for the purpose of achieving electricity and peak demand savings.<br />
Description:<br />
Delivery:<br />
This is a turnkey Initiative for income qualified customers. It offers residents the<br />
opportunity to take advantage of free installation of energy efficient measures<br />
that improve the comfort of their home, increase efficiency, and help them save<br />
money. All eligible customers receive a “Basic and Extended Measures Audit”,<br />
while customers with electric heating also receive a Weatherization Audit. The<br />
initiative is designed to coordinate efforts with gas utilities.<br />
LDC delivered<br />
Participation: Not in market in 2011<br />
Spending: $84,747<br />
Results & Evaluation: Net peak demand savings = 0 kW<br />
<strong>Energy</strong> savings<br />
= 0 kWh<br />
THESL 2011 CDM Annual Report<br />
09/30/2012 22
Additional Comments:<br />
i) There are challenges reaching income eligible customers and enrolling them<br />
in the program. Mitigation - Work with front line agencies and property<br />
management organizations to leverage relationships and attract participants. ii)<br />
There were errors and ambiguities in the definition of social housing, which<br />
does not adequately reflect the variety of low-income housing in larger urban<br />
areas. Mitigation - This will require a formal Change Management process<br />
through the OPA working group. iii) The applications created by the OPA are<br />
lengthy (7 pages) and legally elaborate, creating a barrier to participation.<br />
Mitigation – Work through the OPA working group to streamline application<br />
process.<br />
THESL 2011 CDM Annual Report<br />
09/30/2012 23
3 Summary of Initiative Penetration and Results<br />
The following section provides the detailed OPA Program results at the initiative level. The<br />
participation and savings results have been extracted from the final 2011 report released by the OPA<br />
on August 31, 2012. The evaluation findings for the OPA Programs are provided in Appendix A.<br />
3.1 Program Participation<br />
Table 4: Participation of OPA Programs & Initiatives<br />
Initiative<br />
Unit<br />
Uptake/ Participation<br />
Units<br />
Consumer Program<br />
Appliance Retirement Appliances 6,088<br />
Appliance Exchange Appliances 549<br />
HVAC Incentives Equipment 19,907<br />
Conservation Instant Coupon Booklet Products 65,268<br />
Bi‐Annual Retailer Event Products 111,384<br />
Retailer Co‐op Products 13<br />
Residential Demand Response Devices 1,328<br />
Residential New Construction Houses 0<br />
Business Program<br />
Efficiency: Equipment Replacement Projects 582<br />
Direct Install Lighting Projects 3,946<br />
Existing Building Commissioning Incentive Buildings 0<br />
New Construction and Major Renovation<br />
Incentive<br />
Buildings 0<br />
<strong>Energy</strong> Audit Audits 60<br />
Commercial Demand Response Devices 36<br />
Demand Response 3 Facilities 26<br />
Industrial Program<br />
Process & System Upgrades Projects 0<br />
Monitoring & Targeting Projects 0<br />
<strong>Energy</strong> Manager Managers 0<br />
Efficiency: Equipment Replacement Incentive Projects 32<br />
Demand Response 3 Facilities 17<br />
Home Assistance Program<br />
Home Assistance Program Homes 0<br />
Pre 2011 Programs Completed in 2011<br />
High Performance New Construction Projects 0<br />
<strong>Toronto</strong> Comprehensive ‐ BOMA Projects 331<br />
<strong>Toronto</strong> Comprehensive ‐ BIP Projects 204<br />
<strong>Toronto</strong> Comprehensive ‐ BBP (EB) Projects 18<br />
<strong>Toronto</strong> Comprehensive ‐ BBP (NC) Projects 24<br />
Multifamily <strong>Energy</strong> Efficiency Rebates Projects 107<br />
THESL 2011 CDM Annual Report<br />
09/30/2012 24
3.2 Program Spending<br />
Table 5 summarizes the total spending by initiative THESL has incurred in 2011. It is detailed by the<br />
Program Administration Budget (“PAB”), Participant Based Funding (“PBF”) and Participant Incentive<br />
(“PI”).<br />
Table 5: Summary of Spending in 2011 for OPA Programs<br />
CDM Program Initiatives PAB PBF PI Total<br />
Consumer Program $ 3,219,075<br />
$ 22,900 $ 3,241,975<br />
Appliance Retirement $ 772,370<br />
$ 772,370<br />
Appliance Exchange $ 102,210<br />
$ 102,210<br />
HVAC Incentive $ 849,530<br />
$ 849,530<br />
Conservation Instant Coupon Booklet $ 448,855<br />
$ 448,855<br />
Bi‐Annual Retailer Event $ 66,293<br />
$ 66,293<br />
Residential & Small Commercial Demand Response $ 581,051<br />
$ 22,900 $ 603,951<br />
Residential New Construction $ 240,481<br />
$ 240,481<br />
Midstream Electronics $ 47,131<br />
$ 47,131<br />
Midstream Pool Equipment $ 47,080<br />
$ 47,080<br />
Home <strong>Energy</strong> Assessment Tool $ 64,072<br />
$ 64,072<br />
Business Program $ 3,753,223 $ 911,400 $ 3,684,178 $ 8,348,802<br />
Equipment Replacement Incentive $ 1,587,839<br />
$ 377,284 $ 1,965,122<br />
Direct Install Lighting $ 640,050 $ 911,400 $ 3,306,894 $ 4,858,344<br />
Existing Building Commissioning Incentive $ 428,070<br />
$ 428,070<br />
New Construction & Major Renovation Incentive $ 451,592<br />
$ 451,592<br />
<strong>Energy</strong> Audit $ 504,139<br />
$ 504,139<br />
Direct Service Space Cooling $ 141,534<br />
$ 141,534<br />
Industrial Program $ 570,135<br />
$ 570,135<br />
Process & System Upgrades $ 148,159<br />
$ 148,159<br />
Monitoring & Targeting $ 40,521<br />
$ 40,521<br />
<strong>Energy</strong> Manager $ 14,790<br />
$ 14,790<br />
DR 1 $ 125,709<br />
$ 125,709<br />
DR 3 $ 240,956<br />
$ 240,956<br />
Home Assistance Program $ 84,747<br />
$ 84,747<br />
Pre‐2011 CDM Programs $ ‐ $ ‐ $ 1,853,496 $ 1,853,496<br />
Total Spending $ 7,627,181 $ 911,400 $ 5,560,574 $ 14,099,155<br />
The above spending includes the expenditures associated with planning activities for the initiatives not<br />
launched in 2011 (i.e. Midstream Electronics, Midstream Pool Equipment, Direct Service Space<br />
Cooling and Home Assistance) and excludes participant incentives for the Consumer Program (other<br />
than Residential DR), DR 1 and DR 3, which are paid directly by the OPA to participants.<br />
Pre-2011 CDM Program spending is for participant incentives paid by OPA in 2011. OPA manages<br />
and controls the complete financial reporting for the province-wide programs.<br />
THESL 2011 CDM Annual Report<br />
09/30/2012 25
3.3 Savings Results<br />
Table 6: Summary Savings Results for 2011 OPA Programs<br />
Program<br />
Consumer Program Total<br />
Business Program Total<br />
Industrial Program Total<br />
Pre‐2011 Programs completed in 2011 Total<br />
Total OPA Programs<br />
Incremental Peak<br />
Demand Savings<br />
(kW)<br />
Table 7: Detailed Savings Results for 2011 OPA Programs<br />
Gross Savings Net Savings Contribution to Targets<br />
Incremental<br />
<strong>Energy</strong> Savings<br />
(kWh)<br />
Incremental<br />
Peak Demand<br />
Savings (kW)<br />
Incremental<br />
<strong>Energy</strong> Savings<br />
(kWh)<br />
Program‐to‐Date: Net<br />
Annual Peak Demand<br />
Savings (kW) in 2014<br />
Program‐to‐Date: 2011‐<br />
2014 Net Cumulative<br />
<strong>Energy</strong> Savings (kWh)<br />
11,342 28,213,749 7,184 19,097,886 6,369 76,321,764<br />
18,077 73,524,091 14,369 55,765,683 10,576 216,190,724<br />
12,613 4,563,066 10,545 3,605,917 522 12,658,513<br />
35,943 183,727,812 17,727 94,450,215 17,727 377,800,859<br />
77,974 290,028,718 49,825 172,919,701 35,193 682,971,860<br />
Realization Rate<br />
Gross Savings<br />
Net‐to‐Gross Ratio<br />
Net Savings in 2011<br />
Contribution to Targets<br />
Initiative<br />
Peak<br />
Demand<br />
Savings<br />
<strong>Energy</strong><br />
Savings<br />
Incremental Peak<br />
Demand Savings<br />
(kW)<br />
Incremental<br />
<strong>Energy</strong> Savings<br />
(kWh)<br />
Peak<br />
Demand<br />
Savings<br />
<strong>Energy</strong><br />
Savings<br />
Incremental<br />
Peak Demand<br />
Savings (kW)<br />
THESL 2011 CDM Annual Report<br />
09/28/2012 26<br />
Incremental<br />
<strong>Energy</strong> Savings<br />
(kWh)<br />
Program‐to‐Date: Net<br />
Annual Peak Demand<br />
Savings (kW) in 2014<br />
Program‐to‐Date: 2011‐<br />
2014 Net Cumulative<br />
<strong>Energy</strong> Savings (kWh)<br />
Consumer Program 11,342 28,213,749 7,184 19,097,886 6,369 76,321,764<br />
Appliance Retirement 100% 100% 751 4,896,184 49% 50% 349 2,343,820 317 9,346,505<br />
Appliance Exchange 100% 100% 101 112,306 52% 52% 52 57,879 13 196,285<br />
HVAC Incentives 100% 100% 9,421 17,547,359 60% 60% 5,674 10,493,166 5,674 41,972,664<br />
Conservation Instant Coupon Booklet 100% 100% 133 2,213,090 114% 111% 150 2,439,881 150 9,759,523<br />
Bi‐Annual Retailer Event 100% 100% 192 3,442,548 113% 110% 215 3,760,986 215 15,043,944<br />
Retailer Co‐op 100% 100% 0 339 68% 68% 0 230 0 919<br />
Residential Demand Response 0% 0% 743 1,924 ‐ ‐ 743 1,924 0 1,924<br />
Business Program 18,077 73,524,091 14,369 55,765,683 10,576 216,190,724<br />
Efficiency: Equipment Replacement 98% 102% 10,942 59,789,306 69% 72% 7,527 43,007,032 7,527 172,028,127<br />
Direct Install Lighting 108% 90% 4,579 13,659,691 93% 93% 4,903 12,683,558 3,048 44,087,503<br />
Commercial Demand Response 0% 0% 23 84 ‐ ‐ 23 84 0 84<br />
Demand Response 3 76% 100% 2,533 75,010 n/a n/a 1,915 75,010 0 75,010<br />
Industrial Program 12,613 4,563,066 10,545 3,605,917 522 12,658,513<br />
Efficiency: Equipment Replacement Incentive 91% 117% 719 3,974,681 73% 76% 522 3,017,532 522 12,070,127<br />
Demand Response 3 84% 100% 11,894 588,385 n/a n/a 10,024 588,385 0 588,385<br />
Pre‐2011 Programs completed in 2011 35,943 183,727,812 17,727 94,450,215 17,727 377,800,859<br />
High Performance New Construction 100% 100% 33 168,988 50% 50% 16 84,494 16 337,976<br />
<strong>Toronto</strong> Comprehensive ‐ BOMA 133% 115% 21,010 99,048,907 41% 41% 8,614 40,610,052 8,614 162,440,207<br />
<strong>Toronto</strong> Comprehensive ‐ BIP 99% 99% 8,099 57,471,094 69% 69% 5,600 39,788,597 5,600 159,154,389<br />
<strong>Toronto</strong> Comprehensive ‐ BBP (EB) 99% 144% 528 3,185,542 47% 47% 251 1,538,476 251 6,153,903<br />
<strong>Toronto</strong> Comprehensive ‐ BBP (NC) 101% 178% 3,830 14,365,032 35% 35% 1,340 5,027,761 1,340 20,111,045<br />
Multifamily <strong>Energy</strong> Efficiency Rebates 93% 93% 2,443 9,488,249 78% 78% 1,906 7,400,835 1,906 29,603,338<br />
Assumes demand response resources have a persistence of 1 year
4 Combined CDM Reporting Elements<br />
4.1 Progress Towards CDM Targets<br />
The summary of THESL’s progress towards meeting its CDM targets is provided in the tables below.<br />
The data comes from the 2011 final results released by OPA on August 31, 2012. The cells<br />
highlighted in yellow reference the CDM Strategy submitted by THESL in 2010.<br />
Table 8: Net Peak Demand Savings at the End User Level (MW)<br />
Implementation Period<br />
Annual<br />
2011 2012 2013 2014<br />
2011 - Verified 49.83 37.08 36.69 35.19<br />
Verified Net Annual Peak Demand Savings Persisting in 2014<br />
THESL 2014 Annual CDM Capacity Target<br />
Verified Portion of Peak Demand Savings Target Achieved in 2014 (%)<br />
LDC Milestone submitted for 2011<br />
Variance<br />
35.19<br />
286.27<br />
12.29%<br />
49.56<br />
0.3<br />
The summer peak demand savings for 2011 are 49.8 MW, which is consistent with the predicted<br />
savings in the CDM Strategy of 49.6 MW. Of the total demand reduction, 36% was attributable to<br />
transition projects (i.e. programs that ended prior to the launch of the OPA Programs). The decline in<br />
demand savings noted in years 2012 to 2014 is due to the demand savings persistence with regard to<br />
DR 3 contracts. However, at this point in time THESL assumes that the current aggregate of contracts<br />
will persist until 2014. Based on this assumption, the contribution from the 2011 results to the 2014<br />
target will be 17.4% as reported by OPA.<br />
Table 9: Net <strong>Energy</strong> Savings at the End‐User Level (GWh)<br />
Implementation Period<br />
Annual<br />
Cumulative<br />
2011 2012 2013 2014 2011-2014<br />
2011 - Verified 172.92 172.13 171.02 166.90 682.97<br />
Verified Net Cumulative <strong>Energy</strong> Savings 2011-2014<br />
THESL 2011-2014 Cumulative CDM <strong>Energy</strong> Target<br />
Verified Portion of Cumulative <strong>Energy</strong> Target Achieved (%)<br />
LDC Milestone submitted for 2011<br />
Variance<br />
682.97<br />
1,303.99<br />
52.38%<br />
284.84<br />
-111.92<br />
<strong>Energy</strong> savings in 2011 are lower than the target in the CDM Strategy due to higher achievement from<br />
demand response initiatives that do not contribute to energy savings. However, taking into account the<br />
persistence of savings, THESL has achieved 52% of the four year energy savings target. Of this total,<br />
transition projects (i.e. programs that ended prior to the launch of the OPA Programs) represented<br />
55% of the energy savings for 2011 and clearly demonstrate the importance of the OPA Program<br />
stability on achieving results.<br />
THESL 2011 CDM Annual Report<br />
09/28/2012 27
4.2 THESL’s CDM Outlook (2012-2014)<br />
As indicated in Table 10 below, the savings projections from the CDM Strategy have been reforecast<br />
to incorporate THESL’s experience with the OPA Programs after they have been in market for one<br />
year.<br />
Table 10: 2012-2014 Outlook<br />
OPA Programs 2011 2012‐2014 Forecast Total Target<br />
Actual 2012 2013 2014 2011‐2014 2011‐2014 Variance<br />
Net Annual MW 49.8 49.9 50.5 46.3 196.6 286.3 ‐89.7<br />
2011‐2014 Net Cumulative GWh 683.0 930.1 1,201.0 1,322.9 1,322.9 1,304.0 18.9<br />
Given the end date of December 31, 2014 for the current OPA Programs, it is projected that THESL<br />
will achieve 196.6 MW of summer peak demand savings and 1,322.9 GWh of electricity savings.<br />
Based on this projection, THESL expects to be 89.7 MW below the demand target and 18.9 GWh<br />
above the electricity savings target,<br />
The projected demand shortfall is primarily a result of THESL’s reliance, in its original CDM Strategy,<br />
on 67 MW of demand reduction from potential <strong>Board</strong>-Approved programs. Other contributors to the<br />
demand shortfall are OPA Program launch delays and market saturation in some OPA Programs, as<br />
well as the slowing economy.<br />
The electricity consumption savings are favourable mainly due to the number of transition projects that<br />
were counted towards THESL’s results and a number of energy-savings-only projects that are<br />
expected to be implemented.<br />
4.3 CDM Strategy Modifications<br />
After market analysis of the 2011 results and the in-market experience gained from delivering OPA<br />
Programs, the CDM Strategy has been revised to account for the following:<br />
1. Need for Additional Programs<br />
The disallowance of a large portion of THESL’s application for <strong>Board</strong>-Approved programs has<br />
resulted in a potential 67 MW shortfall in its forecast as contained within its CDM Strategy. To<br />
make up for the potential shortfall, THESL will continue to work with the OPA and the LDC<br />
Working Groups through the “Change Management” process to implement the initiatives<br />
previously submitted to the OEB for approval. These include “<strong>Hydro</strong>nic System Balancing”, “Multi-<br />
Unit Residential Building Demand Response”, “Monitoring and Targeting”, and “Commercial<br />
<strong>Energy</strong> Management and Load Control”. As of the end of 2011, initial discussions have been<br />
occurring and two of the four initiatives are in the Change Management process.<br />
2. Acceptance of TOU Savings<br />
The TOU was accepted by the OEB as a <strong>Board</strong>-Approved program and savings resulting from the<br />
TOU will be counted towards LDC assigned targets. As outlined in the OEB’s CDM Guidelines,<br />
THESL will work with the OPA and other LDCs to develop a plan for independent third party<br />
evaluation of the results. The savings results for TOU are not expected to be available until 2013.<br />
3. Delayed Start of Programs and Market Saturation<br />
The delayed launch of some of the OPA Programs impacted the take-up rates and has delayed<br />
the accumulation of savings. As a result, THESL has:<br />
• Launched a new channel delivery strategy, called Applicant Representative Initiative (“ARI”),<br />
was developed in late 2011 and introduced to the business market in early 2012.<br />
THESL 2011 CDM Annual Report<br />
09/28/2012 28
• Increased market and promotional initiatives and target high potential market sectors for<br />
demand response and retrofit initiatives.<br />
• Continued to collaborate with the community, business and industry associations to engage as<br />
wide a cross section of the market as possible.<br />
• Worked with the OPA to:<br />
– Complete tools and administration processes required to launch the Home Assistance<br />
Program.<br />
– Enhance and improve the marketing of residential initiatives and allow THESL to take on<br />
a more leading role in developing promotional campaigns for THESL’s residential<br />
customers.<br />
– Allow THESL a more active role in the delivery of the DR 3 initiative and provide greater<br />
transparency of market achievements and program results.<br />
• Expanded the roll out of the Key Account Manager, Roving <strong>Energy</strong> Manager and Embedded<br />
<strong>Energy</strong> Manager initiative. THESL will leverage this initiative (with other sales, technical and<br />
program activities) to coordinate and deliver a comprehensive and planned approach to<br />
conservation in the business and industrial sectors.<br />
• Work with other LDCs to share delivery tactics, co-promote programs and develop ideas for<br />
program development.<br />
4. Changing Evaluation Measurement and Verification (“EM&V”) Results<br />
• Review all findings and recommendations from the OPA’s 2011 program evaluation reports<br />
and adopt them where relevant to THESL’s territory including new Net-to-Gross (“NTG”) ratios.<br />
• Participate in EM&V working groups to fully understand any upcoming changes in the savings<br />
results.<br />
4.4 Conclusion<br />
Over the course of 2011, THESL has achieved 49.8 MW in peak demand savings and 172.9 GWh in<br />
energy savings, which represents 23% and 29% of the provincial totals, respectively. While the results<br />
for 2011 were considerable, THESL nonetheless faces challenges in the remaining years of the<br />
current CDM framework. With the current slate of available OPA Programs, and the current forecast of<br />
implementation and projected savings, THESL expects to meet its energy consumption target but will<br />
struggle to meet its demand savings target. THESL expects a 90 MW shortfall to its target in demand<br />
savings by the end of 2014.<br />
Given that 2011 was a mobilization year, there was considerable collaboration between the OPA, EDA<br />
and LDCs to overcome many operational and structural issues that limited program effectiveness<br />
across all market sectors. To date, many improvements have already been implemented which<br />
contributed to the eventual successful delivery of the OPA Program initiatives, particularly those in the<br />
business sector. The high level of collaboration continues to explore improvements to existing<br />
initiatives, the development of new initiatives, as well as improvements in the Change Management<br />
process which will all provide benefits in the remaining years.<br />
However, despite continuing improvements to existing programs to overcome operational and<br />
structural issues and improve program effectiveness, THESL submits that additional program<br />
initiatives will be required. Even with new programs, THESL expects that they on their own will be<br />
insufficient for THESL to achieve its demand savings target due to the limited timeframe remaining<br />
prior to the end of 2014 and the lengthy time period required to bring new programs to market.<br />
Additional framework changes may need to be explored.<br />
THESL 2011 CDM Annual Report<br />
09/28/2012 29
Appendix A: Evaluation Findings for the OPA Programs<br />
The following are the findings from OPA Program evaluations conducted in 2012 by the OPA’s independent third party evaluators on OPA<br />
Program initiatives delivered in 2011 and projects from pre-2011 programs that were completed in 2011. The information was provided by the<br />
OPA to THESL on August 31, 2012 and has been reproduced (in an unaltered form) below:<br />
# Initiative<br />
Consumer Program<br />
1 Appliance Retirement<br />
2 Appliance Exchange<br />
3 HVAC Incentives<br />
*<br />
*<br />
*<br />
*<br />
*<br />
*<br />
*<br />
*<br />
*<br />
*<br />
*<br />
*<br />
OPA Province‐Wide Key Evaluation Findings<br />
Overall participation continues to decline year over year<br />
* Participation declined 17% from 2010 (from over 67,000 units in 2010 to over 56,000 units in 2011)<br />
97% of net resource savings achieved through the home pick‐up stream<br />
* Measure Breakdown: 66% refrigerators, 30% freezers, 4% Dehumidifiers and window air conditioners<br />
3% of net resource savings achieved through the Retailer pick‐up stream<br />
* Measure Breakdown: 90% refrigerators, 10% freezers<br />
Net‐to‐Gross ratio for the initiative was 50%<br />
* Measure‐level free ridership ranges from 82% for the retailer pick‐up stream to 49% for the home pick‐up stream<br />
* Measure‐level spillover ranges from 3.7% for the retailer pick‐up stream to 1.7% for the home pick‐up stream<br />
Overall eligible units exchanged declined by 36% from 2010 (from over 5,700 units in 2010 to over 3,600 units in 2011)<br />
* Measure Breakdown: 75% window air conditioners, 25% dehumidifiers<br />
Dehumidifiers and window air conditioners contributed almost equally to the net energy savings achieved<br />
* Dehumidifiers provide more than three times the energy savings per unit than window air conditioners<br />
Window air conditioners contributed to 64% of the net peak demand savings achieved<br />
Approximately 96% of consumers reported having replaced their exchanged units (as opposed to retiring the unit)<br />
Net‐to‐Gross ratio for the initiative is consistent with previous evaluations (51.5%)<br />
Total air conditioner and furnace installations increased by 14% (from over 95,800 units in 2010 to over 111,500 units in 2011)<br />
* Measure Breakdown: 64% furnaces, 10% tier 1 air conditioners (SEER 14.5) and 26% tier 2 air conditioners (SEER 15)<br />
* Measure breakdown did not change from 2010 to 2011<br />
The HVAC Incentives initiative continues to deliver the majority of both the energy (45%) and demand (83%) savings in the consumer program<br />
* Furnaces accounted for over 91% of energy savings achieved for this initiative<br />
Net‐to‐Gross ratio for the initiative was 17% higher than 2010 (from 43% in 2010 to 60% in 2011)<br />
* Increase due in part to the removal of programmable thermostats from the program, and an increase in the net‐to‐gross ratio for both<br />
Furnaces and Tier 2 air conditioners (SEER 15)<br />
THESL 2011 CDM Annual Report<br />
09/28/2012 30
# Initiative<br />
Consumer Program<br />
4<br />
Conservation Instant<br />
Coupon Booklet<br />
5 Bi‐Annual Retailer Event<br />
6 Retailer Co‐op<br />
7<br />
8<br />
Residential Demand<br />
Response<br />
Business Program<br />
9<br />
Residential New<br />
Construction<br />
Efficiency: Equipment<br />
Replacement<br />
*<br />
*<br />
*<br />
*<br />
*<br />
*<br />
*<br />
*<br />
*<br />
*<br />
*<br />
*<br />
*<br />
*<br />
*<br />
*<br />
OPA Province‐Wide Key Evaluation Findings<br />
Customers redeemed nearly 210,000 coupons, translating to nearly 560,000 products<br />
* Majority of coupons redeemed were downloadable (~40%) or LDC‐branded (~35%)<br />
* Majority of coupons redeemed were for multi‐packs of standard spiral CFLs (37%), followed by multi‐packs of specialty CFLs (17%)<br />
Per unit savings estimates and net‐to‐gross ratios for 2011 are based on a weighted average of 2009 and 2010 evaluation findings<br />
Careful attention in the 2012 evaluation will be made for standard CFLs since it is believed that the market has largely been transformed<br />
Customers redeemed nearly 370,000 coupons, translating to over 870,000 products<br />
* Majority of coupons redeemed were for multi‐packs of standard spiral CFLs (49%), followed by multi‐packs of specialty CFLs (16%)<br />
Per unit savings estimates and net‐to‐gross ratios for 2011 are based on a weighted average of 2009 and 2010 evaluation findings<br />
* Standard CFLs and heavy duty outdoor timers were reintroduced to the initiative in 2011 and contributed more than 64% of the<br />
initiative’s 2011 net annual energy savings<br />
* While the volume of coupons redeemed for heavy duty outdoor timers was relatively small (less than 1%), the measure accounted for<br />
10% of net annual savings due to high per unit savings<br />
Careful attention in the 2012 evaluation will be made for standard CFLs since it is believed that the market has largely been transformed.<br />
Initiative was not evaluated in 2011 due to low uptake. Verified Bi‐Annual Retailer Event per unit assumptions and free‐ridership rates were<br />
used to calculate net resource savings<br />
Approximately 20,000 new devices were installed in 2011<br />
* 99% of the new devices enrolled controlled residential central AC (CAC)<br />
2011 only saw 1 atypical event (in both weather and timing) that had limited participation across the province<br />
* The ex ante impact developed through the 2009/2010 evaluations was maintained for 2011; residential CAC: 0.56 kW/device,<br />
commercial CAC: 0.64 kW/device, and Electric Water Heaters: 0.30 kW/device<br />
Initiative was not evaluated in 2011 due to limited uptake<br />
Business case assumptions were used to calculate savings<br />
Gross verified energy savings were boosted by lighting projects in the prescriptive and custom measure tracks<br />
Lighting projects overall were determined to have a realization rate of 112%; 116% when including interactive energy changes<br />
* On average, the evaluation found high realization rates as a result of both longer operating hours and larger wattage reductions than<br />
initial assumptions<br />
* Low realization rates for engineered lighting projects due to overstated operating hour assumptions<br />
Custom non‐lighting projects suffered from process issues such as: the absence of required M&V plans, the use of inappropriate<br />
assumptions , and the lack of adherence to the M&V plan<br />
The final realization rate for summer peak demand was 94%<br />
* 84% was a result of different methodologies used to calculate peak demand savings<br />
* 10% due to the benefits from reduced air conditioning load in lighting retrofits<br />
Overall net‐to‐gross ratios in the low 70’s represent an improvement over the 2009 and 2010 ERIP program where net‐to‐gross ratios were<br />
Strict eligibility requirements and improvements in the pre‐approval process contributed to the improvement in net‐to‐gross ratios<br />
THESL 2011 CDM Annual Report<br />
09/28/2012 31
# Initiative<br />
Business Program<br />
10 Direct Install Lighting<br />
*<br />
*<br />
*<br />
OPA Province‐Wide Key Evaluation Findings<br />
Though overall performance is above expectations, participation continues to decline year over year as the initiative reaches maturity<br />
70% of province‐wide resource savings persist to 2014<br />
* Over 35% of the projects for 2011 included at least one CFL measure<br />
* Resource savings from CFLs in the commercial sector only persist for the industry standard of 3 years<br />
Since 2009 the overall realization rate for this program has improved<br />
* 2011 evaluation recorded the highest energy realization rate to date at 89.5%<br />
* The hours of use values were held constant from the 2010 evaluation and continue to be the main driver of energy realization rate<br />
* Lights installed in “as needed” areas (e.g., bathrooms, storage areas) were determined to have very low realization rates due to the<br />
difference in actual energy saved vs. reported savings<br />
11<br />
Existing Building<br />
Commissioning Incentive<br />
*<br />
Initiative was not evaluated in 2011, no completed projects in 2011<br />
12<br />
13 <strong>Energy</strong> Audit<br />
14<br />
New Construction and<br />
Major Renovation<br />
Incentive<br />
Commercial Demand<br />
Response (part of the<br />
Residential program<br />
schedule)<br />
*<br />
*<br />
*<br />
*<br />
Initiative was not evaluated in 2011 due to low uptake<br />
Assumptions used are consistent with preliminary reporting based on the 2010 Evaluation findings and consultation with the C&I Work<br />
Group (100% realization rate and 50% net‐to‐gross ratio)<br />
The evaluation is ongoing. The sample size for 2011 was too small to draw reliable conclusions.<br />
See residential demand response (#7)<br />
15<br />
Demand Response 3<br />
(part of the Industrial<br />
program schedule)<br />
*<br />
See Demand Response 3 (#20)<br />
THESL 2011 CDM Annual Report<br />
09/28/2012 32
# Initiative<br />
Industrial Program<br />
16<br />
Process & System<br />
Upgrades<br />
*<br />
OPA Province‐Wide Key Evaluation Findings<br />
Initiative was not evaluated in 2011, no completed projects in 2011<br />
17 Monitoring & Targeting<br />
* Initiative was not evaluated in 2011, no completed projects in 2011<br />
18 <strong>Energy</strong> Manager<br />
19<br />
Efficiency: Equipment<br />
Replacement Incentive<br />
(part of the C&I program<br />
schedule)<br />
20 Demand Response 3<br />
Home Assistance Program<br />
Program performance for Tier 1 customers increased with DR‐3 participants providing 75% of contracted MW for both sectors<br />
* Industrial customers outperform commercial customers by provide 84% and 76% of contracted MW, respectively<br />
High Performance New * Initiative was not evaluated<br />
Construction * Net‐to‐Gross ratios used are consistent with the 2010 evaluation findings (realization rate of 100% and net‐to‐gross ratio of 50%)<br />
*<br />
*<br />
*<br />
Initiative was not evaluated in 2011, no completed projects in 2011<br />
* See Efficiency: Equipment Replacement (#9)<br />
*<br />
*<br />
*<br />
Home Assistance * Initiative was not evaluated in 2011 due to low uptake<br />
21<br />
Program * Business Case assumptions were used to calculate savings<br />
Pre‐2011 Programs completed in 2011<br />
23<br />
* Initiative was not evaluated<br />
24 <strong>Toronto</strong> Comprehensive<br />
* Net‐to‐Gross ratios used are consistent with the 2010 evaluation findings<br />
25<br />
Multifamily <strong>Energy</strong><br />
Efficiency Rebates<br />
Program continues to diversify but still remains heavily concentrated with less than 5% of the contributors accounting for the majority<br />
By increasing the number of contributors in each settlement account and implementation of the new baseline methodology the<br />
performance of the program is expected to increase<br />
Initiative was not evaluated<br />
Net‐to‐Gross ratios used are consistent with the 2010 evaluation findings<br />
THESL 2011 CDM Annual Report<br />
09/28/2012 33
Disclaimer<br />
The information in these materials is based on information currently available to <strong>Toronto</strong> <strong>Hydro</strong><br />
Corporation and its affiliates (together hereinafter referred to as “<strong>Toronto</strong> <strong>Hydro</strong>”), and is provided for<br />
information purposes only. <strong>Toronto</strong> <strong>Hydro</strong> does not warrant the accuracy, reliability, completeness or<br />
timeliness of the information and undertakes no obligation to revise or update these materials.<br />
<strong>Toronto</strong> <strong>Hydro</strong> (including its directors, officers, employees, agents and subcontractors) hereby waives<br />
any and all liability for damages of whatever kind and nature which may occur or be suffered as a<br />
result of the use of these materials or reliance on the information therein. These materials may also<br />
contain forward-looking information within the meaning of applicable securities laws in Canada<br />
("Forward-Looking Information"). The purpose of the Forward-Looking Information is to provide<br />
<strong>Toronto</strong> <strong>Hydro</strong>’s expectations about future results of operations, performance, business prospects and<br />
opportunities and may not be appropriate for other purposes. All Forward-Looking Information is given<br />
pursuant to the "safe harbour" provisions of applicable Canadian securities legislation. The words<br />
"anticipates", "believes", "budgets", "could", "estimates", "expects", "forecasts", "intends", "may",<br />
"might", "plans", "projects", "schedule", "should", "will", "would" and similar expressions are often<br />
intended to identify Forward-Looking Information, although not all Forward-Looking Information<br />
contains these identifying words. The Forward-Looking Information reflects the current beliefs of, and<br />
is based on information currently available to, <strong>Toronto</strong> <strong>Hydro</strong>’s management. The Forward-Looking<br />
Information in these materials includes, but is not limited to, statements regarding <strong>Toronto</strong> <strong>Hydro</strong>’s<br />
future results of operations, performance, business prospects and opportunities. The statements that<br />
make up the Forward-Looking Information are based on assumptions that include, but are not limited<br />
to, the future course of the economy and financial markets, the receipt of applicable regulatory<br />
approvals and requested rate orders, the receipt of favourable judgments, the level of interest rates,<br />
<strong>Toronto</strong> <strong>Hydro</strong>’s ability to borrow, and the fair market value of <strong>Toronto</strong> <strong>Hydro</strong>’s investments. The<br />
Forward-Looking Information is subject to risks, uncertainties and other factors that could cause actual<br />
results to differ materially from historical results or results anticipated by the Forward-Looking<br />
Information. The factors which could cause results or events to differ from current expectations<br />
include, but are not limited to, the timing and amount of future cash flows generated by <strong>Toronto</strong><br />
<strong>Hydro</strong>'s investments, market liquidity and the quality of the underlying assets and financial<br />
instruments, the timing and extent of changes in prevailing interest rates, inflation levels, legislative,<br />
judicial and regulatory developments that could affect revenues, and the results of borrowing efforts.<br />
<strong>Toronto</strong> <strong>Hydro</strong> cautions that this list of factors is not exclusive. All Forward-Looking Information in<br />
these materials is qualified in its entirety by the above cautionary statements and, except as required<br />
by law, <strong>Toronto</strong> <strong>Hydro</strong> undertakes no obligation to revise or update any Forward-Looking Information<br />
as a result of new information, future events or otherwise after the date hereof.<br />
THESL 2011 CDM Annual Report<br />
09/28/2012 34