Economic and Employment Impacts of Small Modular Reactors - SMR
Economic and Employment Impacts of Small Modular Reactors - SMR
Economic and Employment Impacts of Small Modular Reactors - SMR
- No tags were found...

Create successful ePaper yourself
Turn your PDF publications into a flip-book with our unique Google optimized e-Paper software.
Table <strong>of</strong> Contents<br />
Section 1: Introduction <strong>and</strong> Highlights ......................................................................................................... 4<br />
Findings at a Glance .................................................................................................................................. 5<br />
Section 2: Benefits <strong>and</strong> Applications <strong>of</strong> <strong>SMR</strong> Technologies .......................................................................... 7<br />
<strong>SMR</strong> Designs .............................................................................................................................................. 7<br />
Attributes .................................................................................................................................................. 9<br />
Electricity Generation ............................................................................................................................. 10<br />
Additional Applications ........................................................................................................................... 12<br />
Desalination ........................................................................................................................................ 12<br />
Process Heat for Industrial Applications <strong>and</strong> District Heating ............................................................ 13<br />
Hydrogen Production .......................................................................................................................... 13<br />
Approach to <strong>SMR</strong> Market Potential ........................................................................................................ 14<br />
Section 3: <strong>SMR</strong> Market Potential ................................................................................................................ 14<br />
Methodology ........................................................................................................................................... 15<br />
Domestic Nuclear Capacity Projections .................................................................................................. 15<br />
International Nuclear Capacity Projections ............................................................................................ 17<br />
<strong>SMR</strong> Share <strong>of</strong> Nuclear Market................................................................................................................. 18<br />
U.S. Market Share for <strong>SMR</strong> Manufacturing ........................................................................................ 20<br />
Overview <strong>of</strong> the Four Cases for <strong>SMR</strong> Manufacture <strong>and</strong> Operation ..................................................... 20<br />
Other Considerations .............................................................................................................................. 22<br />
Overview <strong>of</strong> Results ................................................................................................................................ 24<br />
Section 4: <strong>Economic</strong> <strong>Impacts</strong> ...................................................................................................................... 25<br />
Input-‐Output Analysis ............................................................................................................................. 26<br />
Input-‐Output Model <strong>of</strong> the <strong>SMR</strong> Industry .............................................................................................. 27<br />
Manufacturing <strong>SMR</strong>s. .......................................................................................................................... 28<br />
Construction <strong>of</strong> <strong>SMR</strong>s. ......................................................................................................................... 29<br />
Operation <strong>of</strong> <strong>SMR</strong>s. ............................................................................................................................. 29<br />
Estimating Manufacturing, Construction, <strong>and</strong> Operations Expenditures <strong>and</strong> Revenues ....................... 29<br />
<strong>Economic</strong> <strong>Impacts</strong> <strong>of</strong> a Typical <strong>SMR</strong> Unit ................................................................................................ 30<br />
Sales (Output) Impact Components: Direct, Indirect, <strong>and</strong> Induced <strong>Impacts</strong> per <strong>SMR</strong>. ..................... 31<br />
1
Total <strong>Economic</strong> <strong>Impacts</strong> <strong>of</strong> a Typical <strong>SMR</strong>. ......................................................................................... 33<br />
<strong>Economic</strong> <strong>Impacts</strong> <strong>of</strong> a Developing <strong>SMR</strong> Industry .................................................................................. 33<br />
Projected <strong>Economic</strong> <strong>Impacts</strong> <strong>of</strong> the <strong>SMR</strong> Industry by 2030 .................................................................... 38<br />
Section 5: Concluding Remarks ................................................................................................................... 43<br />
References .................................................................................................................................................. 46<br />
Appendix A: <strong>SMR</strong> Electricity Generation Market Potential (4 cases) ......................................................... 50<br />
Table <strong>of</strong> Figures<br />
Table 1: <strong>SMR</strong> vendors that have submitted letters <strong>of</strong> intent to certify designs to NRC .............................. 8<br />
Figure 1 -‐ Projected Domestic Nuclear Capacity (Total) ............................................................................. 16<br />
Figure 2 -‐ Projected Domestic Nuclear Capacity Additions ........................................................................ 17<br />
Figure 3 -‐ Projected International Nuclear Capacity (Total) ....................................................................... 18<br />
Figure 4 -‐ Projected International Nuclear Capacity Additions .................................................................. 18<br />
Table 2: <strong>SMR</strong> Market Share <strong>of</strong> New Nuclear Power Facilities ................................................................... 20<br />
Table 3: <strong>SMR</strong> Case Overview ...................................................................................................................... 20<br />
Table 4: Low Nuclear Adoption Scenario ................................................................................................... 21<br />
Table 5: Moderate Nuclear Adoption Scenario ......................................................................................... 21<br />
Table 6: High Nuclear Adoption Scenario .................................................................................................. 22<br />
Figure 5 -‐ Projected <strong>SMR</strong>s Operating in the US .......................................................................................... 24<br />
Figure 6 -‐ Projected <strong>SMR</strong>s Manufactured in the U.S. ................................................................................. 25<br />
Table 7: <strong>SMR</strong> Manufacturing Sectors ......................................................................................................... 28<br />
Table 8: <strong>SMR</strong> Construction Sectors ............................................................................................................ 29<br />
Table 9: IMPLAN Output Multipliers .......................................................................................................... 31<br />
Table 10: The <strong>Economic</strong> <strong>Impacts</strong> <strong>of</strong> a Typical <strong>SMR</strong> .................................................................................... 33<br />
Figure 7.a -‐ <strong>Economic</strong> <strong>Impacts</strong> <strong>of</strong> <strong>SMR</strong>s Manufacturing <strong>and</strong> Construction (Sales) .................................... 34<br />
Figure 7.b -‐ <strong>Economic</strong> <strong>Impacts</strong> <strong>of</strong> <strong>SMR</strong>s Manufacturing <strong>and</strong> Construction (Value-‐Added) ....................... 34<br />
Figure 7.c -‐ <strong>Economic</strong> <strong>Impacts</strong> <strong>of</strong> <strong>SMR</strong>s Manufacturing <strong>and</strong> Construction (Earnings/Payroll) .................. 35<br />
Figure 7.d -‐ <strong>Economic</strong> <strong>Impacts</strong> <strong>of</strong> <strong>SMR</strong>s Manufacturing <strong>and</strong> Construction (Jobs) ..................................... 35<br />
Figure 7.e -‐ <strong>Economic</strong> <strong>Impacts</strong> <strong>of</strong> <strong>SMR</strong>s Manufacturing <strong>and</strong> Construction (Indirect Business Taxes) ........ 36<br />
Figure 8.a -‐ <strong>Economic</strong> <strong>Impacts</strong> <strong>of</strong> <strong>SMR</strong>s Operations (Sales) ........................................................................ 36<br />
Figure 8.b -‐ <strong>Economic</strong> <strong>Impacts</strong> <strong>of</strong> <strong>SMR</strong>s Operations (Value-‐Added) ........................................................... 37<br />
Figure 8.c -‐ <strong>Economic</strong> <strong>Impacts</strong> <strong>of</strong> <strong>SMR</strong>s Operations (Earnings/Payroll) ...................................................... 37<br />
2
Figure 8.d -‐ <strong>Economic</strong> <strong>Impacts</strong> <strong>of</strong> <strong>SMR</strong>s Operations (Jobs)......................................................................... 38<br />
Figure 8.e -‐ <strong>Economic</strong> <strong>Impacts</strong> <strong>of</strong> <strong>SMR</strong>s Operations (Indirect Business Taxes) .......................................... 38<br />
Figure 9.a (Manufacturing <strong>and</strong> Construction) Sales (Output) <strong>Economic</strong> <strong>Impacts</strong> in 2030 by Scenario ... 39<br />
Figure 9.b (Manufacturing <strong>and</strong> Construction) Value-‐Added <strong>Economic</strong> <strong>Impacts</strong> in 2030 by Scenario ..... 39<br />
Figure 9.c (Manufacturing <strong>and</strong> Construction) Earnings (Payroll) <strong>Economic</strong> <strong>Impacts</strong> in 2030 by Scenario<br />
.................................................................................................................................................................... 40<br />
Figure 9.d (Manufacturing <strong>and</strong> Construction) Jobs <strong>Economic</strong> <strong>Impacts</strong> in 2030 by Scenario ................... 40<br />
Figure 9.e (Manufacturing <strong>and</strong> Construction) Indirect Business Taxes <strong>Economic</strong> <strong>Impacts</strong> in 2030 by<br />
Scenario....................................................................................................................................................... 41<br />
Figure 10.a (Operations) Sales (Output) <strong>Economic</strong> <strong>Impacts</strong> in 2030 by Scenario ................................... 41<br />
Figure 10.b -‐ (Operations) Value-‐Added <strong>Economic</strong> <strong>Impacts</strong> in 2030 by Scenario<br />
Figure 10.c (Operations) Earnings (Payroll) <strong>Economic</strong> <strong>Impacts</strong> in 2030 by Scenario ............................... 42<br />
Figure 10.d (Operations) Jobs <strong>Economic</strong> <strong>Impacts</strong> in 2030 by Scenario ................................................... 43<br />
Figure 10.e (Operations) Indirect Business Taxes <strong>Economic</strong> <strong>Impacts</strong> in 2030 by Scenario ..................... 43<br />
3
Section 1: Introduction <strong>and</strong> Highlights<br />
Global energy dem<strong>and</strong> is growing <strong>and</strong>, while fossil fuels will continue to play an important role in<br />
supplying future energy requirements, the role <strong>of</strong> nuclear power may increase significantly as rising<br />
energy dem<strong>and</strong> is balanced with the need to effectively address issues such as climate change, domestic<br />
energy security, <strong>and</strong> electricity access <strong>and</strong> utilization by developing economies. While nuclear power is<br />
likely to be a major provider <strong>of</strong> future energy needs, the structure <strong>of</strong> the commercial nuclear power<br />
industry may change. In the U.S., the commercial development <strong>of</strong> nuclear energy during the 1970s was<br />
characterized by large power plants designed to generate electricity. Although the construction <strong>of</strong> new<br />
nuclear power plants experienced a hiatus in the U.S. over recent decades, the continued development<br />
<strong>of</strong> large nuclear plants <strong>of</strong> approximately 1,000 megawatts (MW) 1 <strong>and</strong> higher continued elsewhere <strong>and</strong><br />
demonstrated advances in safety, performance, <strong>and</strong> efficiency. While advances in large nuclear power<br />
facilities continue, the recent resurgence <strong>of</strong> interest in nuclear power in the U.S. has also led to<br />
increased attention <strong>and</strong> statements <strong>of</strong> Administration support for the development <strong>and</strong> licensing <strong>of</strong> new<br />
technologies such as smaller-‐scale reactor systems, including the creation <strong>of</strong> an <strong>of</strong>fice within the<br />
Department <strong>of</strong> Energy to aid in these activities (Chu, 2010; Black, 2010).<br />
Several recent studies <strong>and</strong> government presentations document the revived interest in small nuclear<br />
power reactors for a variety <strong>of</strong> uses (Ingersoll, 2009; Carelli, et al., 2010; Office <strong>of</strong> Nuclear Energy, 2009;<br />
World Nuclear Association, 2010). This increased attention on small reactors is influenced primarily by<br />
factors such as the initial reduced capital costs compared to traditional nuclear facilities <strong>and</strong> the<br />
potential for small nuclear facilities to provide power in areas where the infrastructure to support large<br />
reactors may be lacking. A recent report by the World Nuclear Association generalized the primary<br />
advantages <strong>of</strong> small modular nuclear reactors (<strong>SMR</strong>s) over traditional nuclear reactor designs, stating<br />
<br />
economy <strong>of</strong> mass production, <strong>and</strong> reduced siting costs. Many are also designed for a high level <strong>of</strong><br />
passive or inherent safety in the event <strong>of</strong> malfunction (World Nuclear Association, 2010).<br />
Because <strong>of</strong> such attributes, <strong>SMR</strong>s are capable <strong>of</strong> obtaining a strong market presence <strong>and</strong> supplying an<br />
increasing portion <strong>of</strong> rising energy dem<strong>and</strong> over the coming decades. As a result, a prospective<br />
investigation <strong>of</strong> their market potential <strong>and</strong> economic importance is warranted. This report, conducted<br />
by the Energy Policy Institute, evaluates the future market<br />
potential <strong>and</strong> economic impact <strong>of</strong> the manufacture, construction, <strong>and</strong> operation <strong>of</strong> <strong>SMR</strong>s in the U.S. for<br />
a 20-‐year period. More generally, it seeks to answer an important question: What impacts might<br />
domestic <strong>SMR</strong> manufacture have on the U.S. economy under given scenarios<br />
To do so, this study begins by reviewing the types, advantages, <strong>and</strong> potential uses <strong>of</strong> <strong>SMR</strong>s currently<br />
under development. The market potential is assessed by developing estimates <strong>of</strong> projected energy<br />
dem<strong>and</strong> until 2030, the estimated share <strong>of</strong> energy production by <strong>SMR</strong>s, <strong>and</strong> the estimated market share<br />
<strong>of</strong> <strong>SMR</strong>s likely to be manufactured in the U.S. Four cases are developed to cover a range <strong>of</strong> scenarios <strong>of</strong><br />
1 Throughout the report, MW refers to electrical capacity except where specifically noted.<br />
4
future energy dem<strong>and</strong> <strong>and</strong> <strong>SMR</strong> adoption. The economic impacts <strong>of</strong> a domestic <strong>SMR</strong> industry are then<br />
estimated by calculating the effects <strong>of</strong> manufacturing <strong>SMR</strong>s in the U.S. for both domestic use <strong>and</strong> for<br />
export to other countries. In addition to the impacts from manufacturing <strong>and</strong> constructing <strong>SMR</strong>s in the<br />
U.S., the continuing operation <strong>of</strong> <strong>SMR</strong>s will generate further economic activity, the impacts <strong>of</strong> which are<br />
also estimated in this study.<br />
Total nuclear market share for electricity generation in each case comes from established models <strong>and</strong><br />
datasets provided by the US Energy Information Administration, the International Atomic Energy<br />
Agency, <strong>and</strong> the Electric Power Research Institute. These models <strong>and</strong> datasets internalize some<br />
displacement <strong>of</strong> fossil fuels by nuclear power due to greenhouse gas regulation <strong>and</strong> technological<br />
advances. The<strong>SMR</strong>s are assumed to capture only a share <strong>of</strong> the<br />
forecasted nuclear power capacity additions. It is reasonable to posit that <strong>SMR</strong>s are capable <strong>of</strong><br />
displacing additional non-‐nuclear electricity generation sources, but this displacement depends on<br />
factors outside <strong>of</strong> the study parameters <strong>and</strong> the datasets provided by the above organizations.<br />
Findings at a Glance<br />
‣ Types <strong>of</strong> <strong>SMR</strong> designs are reviewed<br />
<strong>SMR</strong>s utilizing light water reactor (LWR) designs have advantages for Nuclear Regulatory<br />
Commission (NRC) licensing requirements in the U.S.<br />
‣ <strong>SMR</strong>s have some advantages over large-‐scale facilities<br />
Relatively small size <strong>and</strong> modularity means lower initial capital expenditures, shorter<br />
manufacturing lead-‐times, <strong>and</strong> potentially less risk <strong>of</strong> cost overruns.<br />
<strong>Modular</strong> design <strong>of</strong>fers better matching to a variety <strong>of</strong> grid infrastructure, has the ability<br />
to incrementally increase supply, <strong>and</strong> <strong>of</strong>fers flexibility in adapting to changing market<br />
conditions.<br />
<strong>SMR</strong>s <strong>of</strong>fer improved fabrication <strong>and</strong> construction logistics.<br />
<strong>SMR</strong>s retain, <strong>and</strong> seek to enhance, the safety features <strong>of</strong> conventional nuclear plants.<br />
Also, as with conventional nuclear plants, <strong>SMR</strong>s produce essentially zero criteria <strong>and</strong> carbon<br />
dioxide emissions.<br />
‣ <strong>SMR</strong>s can be used for a variety <strong>of</strong> purposes<br />
In addition to electricity generation, <strong>SMR</strong>s are suitable for industrial heating,<br />
desalination, <strong>and</strong> hydrogen production, as well as other uses. Although this report<br />
discusses a range <strong>of</strong> possible uses for <strong>SMR</strong>s, it does not quantitatively incorporate uses<br />
other than electricity generation into the dem<strong>and</strong> projections because <strong>of</strong> the degree <strong>of</strong><br />
uncertainty involved with projecting the dem<strong>and</strong> for alternative uses.<br />
‣ Four scenarios for the growth <strong>of</strong> the domestic <strong>SMR</strong> industry through 2030 are analyzed, based<br />
on projections <strong>of</strong> growth in nuclear power capacity, <strong>SMR</strong> market share <strong>of</strong> the capacity growth,<br />
<strong>and</strong> the market penetration <strong>of</strong> U.S. manufacturers.<br />
5
High Nuclear Adoption Case: With high rates <strong>of</strong> added nuclear capacity, moderate rates<br />
<strong>of</strong> <strong>SMR</strong> market share <strong>of</strong> added nuclear capacity, <strong>and</strong> moderate market penetration by<br />
domestic <strong>SMR</strong> manufacturers, almost 40 <strong>SMR</strong>s will be manufactured annually in the U.S.<br />
by 2030. This represents a strong greenhouse gas legislation case.<br />
Moderate Nuclear Adoption Case: With moderate rates <strong>of</strong> added nuclear capacity,<br />
moderate rates <strong>of</strong> <strong>SMR</strong> market share <strong>of</strong> added nuclear capacity, <strong>and</strong> moderate market<br />
penetration by domestic <strong>SMR</strong> manufacturers, an estimated 30 <strong>SMR</strong> units will be<br />
manufactured annually in the U.S. by 2030.<br />
Low Nuclear Adoption Case: With low rates <strong>of</strong> added nuclear capacity, moderate rates<br />
<strong>of</strong> <strong>SMR</strong> market share <strong>of</strong> added nuclear capacity, <strong>and</strong> moderate market penetration <strong>of</strong><br />
domestic <strong>SMR</strong> manufacturers, only a few <strong>SMR</strong> units will be manufactured annually in<br />
the U.S. by 2030. -‐as-‐se.<br />
<br />
capacity, disruptively high rates <strong>of</strong> <strong>SMR</strong> market share <strong>of</strong> added nuclear capacity, <strong>and</strong><br />
moderate market penetration by domestic <strong>SMR</strong> manufacturers, approximately 85 <strong>SMR</strong><br />
units will be manufactured annually in the U.S. by 2030.<br />
‣ An economic analysis estimates the total economic impacts <strong>of</strong> <strong>SMR</strong> manufacturing,<br />
construction, <strong>and</strong> operation <strong>of</strong> a representative 100 MW <strong>SMR</strong> unit.<br />
A prototypical 100 MW <strong>SMR</strong> costing $500 million to manufacture <strong>and</strong> install on-‐site is<br />
estimated to create nearly 7,000 jobs <strong>and</strong> generate $1.3 billion in sales, $627 million in<br />
value-‐added, $404 million in earnings (payroll), <strong>and</strong> $35 million in indirect business<br />
taxes.<br />
The annual operation <strong>of</strong> each 100 MW <strong>SMR</strong> unit is estimated to create about 375 jobs<br />
<strong>and</strong> generate $107 million in sales, $68 million in value-‐added, $27 million in earnings<br />
(payroll), <strong>and</strong> $9 million in indirect business taxes.<br />
‣ Given the expected number <strong>of</strong> <strong>SMR</strong>s to be manufactured in the U.S. under each <strong>of</strong> the four<br />
market analysis scenarios, the economic analysis projects the maximum economic impacts <strong>of</strong> a<br />
developing domestic <strong>SMR</strong> industry through 2030. 2<br />
High Nuclear Adoption Case: In 2030, the domestic manufacturing <strong>and</strong> construction <strong>of</strong><br />
<strong>SMR</strong>s will be responsible for an estimated 255,000 jobs annually, $48.3 billion in annual<br />
sales, $23.2 billion in annual value-‐added impacts, $15 billion in annual earnings, <strong>and</strong><br />
$1.3 billion in annual indirect business taxes. Cumulatively through 2030, the domestic<br />
2 These projections do not include support service revenue <strong>and</strong> job impacts from enrichment services. Several<br />
<strong>SMR</strong> designs assume uranium enrichment levels higher than those associated with conventional reactors. This<br />
study uses a prototypical light-‐water reactor design to model economic impacts, <strong>and</strong> the study team assumed the<br />
generic design would not require a higher enrichment level. In addition, the study team assumed growth to be<br />
linear between the low-‐point in 2015 to a high-‐point in 2030. Therefore, if actual manufacturing <strong>of</strong> <strong>SMR</strong> units<br />
begins after 2015, a corresponding linear shift in the economic outputs would likely occur in the years after 2030.<br />
6
operation <strong>of</strong> <strong>SMR</strong>s is responsible for about 81,000 jobs, $23 billion in sales, $15 billion in<br />
value-‐added, $6 billion in earnings, <strong>and</strong> $2 billion in indirect business taxes.<br />
Moderate Nuclear Adoption Case: Annual economic impacts in 2030 for manufacture<br />
<strong>and</strong> construction are estimated to be 215,000 jobs, $40.5 billion in sales, $19.4 billion in<br />
value-‐added impacts, $12.5 billion in payroll earnings, <strong>and</strong> $1.1 billion in indirect<br />
business taxes. Cumulatively through 2030, the domestic operation <strong>of</strong> <strong>SMR</strong>s is<br />
responsible for more than 50,000 jobs, $15 billion in sales, $9.6 billion in value-‐added,<br />
$4 billion in earnings, <strong>and</strong> $1.3 billion in indirect business taxes.<br />
Low Nuclear Adoption Case: In 2030, the domestic <strong>SMR</strong> manufacture <strong>and</strong> construction<br />
industry is projected to have annual economic impacts estimated at almost 21,000 jobs,<br />
$3.9 billion in sales, $1.9 billion in value-‐added, $1.2 billion in earnings, <strong>and</strong> more than<br />
$100 million in indirect business taxes. Cumulatively through 2030, the domestic<br />
operation <strong>of</strong> <strong>SMR</strong>s is responsible for approximately 7,000 jobs, $1.9 billion in sales, 1.2<br />
billion in value-‐added, $500 million in earnings, <strong>and</strong> more than $160 million in indirect<br />
business taxes.<br />
Disruptive Nuclear Adoption Case: The economic analysis projects that in 2030, the<br />
domestic manufacturing <strong>and</strong> construction <strong>of</strong> <strong>SMR</strong>s will be responsible for slightly more<br />
than 600,000 jobs annually, $113.5 billion in annual sales, $54.6 billion in annual value-added<br />
impacts, $35.2 billion in annual payroll earnings, <strong>and</strong> $3.1 billion in annual<br />
indirect business taxes. Cumulatively through 2030, the domestic operation <strong>of</strong> <strong>SMR</strong>s is<br />
responsible for approximately 200,000 jobs, $57.1 billion in sales, $36.4 billion in value-added,<br />
$14.8 billion in earnings, <strong>and</strong> $4.9 billion in indirect business taxes.<br />
Section 2: Benefits <strong>and</strong> Applications <strong>of</strong> <strong>SMR</strong> Technologies<br />
According to International Atomic Energy Agency (IAEA) definitions, a large conventional nuclear reactor<br />
typically exceeds an output <strong>of</strong> 700 MW. In contrast, small nuclear reactors are defined as those<br />
producing less than 300 MW (IAEA, 2007). The fundamental uniqueness <strong>of</strong> <strong>SMR</strong>s lies in their size <strong>and</strong><br />
modularity. <strong>Modular</strong>ity <br />
<strong>of</strong> a monolithic plant or stickbuilt scope to facilitate factory fabrication <strong>of</strong> modules for shipment <strong>and</strong><br />
installation in the field as complete assemblies (Carelli, et al., 2010). The modular approach allows for<br />
greater st<strong>and</strong>ardization <strong>of</strong> components <strong>and</strong> processes compared to large nuclear power plants.<br />
<strong>Modular</strong> fabrication also enables cost reduction opportunities resulting from economic learning as the<br />
number <strong>of</strong> <strong>SMR</strong>s deployed over time increases. In support <strong>of</strong> this argument, preliminary evaluations <strong>of</strong><br />
the capital outlay <strong>and</strong> O&M costs indicate that the lack <strong>of</strong> initial economies <strong>of</strong> scale would be<br />
counterbalanced by the modular <strong>and</strong> integral design approach <strong>of</strong> <strong>SMR</strong>s (Carelli, et al., 2010).<br />
<strong>SMR</strong> Designs<br />
There are numerous <strong>SMR</strong> designs under development globally. Only a small portion <strong>of</strong> these designs are<br />
expected to become NRC-‐certified <strong>and</strong> commercially available within the U.S. in the next 10 to 20 years.<br />
7
A summary <strong>of</strong> <strong>SMR</strong> firms that have submitted a letter <strong>of</strong> intent to certify their reactors with the NRC<br />
appears in Table 1, <strong>and</strong> not all <strong>of</strong> these letters <strong>of</strong> intent will necessarily result in a submittal <strong>and</strong> eventual<br />
licensing. For <strong>SMR</strong>s to reach their potential, it will be necessary for a great reduction in designs <strong>and</strong><br />
competitors.<br />
These <strong>SMR</strong> designs can be categorized into three distinct groups based upon the actual design type,<br />
licensing <strong>and</strong> commercial deployment schedule, <strong>and</strong> design maturity (Office <strong>of</strong> Nuclear Energy, 2009).<br />
<strong>Small</strong> light water reactor (LWR) designs are generally intended for electricity generation <strong>and</strong> have a<br />
deployment schedule <strong>of</strong> five to ten years. Companies utilizing these designs are Babcock & Wilcox,<br />
NuScale Power, <strong>and</strong> Westinghouse Nuclear. Non-‐LWR designs (very high temperature or pebble bed<br />
reactors) are designed to generate process heat for use in industrial applications <strong>and</strong> have a deployment<br />
schedule <strong>of</strong> ten to 15 years. Advanced reactor concepts (liquid metal-‐cooled fast reactors) can be used<br />
for fuel recycling purposes <strong>and</strong> have extended fuel life. These designs have the longest licensing <strong>and</strong><br />
deployment schedule <strong>of</strong> the three groups, estimated at 15 to 25 years. Several firms are using this<br />
design concept, including Toshiba, GE-‐Hitachi, <strong>and</strong> Hyperion.<br />
Table 1: <strong>SMR</strong> vendors that have submitted letters <strong>of</strong> intent to certify designs to NRC<br />
Firm<br />
~Product<br />
Babcock & Wilcox<br />
~mPower<br />
NuScale Power<br />
~NuScale module<br />
Westinghouse<br />
~IRIS<br />
Toshiba<br />
~4S<br />
GE-‐Hitachi<br />
~PRISM<br />
PBMR (Pty.), Ltd.<br />
~Pebble Bed<br />
<strong>Modular</strong> Reactor<br />
Hyperion<br />
~ Hyperion Power<br />
Module<br />
Reactor Type<br />
LWR<br />
LWR<br />
LWR<br />
Sodium-‐cooled<br />
fast reactor<br />
Sodium-‐cooled<br />
fast reactor<br />
PBMR<br />
Lead-‐bismuth-cooled<br />
fast<br />
reactor<br />
Reactor<br />
Power<br />
400 MWt<br />
125 MWe<br />
150 MWt<br />
45 MWe<br />
1000 MWt<br />
335 MWe<br />
30 MWt<br />
10MWe<br />
840 MWt<br />
311 MWe<br />
400 MWt<br />
165 MWe<br />
70 MWt<br />
25 MWe<br />
Refueling Planned NRC<br />
Submittal<br />
5 years Q1 2012<br />
2 years<br />
3-‐3.5 years Q3 2012<br />
30 years October 2010<br />
1-‐2 years Mid 2011<br />
Online<br />
refueling<br />
7-‐10 years<br />
2013<br />
MWt = Megawatt thermal capacity<br />
MWe = Megawatt electric power capacity<br />
Source: Adapted from Nuclear Regulatory Commission Advanced <strong>Reactors</strong> Website<br />
8
In addition to the companies <strong>and</strong> concepts listed in Table 1, at least two other U.S. companies have<br />
proposed <strong>SMR</strong>s design concepts. 3 The General Atomics EM2 (Energy Multiplier Module) is a 240 MW<br />
electric factory-‐produced system that would be truck or train transportable. The unit would be helium-cooled<br />
<strong>and</strong> provide process heat at 850 degrees C (Smith, 2010a). -‐100<br />
system uses a sodium cooled fast reactor design to produce 100 MW <strong>of</strong> electricity in a factory-‐produced,<br />
rail transportable design. The system is designed to operate for more than 20 years without refueling<br />
(IAEA, 2010b).<br />
While the NRC is actively engaged in developing technology-‐neutral guidelines for new plant licensing, it<br />
has developed its current regulations based on 40 years <strong>of</strong> design <strong>and</strong> operation <strong>of</strong> LWR facilities (U.S.<br />
Nuclear Regulatory Commission, 2010). In addition, the NRC has been challenged to significantly<br />
upgrade its workforce <strong>and</strong> capacity to license LWR designs in the last five years (U.S. Government<br />
Accountability Office, 2007). Because <strong>of</strong> these factors, the <strong>SMR</strong>s which utilize light water designs should<br />
have a distinct advantage over non-‐LWR reactors in the NRC design <strong>and</strong> certification process, <strong>and</strong> the<br />
Department <strong>of</strong> Energy has publicly endorsed this view with the aim to financially assist <strong>SMR</strong> LWR designs<br />
through the licensing process (Chu, 2010). This should lead to faster certification <strong>and</strong> give LWR designs<br />
an early adoption advantage in the <strong>SMR</strong> market. An example <strong>of</strong> this LWR advantage is the backing <strong>of</strong><br />
Babcock & Wilcox by three large utilities, Tennessee Valley Authority, First Energy Corp. <strong>and</strong> Oglethorpe<br />
Power Corp. These utilities recently signed a multi-‐firm agreement to solidify a mutual commitment to<br />
acquire necessary appr new reactor design within the U.S (Smith,<br />
2010). Likewise, NuScale Power has met with Energy Northwest, a joint operating agency for public<br />
utilities, about interest in adopting its design, <strong>and</strong> Energy Northwest has initiated studying <strong>SMR</strong>s <strong>and</strong><br />
held informational meetings with its local partners (Dininny, 2009; Havil<strong>and</strong>, 2009).<br />
Attributes<br />
These three design sets (LWR, very high temperature, <strong>and</strong> advanced reactor concepts/liquid metal-cooled)<br />
have specific attributes that position them for a variety <strong>of</strong> applications. When directly<br />
compared to conventional nuclear power plants, several unique attributes <strong>of</strong> <strong>SMR</strong>s may provide<br />
advantages over larger reactor designs in some markets. <strong>Small</strong>er reactors tend to be less expensive with<br />
regards to initial capital outlay <strong>and</strong> are expected to utilize improved fabrication <strong>and</strong> construction<br />
logistics. Because <strong>of</strong> their modular nature, <strong>SMR</strong>s may <strong>of</strong>fer operational flexibilities (Ingersoll, 2009). In<br />
terms <strong>of</strong> capital outlay, the investment timing for <strong>SMR</strong>s can be deferred towards the end <strong>of</strong> construction<br />
due to the shorter construction times, providing a higher net present value for the investment. In<br />
addition, the construction <strong>of</strong> multiple <strong>SMR</strong>s may provide lower financial risk than those associated with<br />
constructing a single large nuclear reactor (Carelli, et al., 2010).<br />
3 The designs listed in this study are not necessarily all-‐inclusive but are intended as examples <strong>of</strong> concepts being<br />
-‐LWR)<br />
<br />
Right-‐<br />
9
Other advantages <strong>of</strong> <strong>SMR</strong>s over conventional nuclear reactor designs include less risk for cost overrun<br />
due to the modular construction, increased flexibility to increase generating capacity (add modules) as<br />
needed (Ingersoll, 2009), <strong>and</strong> potential lower overall cost per kW <strong>of</strong> electricity generation capacity. The<br />
modularity <strong>of</strong> <strong>SMR</strong>s is <strong>of</strong> particular relevance when considering investment flexibility in shifting market<br />
conditions. <strong>SMR</strong>s are better suited to match dem<strong>and</strong> growth by incrementally increasing supply (Carelli,<br />
et al., 2010). In stable or predictable market conditions where long-‐term planning is feasible, the<br />
modularity <strong>of</strong> <strong>SMR</strong>s promotes scalability, while in uncertain market conditions this feature will<br />
enhance the adaptability <strong>of</strong> plant deployment (Carelli et al., 2010, p. 405). Since <strong>SMR</strong>s are assumed to<br />
require much shorter lead timesfinancing is one examplethan large reactor deployments, these<br />
smaller reactors allow investors the flexibility to quickly adapt to changes within the market.<br />
Additionally, <strong>SMR</strong>s can be mass produced, are exportable, <strong>and</strong>, in some designs, can <strong>of</strong>fer longer-‐term<br />
energy reliability because <strong>of</strong> infrequent refueling requirements.<br />
<strong>SMR</strong>s are also capable <strong>of</strong> facilitating improved matching between plant capacity <strong>and</strong> grid capacity in<br />
areas that are not well interconnected to sizable power grids (Carelli, et al., 2010). Some developing<br />
country environments present less mature technical infrastructures or smaller electrical grids. These<br />
areas would generally not able to accept connection to large, concentrated power stations where one<br />
This can reduce<br />
the market potential for large nuclear reactors <strong>and</strong> fossil fuel plants <strong>and</strong>, at the same time, reduce<br />
electricity availability in some countries. Due to their design approach, <strong>SMR</strong>s are capable <strong>of</strong> providing<br />
electric power to these areas with small or limited electrical grid infrastructures.<br />
Based on the aforementioned attributes, <strong>SMR</strong>s may be well-‐suited for the following applications:<br />
electricity generation in both developed <strong>and</strong> developing markets, industrial process heat, desalination,<br />
hydrogen production, oil shale recovery, transmission boosting, <strong>and</strong> district heating (S<strong>and</strong>ers, 2009).<br />
The next sections highlight the applications that have the most potential for large-‐scale<br />
commercialization.<br />
Electricity Generation<br />
The primary market function <strong>of</strong> nuclear power plants has been to generate electricity. In recent years,<br />
nuclear power has provided approximately 15% <strong>of</strong> the world's electricity (World Nuclear Association,<br />
2009), with approximately 440 nuclear power plants in 31 countries (IAEA, 2010). More than 55 nuclear<br />
power reactors are currently under construction, with the vast majority <strong>of</strong> current construction<br />
occurring in Asia <strong>and</strong> in the Russian Federation. Globally, almost 150 reactors are on order or planned<br />
to be operating within the next 8 to 10 years (IAEA, 2010a; World Nuclear Association, 2010). The U.S.,<br />
France, <strong>and</strong> Japan produce 30.8%, 16.2%, <strong>and</strong> 9.7% <strong>of</strong> nuclear-‐generated electricity,<br />
respectively. Russia, South Korea, <strong>and</strong> Germany each generate more than 5% <strong>of</strong> the world total<br />
(International Energy Agency, 2009).<br />
The U.S. is the world leader in terms <strong>of</strong> total electricity generated by nuclear power because <strong>of</strong> its<br />
operating 104 reactors, which have produced between 18% <strong>and</strong> 20.6% <strong>of</strong> electricity generated annually<br />
in the U.S. since 1990 (Nuclear Energy Institute, 2010). Investment in new nuclear capacity was largely<br />
10
halted in the late 1970s due to cost overruns <strong>and</strong> public concerns about safety in the wake <strong>of</strong> Three Mile<br />
Isl<strong>and</strong> (Congressional Budget Office, 2008)<br />
U.S. (Ingersoll, 2009). However, nuclear power gained a larger share <strong>of</strong> electricity generated in the U.S.<br />
during the past few decades because <strong>of</strong> improved safety practices <strong>and</strong> operations, as well as<br />
investments in uprates at existing facilities. Improvements in operations are exemplified by the<br />
increased capacity factor <strong>of</strong> nuclear generation, which has increased from 57.4% in 1987 to an average<br />
<strong>of</strong> about 90% in the 2000s (Nuclear Energy Institute, 2010). <br />
operations <strong>and</strong> its value as a clean energy resource, the Energy Policy Act <strong>of</strong> 2005 (EPACT 2005)<br />
provided new regulatory <strong>and</strong> tax incentives for investment in new nuclear generation. In addition, the<br />
Department <strong>of</strong> Energy has included substantial loan guarantees for nuclear power in the 2011 budget<br />
request, <strong>and</strong> the Administration has justified the guarantees in terms <strong>of</strong> combating climate change<br />
(Pulizzi & Buurma, 2010). These developments may signal a resurgence, <br />
nuclear <strong>of</strong> nuclear power in the U.S. (Weinberg, 1985; Ingersoll, 2009).<br />
In comparison to the U.S., 17 countries (18 including Taiwan) have a larger proportion <strong>of</strong> electricity<br />
generated by nuclear power, with Lithuania <strong>and</strong> France in the lead at more than 75% (IAEA, n.d.).<br />
France <strong>and</strong> Japan provide examples <strong>of</strong> countries that have pursued a concerted effort to have a long-term<br />
commitment to nuclear power. Japan has the third largest installed electricity generation capacity<br />
in the world, <strong>and</strong> about 30% is generated by nuclear power (EIA, 2008). Both France <strong>and</strong> Japan pursued<br />
restructuring plans since the 1970s due to their relative lack <strong>of</strong> indigenous fossil fuels <strong>and</strong> increasing<br />
dem<strong>and</strong> for electricity. In addition to building nuclear power plants for electricity generation, these two<br />
countries have implanted both front-‐end (enrichment) <strong>and</strong> back-‐end (reprocessing) nuclear fuel cycle<br />
facilities (IAEA, 2007). While other countries also made some shifts from fossil fuel to nuclear power for<br />
electricity generation during the past few decades, these shifts were conducted at a significantly slower<br />
pace <strong>and</strong> at a lower level than the measures taken by Japan <strong>and</strong> France.<br />
There are a number <strong>of</strong> factors that may signal an exp<strong>and</strong>ed role for nuclear power in both developed<br />
<strong>and</strong> less established markets in the coming decades. Most forecasts incorporate an increasing global<br />
dem<strong>and</strong> for electricity, resulting from countrie (particularly from those in the developing world)<br />
to grow their economies <strong>and</strong> improve the quality <strong>of</strong> life for their populations. The risks associated with<br />
global climate change may force governments to limit the development <strong>of</strong> power generation by means<br />
<strong>of</strong> burning hydrocarbons; this strengthens the potential for nuclear energy growth with its lack <strong>of</strong><br />
greenhouse gas <strong>and</strong> other pollutant emissions. Despite this forecast <strong>of</strong> strong growth in clean energy<br />
dem<strong>and</strong>, several factors <strong>and</strong> certain circumstances may make <strong>SMR</strong>s more attractive than conventional<br />
reactor builds in both the domestic <strong>and</strong> international arena.<br />
While deployment <strong>of</strong> nuclear power has predominantly occurred in developed countries during the past<br />
few decades, an IAEA study forecasts that developing countries <strong>and</strong> emerging markets will be the<br />
primary locations <strong>of</strong> nuclear energy additions by 2050, with roughly equal proportions through 2030<br />
(IAEA, 2007). Population growth rates are expected to rise within these developing countries while birth<br />
rates in developed countries have decreased to at or below self-‐sustaining rates. Furthermore, a<br />
comparison <strong>of</strong> energy use per capita among countries indicates that the growth rate in power dem<strong>and</strong><br />
11
will be much greater in developing nations (IAEA, 2007). As a result future energy dem<strong>and</strong> will also<br />
increase most significantly in developing countries; therefore these nations are likely the primary target<br />
for long-‐term future nuclear plant deployment.<br />
The primary obstacle for many developing countries lies in their lack <strong>of</strong> available resources to build a<br />
large scale nuclear reactor that costs billions <strong>of</strong> dollars <strong>and</strong> requires at least several years to construct.<br />
Aside from costs, other key factors may inhibit the production <strong>of</strong> conventional nuclear reactors or larger<br />
fossil fuel plants within these countries (IAEA, 2007). Electrical grids with limited capacity are<br />
susceptible to operation <strong>and</strong> stability issues when power variations in excess <strong>of</strong> 10% <strong>of</strong> the total grid<br />
capacity occur. In certain countries, regardless <strong>of</strong> whether the population is concentrated in urban areas<br />
or dispersed in remote regions, the grid is not well-‐developed or robust (Carelli et al., 2010). As a<br />
result, <strong>SMR</strong>s may be an attractive alternative due to their ability to be used as both incremental <strong>and</strong><br />
distributed generation sources. With this potential, however, come security concerns regarding<br />
transport <strong>and</strong> emplacement <strong>of</strong> <strong>SMR</strong>s in remote areas <strong>of</strong> some developing countries.<br />
Additional Applications<br />
Besides electricity generation, additional applications may be well-‐suited for <strong>SMR</strong> systems in the future.<br />
While the applicability <strong>of</strong> nuclear energy to additional applications is not dependent on facility size, the<br />
actual use <strong>of</strong> large nuclear facilities does not occur due to economic considerations. Currently, only a<br />
few countries utilize nuclear energy for non-‐generation purposes, primarily desalination <strong>and</strong> district<br />
heating (IAEA, 2008). A brief overview <strong>of</strong> the application possibilities for <strong>SMR</strong>s is provided below.<br />
Desalination. The IAEA has identified desalination as possibly the leading non-‐electric civilian use for<br />
nuclear energy. Water scarcity is becoming an increasingly problematic global issue in both developed<br />
<strong>and</strong> developing countries. As noted in an IAEA (2007) report,<br />
Because <strong>of</strong> population growth, surface water resources are increasingly stressed in many parts<br />
<strong>of</strong> the world, developed <strong>and</strong> developing regions alike. Water stress is counter to sustainable<br />
development; it engenders disease; diverts natural flows, endangering flora <strong>and</strong> fauna <strong>of</strong> rivers,<br />
lakes wetl<strong>and</strong>s, deltas <strong>and</strong> oceans; <strong>and</strong> it incites regional conflicts over water rights. In the<br />
developing world, more than one billion people currently lack access to safe drinking water;<br />
nearly two <strong>and</strong> a half billion lack access to adequate sanitation services. This would only get<br />
<br />
these trends, many opportunities in both developed <strong>and</strong> developing countries are foreseen for<br />
supply <strong>of</strong> potable water generated using nuclear process heat or <strong>of</strong>f-‐peak electricity (p. 23).<br />
The desalination <strong>of</strong> sea water requires large amounts <strong>of</strong> energy <strong>and</strong> is not dependent on a particular fuel<br />
roduction <strong>of</strong> potable water<br />
from sea water in a facility in which a nuclear reactor is used as the source <strong>of</strong> energy for the desalination<br />
The three technologies that comprise nuclear desalination are nuclear, the desalination<br />
method, <strong>and</strong> the system that couples them together (IAEA, 2000). The feasibility <strong>of</strong> integrated nuclear<br />
desalination plants has been proven with over 175 reactor-‐years <strong>of</strong> experience worldwide (IAEA, 2007a).<br />
12
Large-‐scale, proven commercial technologies for desalination can be grouped into distillation processes<br />
<strong>and</strong> the reverse osmosis process. Distillation technologies require heat to create steam which<br />
condenses <strong>and</strong> separates fresh water from brine. Reverse osmosis requires only electricity to push fresh<br />
water from the higher pressure saltwater side <strong>of</strong> a semi-‐permeable membrane to the lower pressure<br />
freshwater side. An IAEA study (2007a) on the economics <strong>of</strong> nuclear desalination reported that <strong>SMR</strong>s<br />
<strong>of</strong>fer the largest potential as coupling options to nuclear desalination systems in developing countries<br />
(p. 4). Furthermore, the study found that the costs for nuclear desalination are roughly similar to that <strong>of</strong><br />
natural gas desalination, <strong>and</strong> could be substantially lower depending on fuel costs (IAEA, 2007a). Based<br />
on a preliminary assessment <strong>of</strong> the global desalination market through 2030, particularly in developing<br />
countries, desalination has the potential to provide a strong market for <strong>SMR</strong>s if they can successfully<br />
compete with conventional nuclear plants <strong>and</strong> other sources <strong>of</strong> generation (Arthur, 2010).<br />
Process Heat for Industrial Applications <strong>and</strong> District Heating. <strong>SMR</strong>s can be used to provide heat<br />
over temperature ranges from 100 to 200 degrees centigrade to over 800 degrees centigrade,<br />
depending on the design <strong>of</strong> the <strong>SMR</strong> <strong>and</strong> the technology used in it. During the production <strong>of</strong> electricity,<br />
more than half <strong>of</strong> the heat generated is rejected at low temperature. This residual heat is usable for<br />
various industrial applications. Higher temperature process heat can be used for a variety <strong>of</strong> industrial<br />
applications, such as the production <strong>of</strong> glass, plastics, steel, <strong>and</strong> ammonia (Office <strong>of</strong> Nuclear Energy,<br />
2009). In addition concepts for producing carbon-‐neutral synthetic fuels <strong>and</strong> chemicals, <strong>of</strong>ten propose<br />
the coupling <strong>of</strong> systems, including nuclear, for a source <strong>of</strong> carbon-‐free heat <strong>and</strong> hydrogen needed in<br />
their processes (Los Alamos National Laboratory, 2008). Given the modularity <strong>of</strong> <strong>SMR</strong>s, these reactors<br />
<strong>of</strong>fer advantages in areas or applications where heat is needed but where the large heat output <strong>and</strong><br />
expense <strong>of</strong> a large nuclear reactor makes its application impractical.<br />
District heating is an existing low temperature process heat application provided by nuclear plants in<br />
cold regions. Most <strong>of</strong>ten district heating is coupled with electric generation as a cogeneration<br />
application, but there are some very small single purpose nuclear district heating plants in existence.<br />
From a central location, a district heating system provides essential heat for residential <strong>and</strong> commercial<br />
needs such as space <strong>and</strong> water heating. The heat is <strong>of</strong>ten obtained from a cogeneration plant burning<br />
fossil fuels, although there are several alternatives, such as nuclear power, geothermal heating, central<br />
solar heating, <strong>and</strong> l<strong>and</strong>fill gas. Low-‐ temperature heat from nuclear reactors for district heating has<br />
been demonstrated in Russia, the Ukraine, Bulgaria, the Czech Republic, Slovakia, Hungary, <strong>and</strong> Sweden<br />
(Csik & Kupitz, 1997). In the past, the low price <strong>of</strong> fossil fuels have discouraged nuclear district heating<br />
plants (IAEA, 2009a), although higher prices may make alternatives, including process heat from <strong>SMR</strong>s,<br />
more attractive in the future.<br />
Hydrogen Production. Hydrogen is considered a clean, convenient <strong>and</strong> versatile energy carrier with a<br />
wide variety <strong>of</strong> current <strong>and</strong> potential uses. The potential market for transportation use <strong>and</strong> as a<br />
replacement for liquid fossil fuels has been a driver in the past decade for nuclear-‐hydrogen research<br />
<strong>and</strong> demonstration programs (Office <strong>of</strong> Nuclear Energy, 2010; IAEA, 1999). Almost all hydrogen is<br />
currently produced for chemical industry applications, including the refining <strong>of</strong> high sulfur content crude<br />
13
oil. While most hydrogen is produced via steam reforming <strong>of</strong> hydrocarbons, it can be produced via<br />
electrolysis <strong>and</strong> high temperature chemical reactions, methods that can produce no greenhouse gas<br />
emissions. Conventional reactors, both large <strong>and</strong> <strong>of</strong> the <strong>SMR</strong> variety, can provide electricity for<br />
electrolysis. High temperature reactors that are capable <strong>of</strong> providing high temperature process heat for<br />
electrolytic, thermochemical, hybrid, <strong>and</strong> other applications are under development through the<br />
ant program. <strong>SMR</strong>s, based on gas-cooled<br />
or pebble-‐bed designs, could be used for hydrogen production in the future.<br />
Approach to <strong>SMR</strong> Market Potential<br />
While the potential uses <strong>and</strong> benefits <strong>of</strong> <strong>SMR</strong>s outlined above are numerous but certainly not all-inclusive,<br />
this study incorporates only the market potential for electricity production, using forecasts<br />
from established agencies <strong>and</strong> organizations. At present, electricity is the largest <strong>and</strong> most well-‐defined<br />
<strong>of</strong> the potential <strong>SMR</strong> applications. The cogeneration markets are ignored in this forecast for two<br />
reasons. First, the market size for these applications is anticipated to be significantly smaller than the<br />
electricity generation market. Second, the degree <strong>of</strong> uncertainty in estimating future cogeneration<br />
markets is significant <strong>and</strong> would taint the overall dem<strong>and</strong> forecasts <strong>of</strong> nuclear electricity generation<br />
from the reputable sources used for this study. Because <strong>of</strong> the omission <strong>of</strong> markets other than electricity<br />
generation, thforecasts for <strong>SMR</strong> dem<strong>and</strong> should be viewed as conservative in nature.<br />
Aside from the potential high temperature applications noted above, this study makes no assumptions<br />
about which <strong>of</strong> the <strong>SMR</strong> technologies currently under development will be deployed for different uses<br />
or at different locations. The fact remains that no <strong>SMR</strong>s have yet been certified by the NRC <strong>and</strong> the<br />
earliest this is expected to happen is 2015. Therefore the technical <strong>and</strong> financial performance <strong>of</strong><br />
different <strong>SMR</strong> designs has not yet been proved <strong>and</strong> the differing strengths <strong>and</strong> weaknesses <strong>of</strong> these<br />
designs cannot be currently evaluated. Under these circumstances, it is difficult to determine the<br />
market potential that exists for each design. As a result, a MW <strong>SMR</strong> will be assumed<br />
for the market potential <strong>and</strong> resulting economic analysis below.<br />
Section 3: <strong>SMR</strong> Market Potential<br />
The purpose <strong>of</strong> determining the market potential is to enable an economic impact analysis <strong>of</strong> small<br />
modular reactor manufacturing <strong>and</strong> operations in the U.S. over the next 20 years. This is achieved by<br />
first estimating the number <strong>of</strong> <strong>SMR</strong>s manufactured in the U.S., <strong>and</strong> second by estimating the number <strong>of</strong><br />
these reactors operating in the U.S. during this time period.<br />
This report presents four distinct cases projecting the potential economic impact <strong>of</strong> <strong>SMR</strong> systems<br />
through 2030. These cases are referred to as Low, Moderate, High, <strong>and</strong> Disruptive. Each case<br />
incorporates added nuclear power capacity for electricity production, the market share <strong>of</strong> <strong>SMR</strong>s for that<br />
capacity, <strong>and</strong> penetration <strong>of</strong> U.S. manufacturers into the overall global <strong>SMR</strong> market.<br />
14
Methodology<br />
Forecasted capacity additions for the nuclear power industry as a whole were used as a basis for<br />
projecting the number <strong>of</strong> <strong>SMR</strong> systems manufactured. The forecasted nuclear capacity data was<br />
extracted from recent U.S. Energy Information Agency, Electric Power Research Institute, <strong>and</strong><br />
International Atomic Energy Agency studies. Their data were compiled to form scenarios for Low,<br />
Moderate, <strong>and</strong> High nuclear power growth in the U.S. <strong>and</strong> internationally. Estimates for the annual<br />
market share <strong>of</strong> <strong>SMR</strong>s as a portion <strong>of</strong> total nuclear power additions were then applied, giving a power<br />
generating capacity. This generating capacity was converted into an <strong>SMR</strong> unit count by applying the<br />
nominal <strong>SMR</strong> generating capacity <strong>of</strong> 100 MW. The resulting number <strong>of</strong> <strong>SMR</strong>s represents the total<br />
projected <strong>SMR</strong> market potential for both domestic <strong>and</strong> international markets. The U.S. <strong>SMR</strong><br />
<br />
manufactured in the U.S.<br />
As mentioned previously, this methodology assumes that <strong>SMR</strong>s are only used for electricity generation<br />
<strong>and</strong> that they only capture a share <strong>of</strong> the forecasted nuclear power capacity additions. Additional <strong>SMR</strong><br />
displacement <strong>of</strong> other non-‐nuclear electric generating sources is not accounted for in the projections<br />
that were not already included in the data from the various agencies. The growth <strong>of</strong> the <strong>SMR</strong> market is<br />
assumed to be linear from the time the first system is brought on line through 2030. Once deployed, it<br />
is assumed that each <strong>SMR</strong> system will operate through 2030. <strong>SMR</strong>s are<br />
expected to have an operational lifetime similar to that <strong>of</strong> conventional nuclear plants, which exceed the<br />
present <br />
Domestic Nuclear Capacity Projections<br />
The projections for U.S. nuclear capacity additions were taken from EIA <strong>and</strong> EPRI reports released in<br />
EIA Updated<br />
Annual Energy Outlook 2009 (April 2009)<br />
macroeconomic outlook <strong>of</strong> the U.S. <strong>and</strong> the enactment <strong>of</strong> the American Recovery <strong>and</strong> Reinvestment Act<br />
passed into law in February 2009. The case assumes that regulatory impact on the energy markets is<br />
limited only to currently enacted legislation (as <strong>of</strong> April 2009). The report projects 3.4 gigawatts (GW) <strong>of</strong><br />
expansion at existing nuclear power plants, 13.1 GW <strong>of</strong> new capacity, <strong>and</strong> 4.4 GW <strong>of</strong> retirements in the<br />
period up to 2030. This is a net increase <strong>of</strong> 12 GW nuclear generating capacity by 2030. This scenario is<br />
referred to as No Green House Gas (GHG) Legislation.<br />
The Moderate scenario uses Prism case as the projection for U.S. nuclear capacity growth. EPRI is<br />
a non-‐pr<strong>of</strong>it organization that conducts third party research on challenges faced by the electric power<br />
industry. This case assumes that there will be 10 GW <strong>of</strong> nuclear capacity added in the U.S. by 2020 <strong>and</strong><br />
another 54 GW by 2030. It is assumed that U.S. nuclear capacity will not be reduced by plant<br />
2 emissions, with technology<br />
advancement being the limiting factor for further deployment <strong>of</strong> nuclear power.<br />
15
U.S. nuclear capacity projections <strong>of</strong>fered in the High scenario are extracted from the EIA Report -‐ Energy<br />
Market <strong>and</strong> <strong>Economic</strong> <strong>Impacts</strong> <strong>of</strong> H.R. 2454, the American Clean Energy <strong>and</strong> Security Act <strong>of</strong> 2009 (August<br />
2009)ase assumes<br />
low emission technologies including nuclear are developed <strong>and</strong> deployed on a large-‐scale in a timeframe<br />
consistent with CO 2 reduction requirements <strong>of</strong> the American Clean Energy <strong>and</strong> Security Act <strong>of</strong> 2009<br />
(ACESA), commonly known as Waxman-‐Markey after its legislative sponsors. In this scenario, U.S.<br />
nuclear power capacity is nearly doubled over the next 20 years with an expected net increase <strong>of</strong> 90<br />
GW. This case is also referred to as the Greenhouse Gas (GHG) Legislation case.<br />
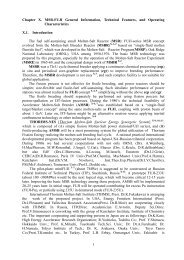
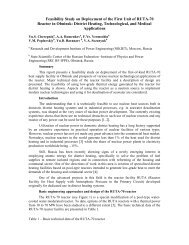
The plot shown in Figure 1 below represents the total U.S. nuclear generating capacity by year for each<br />
<strong>of</strong> the three scenarios. Figure 2 indicates additions in generating capacity by year. This plot represents<br />
gross capacity added as plant retirements are not deducted. The zero-‐added nuclear capacity<br />
forecasted in the year 2021 for the GHG Legislation <strong>and</strong> Reference cases is from data <strong>and</strong> models<br />
supplied by EIA. The zero-‐added capacity results from scheduled expiration <strong>of</strong> the nuclear production<br />
tax credit. EPACT 2005 provided for a production tax credit <strong>of</strong> 1.8¢ per kilowatt hour <strong>of</strong> electricity<br />
produced by an advanced nuclear power facility, with a national limitation <strong>of</strong> 6,000 MW allocated to the<br />
credit. EIA conservatively assumes that the tax credit will not be renewed <strong>and</strong> builds for 2021 are solely<br />
a result <strong>of</strong> the tax credit. However, the congressional intention <strong>of</strong> the tax credit <strong>and</strong> other nuclear<br />
incentives created by EPACT 2005 was to provide assurance for new nuclear construction <strong>and</strong><br />
investment following a period where no plants had been ordered since 1978 (Holt, 2006). <br />
assumption <strong>of</strong> zero-‐added capacity in 2021 may prove to be overly conservative, it has been retained for<br />
this study so as not to alter any <strong>of</strong> the external models <strong>and</strong> datasets from EIA, IAEA, <strong>and</strong> EPRI.<br />
Nuclear Generation Capacity (Gwe)<br />
190<br />
170<br />
150<br />
130<br />
110<br />
90<br />
Figure 1<br />
Projected Domestic Nuclear Capacity (Total)<br />
Reference Case -‐ NO GHG<br />
Legislation<br />
Basic Case -‐ GHG Legislation<br />
EPRI Case<br />
2005 2010 2015 2020 2025 2030<br />
16
Figure 2<br />
Nuclear Generation Capacity (Gwe)<br />
14<br />
12<br />
10<br />
8<br />
6<br />
4<br />
2<br />
Projected Domestic Nuclear Capacity Additions*<br />
Reference Case -‐ NO<br />
GHG Legislation<br />
Basic Case -‐ GHG<br />
Legislation<br />
EPRI Case<br />
0<br />
2005 2010 2015 2020 2025 2030<br />
* The dips in the Reference <strong>and</strong> Basic zero-‐added capacity in 2021 due to the expiration <strong>of</strong><br />
the production text credit (see discussion in previous text). These may prove to be overly conservative, but they have been<br />
retained for this study so as not to alter any <strong>of</strong> the external models <strong>and</strong> datasets from EIA, IAEA, <strong>and</strong> EPRI.<br />
International Nuclear Capacity Projections<br />
International nuclear capacity data for the <br />
described in the EIA International Energy Outlook 2009. This case reflects continued growth <strong>of</strong> the<br />
nuclear generating capacity resulting from rising fossil fuel prices <strong>and</strong> increased global regulation <strong>of</strong><br />
greenhouse gas emissions. It assumes most <strong>of</strong> the older nuclear plants currently in operation will<br />
continue to operate through 2030. However, there is the expectation that nuclear capacity in Europe<br />
will experience minimal growth due to plans for the phasing out <strong>of</strong> nuclear programs in countries such<br />
as Germany <strong>and</strong> Belgium.<br />
IAEA Energy, Electricity<br />
<strong>and</strong> Nuclear Power Estimates for the Period up to 2030 2009 Edition. Data representing U.S.<br />
contributions to this capacity have been removed so as to only depict international nuclear capacity.<br />
<br />
economic <strong>and</strong> electricity dem<strong>and</strong> growth essentially resumes to pre-‐crisis levels. The case also assumes<br />
exp<strong>and</strong>ing implementation <strong>of</strong> policy targeted to address climate change concerns globally. Figures 3 <strong>and</strong><br />
4 illustrate projections for total international nuclear generating capacity <strong>and</strong> incremental capacity<br />
growth, respectively.<br />
17
Nuclear Generation Capacity (Gwe)<br />
700<br />
650<br />
600<br />
550<br />
500<br />
450<br />
400<br />
350<br />
300<br />
250<br />
Figure 3<br />
Projected International Nuclear Capacity (Total)<br />
EIA Ref. Case<br />
IAEA High<br />
Case<br />
2005 2010 2015 2020 2025 2030<br />
Nuclear Generation Capacity (Gwe)<br />
Figure 4<br />
Projected International Nuclear Capacity Additions<br />
30<br />
EIA Ref. Case<br />
25<br />
IAEA High Case<br />
20<br />
15<br />
10<br />
5<br />
0<br />
2005 2010 2015 2020 2025 2030 2035<br />
<strong>SMR</strong> Share <strong>of</strong> Nuclear Market<br />
There are two scenarios presented for <strong>SMR</strong> market share as a percentage <strong>of</strong> new nuclear power<br />
installations Moderate Deployment <strong>and</strong> Disruptive Technology. Both scenarios assume that <strong>SMR</strong>s<br />
capture a growing piece <strong>of</strong> the overall nuclear capacity additions from the time <strong>of</strong> their initial<br />
commercial deployment through 2030. Increasing dem<strong>and</strong> in nuclear capacity is assumed to result in a<br />
corresponding increase in dem<strong>and</strong> for <strong>SMR</strong> systems. The first year <strong>of</strong> possible commercial manufacture<br />
for <strong>SMR</strong> systems is assumed to be 2015. This is based on the published intentions <strong>of</strong> light water <strong>SMR</strong><br />
manufacturers to submit design certification applications to the NRC beginning in 2011, at the time the<br />
present study was initiated (NuScale Power, n.d.; Babcock & Wilcox Company, 2009; U.S. Nuclear<br />
Regulatory Commission, 2010). The actual time between applications for design certification to <strong>SMR</strong><br />
18
manufacture <strong>and</strong> deployment in a commercial power setting may be significantly longer than the four<br />
years projected. In both <strong>of</strong> the <strong>SMR</strong> market share cases, the growth is expected to be linear between<br />
the low point in 2015 to a high point in 2030; therefore, if actual commercial manufacture <strong>of</strong> <strong>SMR</strong> units<br />
begins after 2015, a corresponding linear shift in the economic outputs would likely occur in the years<br />
after 2030.<br />
The Moderate Deployment scenario was applied to each <strong>of</strong> the capacity growth scenarios to provide<br />
projections for Low, Moderate, <strong>and</strong> High <strong>SMR</strong> unit counts. This scenario represents a slow but steady<br />
increase in the market share for <strong>SMR</strong> systems. In this scenario, <strong>SMR</strong>s are assumed to begin at a 2%<br />
capture rate in 2015, culminating in a capture <strong>of</strong> 32% <strong>of</strong> nuclear capacity additions by 2030.<br />
Th<br />
embrace <strong>SMR</strong> technology such that there is a significant replacement <strong>of</strong> large-‐scale nuclear facilities by<br />
<strong>SMR</strong>s. In this case, <strong>SMR</strong>s are assumed to capture 75% <strong>of</strong> nuclear additions by 2030. As previously<br />
discussed, numerous characteristics <strong>of</strong> proposed <strong>SMR</strong> designs can serve to overcome barriers that have<br />
limited the growth <strong>of</strong> the nuclear power industry (Ingersoll, 2009; Carelli et al., 2010). Such<br />
characteristics include:<br />
<br />
Scalability to meet the increasing dem<strong>and</strong> <strong>of</strong> developing energy markets<br />
-‐<br />
Incremental cost benefits realized from modular factory construction <strong>of</strong> reactor <strong>and</strong> turbine<br />
components<br />
Improved transportability<br />
Reduced site construction times<br />
Longer fuel cycles<br />
Placement <strong>of</strong> the reactor vessel underground to improve security from terrorist <strong>and</strong><br />
proliferation threats<br />
Incorporating <strong>of</strong>f-‐site refueling <strong>and</strong> <strong>of</strong>f-‐site spent fuel storage for use in undeveloped regions<br />
Incorporating inherent <strong>and</strong> passive safety features<br />
Reduced dependence on water as a coolant opening up areas previously unsuited for nuclear<br />
plants such as the arid, western U.S.<br />
The disruptive scenario is matched with the High nuclear capacity growth scenario to represent a<br />
highest possible <strong>SMR</strong> market potential.<br />
The data in Table 2 summarizes the projections for <strong>SMR</strong> market share <strong>of</strong> new nuclear power capacity for<br />
each scenario.<br />
19
Table 2: <strong>SMR</strong> Market Share <strong>of</strong> New Nuclear Power Facilities<br />
<strong>SMR</strong> Market Share<br />
2015 2020 2025 2030<br />
Scenario<br />
Moderate Deployment 2% 12% 22% 32%<br />
Disruptive Technology 5% 30% 55% 75%<br />
U.S. Market Share for <strong>SMR</strong> Manufacturing<br />
Projections for <strong>SMR</strong> manufacturing market share captured by U.S. firms are separated into two<br />
categories, international market share <strong>and</strong> domestic market share. In each category, the market share<br />
captured by domestic <strong>SMR</strong> manufacturers is assumed to be constant over the time period under<br />
consideration. U.S. manufacturers are assumed to capture 50% <strong>of</strong> the domestic <strong>SMR</strong> market <strong>and</strong> about<br />
20% <strong>of</strong> the international <strong>SMR</strong> market. These estimates were made based upon the following<br />
considerations<br />
<strong>SMR</strong> development activity is underway in at least 7 countries (World Nuclear Association, 2010).<br />
U.S. manufacturers may realize a preference for U.S. design certification from the NRC.<br />
The domestic <strong>and</strong> international market share projections were applied to the total <strong>SMR</strong> dem<strong>and</strong><br />
estimates to derive the number <strong>of</strong> units built annually in the U.S.<br />
Overview <strong>of</strong> the Four Cases for <strong>SMR</strong> Manufacture <strong>and</strong> Operation<br />
As described above, the three primary factors considered in the analysis are growth in nuclear power<br />
capacity, <strong>SMR</strong> market share <strong>of</strong> that capacity growth, <strong>and</strong> U.S. manufacturer penetration into the <strong>SMR</strong><br />
market. Table 3 summarizes the scenarios used to build each <strong>of</strong> the cases for estimating <strong>SMR</strong> economic<br />
impacts.<br />
<strong>SMR</strong> <strong>Economic</strong><br />
Impact Case<br />
Low<br />
Moderate<br />
High<br />
Disruptive<br />
Table 3: <strong>SMR</strong> Case Overview<br />
Added Nuclear<br />
Capacity Scenario<br />
Low Adoption<br />
Moderate<br />
Adoption<br />
High Adoption<br />
High Adoption<br />
20<br />
<strong>SMR</strong> Market Share<br />
<strong>of</strong> Added Nuclear<br />
Capacity<br />
Moderate <strong>SMR</strong><br />
Deployment (32%<br />
by 2030)<br />
Moderate <strong>SMR</strong><br />
Deployment (32%<br />
by 2030)<br />
Moderate <strong>SMR</strong><br />
Deployment (32%<br />
by 2030)<br />
Disruptive<br />
Technology (75%<br />
by 2030)<br />
<strong>SMR</strong> Market Share<br />
for U.S.<br />
Manufacturers<br />
50% <strong>of</strong> Domestic,<br />
20% <strong>of</strong> Int.<br />
50% <strong>of</strong> Domestic,<br />
20% <strong>of</strong> Int.<br />
50% <strong>of</strong> Domestic,<br />
20% <strong>of</strong> Int.<br />
50% <strong>of</strong> Domestic,<br />
20% <strong>of</strong> Int.
Tables 4 6 provide overviews <strong>of</strong> each <strong>of</strong> the nuclear capacity scenarios utilized for this study.<br />
Domestic<br />
EIA Updated Annual Energy Outlook 2009<br />
Reference Case with ARRA<br />
Report #: SR-‐OIAF/2009-‐03<br />
Reflects only current laws <strong>and</strong> policies.<br />
3.4 GW <strong>of</strong> expansion at existing plants,<br />
13.1 GW <strong>of</strong> new capacity, <strong>and</strong> 4.4 GW <strong>of</strong><br />
retirements.<br />
10 new nuclear power plants are<br />
completed through 2030.<br />
Most existing nuclear units continue to<br />
operate through 2030.<br />
Table 4: Low Nuclear Adoption Scenario<br />
International<br />
EIA International Energy Outlook 2009<br />
Reference Case<br />
Report #:DOE/EIA-‐0484(2009)<br />
Reflects support for new nuclear capacity<br />
from rising fossil fuel prices, greenhouse<br />
gas emissions regulations.<br />
Most <strong>of</strong> the older nuclear power plants in<br />
the OECD countries <strong>and</strong> non-‐OECD Eurasia<br />
will be granted life extensions.<br />
OECD Europe expected to see a small<br />
decline in nuclear power generation.<br />
Domestic<br />
EPRI The Power to Reduce C02 Emissions<br />
2009 PRISM Analysis<br />
EPRI Report 1020389<br />
Substantially increased deployment <strong>of</strong><br />
advanced nuclear power plants.<br />
Existing fleet continues to operate safely<br />
at high capacity factors.<br />
Ongoing efforts to extend the service <strong>of</strong><br />
existing plants beyond 60 years.<br />
Construction <strong>of</strong> 10 GW <strong>of</strong> advanced<br />
reactors by 2020, <strong>and</strong> ultimately 64 GW<br />
by 2030.<br />
Table 5: Moderate Nuclear Adoption Scenario<br />
International<br />
IAEA Energy, Electricity <strong>and</strong> Nuclear Power<br />
Estimates for the Period up to 2030<br />
2009 Edition<br />
IAEA High Case<br />
IAEA Report IAEA-‐RDS-‐1/29<br />
<strong>Economic</strong> crisis overcome in the near<br />
future.<br />
Past rates <strong>of</strong> economic growth <strong>and</strong><br />
electricity dem<strong>and</strong>, especially in the Far<br />
East, would essentially resume.<br />
Implementation <strong>of</strong> policies targeted at<br />
mitigating climate change.<br />
Underlying fundamentals point to<br />
continued strong growth in the longer<br />
term.<br />
21
High Case Domestic<br />
EIA Energy Market <strong>and</strong> <strong>Economic</strong> <strong>Impacts</strong> <strong>of</strong><br />
H.R. 2454<br />
ACESA Basic Case<br />
Report #: SR-‐OIAF/2009-‐05<br />
Assumes low emissions technologies<br />
including nuclear are developed <strong>and</strong><br />
deployed on a large scale in a timeframe<br />
consistent with CO2 reduction<br />
requirements <strong>of</strong> ACESA legislation.<br />
Table 6: High Nuclear Adoption Scenario<br />
High Case International<br />
IAEA Energy, Electricity <strong>and</strong> Nuclear Power<br />
Estimates for the Period up to 2030<br />
2009 Edition<br />
IAEA High Case<br />
IAEA Report IAEA-‐RDS-‐1/29<br />
<strong>Economic</strong> crisis overcome in the near<br />
future.<br />
Past rates <strong>of</strong> economic growth <strong>and</strong><br />
electricity dem<strong>and</strong>, especially in the Far<br />
East, would essentially resume.<br />
Implementation <strong>of</strong> policies targeted at<br />
mitigating climate change.<br />
Underlying fundamentals point to<br />
continued strong growth in the longer<br />
term<br />
Other Considerations<br />
<strong>SMR</strong> deployment is assumed to capture a percentage <strong>of</strong> the forecasted additions to nuclear generating<br />
capacity. In each <strong>of</strong> the third party studies listed above, nuclear growth comes, in part, at the expense<br />
<strong>of</strong> fossil fuel electricity generation. This is primarily due to expected increasing costs for carbon<br />
emissions. Each <strong>of</strong> the studies also assumes that nuclear capacity additions will be GW scale facilities.<br />
Since <strong>SMR</strong>s have generating capacities more comparable to fossil fuel electric plants, particularly natural<br />
gas plants, it is reasonable to assume that <strong>SMR</strong>s may be better suited to capture market share from<br />
fossil fuel plants than from traditional GW scale nuclear facilities. In addition, <strong>SMR</strong> manufacturers may<br />
be in a position to fill dem<strong>and</strong> currently met by the natural gas <strong>and</strong> coal-‐fired power plants if trade<strong>of</strong>fs<br />
between high initial costs (nuclear) <strong>and</strong> high carbon emissions (fossil fuel) become more evenly<br />
balanced due to environmental policy changes.<br />
While environmental policy changes may lead to larger dem<strong>and</strong> <strong>and</strong> more rapid deployment <strong>of</strong> <strong>SMR</strong>s<br />
than generally assumed, other factors may hinder <strong>SMR</strong> deployment. Issues such as spent fuel storage,<br />
licensing, public acceptance, <strong>and</strong> supply chain factors may prove to be significant over the coming years.<br />
The specifics <strong>of</strong> how these issues are resolved are likely to significantly impact the future <strong>of</strong> small<br />
modular nuclear reactors. Each <strong>of</strong> these is discussed briefly below.<br />
The storage <strong>of</strong> spent fuel is an important one for from both a cost <strong>and</strong> public acceptance perspective.<br />
Domestic firms developing <strong>SMR</strong> designs address the issue <strong>of</strong> spent fuel storage by assuming that spent<br />
fuel will either be stored on-‐site at the <strong>SMR</strong> location or <strong>of</strong>f-‐site at a permanent location. The primary<br />
22
enefit <strong>of</strong> on-‐site storage is that it is the storage method used by all commercial nuclear power facilities<br />
currently operating in the U.S. <strong>and</strong> naturally complement on-‐site refueling. However, on-‐site refueling<br />
<strong>and</strong> spent fuel storage would present potential security challenges for proliferation prevention. On-‐site<br />
storage is also considered to be a temporary solution <strong>and</strong> is practical only for the life <strong>of</strong> the power plant.<br />
Although <strong>of</strong>f-‐site storage has the benefit <strong>of</strong> improved security over on-‐site storage, long-‐term storage<br />
options at secured <strong>of</strong>f-‐site locations are currently non-‐existent in the U.S.<br />
Another major issue with significant potential impacts on the future <strong>of</strong> <strong>SMR</strong>s in the U.S. concerns the<br />
speed at which <strong>SMR</strong>s are likely to be adopted. Factors such as licensing, public acceptance, <strong>and</strong> supply<br />
chain issues may hinder significant <strong>SMR</strong> deployment in the future. In terms <strong>of</strong> licensing, it is important<br />
to note that current regulations <strong>and</strong> licensing procedures were developed with consideration for large<br />
scale, light-‐water reactor facilities (U.S. Nuclear Regulatory Commission, 2010). <strong>SMR</strong> designs do not fit<br />
into the current framework partly due to their size, associated technologies such as in-‐vessel<br />
instrumentation, <strong>and</strong> the use <strong>of</strong> advanced designs (other than light-‐water). Licensing for commercial<br />
manufacturing <strong>and</strong> operation are co<br />
procedures with consideration for <strong>SMR</strong> projects.<br />
In addition, the licensing <strong>of</strong> new <strong>SMR</strong> facilities is likely to be affected by the degree <strong>of</strong> public acceptance<br />
<strong>of</strong> nuclear technologies in general. Though the U.S. currently has the highest number <strong>of</strong> operating<br />
nuclear power reactors in the world (IAEA, 2010), growth in the domestic nuclear power industry has<br />
stagnated since 1990. While costs have been a factor, segments <strong>of</strong> the public remain concerned about<br />
nuclear waste disposal <strong>and</strong>, to some extent, safety. Lack <strong>of</strong> public acceptance toward nuclear energy in<br />
general may affect the<br />
speed <strong>of</strong> <strong>SMR</strong> licensing <strong>and</strong> deployment in the U.S.<br />
Finally, the hiatus in new nuclear power plant construction in the U.S <br />
ability to rapidly deploy new nuclear facilities on a large scale. The lack <strong>of</strong> nuclear construction over<br />
recent decades has, to a large degree, forced U.S. nuclear component suppliers to either focus on<br />
international markets or exit the nuclear industry (Kenley, et al., 2009). This weakened supply chain<br />
position could present a significant challenge for U.S. <strong>SMR</strong> manufacturers in the event <strong>of</strong> rapidly<br />
increasing dem<strong>and</strong>. Foreign manufacturers may realize an advantage in this regard, allowing them to<br />
capture <strong>SMR</strong> market share from U.S. manufacturers. On the other h<strong>and</strong>, with respect to domestic<br />
manufacturing capabilities, other industrial sectors associated with defense <strong>and</strong> ship building, as<br />
examples, could provide the base needed for factory-‐based <strong>SMR</strong> production.<br />
While the scenarios used here incorporate the effects <strong>of</strong> market conditions over time, including<br />
environmental policy changes, it is important to note that unexpected changes in regulatory policy,<br />
licensing procedures, public acceptance, security requirements, <strong>and</strong> supply chain factors may be<br />
significant. As a result, the actual path for the future dem<strong>and</strong> for <strong>SMR</strong> manufacturing <strong>and</strong> operation may<br />
deviate from the projections derived in this study.<br />
23
In addition, it is important to note that the operations to transform projections <strong>of</strong> energy dem<strong>and</strong><br />
projections into the forecast numbers <strong>of</strong> <strong>SMR</strong> units manufactured <strong>and</strong> operated are mathematically<br />
linear. This means that the projected numbers <strong>of</strong> <strong>SMR</strong> units are, in effect, a re-‐scaling <strong>of</strong> the energy<br />
dem<strong>and</strong> projections. As a result, any perturbations that occur in the energy dem<strong>and</strong> projections will<br />
impact the final <strong>SMR</strong> counts. For example, the dip in the number <strong>of</strong> <strong>SMR</strong>s manufactured in the year<br />
2021 for both the high <strong>and</strong> disruptive cases are reflections <strong>of</strong> the drop <strong>of</strong>f in additional capacity for 2021<br />
in the EIA Basic <strong>and</strong> Reference cases, shown earlier in Figure 2 <strong>and</strong> now appearing in Figure 6, caused by<br />
the scheduled expiration <strong>of</strong> the advanced nuclear production tax credit. As explained earlier, this may<br />
prove an overly conservative assumption<br />
<strong>and</strong> models.<br />
Overview <strong>of</strong> Results<br />
The projected dem<strong>and</strong> for domestic <strong>SMR</strong> manufacturing <strong>and</strong> operations are summarized below.<br />
Detailed results for the number <strong>of</strong> <strong>SMR</strong>s manufactured <strong>and</strong> operating in the U.S. on a year-‐by-‐year basis<br />
are provided in Appendix A. These annual estimates for <strong>SMR</strong> manufacturing <strong>and</strong> operation are used to<br />
generate the estimated economic impacts in Section 4 <strong>of</strong> this report.<br />
Figure 5 indicates the cumulative number <strong>of</strong> <strong>SMR</strong> units operating per year in the U.S. for each <strong>SMR</strong><br />
<strong>Economic</strong> Impact Case described above. The plot in Figure 6 represents the number <strong>of</strong> <strong>SMR</strong> units built<br />
in the U.S. per year for each case. As mentioned previously, the nominal unit <strong>SMR</strong> generating capacity is<br />
assumed to be 100 MW.<br />
Figure 5<br />
600<br />
500<br />
400<br />
Projected <strong>SMR</strong>s Operating in the US<br />
Low Case<br />
Moderate Case<br />
High Case<br />
Disruptive Case<br />
Units<br />
300<br />
200<br />
100<br />
0<br />
2010 2015 2020 2025 2030<br />
24
Figure 6<br />
100<br />
80<br />
60<br />
Projected <strong>SMR</strong>s Manufactured in the U.S.<br />
Low Case<br />
Moderate Case<br />
High Case<br />
Disruptive Case<br />
Units<br />
40<br />
20<br />
0<br />
2010 2015 2020 2025 2030<br />
In the low <strong>SMR</strong> adoption case, there are only two to four <strong>SMR</strong>s manufactured in the U.S. each year<br />
between 2020 <strong>and</strong> 2030. In this case, the infrastructure to manufacture several <strong>SMR</strong>s per year in the<br />
U.S. may be too expensive to warrant the investment, so thbusiness-‐as-‐usual case will not lead to a<br />
concerted <strong>SMR</strong> manufacturing effort in the U.S., if only the domestic market is considered.<br />
Both the moderate <strong>and</strong> high <strong>SMR</strong> adoption cases assume that some greenhouse gas legislation is passed<br />
that penalizes CO 2 emissions. For these cases, the number <strong>of</strong> <strong>SMR</strong>s manufactured in the U.S. increases<br />
from 5 to 8 in 2020, to 31 to 37 in 2030. The total number <strong>of</strong> <strong>SMR</strong>s operating in the U.S. would increase<br />
from 4 to 14 in 2020, to 140 to 215 in 2030.<br />
The disruptive case represents a significant resurgence <strong>of</strong> nuclear manufacturing in the U.S. The number<br />
<strong>of</strong> <strong>SMR</strong>s manufactured yearly in the US would more than quadruple from 20 units in 2020 to 87 units in<br />
2030. The number <strong>of</strong> <strong>SMR</strong>s operating in the U.S. increases by more than an order <strong>of</strong> magnitude from 37<br />
in 2020 to 533 in 2030.<br />
Section 4: <strong>Economic</strong> <strong>Impacts</strong><br />
The manufacture <strong>of</strong> <strong>SMR</strong>s in the U.S., the construction <strong>of</strong> on-‐site facilities where each <strong>SMR</strong> is to be<br />
located, <strong>and</strong> the annual operation <strong>of</strong> <strong>SMR</strong>s will generate a variety <strong>of</strong> economic effects. This section <strong>of</strong><br />
the study describes the types <strong>of</strong> economic impacts stemming from <strong>SMR</strong> manufacturing, construction,<br />
<strong>and</strong> operation as well as how these impacts are measured. The economic impacts are estimated on a<br />
national basis <strong>and</strong> reported in a variety <strong>of</strong> measures commonly used in economic impact analysis.<br />
25
The basis for estimating the magnitude <strong>of</strong> the economic impacts from the development <strong>of</strong> a domestic<br />
<strong>SMR</strong> industry is the marketing analysis described above. Each <strong>of</strong> the four scenarios used in estimating<br />
the dem<strong>and</strong> for <strong>SMR</strong>s provides the projected numbers <strong>of</strong> <strong>SMR</strong>s manufactured in the U.S., deployed in<br />
the U.S., <strong>and</strong> in operation in the U.S. on an annual basis through 2030. The economic impact analysis<br />
employed here is developed using these annual projections by using the previously-‐described 100 MW<br />
prototypical <strong>SMR</strong> as a basis for analysis.<br />
The impacts stemming from the domestic manufacturing <strong>and</strong> on-‐site construction <strong>of</strong> each 100 MW <strong>SMR</strong><br />
unit are first estimated <strong>and</strong> then aggregated across the number <strong>of</strong> units projected in each <strong>of</strong> the four<br />
marketing analysis scenarios. There are additional impacts stemming from the annual operation <strong>of</strong> each<br />
<strong>SMR</strong> deployed in the U.S. The economic impacts <strong>of</strong> operating each 100 MW <strong>SMR</strong> unit are estimated <strong>and</strong><br />
aggregated across the number <strong>of</strong> <strong>SMR</strong> units in operation in the U.S. for each <strong>of</strong> the four scenarios.<br />
Input-Output Analysis<br />
The economic impacts <strong>of</strong> manufacturing, construction, <strong>and</strong> operation <strong>of</strong> <strong>SMR</strong>s are calculated using<br />
st<strong>and</strong>ard estimation techniques collectively known as Input-‐Output (I-‐O) analysis. An underlying concept<br />
in I-‐O analysis is the notion that industries are closely linked <strong>and</strong> that economic activity in one industry<br />
ripples across other sectors <strong>of</strong> the economy, generating impacts both directly <strong>and</strong> indirectly. The direct<br />
effects <strong>of</strong> an industry stem from the employment <strong>and</strong> salaries in the industry itself. In addition, there<br />
are secondary, or indirect impacts when the activity in one industry affects related industries. Each<br />
industry purchases raw inputs from other industries that add value to their product or service. These<br />
other industries in turn purchase inputs from still more industries that add value to their product or<br />
service. These types <strong>of</strong> purchases from constitute the indirect effects <strong>of</strong><br />
the economic activity <strong>of</strong> the original industry. Finally, there are the induced economic impacts caused by<br />
the direct <strong>and</strong> indirect dollars being re-‐spent in the economy. The direct, indirect, <strong>and</strong> induced economic<br />
impacts are well known to economists <strong>and</strong> are calculated using I-‐O analysis.<br />
In terms <strong>of</strong> the economic impacts <strong>of</strong> the <strong>SMR</strong> industry, the direct effects stem from the actual change in<br />
final dem<strong>and</strong> for <strong>SMR</strong> units. An increase in <strong>SMR</strong> dem<strong>and</strong>, for example, will create additional<br />
employment <strong>and</strong> salaries within the <strong>SMR</strong> industry. The indirect effects stem from the purchases <strong>of</strong><br />
goods <strong>and</strong> services by the <strong>SMR</strong> industry from suppliers in other domestic industries. In effect, the <strong>SMR</strong><br />
industry, as its purchases from other firms, ripple through the economy in a chain-like<br />
manner. The induced effects stem from the increase in wage <strong>and</strong> salary earnings <strong>and</strong> other<br />
household income that ripples though the economy as direct <strong>and</strong> indirect dollars are spent <strong>and</strong> re-‐spent<br />
in the national economy. The biggest driver <strong>of</strong> these induced effects is employee spending from wage<br />
<strong>and</strong> salary payroll <strong>and</strong> earnings.<br />
The presence <strong>of</strong> indirect <strong>and</strong> induced economic effects means that an initial increase in dem<strong>and</strong> for a<br />
tiplier effects is <strong>of</strong> primary<br />
concern in I-‐O analysis <strong>and</strong> is an important component in determining the overall economic impacts <strong>of</strong><br />
industry changes. In essence, multipliers determine how the direct change in final dem<strong>and</strong> <strong>of</strong> a single<br />
26
industry ripples throughout all the other industries in an economy. Two basic types <strong>of</strong> multipliers are<br />
recognized in st<strong>and</strong>ard I-‐O analysis. Type I multipliers measure the direct changes <strong>and</strong> the indirect<br />
Type II multipliers, also known as Social Accounting Matrix<br />
(SAM) multipliers, are larger in magnitude <strong>and</strong> more broad-‐based by virtue <strong>of</strong> the fact that they include<br />
the direct, indirect, <strong>and</strong> induced effects. They assume wages, salaries, <strong>and</strong> other income circulate<br />
through the economy along with backward linkages <strong>of</strong> business purchases. Type II multipliers measure<br />
the direct, indirect, <strong>and</strong> induced impacts from a change in final dem<strong>and</strong>s as measured by sales (output).<br />
Because the sum <strong>of</strong> the direct, indirect, <strong>and</strong> induced measures the total impact <strong>of</strong> an industry to an<br />
economy, this report will employ Type II multipliers. Once the Type II multipliers for the <strong>SMR</strong> industry<br />
are calculated, they can be used to estimate the changes in the overall economic activity <strong>of</strong> the U.S.<br />
economy stemming from different levels <strong>of</strong> activity in the <strong>SMR</strong> industry.<br />
There are a variety <strong>of</strong> I-‐O modeling s<strong>of</strong>tware programs <strong>and</strong> data systems that are available for economic<br />
impact modeling. They include programs from REMI -‐ <strong>Economic</strong> Modeling Inc, EMSI -‐ <strong>Economic</strong> Modeling<br />
Specialists, Inc., RIMS II -‐ Regional Input-‐Output Modeling System, <strong>and</strong> IMPLAN -‐ Impact Analysis for<br />
Planning. IMPLAN is one <strong>of</strong> the oldest <strong>and</strong> most widely used modeling s<strong>of</strong>tware, being originally<br />
developed for the United States Department <strong>of</strong> Agriculture Forest Service in the late 1970s <strong>and</strong> early<br />
1980s. The IMPLAN model has great flexibility, robustness, <strong>and</strong> transparency. For these reasons, IMPLAN<br />
was chosen as the s<strong>of</strong>tware platform <strong>and</strong> data system for this study.<br />
I-‐O models are first <strong>and</strong> foremost a system <strong>of</strong> national or regional accounts within an economic<br />
accounting framework that measures the interdependence among the producing <strong>and</strong> consuming sectors<br />
<strong>of</strong> an economy. They identify the relationship between a given set <strong>of</strong> dem<strong>and</strong>s for final goods <strong>and</strong><br />
services <strong>and</strong> the inputs required to satisfy those dem<strong>and</strong>s. The IMPLAN model, for example, provides<br />
estimates <strong>of</strong> production, employment, employee compensation, business income, <strong>and</strong> taxes for each <strong>of</strong><br />
over 400 sectors <strong>of</strong> the U.S. economy. Although I-‐O models can be utilized for descriptive models <strong>of</strong> the<br />
economy, their primary use is as predictive models for estimating impacts on the economy from<br />
changes in final dem<strong>and</strong>s in given industries. In such predictive models, multipliers are estimated in<br />
order to assess the overall economic impact <strong>of</strong> industry changes.<br />
Input-Output Model <strong>of</strong> the <strong>SMR</strong> Industry<br />
The manufacturing <strong>and</strong> construction <strong>of</strong> <strong>SMR</strong>s are in the planning <strong>and</strong> development stages. The major<br />
players in the market have yet to fully emerge. The manufacturing <strong>and</strong> construction <strong>of</strong> <strong>SMR</strong>s will likely<br />
occur at various locations throughout the United States. The supply chain will likely span the entire<br />
country, as well as include international suppliers. In addition, the market for <strong>SMR</strong>s is largely a national<br />
market. For these reasons, a nationwide approach to the I-‐O analysis was employed <strong>and</strong> national (U.S.)<br />
models <strong>of</strong> the <strong>SMR</strong> industry were created.<br />
In order to estimate the economic impacts <strong>of</strong> a developing <strong>SMR</strong> industry on the national economy, two<br />
IMPLAN models were constructed. The first was a disaggregated 440 sector model <strong>and</strong> the second was<br />
an aggregated 21 sector model. The simpler aggregated model is used in this study to report the results<br />
27
<strong>of</strong> the I-‐O analysis in a user-‐friendly format. The more complex disaggregated model was utilized as a<br />
benchmark to compare <strong>and</strong> calibrate the outputs <strong>of</strong> the aggregated model.<br />
The economic data employed in the analysis model are from calendar year 2007. Although 2008<br />
economic data is available for use in IMPLAN, it was avoided because <br />
model parameters. Year 2009 data was not available at the time <strong>of</strong> this study <strong>and</strong> was a recession year<br />
in any case. Year 2007 was judged to be the best platform for forecasting <strong>of</strong> the economic impacts <strong>of</strong><br />
<strong>SMR</strong>s. The forecasted economic impacts were in constant 2007 dollars. To facilitate the economic<br />
forecast modeling, it was assumed that composition <strong>of</strong> the U.S. economy remained constant over the<br />
forecast period. An alternative approach would have required a comprehensive forecast <strong>of</strong> the U.S.<br />
economy over the next 20 years, a task that is beyond the scope <strong>of</strong> this study.<br />
The economic impacts <strong>of</strong> a developing <strong>SMR</strong> industry stem from three different types <strong>of</strong> economic<br />
activity. The first is the manufacturing <strong>of</strong> the <strong>SMR</strong> units themselves. The second is the construction <strong>of</strong><br />
the facilities in which the <strong>SMR</strong>s are located. The third is the ongoing operations <strong>of</strong> <strong>SMR</strong>s for generating<br />
electricity. Each <strong>of</strong> these is described below.<br />
Manufacturing <strong>SMR</strong>s. <strong>SMR</strong> manufacturing is quite different than the construction <strong>of</strong> traditional<br />
nuclear plants. <strong>SMR</strong>s will be manufactured <strong>and</strong> produced at a manufacturing facility (factory) as a<br />
completed unit, transported to the operational location, <strong>and</strong> installed on-‐site. In contrast, a traditional<br />
nuclear power plant is constructed on-‐site <strong>and</strong> the construction techniques are well-‐developed <strong>and</strong> well-known.<br />
The manufacture <strong>of</strong> <strong>SMR</strong>s in the United States, on the other h<strong>and</strong>, currently is in the planning <strong>and</strong><br />
development stages <strong>and</strong> the costs <strong>and</strong> production techniques are proprietary. As a result, data on cost,<br />
employment, <strong>and</strong> production techniques are not available. Traditional input-‐output studies <strong>of</strong> the<br />
effects <strong>of</strong> industry changes normally utilize an extant industrial sector or build a new industrial sector<br />
model. This was not an option <strong>and</strong> an alternative approach was utilized in which an aggregated <strong>SMR</strong><br />
sector was created consisting <strong>of</strong> the nine IMPLAN sectors that are identified with nuclear power plant<br />
manufacturing. These sectors are shown in Table 7.<br />
Table 7: <strong>SMR</strong> Manufacturing Sectors<br />
IMPLAN Industry<br />
Number<br />
IMPLAN Industry Description<br />
125 All other basic inorganic chemical manufacturing<br />
133 Pharmaceutical preparation manufacturing<br />
186 Plate work <strong>and</strong> fabricated structural product manufacturing<br />
188 Power boiler <strong>and</strong> heat exchanger manufacturing<br />
189 Metal tank (heavy gauge) manufacturing<br />
198 Valve <strong>and</strong> fittings other than plumbing<br />
255 Irradiation apparatus manufacturing<br />
256 Watch, clock, <strong>and</strong> other measuring <strong>and</strong> controlling device manufacturing<br />
375 Environmental <strong>and</strong> other technical consulting services<br />
28
Construction <strong>of</strong> <strong>SMR</strong>s. As with the manufacturing <strong>of</strong> <strong>SMR</strong>s, there was a lack <strong>of</strong> construction <strong>and</strong><br />
installation expenditure data for <strong>SMR</strong>s. The modularity <strong>of</strong> the <strong>SMR</strong>s suggests a wide range <strong>of</strong> location<br />
<strong>and</strong> employment possibilities beyond what might be covered in IMPLAN Sector 35, (i.e. nonresidential<br />
manufacturing). Thus we employed an aggregated manufacturing <strong>SMR</strong> sector composed <strong>of</strong> the<br />
industrial sectors shown in Table 8.<br />
Table 8: <strong>SMR</strong> Construction Sectors<br />
IMPLAN Industry<br />
Number<br />
IMPLAN Industry Description<br />
34 Construct new nonresidential commercial<br />
35 Construct new nonresidential manufacturing<br />
36 Construct other new nonresidential structures<br />
39 Maintenance & repair construct <strong>of</strong> nonresident structures<br />
Operation <strong>of</strong> <strong>SMR</strong>s. As described in the previous section <strong>of</strong> this report, <strong>SMR</strong>s are suitable for a wide<br />
range <strong>of</strong> potential uses. However, given the uncertainties associated with estimating the dem<strong>and</strong> for<br />
uses other than electricity generation, the economic impacts stemming from the operation <strong>of</strong> <strong>SMR</strong>s are<br />
calculated with only this use in mind. Unlike the modeling <strong>of</strong> the manufacturing <strong>and</strong> construction <strong>of</strong> <strong>SMR</strong><br />
units, the economic impacts <strong>of</strong> power generation facilities are well known. These are incorporated into<br />
the specific IMPLAN sector for power generation, Sector 31. This sector was used to estimate the<br />
operational revenues/expenditures <strong>of</strong> the <strong>SMR</strong>s. It should be noted that the use <strong>of</strong> Sector 31 can be<br />
problematic because it includes all electricity generation. Expenditure patterns for traditional, large-scale<br />
nuclear power facilities are different than coal <strong>and</strong> natural gas fired plants. However, <strong>SMR</strong>s are<br />
still in the planning stage <strong>and</strong> the operating expenditure patterns <strong>and</strong> operating employment are not yet<br />
known. As a result, the use <strong>of</strong> the IMPLAN Sector 31 to estimate the economic impacts <strong>of</strong> operations is<br />
reasonable until further data become available.<br />
Estimating Manufacturing, Construction, <strong>and</strong> Operations Expenditures <strong>and</strong> Revenues<br />
As described in Section 3 <strong>of</strong> this report, the economic impacts <strong>of</strong> a developing <strong>SMR</strong> industry are<br />
estimated using a prototypical 100 MW <strong>SMR</strong> unit. This forms the basis <strong>of</strong> the approach taken with the<br />
aggregated IMPLAN model. The economic measures <strong>of</strong> the model for each prototypical unit,<br />
such as sales, value-‐added, wage <strong>and</strong> salary earnings, <strong>and</strong> indirect business taxes, were multiplied by the<br />
annual projections <strong>of</strong> the number <strong>of</strong> <strong>SMR</strong>s to be constructed <strong>and</strong> operated in the U.S. for the next 20<br />
years (2010-‐2030).<br />
For the estimates <strong>of</strong> the impacts stemming from the manufacturing <strong>and</strong> construction <strong>of</strong> <strong>SMR</strong>s, the I-‐O<br />
model used here relies on estimates for the costs <strong>of</strong> these activities. These are the direct expenditures<br />
for manufacturing <strong>and</strong> construction. The estimates <strong>of</strong> the resulting indirect <strong>and</strong> induced economic<br />
effects are subsequently estimated utilizing the Type II multipliers for these activities. Manufacturing<br />
<strong>and</strong> construction costs are measured in terms <strong>of</strong> capacity costs as denoted in kilowatts (kW) or<br />
29
megawatts (MW), an instantaneous measurement <strong>of</strong> what a generation source can produce at a single<br />
point in time. Therefore, the cost <strong>of</strong> capacity, construction, <strong>and</strong> capital is measured in $/kW or $/MW.<br />
As described above, both the costs <strong>and</strong> production techniques for <strong>SMR</strong> manufacturing <strong>and</strong> construction<br />
are proprietary. Published sources give cost estimates for <strong>SMR</strong>s ranging from $3000-‐$7000 per kilowatt<br />
<strong>of</strong> installed capacity, with a number <strong>of</strong> vendors stating they are aiming for the lower end <strong>of</strong> the<br />
spectrum (Wes<strong>of</strong>f, Kanellos, & St. John, 2009). Based on input from industry sources, the present study<br />
uses an estimate for manufacturing <strong>and</strong> construction costs for a typical <strong>SMR</strong> to be a midrange <strong>and</strong><br />
competitive $5000/KW. For the prototypical 100 MW plant used in this study, this equates to $500<br />
million per <strong>SMR</strong>. The project team estimates that approximately 87% <strong>of</strong> the total cost <strong>of</strong> the <strong>SMR</strong>s<br />
would be in manufacturing <strong>and</strong> 13% would be in construction <strong>and</strong> installation. Furthermore, it is<br />
assumed in this analysis that a typical <strong>SMR</strong> would be manufactured <strong>and</strong> constructed within a year in the<br />
U.S.<br />
The economic impacts <strong>of</strong> the manufacture <strong>and</strong> construction <strong>of</strong> <strong>SMR</strong>s was based on the number <strong>of</strong> new<br />
plants constructed each year. In contrast, the economic impacts <strong>of</strong> the operation <strong>of</strong> <strong>SMR</strong>s were based<br />
on the number <strong>of</strong> plants cumulatively in service in the U.S. Annual revenues for a prototypical 100 MW<br />
<strong>SMR</strong> are estimated as follows. First, it was necessary to estimate the price <strong>of</strong> electricity sold from each<br />
unit. Price estimates for electricity in the U.S. are commonly denoted in terms <strong>of</strong> dollars per kilowatt-hour<br />
(KWh) <strong>of</strong> electricity. This study estimates a competitive price <strong>of</strong> $0.075/kWh for the life <strong>of</strong> the<br />
prototypical <strong>SMR</strong>, 4 <strong>and</strong> a range <strong>of</strong> $0.05-‐$0.09/kWh has been reported for differing designs (Wes<strong>of</strong>f,<br />
Kanellos, & St. John, 2009). Second, the annual output <strong>of</strong> electricity from the prototypical <strong>SMR</strong> unit was<br />
estimated based on the assumption that the unit will operate at 90% efficiency over the course <strong>of</strong> a<br />
year. Based on these assumptions, the typical 100 MW plant generates estimated annual revenues <strong>of</strong><br />
$59,130,000 (90 MW x 1000 kW/MW x $0.075 kWh x 8760 hours/year = $59,130,000/year).<br />
<strong>Economic</strong> <strong>Impacts</strong> <strong>of</strong> a Typical <strong>SMR</strong> Unit<br />
Given the estimated expenditures for the manufacturing <strong>and</strong> construction <strong>of</strong> each <strong>SMR</strong> unit <strong>and</strong> the<br />
annual revenues derived from the sale <strong>of</strong> electricity from each unit, the economic impacts <strong>of</strong> the <strong>SMR</strong><br />
industry can be calculated using the estimated multipliers for each <strong>of</strong> these activities, as derived from<br />
the IMPLAN aggregated model described above. The aggregated model yields the multiplier estimates<br />
for each <strong>of</strong> these activities. These multipliers, coupled with the estimated expenditures for <strong>SMR</strong><br />
manufacturing <strong>and</strong> construction as well as the revenues derived from <strong>SMR</strong> operation, yield the total<br />
economic impact <strong>of</strong> each activity per <strong>SMR</strong>.<br />
4 A variety <strong>of</strong> factors impacts this number, including financing terms <strong>of</strong> Nth-‐<strong>of</strong>-‐a-‐kind <strong>SMR</strong>s, plant life, <strong>and</strong> different<br />
utility regulatory regimes. If a higher estimated price for electricity were chosen (or higher capital cost per <strong>SMR</strong>), it<br />
would result in higher economic <strong>and</strong> employment impacts due to the I-‐O modeling method utilized in this study.<br />
30
The economic impacts reported in this study include the direct, indirect, <strong>and</strong> induced effects, as<br />
discussed above. These can be expressed by several different measures. The most common are the<br />
following:<br />
1) Sales (output) economic impacts which represent changes in total transactions.<br />
2) Value-‐added impacts are a measure <strong>of</strong> gross domestic product at the national, regional, or local<br />
area. It includes employee compensation <strong>and</strong> proprietor income, other property income, <strong>and</strong><br />
indirect business taxes.<br />
3) Employee compensation <strong>and</strong> proprietor income measure earnings <strong>and</strong> payroll impacts.<br />
4) <strong>Employment</strong> (jobs) includes the impacts on full <strong>and</strong> part-‐time workers.<br />
5) Indirect business measures the impacts on sales taxes, property taxes, excise taxes, <strong>and</strong> all other<br />
taxes except personal income taxes <strong>and</strong> corporate income taxes.<br />
Sales (output) economic impacts are the broadest measure <strong>of</strong> economic activity. While they include<br />
some double counting <strong>of</strong> impacts <strong>and</strong> are considered to be less accurate in some ways than other<br />
measures, they are one <strong>of</strong> the most commonly reported. Value-‐added impacts are the most accurate<br />
broad measure <strong>of</strong> economic activity but they are sometimes difficult for policy-‐makers to interpret.<br />
Salary (payroll) impacts <strong>and</strong> the employment impacts are the easiest to explain <strong>and</strong> underst<strong>and</strong>. Finally,<br />
indirect business taxes are a measure <strong>of</strong> the tax impacts <strong>of</strong> a change in final dem<strong>and</strong> (excluding income<br />
taxes).<br />
While all <strong>of</strong> the measures <strong>of</strong> economic impacts are presented in graph <strong>and</strong> tabular form below, the<br />
following section provides a brief explanation <strong>of</strong> the sales (output) multipliers for a prototypical 100 MW<br />
<strong>SMR</strong> unit.<br />
Sales (Output) Impact Components: Direct, Indirect, <strong>and</strong> Induced <strong>Impacts</strong> per <strong>SMR</strong>. The sales<br />
(output) multipliers for all economic sectors in the aggregated model are presented in Table 9. These<br />
include the direct, indirect, <strong>and</strong> induced effects <strong>and</strong> the Type 1 <strong>and</strong> Type II (SAM) multipliers for each<br />
industry.<br />
Table 9: IMPLAN Output Multipliers<br />
Description<br />
Direct<br />
Effects<br />
Indirect<br />
Effects<br />
Induced<br />
Effects<br />
Total<br />
Type I<br />
Multiplier<br />
Type II (SAM)<br />
Multiplier<br />
Production Agriculture 1.000000 0.996176 0.524671 2.520847 1.996176 2.520847<br />
Ag, Forestry, Fish & Hunting 1.000000 0.443921 0.718608 2.162529 1.443921 2.162529<br />
Mining 1.000000 0.654963 0.596948 2.251911 1.654963 2.251911<br />
Nuclear Power Generation 1.000000 0.376339 0.435090 1.811429 1.376339 1.811429<br />
Utilities 1.000000 0.746149 0.514559 2.260708 1.746149 2.260708<br />
<strong>SMR</strong> Construction 1.000000 0.787949 0.885841 2.673790 1.787949 2.673790<br />
Construction 1.000000 0.918940 0.722067 2.641007 1.918940 2.641007<br />
Food Processing 1.000000 1.425418 0.612926 3.038344 2.425418 3.038344<br />
31
Manufacturing 1.000000 1.019005 0.645757 2.664762 2.019005 2.664762<br />
<strong>SMR</strong> Manufacturing 1.000000 0.872598 0.727505 2.600104 1.872598 2.600104<br />
Retail trade/Wholesale Trade 1.000000 0.494960 0.766249 2.261208 1.494960 2.261208<br />
Transportation & Warehousing 1.000000 0.767610 0.807901 2.575511 1.767610 2.575511<br />
Information/ Education/Social 1.000000 0.759661 0.748092 2.507752 1.759661 2.507752<br />
Real Estate, Finance & insurance 1.000000 0.563218 0.495409 2.058627 1.563218 2.058627<br />
Pr<strong>of</strong>essional/Tech/Scientific/Tech 1.000000 0.589225 0.953767 2.542991 1.589225 2.542991<br />
Health & Social Services 1.000000 0.562431 0.945108 2.507539 1.562431 2.507539<br />
Arts-‐ Entertainment & Recreation 1.000000 0.584933 0.833100 2.418033 1.584933 2.418033<br />
Accommodation & Food Services 1.000000 0.816050 0.772855 2.588905 1.816050 2.588905<br />
Other Services 1.000000 0.716444 0.827296 2.543740 1.716444 2.543740<br />
Federal Govt. 1.000000 0.073626 1.016510 2.090136 1.073626 2.090136<br />
State <strong>and</strong> Local Govt. 1.000000 0.136605 1.106367 2.242972 1.136605 2.242972<br />
The manufacture <strong>of</strong> the typical <strong>SMR</strong> generates direct sales (output) impacts <strong>of</strong> $435 million per <strong>SMR</strong>.<br />
This is derived by using the estimated $500 million expenditure for the prototypical 100 MW <strong>SMR</strong> <strong>and</strong><br />
allocating 87% <strong>of</strong> this expenditure for manufacturing costs (the remaining 13% is allocated for<br />
construction, as described above). The indirect <strong>and</strong> induced effects are estimated using the Type II<br />
multipliers derived from the aggregated IMPLAN model. The Type II sales (output) multiplier was 2.60<br />
for the <strong>SMR</strong> manufacturing sector in the aggregated model. This multiplier was close in magnitude to<br />
the individual industry sectors in the disaggregated model, <strong>and</strong> ranged from 2.63 to 2.79. These sales<br />
(output) multipliers are consistent with those expected for a national U.S. model. The general rule-‐<strong>of</strong>-thumb<br />
for multipliers is the larger <strong>and</strong> more integrated the economy, the greater the magnitude <strong>of</strong> a<br />
typical multiplier. Comparable U.S. multipliers are typically larger in magnitude than state multipliers;<br />
<strong>and</strong> they in turn are typically larger than comparable multipliers at the county level. Based on the<br />
estimated direct expenditures, the indirect effects for each 100 MW <strong>SMR</strong> are estimated to be $379.58<br />
million <strong>and</strong> the induced effects are $316.46 million. This gives a total economic impact, as measured by<br />
sales, <strong>of</strong> $1,131 million.<br />
For the construction <strong>of</strong> a typical <strong>SMR</strong>, the Type II sales multiplier from the aggregated construction<br />
model is estimated to be 2.67, which is consistent with the estimated multipliers for the individual<br />
construction sectors in disaggregated model that ranged from 2.53 to 2.86. The direct construction<br />
expenditure for a typical <strong>SMR</strong>, estimated to be $65 million, generates $51.2 million in indirect sales<br />
(output) impacts <strong>and</strong> $57.58 million in induced impacts. The total sales (output) impact stemming from<br />
the construction <strong>of</strong> <strong>SMR</strong>s is estimated to be $173.8 million.<br />
The sales (output) multiplier for operational expenditures is estimated to be 1.81, which is within the<br />
typical range for electrical generation. As described earlier, the operation <strong>of</strong> a typical <strong>SMR</strong> generates<br />
$59.1 million in annual revenues. These direct sales (output) impacts, coupled with the estimated Type II<br />
32
multiplier effects, yield an estimated $22.3 million in indirect impacts <strong>and</strong> $25.7 million in induced<br />
impacts. As a result, the total sales impacts from the annual operation <strong>of</strong> a typical 100 MW <strong>SMR</strong> is<br />
estimated to be $107.1 million.<br />
Total <strong>Economic</strong> <strong>Impacts</strong> <strong>of</strong> a Typical <strong>SMR</strong>. The total economic impacts (direct, indirect, <strong>and</strong> induced)<br />
are presented in Table 10 in terms <strong>of</strong> sales (output), value-‐added, payroll (earnings), <strong>and</strong> indirect<br />
business taxes.<br />
Table 10: The <strong>Economic</strong> <strong>Impacts</strong> <strong>of</strong> a Typical <strong>SMR</strong><br />
Including the Direct, Indirect, <strong>and</strong> Induced <strong>Impacts</strong><br />
Sales Value-‐Added Earnings (Payroll) <strong>Employment</strong> Indirect Business<br />
Taxes<br />
Manufacturing $ 1,131,044,963 $ 540,660,687 $ 342,449,451 5,687 $ 30,722,980<br />
Construction $ 173,796,340 $ 86,517,571 $ 62,185,369 1,238 $ 5,030,832<br />
Total <strong>SMR</strong><br />
Production $ 1,304,841,303 $ 627,178,258 $ 404,634,820 6,925 $ 35,753,812<br />
Annual Operations $ 107,109,777 $ 68,299,751 $ 27,732,333 374 $ 9,128,073<br />
Total $ 1,411,951,080 $ 695,478,009 $ 432,367,152 7,299 $ 44,881,885<br />
As shown in the table, the manufacturing impacts are $1,131.0 million in sales; $540.7 million in value-added;<br />
$342.5 million in payroll earnings; 5,687 jobs; <strong>and</strong> $30.7 million in indirect business taxes. For<br />
construction, the impacts are $173.8 million in sales impacts; $86.5 million in value added; $62.2 million<br />
in payroll earnings; 1,238 jobs; <strong>and</strong> $5.0 million in indirect business taxes.<br />
The total economic impacts for a typical <strong>SMR</strong> in construction <strong>and</strong> manufacturing are $1,304.8 million in<br />
sales; $627.2 million in value-‐added; $404.6 million in earnings-‐payroll; 6,925 jobs; <strong>and</strong> $35.8 million in<br />
indirect business taxes.<br />
The total economic impacts stemming from the annual operation <strong>of</strong> a typical <strong>SMR</strong> are as follows: sales<br />
impacts $107.1 million; value-‐added $68.3 million; earnings-‐ payroll $27.7 million; jobs 374; <strong>and</strong> indirect<br />
business taxes $9.1 million.<br />
<strong>Economic</strong> <strong>Impacts</strong> <strong>of</strong> a Developing <strong>SMR</strong> Industry<br />
In order to estimate the potential impacts <strong>of</strong> the manufacturing, construction, <strong>and</strong> operation <strong>of</strong> <strong>SMR</strong>s<br />
economy-‐wide, the study couples the estimated dem<strong>and</strong> for <strong>SMR</strong>s under the four different scenarios<br />
derived in Section 3 with the economic impacts estimated for a typical <strong>SMR</strong> calculated in the I-‐O analysis<br />
described earlier in Section 4. In each <strong>of</strong> the four dem<strong>and</strong> scenarios, the study team applies the<br />
economic impacts <strong>of</strong> a typical <strong>SMR</strong> to the 20-‐year projections <strong>of</strong> the number <strong>of</strong> <strong>SMR</strong>s manufactured <strong>and</strong><br />
constructed in the U.S. as well as by the number <strong>of</strong> <strong>SMR</strong>s cumulatively in operation.<br />
33
Figures 7.a through e illustrate the various measures <strong>of</strong> the manufacturing <strong>and</strong> construction economic<br />
impacts projected for each <strong>of</strong> the next 20 years under each <strong>of</strong> the four dem<strong>and</strong> scenarios. Figures 8.a<br />
through e illustrate the cumulative economic impact for the operation <strong>of</strong> <strong>SMR</strong>s in the U.S. under each <strong>of</strong><br />
the dem<strong>and</strong> scenarios. Appendix B shows the data, on a year-‐by-‐year basis, in tabular form.<br />
Figure 7.a<br />
Sales <strong>Economic</strong> <strong>Impacts</strong> (Billions $)<br />
$120<br />
$100<br />
$80<br />
$60<br />
$40<br />
$20<br />
<strong>Economic</strong> <strong>Impacts</strong> <strong>of</strong> <strong>SMR</strong>s Manufacturing <strong>and</strong> Construction<br />
(Sales)<br />
Sales Low Nuclear Adoption<br />
Case<br />
Sales Moderate Nuclear<br />
Adoption Case<br />
Sales High Nuclear Adoption<br />
Case<br />
Sales Disruptive Nuclear<br />
Adoption Case<br />
$0<br />
2010 2015 2020 2025 2030<br />
Figure 7.b<br />
Value-‐Added <strong>Economic</strong> <strong>Impacts</strong> (Billions $)<br />
$60<br />
$50<br />
$40<br />
$30<br />
$20<br />
$10<br />
$0<br />
<strong>Economic</strong> <strong>Impacts</strong> <strong>of</strong> <strong>SMR</strong>s Manufacturing <strong>and</strong> Construction<br />
(Value-‐Added)<br />
Value-‐Added Low Nuclear<br />
Adoption Case<br />
Value-‐Added Moderate<br />
Nuclear Adoption Case<br />
Value-‐Added High Nuclear<br />
Adoption Case<br />
Value-‐Added Disruptive<br />
Nuclear Adoption Case<br />
2010 2015 2020 2025 2030<br />
34
Figure 7.c<br />
Earnings <strong>Economic</strong> <strong>Impacts</strong> (Billions $)<br />
$40<br />
$35<br />
$30<br />
$25<br />
$20<br />
$15<br />
$10<br />
$5<br />
$0<br />
<strong>Economic</strong> <strong>Impacts</strong> <strong>of</strong> <strong>SMR</strong>s Manufacturing <strong>and</strong> Construction<br />
(Earnings/Payroll)<br />
Earnings Low Nuclear<br />
Adoption Case<br />
Earnings Moderate Nuclear<br />
Adoption Case<br />
Earnings High Nuclear<br />
Adoption Case<br />
Earnings Disruptive Nuclear<br />
Adoption Case<br />
2010 2015 2020 2025 2030<br />
Figure 7.d<br />
Jobs <strong>Economic</strong> <strong>Impacts</strong> (Thous<strong>and</strong>s)<br />
700<br />
600<br />
500<br />
400<br />
300<br />
200<br />
100<br />
0<br />
<strong>Economic</strong> <strong>Impacts</strong> <strong>of</strong> <strong>SMR</strong>s Manufacturing <strong>and</strong> Construction<br />
(Jobs)<br />
<strong>Employment</strong> Low Nuclear<br />
Adoption Case<br />
<strong>Employment</strong> Moderate<br />
Nuclear Adoption Case<br />
<strong>Employment</strong> High Nuclear<br />
Adoption Case<br />
<strong>Employment</strong> Disruptive<br />
Nuclear Adoption Case<br />
2010 2015 2020 2025 2030<br />
35
Figure 7.e<br />
Indirect Business Taxes <strong>Economic</strong> <strong>Impacts</strong><br />
(Billions $)<br />
$4<br />
$3<br />
$2<br />
$1<br />
$0<br />
<strong>Economic</strong> <strong>Impacts</strong> <strong>of</strong> <strong>SMR</strong>s Manufacturing <strong>and</strong> Construction<br />
(Indirect Business Taxes)<br />
Indirect Business Taxes Low<br />
Nuclear Adoption Case<br />
Indirect Business Taxes Moderate<br />
Nuclear Adoption Case<br />
Indirect Business Taxes High<br />
Nuclear Adoption Case<br />
Indirect Business Taxes Disruptive<br />
Nuclear Adoption Case<br />
2010 2015 2020 2025 2030<br />
Sales <strong>Economic</strong> <strong>Impacts</strong> (Billions $)<br />
$60<br />
$50<br />
$40<br />
$30<br />
$20<br />
$10<br />
$0<br />
Figure 8.a<br />
<strong>Economic</strong> <strong>Impacts</strong> <strong>of</strong> <strong>SMR</strong>s Operations (Sales)<br />
Sales Low Nuclear Adoption<br />
Case<br />
Sales Moderate Nuclear<br />
Adoption Case<br />
Sales High Nuclear Adoption<br />
Case<br />
Sales Disruptive Nuclear<br />
Adoption Case<br />
2010 2015 2020 2025 2030<br />
36
Value-‐Added <strong>Economic</strong> <strong>Impacts</strong><br />
(Billions $)<br />
$40<br />
$35<br />
$30<br />
$25<br />
$20<br />
$15<br />
$10<br />
$5<br />
$0<br />
Figure 8.b<br />
<strong>Economic</strong> <strong>Impacts</strong> <strong>of</strong> <strong>SMR</strong>s Operations (Value-‐Added)<br />
Value-‐Added Low Nuclear Adoption<br />
Case<br />
Value-‐Added Moderate Nuclear<br />
Adoption Case<br />
Value-‐Added High Nuclear<br />
Adoption Case<br />
Value-‐Added Disruptive Nuclear<br />
Adoption Case<br />
2010 2015 2020 2025 2030<br />
Earnings <strong>Economic</strong> <strong>Impacts</strong> (Billions $)<br />
$16<br />
$14<br />
$12<br />
$10<br />
$8<br />
$6<br />
$4<br />
$2<br />
$0<br />
Figure 8.c<br />
<strong>Economic</strong> <strong>Impacts</strong> <strong>of</strong> <strong>SMR</strong>s Operations (Earnings/Payroll)<br />
Earnings Low Nuclear Adoption<br />
Case<br />
Earnings Moderate Nuclear<br />
Adoption Case<br />
Earnings High Nuclear Adoption<br />
Case<br />
Earnings Disruptive Nuclear<br />
Adoption Case<br />
2010 2015 2020 2025 2030<br />
37
Figure 8.d<br />
Jobs <strong>Economic</strong> <strong>Impacts</strong> (Thous<strong>and</strong>s)<br />
250<br />
200<br />
150<br />
100<br />
50<br />
<strong>Economic</strong> <strong>Impacts</strong> <strong>of</strong> <strong>SMR</strong>s Operations (Jobs)<br />
<strong>Employment</strong> Low Nuclear Adoption<br />
Case<br />
<strong>Employment</strong> Moderate Nuclear<br />
Adoption Case<br />
<strong>Employment</strong> High Nuclear<br />
Adoption Case<br />
<strong>Employment</strong> Disruptive Nuclear<br />
Adoption Case<br />
0<br />
2010 2015 2020 2025 2030<br />
$6<br />
Figure 8.e<br />
<strong>Economic</strong> <strong>Impacts</strong> <strong>of</strong> <strong>SMR</strong>s Operations<br />
(Indirect Business Taxes)<br />
Indirect Business Taxes <strong>Economic</strong> <strong>Impacts</strong><br />
(Billions $)<br />
$5<br />
$4<br />
$3<br />
$2<br />
$1<br />
$0<br />
Indirect Business Taxes Low Nuclear<br />
Adoption Case<br />
Indirect Business Taxes Moderate<br />
Nuclear Adoption Case<br />
Indirect Business Taxes High Nuclear<br />
Adoption Case<br />
Indirect Business Taxes Disruptive<br />
Nuclear Adoption Case<br />
2010 2015 2020 2025 2030<br />
Projected <strong>Economic</strong> <strong>Impacts</strong> <strong>of</strong> the <strong>SMR</strong> Industry by 2030<br />
Under the assumptions utilized in this study, by year 2030 the market for <strong>SMR</strong>s will be substantially if<br />
not fully developed. Figures 9.a through 9.e report various economic impacts by the year 2030 for each<br />
<strong>of</strong> the projected dem<strong>and</strong> scenarios: Low, Medium, High, <strong>and</strong> Disruptive. The research team reports the<br />
economic impacts by sales (output), value-‐added, earnings (payroll), jobs, <strong>and</strong> indirect business taxes.<br />
These data are presented in tabular form in Appendix C.<br />
38
$120<br />
$100<br />
Figure 9.a<br />
(Manufacturing <strong>and</strong> Construction)<br />
Sales (Output) <strong>Economic</strong> <strong>Impacts</strong><br />
in 2030 by Scenario<br />
$113.5<br />
$80<br />
Billions<br />
$60<br />
$40<br />
$40.5<br />
$48.3<br />
$20<br />
$0<br />
$3.9<br />
Low Nuclear<br />
Adoption Case<br />
Moderate<br />
Nuclear Adoption<br />
Case<br />
High Nuclear<br />
Adoption Case<br />
Disruptive<br />
Nuclear Adoption<br />
Case<br />
$60<br />
$50<br />
$40<br />
Figure 9.b<br />
(Manufacturing <strong>and</strong> Construction)<br />
Value-‐Added <strong>Economic</strong> <strong>Impacts</strong><br />
in 2030 by Scenario<br />
$54.6<br />
Billions<br />
$30<br />
$20<br />
$19.4<br />
$23.2<br />
$10<br />
$0<br />
$1.9<br />
Low Nuclear<br />
Adoption Case<br />
Moderate<br />
Nuclear Adoption<br />
Case<br />
High Nuclear<br />
Adoption Case<br />
Disruptive<br />
Nuclear Adoption<br />
Case<br />
39
Figure 9.c<br />
(Manufacturing <strong>and</strong> Construction)<br />
Earnings (Payroll) <strong>Economic</strong> <strong>Impacts</strong><br />
in 2030 by Scenario<br />
$40<br />
$35<br />
$35.2<br />
$30<br />
$25<br />
Billions<br />
$20<br />
$15<br />
$12.5<br />
$15.0<br />
$10<br />
$5<br />
$0<br />
$1.2<br />
Low Nuclear<br />
Adoption Case<br />
Moderate<br />
Nuclear Adoption<br />
Case<br />
High Nuclear<br />
Adoption Case<br />
Disruptive<br />
Nuclear Adoption<br />
Case<br />
Figure 9.d<br />
(Manufacturing <strong>and</strong> Construction)<br />
Jobs <strong>Economic</strong> <strong>Impacts</strong><br />
in 2030 by Scenario<br />
800,000<br />
600,000<br />
602,450<br />
400,000<br />
200,000<br />
-‐<br />
20,774<br />
214,666<br />
256,214<br />
Low Nuclear<br />
Adoption Case<br />
Moderate<br />
Nuclear<br />
Adoption Case<br />
High Nuclear<br />
Adoption Case<br />
Disruptive<br />
Nuclear<br />
Adoption Case<br />
40
Billions<br />
$3.5<br />
$3.0<br />
$2.5<br />
$2.0<br />
$1.5<br />
$1.0<br />
$0.5<br />
$0.0<br />
$0.1<br />
Low Nuclear<br />
Adoption Case<br />
Figure 9.e<br />
(Manufacturing <strong>and</strong> Construction)<br />
Indirect Business Taxes<br />
<strong>Economic</strong> <strong>Impacts</strong><br />
in 2030 by Scenario<br />
$1.1<br />
Moderate<br />
Nuclear Adoption<br />
Case<br />
$1.3<br />
High Nuclear<br />
Adoption Case<br />
$3.1<br />
Disruptive<br />
Nuclear Adoption<br />
Case<br />
Figures 10. a through e report these measures for the operations <strong>of</strong> <strong>SMR</strong>s. As described earlier, the<br />
operations impacts stem from the cumulative additions <strong>of</strong> <strong>SMR</strong>s throughout the projected twenty-‐year<br />
period until 2030. These data are presented in tabular form in Appendix D.<br />
Figure 10.a<br />
$60<br />
$50<br />
$40<br />
Sales (Output) <strong>Economic</strong> <strong>Impacts</strong><br />
in 2030 by Scenario<br />
$57.1<br />
Billions<br />
$30<br />
$20<br />
$15.0<br />
$23.0<br />
$10<br />
$0<br />
$1.9<br />
Low Nuclear<br />
Adoption Case<br />
Moderate<br />
Nuclear Adoption<br />
Case<br />
High Nuclear<br />
Adoption Case<br />
Disruptive<br />
Nuclear Adoption<br />
Case<br />
41
Figure 10.b<br />
Value-‐Added <strong>Economic</strong> <strong>Impacts</strong><br />
in 2030 by Scenario<br />
$40<br />
$35<br />
$36.4<br />
$30<br />
$25<br />
Billions<br />
$20<br />
$15<br />
$10<br />
$9.6<br />
$14.7<br />
$5<br />
$0<br />
$1.2<br />
Low Nuclear<br />
Adoption Case<br />
Moderate<br />
Nuclear Adoption<br />
Case<br />
High Nuclear<br />
Adoption Case<br />
Disruptive<br />
Nuclear Adoption<br />
Case<br />
Figure 10.c<br />
Earnings (Payroll) <strong>Economic</strong> <strong>Impacts</strong><br />
in 2030 by Scenario<br />
$16<br />
$14.8<br />
$14<br />
$12<br />
$10<br />
Billions<br />
$8<br />
$6<br />
$4<br />
$3.9<br />
$6.0<br />
$2<br />
$0<br />
$0.5<br />
Low Nuclear<br />
Adoption Case<br />
Moderate<br />
Nuclear Adoption<br />
Case<br />
High Nuclear<br />
Adoption Case<br />
Disruptive<br />
Nuclear Adoption<br />
Case<br />
42
Figure 10.d<br />
Jobs <strong>Economic</strong> <strong>Impacts</strong><br />
in 2030 by Scenario<br />
250,000<br />
200,000<br />
199,543<br />
150,000<br />
100,000<br />
50,000<br />
0<br />
6,739<br />
Low Nuclear<br />
Adoption Case<br />
52,413<br />
Moderate<br />
Nuclear Adoption<br />
Case<br />
80,491<br />
High Nuclear<br />
Adoption Case<br />
Disruptive<br />
Nuclear Adoption<br />
Case<br />
Billions<br />
$6.0<br />
$5.0<br />
$4.0<br />
$3.0<br />
$2.0<br />
$1.0<br />
$0.0<br />
$0.2<br />
Low Nuclear<br />
Adoption Case<br />
$1.3<br />
Figure 10.e<br />
Indirect Business Taxes<br />
<strong>Economic</strong> <strong>Impacts</strong><br />
in 2030 by Scenario<br />
Moderate<br />
Nuclear Adoption<br />
Case<br />
$2.0<br />
High Nuclear<br />
Adoption Case<br />
$4.9<br />
Disruptive<br />
Nuclear Adoption<br />
Case<br />
Section 5: Concluding Remarks<br />
This study highlights the magnitude <strong>of</strong> potential benefits from manufacturing <strong>SMR</strong>s in the U.S. The<br />
economic analysis estimates the impacts <strong>of</strong> <strong>SMR</strong> manufacturing, construction, <strong>and</strong> operation <strong>of</strong> a<br />
representative 100 MW <strong>SMR</strong> unit as follows:<br />
43
A prototypical 100 MW <strong>SMR</strong> costing $500 million to manufacture <strong>and</strong> install on-‐site is<br />
estimated to create nearly 7,000 jobs <strong>and</strong> generate $1.3 billion in sales, $627 million in<br />
value-‐added, $404 million in earnings (payroll), <strong>and</strong> $35 million in indirect business taxes<br />
The annual operation <strong>of</strong> each 100 MW <strong>SMR</strong> unit is estimated to create about 375 jobs<br />
<strong>and</strong> generate $107 million in sales, $68 million in value-‐added, $27 million in earnings<br />
(payroll), <strong>and</strong> $9 million in indirect business taxes<br />
The development <strong>of</strong> a robust domestic <strong>SMR</strong> industry will result in significant economic benefits. Given<br />
the assumptions regarding the deployment <strong>of</strong> <strong>SMR</strong>s as outlined in the Moderate <strong>and</strong> High Nuclear<br />
Adoption cases, the manufacture <strong>and</strong> construction <strong>of</strong> <strong>SMR</strong>s in 2030 will be responsible for an estimated<br />
range <strong>of</strong>: 215,000 255,000 jobs,; $40 -‐ $48 billion in sales; $19 -‐ $23 billion in value-‐added; $12 -‐ $15<br />
billion in annual earnings; <strong>and</strong> $1.1 -‐ $1.3 billion in indirect business taxes. From cumulative operations<br />
through 2030, <strong>SMR</strong>s will be responsible for: 52,000 80,000 jobs; $15 -‐ $23 billion in sales; $10 -‐ $15<br />
billion in value-‐added; $4 -‐ $6 billion in annual earnings; <strong>and</strong> $1.3 -‐ $2 billion in indirect business taxes.<br />
Aggressive development <strong>of</strong> a domestic <strong>SMR</strong> industry, as outlined in the Disruptive Nuclear Adoption<br />
Case, roughly triples these estimated impacts <strong>and</strong> generates very significant economic benefits.<br />
In stark contrast, the conditions assumed in the Low Nuclear Adoption (also called the No Greenhouse<br />
Gas Legislation) case, result in approximately 1/10 th <strong>of</strong> the economic benefits <strong>of</strong> the High <strong>and</strong> Moderate<br />
cases, with just a few <strong>SMR</strong>s manufactured domestically on an annual basis by 2030. The results <strong>of</strong> the<br />
Low Nuclear Adoption Case indicate a likely low probability for achieving a globally competitive <strong>and</strong><br />
stable <strong>SMR</strong> manufacturing industry in the U.S.<br />
Based on the overall results <strong>of</strong> this study, a robust <strong>SMR</strong> market, both globally <strong>and</strong> nationally, will add to<br />
the U.S. manufacturing base <strong>and</strong> provide a significant number <strong>of</strong> high-‐paying jobs in manufacture <strong>and</strong><br />
operations. This conclusion is based on a number <strong>of</strong> dependencies that temper the relative certainty <strong>of</strong><br />
the results.<br />
First, crucial to the success <strong>of</strong> the <strong>SMR</strong> manufacturing industry is successfully navigating the NRC<br />
licensing process in a satisfactory timeframe. Because the <strong>SMR</strong> design <strong>and</strong> manufacturing industry is<br />
globally competitive <strong>and</strong> <strong>SMR</strong>s will compete with other options for U.S. electricity generation, significant<br />
delays or failure <strong>of</strong> specific designs in NRC licensing could result in a domestic industry that does not<br />
realize its potential. Second, the economic impacts <strong>and</strong> market penetration <strong>of</strong> <strong>SMR</strong>s corresponds to the<br />
degree <strong>of</strong> anticipated carbon regulationthe tighter the regulation <strong>and</strong> the higher the price on carbon,<br />
the greater the degree <strong>of</strong> <strong>SMR</strong> (<strong>and</strong> nuclear) success. Third, the issue <strong>of</strong> siting has not yet been<br />
addressed. Nuclear energy may be at its highest public approval rating in more than a generation (Jones,<br />
2010), but it is still an assumption the American public is readily willing to site many new nuclear<br />
reactors. In addition, it is assumed that <strong>SMR</strong>s will be easier to site than traditional nuclear power<br />
generation facilities although this notion has not yet been tested. Likewise, competitors to nuclear<br />
power, in particular coal plants, have experienced sustained public opposition <strong>of</strong> late. The degree <strong>of</strong><br />
public acceptance (or rejection) <strong>of</strong> nuclear power in relation to its competitors will be important to<br />
market penetration in the future.<br />
44
Finally, this study did not address the domestic investment climate for <strong>SMR</strong>s. The investment<br />
community has long taken a wait-‐<strong>and</strong>-‐see attitude toward the nuclear power industry. Explicit<br />
government support for <strong>SMR</strong>s will have an impact on investment desirability in the sector, as will the<br />
availability <strong>of</strong> what is now closely held data by proprietors. Each <strong>of</strong> these dependencies merits additional<br />
independent research <strong>and</strong> possible replication <strong>of</strong> this study as <strong>SMR</strong>s move closer to realization.<br />
45
References<br />
Arthur, E. (2010). The right sized reactor: <strong>Small</strong> modular reactors for the second nuclear era. Edited<br />
version <strong>of</strong> a proprietary paper written in 2007 on assessing market potential for small nuclear reactors.<br />
Babcock & Wilcox Company. (2009, June 10). B&W introduces scalable, practical nuclear energy.<br />
Retrieved January 2010, from<br />
http://www.babcock.com/products/modular_nuclear/pdf/press_release.pdf<br />
Black, R. (2010, April 6). DOE programs for small modular reactors <strong>and</strong> advanced reactor concepts -‐<br />
presentation. Retrieved April 30, 2010, from www.nrc.gov/reading-‐rm/doc.../2010/20100406/black-‐<br />
20100406.pdf<br />
Carelli, M., Garrone, P., Locatelli, G., Mancini, M., Myc<strong>of</strong>f, C., Trucco, P., et al. (2010). <strong>Economic</strong> features<br />
<strong>of</strong> integral, modular, small-‐to-‐medium size reactors. Progress in Nuclear Energy , 52 (4), 403-‐414.<br />
Chu, S. (2010, March 23). America's new nuclear option: <strong>Small</strong> modular reactors will exp<strong>and</strong> the ways<br />
we use nuclear power. The Wall Street Journal .<br />
Congressional Budget Office. (2008). Nuclear power's role in generating electricity. Congress <strong>of</strong> the<br />
United States, Congressional Budget Office.<br />
Csik, B. J., & Kupitz, J. (1997). Nuclear power applications: supplying heat for homes <strong>and</strong> industries. IAEA<br />
Bulletin , 39 (2).<br />
Dininny, S. (2009, June 3). Energy Northwest considers more nuclear power. The Seattle Times .<br />
Electric Power Research Institute. (2009). The power to reduce CO2 emissions: The full portfolio -‐2009<br />
Technical Report 1020389 -‐ research update October 2009. Palo Alto, CA: EPRI.<br />
Energy Information Administration. (2009, April). Annual energy outlook 2009 with projections to 2030,<br />
updated annual energy outlook 2009 reference case with ARRA. Retrieved from<br />
http://www.eia.doe.gov/oiaf/servicerpt/stimulus/pdf/stimulus.pdf<br />
Energy Information Administration. (2008, September). Country analysis briefs: Japan. Retrieved April 7,<br />
2010, from http://www.eia.doe.gov/cabs/Japan/pdf.pdf<br />
Energy Information Administration. (2009a, August 4). Energy market <strong>and</strong> economic impacts <strong>of</strong> H.R.<br />
2454, the American Clean Energy <strong>and</strong> Security Act <strong>of</strong> 2009. Retrieved from<br />
http://www.eia.doe.gov/oiaf/servicerpt/hr2454/pdf/sroiaf(2009)05.pdf<br />
46
Energy Information Administration. (2009b, May 27). International energy outlook 2009. Retrieved<br />
January 2010, from http://www.eia.doe.gov/oiaf/ieo/index.html<br />
Havil<strong>and</strong>, D. (2009, August 24). Public invited to informational meeting on small-‐scale nuclear power.<br />
Retrieved April 30, 2010, from KBKW Newsroom:<br />
http://kbkw.com/modules/news/article.phpstoryid=809<br />
Holt, M. (2006). Nuclear energy policy. Library <strong>of</strong> Congress. Washington D.C.: Congressional Research<br />
Service.<br />
Ingersoll, D. (2009). Deliberately small reactors <strong>and</strong> the second nuclear era. Progress in Nuclear Energy ,<br />
51, 589-‐603.<br />
International Atomic Energy Agency. (2009). Design features to achieve defence in depth in small <strong>and</strong><br />
medium sized reactors. TECDOC-‐1536. Vienna: IAEA.<br />
International Atomic Energy Agency. (2007a). <strong>Economic</strong>s <strong>of</strong> nuclear desalination: new developments <strong>and</strong><br />
site specific studies -‐ Final results <strong>of</strong> a coordinated research project 2002-‐2006. IAEA-‐TECDOC-‐1561 July<br />
2007. Vienna: International Atomic Energy Agency.<br />
International Atomic Energy Agency. (2009b). Energy, electricity <strong>and</strong> nuclear power estimates for the<br />
period up to 2030 -‐ 2009 Edition. Vienna: International Atomic Energy Agency.<br />
International Atomic Energy Agency. (1999). Hydrogen as an energy carrier <strong>and</strong> its production by nuclear<br />
power. IAEA-‐TECDOC-‐1085 May 1999. Vienna: International Atomic Energy Agency.<br />
International Atomic Energy Agency. (2008). International status <strong>and</strong> prospects <strong>of</strong> nuclear power.<br />
Retrieved April 7 2010, from http://www.iaea.org/Publications/Booklets/NuclearPower/np08.pdf<br />
International Atomic Energy Agency. (2000). Introduction <strong>of</strong> nuclear desalination: A guidebook. Technical<br />
Reports Series No. 400 . Vienna: International Atomic Energy Agency.<br />
International Atomic Energy Agency. (2009a). Non-‐electric applications <strong>of</strong> nuclear power: seawater<br />
desalination, hydrogen production <strong>and</strong> other industrial applications. Proceedings <strong>of</strong> an International<br />
Conference, Oarai, Japan, 16 -‐ 19 April 2007. Vienna: International Atomic Energy Agency.<br />
International Atomic Energy Agency. (2010). Nuclear power plants information -‐ Number <strong>of</strong> reactors in<br />
operation worldwide. Retrieved April 1, 2010, from http://www.iaea.org/cgi-bin/db.page.pl/pris.oprconst.htm<br />
International Atomic Energy Agency. (2010a). Power reactor information system. Retrieved April 1, 2010,<br />
from http://www.iaea.or.at/programmes/a2/<br />
47
International Atomic Energy Agency. (2010b, January). Status <strong>and</strong> near-‐term prospects <strong>of</strong> small <strong>and</strong><br />
medium sized reactors. Retrieved February 21, 2010, from<br />
http://www.iaea.org/NuclearPower/Downloads/<strong>SMR</strong>/docs/Status-‐<strong>SMR</strong>s-‐January-‐2010.pdf<br />
International Atomic Energy Agency. (2007). Status <strong>of</strong> small reactor designs without on-‐site refuelling.<br />
Vienna, Austria.<br />
International Atomic Energy Association. (n.d.). Nuclear share in electricity generation in 2009. Retrieved<br />
April 2010, from Nuclear power plants information: http://www.iaea.org/cgi-bin/db.page.pl/pris.nucshare.htm<br />
International Energy Agency. (2009). Key world energy statistics 2009. Retrieved April 1, 2010, from<br />
http://www.iea.org/Textbase/nppdf/free/2009/key_stats_2009.pdf<br />
Jones, J. (2010, March 22). U.S. support for nuclear power climbs to new high <strong>of</strong> 62%. Retrieved April 5,<br />
2010, from Gallup: http://www.gallup.com/poll/126827/Support-‐Nuclear-‐Power-‐Climbs-‐New-‐<br />
High.aspxversion=print<br />
Kenley, C., Klingler, R., Plowman, C., Soto, R., Turk, R., Baker, R., et al. (2009). Job creation due to nuclear<br />
power resurgence in the United States. Energy Policy (37), 4897-‐4900.<br />
Los Alamos National Laboratory. (2008, February 12). Synthetic fuel concept to steal CO2 from air.<br />
Retrieved April 7, 2010, from<br />
http://www.lanl.gov/news/index.php/fuseaction/home.story/story_id/12554<br />
Nuclear Energy Institute. (2010). U.S. nuclear generating statistics 1971-‐2009. Retrieved April 2010, from<br />
http://www.nei.org/resources<strong>and</strong>stats/documentlibrary/reliable<strong>and</strong>affordableenergy/graphics<strong>and</strong>chart<br />
s/usnucleargeneratingstatistics/<br />
NuScale Power. (n.d.). The regulatory approval process <strong>and</strong> NuScale systems. Retrieved January 2010,<br />
from NuScale Power: http://www.nuscalepower.com/ri-‐Nuclear-‐Regulatory-‐Info-‐And-‐Process.php<br />
Office <strong>of</strong> Nuclear Energy -‐ U.S. DOE. (2010, February). Next generation nuclear plant demonstration<br />
project. Retrieved April 5, 2010, from<br />
http://nuclear.energy.gov/pdfFiles/factSheets/2011_NGNP_Factsheet.pdf<br />
Office <strong>of</strong> Nuclear Energy, U.S. DOE. (2009, December). Developing <strong>and</strong> deploying small modular reactors<br />
(<strong>SMR</strong>s) -‐ presentation to Under Secretary Johnson <strong>and</strong> Under Secretary Koonin.<br />
Pulizzi, H. J., & Buurma, C. (2010, February 16). Obama unveils loan guarantees for nuclear plant. The<br />
Wall Street Journal .<br />
48
S<strong>and</strong>ers, T. (2009, December 15). Testimony <strong>of</strong> American Nuclear Society before the U.S. Senate<br />
Committe on Energy <strong>and</strong> Natural Resources on S.2052. Retrieved from<br />
http://energy.senate.gov/public/_files/DrS<strong>and</strong>ersChart2DesignsApplications.pdf<br />
Smith, R. (2010a, February 22). General Atomics proposes a plant that runs on nuclear waste. The Wall<br />
Street Journal .<br />
Smith, R. (2010, February 18). <strong>Small</strong> reactors generate big hopes. The Wall Street Journal .<br />
U.S. Government Accountability Office. (2007). NRC's workforce <strong>and</strong> processes for new reactor licensing<br />
are generally in place, but uncertainties remain as industry begins to submit applications. GAO-‐07-‐1129.<br />
Washington D.C.: GAO.<br />
U.S. Nuclear Regulatory Commission. (2010, April). Advanced reactors. Retrieved April 30, 2010, from<br />
http://www.nrc.gov/reactors/advanced.html<br />
Wes<strong>of</strong>f, E., Kanellos, M., & St. John, J. (2009). <strong>Small</strong> modular nuclear reactors: The economies <strong>of</strong> small -‐<br />
December 2009. Greentech Media.<br />
World Nuclear Association. (2010, February). <strong>Small</strong> nuclear power reactors. Retrieved February 21, 2010,<br />
from http://www.world-‐nuclear.org/info/inf33.html<br />
World Nuclear Association. (2009, September). World energy needs <strong>and</strong> nuclear power. Retrieved<br />
January 25, 2010, from http://www.world-‐nuclear.org/info/inf16.html<br />
World Nuclear Association. (2010b, April 1). World nuclear power reactors & uranium requirements.<br />
Retrieved April 7, 2010, from http://www.world-‐nuclear.org/info/default.aspxid=27636<br />
49
Appendix A: <strong>SMR</strong> Electricity Generation Market Potential (4 cases)<br />
Low Nuclear Adoption Case 2010 2011 2012 2013 2014 2015 2016 2017 2018 2019 2020 2021 2022 2023 2024 2025 2026 2027 2028 2029 2030<br />
US Total Nuclear Capacity Installed (MWe) 0.0 0.0 0.0 0.0 1180.0 0.0 0.0 1000.0 1000.0 1000.0 2207.4 0.0 0.0 0.0 0.0 0.0 0.0 1077.3 1040.1 1049.0 1008.5<br />
US <strong>SMR</strong> Capacity Installed [All Manufac.] (MWe) 0.0 0.0 0.0 0.0 0.0 0.0 0.0 60.0 80.0 100.0 264.9 0.0 0.0 0.0 0.0 0.0 0.0 280.1 291.2 314.7 322.7<br />
US <strong>SMR</strong> Capacity Installed [All Manufac.] (Units) 0 0 0 0 0 0 0 1 1 1 3 0 0 0 0 0 0 3 3 3 3<br />
US <strong>SMR</strong>s Operating (Units) 0 0 0 0 0 0 0 1 2 3 6 6 6 6 6 6 6 9 12 15 18<br />
US <strong>SMR</strong> Capacity Installed [US Manfuc.] (MWe) 0.0 0.0 0.0 0.0 0.0 0.0 0.0 30.0 40.0 50.0 132.4 0.0 0.0 0.0 0.0 0.0 0.0 140.0 145.6 157.4 161.4<br />
US <strong>SMR</strong> Capacity Installed [US Manfuc.] (Units) 0 0 0 0 0 0 0 0 0 1 1 0 0 0 0 0 0 1 1 2 2<br />
Inter. Total Nuclear Capacity Installed (MWe) #N/A 5322.3 5804.6 6214.9 6553.1 6819.4 7013.7 7136.0 7186.3 7164.6 7070.9 6905.1 6667.4 6357.7 5976.0 5522.3 4996.6 4398.9 3729.1 2987.4 2173.7<br />
Inter. <strong>SMR</strong> Capacity Installed [All Manufac.] (MWe) 0.0 0.0 0.0 0.0 136.4 280.5 428.2 574.9 716.5 848.5 966.7 1066.8 1144.4 1195.2 1214.9 1199.2 1143.7 1044.2 896.2 695.6<br />
Inter. <strong>SMR</strong> Capacity Installed [All Manufac.] (Units) 0 0 0 0 0 1 3 4 6 7 8 10 11 11 12 12 12 11 10 9 7<br />
Inter. <strong>SMR</strong> Capacity Installed [US Manufac.] (MWe) 0.0 0.0 0.0 0.0 27.3 56.1 85.6 115.0 143.3 169.7 193.3 213.4 228.9 239.0 243.0 239.8 228.7 208.8 179.2 139.1<br />
Inter. <strong>SMR</strong> Capacity Installed [US Manufac.] (Units) 0 0 0 0 0 0 1 1 1 1 2 2 2 2 2 2 2 2 2 2 1<br />
Total <strong>SMR</strong>s Manufactured in the US (Units) 0 0 0 0 0 0 1 1 1 2 3 2 2 2 2 2 2 3 3 4 3<br />
Moderate Nuclear Adoption Case 2010 2011 2012 2013 2014 2015 2016 2017 2018 2019 2020 2021 2022 2023 2024 2025 2026 2027 2028 2029 2030<br />
US Total Nuclear Capacity Installed (MWe) 0.0 0.0 0.0 0.0 1180.0 0.0 0.0 1000.0 1000.0 1000.0 1200.0 2340.0 3020.0 3700.0 4380.0 5060.0 5740.0 6420.0 7100.0 7780.0 8460.0<br />
US <strong>SMR</strong> Capacity Installed [All Manufac.] (MWe) 0.0 0.0 0.0 0.0 0.0 0.0 0.0 60.0 80.0 100.0 144.0 327.6 483.2 666.0 876.0 1113.2 1377.6 1669.2 1988.0 2334.0 2707.2<br />
US <strong>SMR</strong> Capacity Installed [All Manufac.] (Units) 0 0 0 0 0 0 0 1 1 1 1 3 5 7 9 11 14 17 20 23 27<br />
US <strong>SMR</strong>s Operating (Units) 0 0 0 0 0 0 0 1 2 3 4 7 12 19 28 39 53 70 90 113 140<br />
US <strong>SMR</strong> Capacity Installed [US Manfuc.] (MWe) 0.0 0.0 0.0 0.0 0.0 0.0 0.0 30.0 40.0 50.0 72.0 163.8 241.6 333.0 438.0 556.6 688.8 834.6 994.0 1167.0 1353.6<br />
US <strong>SMR</strong> Capacity Installed [US Manfuc.] (Units) 0 0 0 0 0 0 0 0 0 1 1 2 2 3 4 6 7 8 10 12 14<br />
Inter. Total Nuclear Capacity Installed (MWe) #N/A 11357.0 12170.1 12983.2 13796.3 14609.4 15422.6 16235.7 17048.8 17861.9 18675.0 19488.2 20301.3 21114.4 21927.5 22740.6 23553.8 24366.9 25180.0 25993.1 26806.2<br />
Inter. <strong>SMR</strong> Capacity Installed [All Manufac.] (MWe) 0.0 0.0 0.0 0.0 292.2 616.9 974.1 1363.9 1786.2 2241.0 2728.3 3248.2 3800.6 4385.5 5002.9 5652.9 6335.4 7050.4 7797.9 8578.0<br />
Inter. <strong>SMR</strong> Capacity Installed [All Manufac.] (Units) 0 0 0 0 0 3 6 10 14 18 22 27 32 38 44 50 57 63 71 78 86<br />
Inter. <strong>SMR</strong> Capacity Installed [US Manufac.] (MWe) 0.0 0.0 0.0 0.0 58.4 123.4 194.8 272.8 357.2 448.2 545.7 649.6 760.1 877.1 1000.6 1130.6 1267.1 1410.1 1559.6 1715.6<br />
Inter. <strong>SMR</strong> Capacity Installed [US Manufac.] (Units) 0 0 0 0 0 1 1 2 3 4 4 5 6 8 9 10 11 13 14 16 17<br />
Total <strong>SMR</strong>s Manufactured in the US (Units) 0 0 0 0 0 1 1 2 3 5 5 7 8 11 13 16 18 21 24 28 31<br />
50
Appendix A, continued:<br />
High Nuclear Adoption Case 2010 2011 2012 2013 2014 2015 2016 2017 2018 2019 2020 2021 2022 2023 2024 2025 2026 2027 2028 2029 2030<br />
US Total Nuclear Capacity Installed (MWe) 0.0 0.0 0.0 0.0 1180.0 0.0 0.0 1000.0 3000.0 4450.0 6066.3 0.0 6092.0 7005.8 7282.3 8374.7 8381.6 8909.9 10110.0 11362.1 12572.4<br />
US <strong>SMR</strong> Capacity Installed [All Manufac.] (MWe) 0.0 0.0 0.0 0.0 0.0 0.0 0.0 60.0 240.0 445.0 728.0 0.0 974.7 1261.0 1456.5 1842.4 2011.6 2316.6 2830.8 3408.6 4023.2<br />
US <strong>SMR</strong> Capacity Installed [All Manufac.] (Units) 0 0 0 0 0 0 0 1 2 4 7 0 10 13 15 18 20 23 28 34 40<br />
US <strong>SMR</strong>s Operating (Units) 0 0 0 0 0 0 0 1 3 7 14 14 24 37 52 70 90 113 141 175 215<br />
US <strong>SMR</strong> Capacity Installed [US Manfuc.] (MWe) 0.0 0.0 0.0 0.0 0.0 0.0 0.0 30.0 120.0 222.5 364.0 0.0 487.4 630.5 728.2 921.2 1005.8 1158.3 1415.4 1704.3 2011.6<br />
US <strong>SMR</strong> Capacity Installed [US Manfuc.] (Units) 0 0 0 0 0 0 0 0 1 2 4 0 5 6 7 9 10 12 14 17 20<br />
Inter. Total Nuclear Capacity Installed (MWe) #N/A 11357.0 12170.1 12983.2 13796.3 14609.4 15422.6 16235.7 17048.8 17861.9 18675.0 19488.2 20301.3 21114.4 21927.5 22740.6 23553.8 24366.9 25180.0 25993.1 26806.2<br />
Inter. <strong>SMR</strong> Capacity Installed [All Manufac.] (MWe) 0.0 0.0 0.0 0.0 292.2 616.9 974.1 1363.9 1786.2 2241.0 2728.3 3248.2 3800.6 4385.5 5002.9 5652.9 6335.4 7050.4 7797.9 8578.0<br />
Inter. <strong>SMR</strong> Capacity Installed [All Manufac.] (Units) 0 0 0 0 0 3 6 10 14 18 22 27 32 38 44 50 57 63 71 78 86<br />
Inter. <strong>SMR</strong> Capacity Installed [US Manufac.] (MWe) 0.0 0.0 0.0 0.0 58.4 123.4 194.8 272.8 357.2 448.2 545.7 649.6 760.1 877.1 1000.6 1130.6 1267.1 1410.1 1559.6 1715.6<br />
Inter. <strong>SMR</strong> Capacity Installed [US Manufac.] (Units) 0 0 0 0 0 1 1 2 3 4 4 5 6 8 9 10 11 13 14 16 17<br />
Total <strong>SMR</strong>s Manufactured in the US (Units) 0 0 0 0 0 1 1 2 4 6 8 5 11 14 16 19 21 25 28 33 37<br />
Disruptive Nuclear Adoption Case 2010 2011 2012 2013 2014 2015 2016 2017 2018 2019 2020 2021 2022 2023 2024 2025 2026 2027 2028 2029 2030<br />
US Total Nuclear Capacity Installed (MWe) 0.0 0.0 0.0 0.0 1180.0 0.0 0.0 1000.0 3000.0 4450.0 6066.3 0.0 6092.0 7005.8 7282.3 8374.7 8381.6 8909.9 10110.0 11362.1 12572.4<br />
US <strong>SMR</strong> Capacity Installed [All Manufac.] (MWe) 0.0 0.0 0.0 0.0 0.0 0.0 0.0 150.0 600.0 1112.5 1819.9 0.0 2436.8 3152.6 3641.2 4606.1 5029.0 5791.5 7077.0 8521.6 9429.3<br />
US <strong>SMR</strong> Capacity Installed [All Manufac.] (Units) 0 0 0 0 0 0 0 2 6 11 18 0 24 32 36 46 50 58 71 85 94<br />
US <strong>SMR</strong>s Operating (Units) 0 0 0 0 0 0 0 2 8 19 37 37 61 93 129 175 225 283 354 439 533<br />
US <strong>SMR</strong> Capacity Installed [US Manfuc.] (MWe) 0.0 0.0 0.0 0.0 0.0 0.0 0.0 75.0 300.0 556.3 909.9 0.0 1218.4 1576.3 1820.6 2303.0 2514.5 2895.7 3538.5 4260.8 4714.6<br />
US <strong>SMR</strong> Capacity Installed [US Manfuc.] (Units) 0 0 0 0 0 0 0 1 3 6 9 0 12 16 18 23 25 29 35 43 47<br />
Inter. Total Nuclear Capacity Installed (MWe) #N/A 11357.0 12170.1 12983.2 13796.3 14609.4 15422.6 16235.7 17048.8 17861.9 18675.0 19488.2 20301.3 21114.4 21927.5 22740.6 23553.8 24366.9 25180.0 25993.1 26806.2<br />
Inter. <strong>SMR</strong> Capacity Installed [All Manufac.] (MWe) 0.0 0.0 0.0 0.0 730.5 1542.3 2435.4 3409.8 4465.5 5602.5 6820.9 8120.5 9501.5 10963.8 12507.4 14132.3 15838.5 17626.0 19494.8 20104.7<br />
Inter. <strong>SMR</strong> Capacity Installed [All Manufac.] (Units) 0 0 0 0 0 7 15 24 34 45 56 68 81 95 110 125 141 158 176 195 201<br />
Inter. <strong>SMR</strong> Capacity Installed [US Manufac.] (MWe) 0.0 0.0 0.0 0.0 146.1 308.5 487.1 682.0 893.1 1120.5 1364.2 1624.1 1900.3 2192.8 2501.5 2826.5 3167.7 3525.2 3899.0 4020.9<br />
Inter. <strong>SMR</strong> Capacity Installed [US Manufac.] (Units) 0 0 0 0 0 1 3 5 7 9 11 14 16 19 22 25 28 32 35 39 40<br />
Total <strong>SMR</strong>s Manufactured in the US (Units) 0 0 0 0 0 1 3 6 10 15 20 14 28 35 40 48 53 61 70 82 87<br />
51
Appendix B: Table <strong>of</strong> results for each type <strong>of</strong> economic impact, per year, impact for each scenario<br />
2010 2020<br />
Sales <strong>Economic</strong> <strong>Impacts</strong><br />
(dollars in Billions) 2010 2011 2012 2013 2014 2015 2016 2017 2018 2019 2020<br />
Low Nuclear Adoption Case $ -‐ $ -‐ $ -‐ $ -‐ $ -‐ $ -‐ $ 130.5 $ 130.5 $ 130.5 $ 261.0 $ 391.5<br />
Moderate Nuclear Adoption Case $ -‐ $ -‐ $ -‐ $ -‐ $ -‐ $ 130.5 $ 130.5 $ 261.0 $ 391.5 $ 652.4 $ 652.4<br />
High Nuclear Adoption Case $ -‐ $ -‐ $ -‐ $ -‐ $ -‐ $ 130.5 $ 130.5 $ 261.0 $ 521.9 $ 782.9 $ 1,043.9<br />
Disruptive Nuclear Adoption Case $ -‐ $ -‐ $ -‐ $ -‐ $ -‐ $ 130.5 $ 391.5 $ 782.9 $ 1,304.8 $ 1,957.3 $ 2,609.7<br />
Value-‐Added <strong>Economic</strong> <strong>Impacts</strong><br />
(dollars in Billions) 2010 2011 2012 2013 2014 2015 2016 2017 2018 2019 2020<br />
Low Nuclear Adoption Case $ -‐ $ -‐ $ -‐ $ -‐ $ -‐ $ -‐ $ 62.7 $ 62.7 $ 62.7 $ 125.4 $ 188.2<br />
Moderate Nuclear Adoption Case $ -‐ $ -‐ $ -‐ $ -‐ $ -‐ $ 62.7 $ 62.7 $ 125.4 $ 188.2 $ 313.6 $ 313.6<br />
High Nuclear Adoption Case $ -‐ $ -‐ $ -‐ $ -‐ $ -‐ $ 62.7 $ 62.7 $ 125.4 $ 250.9 $ 376.3 $ 501.7<br />
Disruptive Nuclear Adoption Case $ -‐ $ -‐ $ -‐ $ -‐ $ -‐ $ 62.7 $ 188.2 $ 376.3 $ 627.2 $ 940.8 $ 1,254.4<br />
Earnings (Payroll) <strong>Economic</strong> <strong>Impacts</strong><br />
(dollars in Billions) 2010 2011 2012 2013 2014 2015 2016 2017 2018 2019 2020<br />
Low Nuclear Adoption Case $ -‐ $ -‐ $ -‐ $ -‐ $ -‐ $ -‐ $ 40.5 $ 40.5 $ 40.5 $ 80.9 $ 121.4<br />
Moderate Nuclear Adoption Case $ -‐ $ -‐ $ -‐ $ -‐ $ -‐ $ 40.5 $ 40.5 $ 80.9 $ 121.4 $ 202.3 $ 202.3<br />
High Nuclear Adoption Case $ -‐ $ -‐ $ -‐ $ -‐ $ -‐ $ 40.5 $ 40.5 $ 80.9 $ 161.9 $ 242.8 $ 323.7<br />
Disruptive Nuclear Adoption Case $ -‐ $ -‐ $ -‐ $ -‐ $ -‐ $ 40.5 $ 121.4 $ 242.8 $ 404.6 $ 607.0 $ 809.3<br />
<strong>Employment</strong> <strong>Economic</strong> <strong>Impacts</strong> 2010 2011 2012 2013 2014 2015 2016 2017 2018 2019 2020<br />
Low Nuclear Adoption Case -‐ -‐ -‐ -‐ -‐ -‐ 6,925 6,925 6,925 13,849 20,774<br />
Moderate Nuclear Adoption Case -‐ -‐ -‐ -‐ -‐ 6,925 6,925 13,849 20,774 34,624 34,624<br />
High Nuclear Adoption Case -‐ -‐ -‐ -‐ -‐ 6,925 6,925 13,849 27,699 41,548 55,398<br />
Disruptive Nuclear Adoption Case -‐ -‐ -‐ -‐ -‐ 6,925 20,774 41,548 69,247 103,871 138,494<br />
Indirect Business Taxes <strong>Economic</strong><br />
<strong>Impacts</strong><br />
(dollars in Billions) 2010 2011 2012 2013 2014 2015 2016 2017 2018 2019 2020<br />
Low Nuclear Adoption Case $ -‐ $ -‐ $ -‐ $ -‐ $ -‐ $ -‐ $ 3.6 $ 3.6 $ 3.6 $ 7.2 $ 10.7<br />
Moderate Nuclear Adoption Case $ -‐ $ -‐ $ -‐ $ -‐ $ -‐ $ 3.6 $ 3.6 $ 7.2 $ 10.7 $ 17.9 $ 17.9<br />
High Nuclear Adoption Case $ -‐ $ -‐ $ -‐ $ -‐ $ -‐ $ 3.6 $ 3.6 $ 7.2 $ 14.3 $ 21.5 $ 28.6<br />
Disruptive Nuclear Adoption Case $ -‐ $ -‐ $ -‐ $ -‐ $ -‐ $ 3.6 $ 10.7 $ 21.5 $ 35.8 $ 53.6 $ 71.5<br />
52
Appendix B, continued:<br />
2021 2030<br />
Sales <strong>Economic</strong> <strong>Impacts</strong><br />
(dollars in Billions) 2021 2022 2023 2024 2025 2026 2027 2028 2029 2030<br />
Low Nuclear Adoption Case $ 261.0 $ 261.0 $ 261.0 $ 261.0 $ 261.0 $ 261.0 $ 391.5 $ 391.5 $ 521.9 $ 391.5<br />
Moderate Nuclear Adoption Case $ 913.4 $ 1,043.9 $ 1,435.3 $ 1,696.3 $ 2,087.7 $ 2,348.7 $ 2,740.2 $ 3,131.6 $ 3,653.6 $ 4,045.0<br />
High Nuclear Adoption Case $ 652.4 $ 1,435.3 $ 1,826.8 $ 2,087.7 $ 2,479.2 $ 2,740.2 $ 3,262.1 $ 3,653.6 $ 4,306.0 $ 4,827.9<br />
Disruptive Nuclear Adoption Case $ 1,826.8 $ 3,653.6 $ 4,566.9 $ 5,219.4 $ 6,263.2 $ 6,915.7 $ 7,959.5 $ 9,133.9 $ 10,699.7 $ 11,352.1<br />
Value-‐Added <strong>Economic</strong> <strong>Impacts</strong><br />
(dollars in Billions) 2021 2022 2023 2024 2025 2026 2027 2028 2029 2030<br />
Low Nuclear Adoption Case $ 125.4 $ 125.4 $ 125.4 $ 125.4 $ 125.4 $ 125.4 $ 188.2 $ 188.2 $ 250.9 $ 188.2<br />
Moderate Nuclear Adoption Case $ 439.0 $ 501.7 $ 689.9 $ 815.3 $ 1,003.5 $ 1,128.9 $ 1,317.1 $ 1,505.2 $ 1,756.1 $ 1,944.3<br />
High Nuclear Adoption Case $ 313.6 $ 689.9 $ 878.0 $ 1,003.5 $ 1,191.6 $ 1,317.1 $ 1,567.9 $ 1,756.1 $ 2,069.7 $ 2,320.6<br />
Disruptive Nuclear Adoption Case $ 878.0 $ 1,756.1 $ 2,195.1 $ 2,508.7 $ 3,010.5 $ 3,324.0 $ 3,825.8 $ 4,390.2 $ 5,142.9 $ 5,456.5<br />
Earnings (Payroll) <strong>Economic</strong> <strong>Impacts</strong><br />
(dollars in Billions)<br />
2021 2022 2023 2024 2025 2026 2027 2028 2029 2030<br />
Low Nuclear Adoption Case $ 80.9 $ 80.9 $ 80.9 $ 80.9 $ 80.9 $ 80.9 $ 121.4 $ 121.4 $ 161.9 $ 121.4<br />
Moderate Nuclear Adoption Case $ 283.2 $ 323.7 $ 445.1 $ 526.0 $ 647.4 $ 728.3 $ 849.7 $ 971.1 $ 1,133.0 $ 1,254.4<br />
High Nuclear Adoption Case $ 202.3 $ 445.1 $ 566.5 $ 647.4 $ 768.8 $ 849.7 $ 1,011.6 $ 1,133.0 $ 1,335.3 $ 1,497.1<br />
Disruptive Nuclear Adoption Case $ 566.5 $ 1,133.0 $ 1,416.2 $ 1,618.5 $ 1,942.2 $ 2,144.6 $ 2,468.3 $ 2,832.4 $ 3,318.0 $ 3,520.3<br />
<strong>Employment</strong> <strong>Economic</strong> <strong>Impacts</strong> 2021 2022 2023 2024 2025 2026 2027 2028 2029 2030<br />
Low Nuclear Adoption Case 13,849 13,849 13,849 13,849 13,849 13,849 20,774 20,774 27,699 20,774<br />
Moderate Nuclear Adoption Case 48,473 55,398 76,172 90,021 110,795 124,645 145,419 166,193 193,892 214,666<br />
High Nuclear Adoption Case 34,624 76,172 96,946 110,795 131,570 145,419 173,118 193,892 228,516 256,214<br />
Disruptive Nuclear Adoption Case 96,946 193,892 242,365 276,989 332,386 367,010 422,408 484,730 567,827 602,450<br />
Indirect Business Taxes <strong>Economic</strong><br />
<strong>Impacts</strong><br />
(dollars in Billions) 2021 2022 2023 2024 2025 2026 2027 2028 2029 2030<br />
Low Nuclear Adoption Case $ 7.2 $ 7.2 $ 7.2 $ 7.2 $ 7.2 $ 7.2 $ 10.7 $ 10.7 $ 14.3 $ 10.7<br />
Moderate Nuclear Adoption Case $ 25.0 $ 28.6 $ 39.3 $ 46.5 $ 57.2 $ 64.4 $ 75.1 $ 85.8 $ 100.1 $ 110.8<br />
High Nuclear Adoption Case $ 17.9 $ 39.3 $ 50.1 $ 57.2 $ 67.9 $ 75.1 $ 89.4 $ 100.1 $ 118.0 $ 132.3<br />
Disruptive Nuclear Adoption Case $ 50.1 $ 100.1 $ 125.1 $ 143.0 $ 171.6 $ 189.5 $ 218.1 $ 250.3 $ 293.2 $ 311.1<br />
53
Appendix C: Projected <strong>Economic</strong> <strong>Impacts</strong> <strong>of</strong> <strong>SMR</strong> Manufacturing <strong>and</strong> Construction <strong>of</strong> <strong>SMR</strong>s in Year<br />
2030<br />
Scenario<br />
Sales <strong>Economic</strong> <strong>Impacts</strong><br />
Low Nuclear Adoption Case $ 3,914,523,909<br />
Moderate Nuclear Adoption Case $ 40,450,080,396<br />
High Nuclear Adoption Case $ 48,279,128,214<br />
Disruptive Nuclear Adoption Case $ 113,521,193,369<br />
Scenario<br />
Value-‐Added <strong>Economic</strong> <strong>Impacts</strong><br />
Low Nuclear Adoption Case $ 1,881,534,775<br />
Moderate Nuclear Adoption Case $ 19,442,526,011<br />
High Nuclear Adoption Case $ 23,205,595,561<br />
Disruptive Nuclear Adoption Case $ 54,564,508,481<br />
Scenario<br />
Earnings (Payroll) <strong>Economic</strong> <strong>Impacts</strong><br />
Low Nuclear Adoption Case $ 1,213,904,459<br />
Moderate Nuclear Adoption Case $ 12,543,679,408<br />
High Nuclear Adoption Case $ 14,971,488,326<br />
Disruptive Nuclear Adoption Case $ 35,203,229,307<br />
Scenario<br />
<strong>Employment</strong> <strong>Economic</strong> <strong>Impacts</strong><br />
Low Nuclear Adoption Case 20,774<br />
Moderate Nuclear Adoption Case 214,666<br />
High Nuclear Adoption Case 256,214<br />
Disruptive Nuclear Adoption Case 602,450<br />
Scenario<br />
Indirect Business Taxes <strong>Economic</strong> <strong>Impacts</strong><br />
Low Nuclear Adoption Case $ 107,261,435<br />
Moderate Nuclear Adoption Case $ 1,108,368,157<br />
High Nuclear Adoption Case $ 1,322,891,026<br />
Disruptive Nuclear Adoption Case $ 3,110,581,602<br />
54
Appendix D: Projected <strong>Economic</strong> <strong>Impacts</strong> <strong>of</strong> Cumulative Operations <strong>of</strong> <strong>SMR</strong>s in Year 2030<br />
<strong>Economic</strong> Impact Projections Year 2030<br />
Scenario<br />
Sales<br />
Low Nuclear Adoption Case $ 1,927,975,993<br />
Moderate Nuclear Adoption Case $ 14,995,368,837<br />
High Nuclear Adoption Case $ 23,028,602,142<br />
Disruptive Nuclear Adoption Case $ 57,089,511,358<br />
Scenario<br />
Value-‐Added<br />
Low Nuclear Adoption Case $ 1,229,395,516<br />
Moderate Nuclear Adoption Case $ 9,561,965,126<br />
High Nuclear Adoption Case $ 14,684,446,444<br />
Disruptive Nuclear Adoption Case $ 36,403,767,231<br />
Scenario<br />
Earnings/Payroll<br />
Low Nuclear Adoption Case $ 499,181,990<br />
Moderate Nuclear Adoption Case $ 3,882,526,592<br />
High Nuclear Adoption Case $ 5,962,451,552<br />
Disruptive Nuclear Adoption Case $ 14,781,333,381<br />
Scenario<br />
<strong>Employment</strong><br />
Low Nuclear Adoption Case $ 6,739<br />
Moderate Nuclear Adoption Case $ 52,413<br />
High Nuclear Adoption Case $ 80,491<br />
Disruptive Nuclear Adoption Case 199,543<br />
Scenario<br />
Indirect Business Taxes<br />
Low Nuclear Adoption Case $ 164,305,314<br />
Moderate Nuclear Adoption Case $ 1,277,930,221<br />
High Nuclear Adoption Case $ 1,962,535,696<br />
Disruptive Nuclear Adoption Case $ 4,865,262,911<br />
55