B02 Coulton - GeoTools - NOAA
B02 Coulton - GeoTools - NOAA
B02 Coulton - GeoTools - NOAA
- No tags were found...

You also want an ePaper? Increase the reach of your titles
YUMPU automatically turns print PDFs into web optimized ePapers that Google loves.
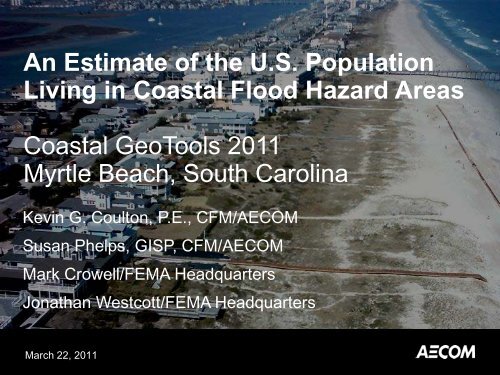
An Estimate of the U.S. Population<br />
Living in Coastal Flood Hazard Areas<br />
Coastal <strong>GeoTools</strong> 2011<br />
Myrtle Beach, South Carolina<br />
Kevin G. <strong>Coulton</strong>, P.E., CFM/AECOM<br />
Susan Phelps, GISP, CFM/AECOM<br />
Mark Crowell/FEMA Headquarters<br />
Jonathan Westcott/FEMA Headquarters<br />
March 22, 2011
Agenda<br />
Goals and Objectives<br />
Key Definitions<br />
Study Approach<br />
Results<br />
March 31, 2011 Page 2
Goals and Objectives<br />
• The primary goal of the study was to provide useful<br />
information to FEMA that can be used to support future<br />
decisions about identifying, mapping, and managing<br />
Coastal AE Zones and shaded X Zones through the NFIP.<br />
• The primary objectives of the study were to:<br />
– Respond to a 2006 NFIP evaluation comment that FEMA begin to<br />
delineate Coastal AE Zones.<br />
– Prepare datasets useful for an eventual response to GAO<br />
recommendations to evaluate long-term fiscal implications of climate<br />
change on the NFIP.<br />
– Estimate population and housing demographics and NFIP claims<br />
and policy distributions in “coastal” flood hazard zones.<br />
March 31, 2011 Page 3
Key Definitions – FEMA Flood Hazard Zones<br />
• The land area covered by the floodwaters of the base flood<br />
(1.0% annual chance [100-yr] flood) is the Special Flood<br />
Hazard Area (SFHA) on NFIP maps.<br />
• The SFHA is the area where the NFIP's floodplain<br />
management regulations must be enforced and the area<br />
where the mandatory purchase of flood insurance applies.<br />
• The SFHA includes A and V Zones (A, AO, AH, VE, and V).<br />
• Current FEMA regulations do not distinguish between<br />
riverine and coastal A Zones.<br />
• The 0.2% annual chance [500-yr] flood zone, the shaded X<br />
Zone, is not a SFHA and is delineated by the inland extent<br />
of the 0.2% annual chance stillwater elevation.<br />
March 31, 2011 Page 4
Key Definitions – Flood Hazard Mapping Along<br />
Coastlines<br />
• Flood hazard zones<br />
along coastlines<br />
can be attributed to<br />
“pure” coastal flood<br />
sources; e.g., storm<br />
surge, wave runup.<br />
• However, zones at<br />
river confluences<br />
are a combination<br />
of coastal and<br />
fluvial flood<br />
sources.<br />
March 31, 2011 Page 5
Key Definitions – Flood Hazard Mapping at River<br />
Confluences<br />
(Note: The proposed limits in Figure 4-2 neglect any potential effects of vegetation and obstructions, and reflect the maximum inland extent of wave action effects.)<br />
March 31, 2011 Page 6
Key Definitions – Census Block Groups/Coastlines<br />
< Shaded census block groups<br />
are adjacent to open coast or<br />
sheltered waters or contain V/VE<br />
Zones.)<br />
Coastlines were delineated along the ><br />
seaward edges of census block group<br />
boundaries and where census block<br />
group boundaries join across <strong>NOAA</strong>defined<br />
water boundaries.<br />
March 31, 2011 Page 7
Study Approach<br />
The estimation of the population located in coastal flood<br />
zones followed a three step procedure:<br />
– Step1 - Create a national database by compiling the best available<br />
coastal-proximate digital flood hazard data showing the location and<br />
extent of coastal and riverine SFHAs.<br />
– Step 2 - Develop a systematic method to separate the coastal and<br />
riverine AE and shaded X Zones and delineate this new boundary line<br />
onto the digital flood hazard database.<br />
– Step 3 - Combine 2000 census data with the national digital flood<br />
hazard database and the VE Zone and coastal AE and shaded X<br />
Zone areas using a Geographic Information System.<br />
March 31, 2011 Page 8
Step 1: Digital Base Data Compilation<br />
Three digital data sources were used to compile the base<br />
coastal dataset used for this analysis:<br />
– National Flood Hazard Layer (NFHL) data.<br />
– Q3/First American - Effective flood zone data scanned from hardcopy<br />
flood maps<br />
– National Elevation Data (NED) Terrain Data combined with estimates<br />
of 1.0% and 0.2% annual chance stillwater elevations. The stillwater<br />
elevation is defined by FEMA as the surface of the water resulting<br />
from astronomical tides, storm surge, and freshwater inputs, but<br />
excluding wave setup contributions<br />
March 31, 2011 Page 9
Approximated Flood Zones<br />
• NED Terrain Data combined<br />
with estimates of 1.0% and<br />
0.2% annual chance<br />
stillwater elevations.<br />
• Stillwater elevations<br />
obtained from FIS reports<br />
and DFIRM datasets.<br />
• Datum conversions done<br />
using on-line tools.<br />
• For the Great Lakes, IGLD55<br />
> IGLD85 > NAVD88; for all<br />
other coasts, NGVD29 ><br />
NAVD88, as necessary.<br />
March 31, 2011 Page 10
Step 1: Digital Base Data Compilation<br />
• Update function in<br />
ArcGIS toolbox utilized to<br />
combine 3 flood zone<br />
layers<br />
– First update process run to<br />
replace effective flood zone<br />
data with NFHL<br />
– Second update process run for<br />
inclusion of NED/stillwater<br />
flood zones<br />
March 31, 2011 Page 11
Summary of Flood Zone Source Data by Coastal County<br />
March 31, 2011 Page 12
Step 2: Riverine and Coastal AE and Shaded X Zone<br />
Separation<br />
• The AE and shaded X Zones were<br />
manually separated into riverine and<br />
coastal portions based on the<br />
available data.<br />
Data Source Separation Location Comment<br />
NFHL Data First riverine BFE Most definitive method<br />
Q3Data<br />
Q3Data<br />
Q3 Data<br />
NED Terrain Data<br />
At downstream limit of floodway (used<br />
infrequently)<br />
At transition from AE to A Zone (used<br />
infrequently)<br />
At point where the Zone A/AE floodplain<br />
begins to widen in upstream direction<br />
(used infrequently)<br />
At point where SWEL minus 1-ft polygon<br />
edge crosses streams<br />
No BFEs available in Q3 data<br />
Use if no Q3 floodways exist;<br />
assumes A Zones are riverine<br />
Use if no Q3 floodways or AE to<br />
A Zone transitions exist<br />
Use if no Q3 or NFHL data are<br />
available<br />
(Separation occurs at most downstream BFE in NFHL datasets.)<br />
March 31, 2011 Page 13
Step 2: Riverine and Coastal AE and Shaded X Zone<br />
Separation<br />
The riverine-coastal separation line<br />
generally defines “coastal” land<br />
area; Coastal AE and shaded X<br />
Zones may make up a large or<br />
small portion of this area.<br />
March 31, 2011 Page 15
Step 2: Riverine and Coastal AE and Shaded X Zone<br />
Separation<br />
Example of<br />
resulting<br />
Coastal AE<br />
Zones (dark<br />
green) and<br />
riverine AE<br />
Zones (light<br />
green).<br />
March 31, 2011 Page 16
Step 2: Riverine and Coastal AE and Shaded X Zone<br />
Separation<br />
March 31, 2011 Page 17
Step 3: Tallying Coastal Population<br />
• Once coastal AE and shaded X Zones were separated from<br />
riverine AE Zones, the zones seaward of this separation<br />
line were classified as “coastal flood hazard zones”,<br />
consisting of coastal AE Zones and VE Zones, as well as<br />
coastal shaded X zones.<br />
• The union tool in ArcGIS Toolbox was used to spatially<br />
combine the coastal flood hazard areas with census block<br />
groups (CBGs).<br />
March 31, 2011 Page 18
Step 3: Tallying Coastal Population<br />
• Square mile area calculations from the GIS unions provided<br />
estimates of the portion of each census block group located<br />
within the coastal flood hazard zones.<br />
• Census block group populations were assumed to be<br />
uniformly distributed across each block group and the<br />
population within a coastal flood zone was estimated in a<br />
spreadsheet calculation by multiplying the block group<br />
population per square mile by the square mile area of the<br />
coastal flood zone.<br />
March 31, 2011 Page 19
Results – “Coastal” Counties<br />
(Counties with VE Zones, Coastal AE, and/or Coastal<br />
Shaded X Zones)<br />
March 31, 2011 Page 20
Results – National Population Summary by Coastline<br />
March 31, 2011 Page 21
Results – National Demographics Summary by Coastline<br />
GEOGRAPHY<br />
ALL COASTAL A, V and SHADED X ZONES<br />
COAST<br />
2000 POPULATION<br />
2000 HOUSING UNITS<br />
AREA (SQ MI)<br />
POLICIES-IN-FORCE<br />
(2009)<br />
ATLANTIC 6,244,102 3,005,855 12,224 1,002,016<br />
ATLANTIC TERRITORIES 186,387 80,354 104 6,502<br />
GULF 3,314,342 1,193,618 18,536 769,421<br />
PACIFIC 537,929 257,385 22,213 34,910<br />
PACIFIC TERRITORIES 20,017 5,279 77 NA<br />
GREAT LAKES 163,614 82,111 622 9,989<br />
Coastal Totals (U.S. Only) 10,259,987 4,538,969 53,595 1,816,336<br />
Coastal Totals (U.S. and Territories) 10,466,391 4,624,602 53,776 1,822,838<br />
National Totals (U.S. Only) 281,421,899 115,903,837 3,594,434 4,374,134<br />
National Totals (U.S. and Territories) 285,643,295 117,458,300 3,598,458 4,427,625<br />
% Coastal (U.S. Only) 3.6% 3.9% 1.5% 41.5%<br />
% Coastal (U.S. and Territories) 3.7% 3.9% 1.5% 41.2%<br />
March 31, 2011 Page 22
Results – National Summary by<br />
Individual Coastal Flood Hazard Zones<br />
• There is an estimated total population of 2,089,000 in<br />
coastal shaded X Zones compared to 7,760,000 and<br />
617,000 in coastal SFHAs (coastal A and V Zones),<br />
respectively.<br />
• There is an estimated total of 891,000 housing units in<br />
coastal shaded X Zones compared to 3,392,000 and<br />
342,000 housing units in coastal SFHAs (coastal A and V<br />
Zones), respectively.<br />
• There is an estimated total of 6,400 square miles of<br />
coastline in coastal shaded X Zones compared to 38,900<br />
and 8,500 square miles for coastal SFHAs (coastal A and V<br />
Zones), respectively.<br />
March 31, 2011 Page 23
Results – National Summary by<br />
Combined Flood Hazard Zones Coastal vs. Riverine<br />
GEOGRAPHY<br />
2000 POPULATION<br />
2000 HOUSING UNITS<br />
AREA (SQ MI)<br />
POLICIES-IN-FORCE<br />
(2009)<br />
CUMULATIVE CLAIMS (AS<br />
OF DEC. 31, 2009)<br />
COASTAL A, V AND SHADED X ZONES 10,466,391 4,624,602 53,776 1,822,838 783,940<br />
COASTAL AND RIVERINE A, V AND<br />
SHADED X ZONES 40,069,607 17,000,002 258,681 2,450,204 920,620<br />
% OF TOTAL A, V AND SHADED X ZONE<br />
DEMOGRAPHICS OCCURING IN COASTAL<br />
AREAS 26% 27% 21% 74% 85%<br />
March 31, 2011 Page 24
Data Limitations and Accuracy of the Results<br />
• Absence of Mapped Shaded X Zones<br />
– There is not a consistently mapped transition from a 1.0% to 0.2%<br />
annual-chance flood hazard along all coastlines; i.e., shaded X<br />
Zones are not immediately inland of AE and VE Zones in all coastal<br />
areas.<br />
– The 1.0% surge or runup/overtopping may extend inland over the<br />
0.2% SWEL inland limit.<br />
– PFD VE Zones may extend inland over the 0.2% SWEL inland limit.<br />
– The shaded X Zones may not be mapped due to map scale<br />
limitations.<br />
– The FIS may have been limited to a study of the 1.0% annual chance<br />
flood and the 0.2% annual chance flood was not studied.<br />
March 31, 2011 Page 25
Data Limitations and Accuracy of the Results<br />
• Flood Zone Data Limitations<br />
– Flood zone data truly represent “snapshots” in time; for this study the<br />
flood zone data were not all derived at the same point in time nor<br />
with similar methods and this imposes limitations on the use of the<br />
data.<br />
– Much of the flood zone GIS data provided for use in this study<br />
contains inherent topological errors, such as gaps in the flood zones.<br />
QC efforts were focused on finding and removing overlapping<br />
polygons and large gaps in the data.<br />
– The highest quality flood zone data are represented by the more<br />
recent effective Digital Flood Insurance Rate Map (DFIRM) data,<br />
archived in the National Flood Hazard Layer (NFHL) and preliminary<br />
DFIRM data, those data not yet archived in the NFHL.<br />
March 31, 2011 Page 26
Data Use in <strong>NOAA</strong> Products<br />
<strong>NOAA</strong> Coastal County Snapshots – Charleston, SC<br />
March 31, 2011 Page 28
Thank You!<br />
Questions<br />
Kevin.<strong>Coulton</strong>@aecom.com<br />
March 22, 2011