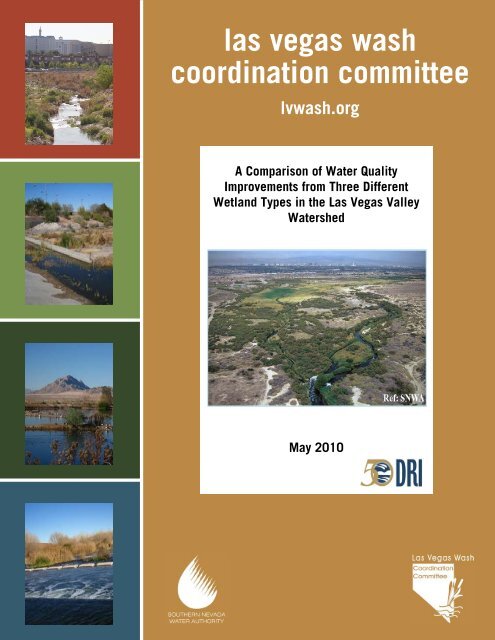
A Comparison of Water Quality Improvements from Three Different ...
A Comparison of Water Quality Improvements from Three Different ...
A Comparison of Water Quality Improvements from Three Different ...
- No tags were found...

Create successful ePaper yourself
Turn your PDF publications into a flip-book with our unique Google optimized e-Paper software.
snap<br />
las vegas wash<br />
coordination committee<br />
lvwash.org<br />
A <strong>Comparison</strong> <strong>of</strong> <strong>Water</strong> <strong>Quality</strong><br />
<strong>Improvements</strong> <strong>from</strong> <strong>Three</strong> <strong>Different</strong><br />
Wetland Types in the Las Vegas Valley<br />
<strong>Water</strong>shed<br />
May 2010
A <strong>Comparison</strong> <strong>of</strong> <strong>Water</strong> <strong>Quality</strong> <strong>Improvements</strong> <strong>from</strong> <strong>Three</strong><br />
<strong>Different</strong> Wetland Types in the Las Vegas Valley <strong>Water</strong>shed<br />
Prepared For:<br />
Southern Nevada <strong>Water</strong> Authority<br />
Las Vegas Wash Project Coordination Team<br />
100 City Parkway, Suite 700<br />
Las Vegas, Nevada 89106<br />
Prepared By:<br />
Kumud Acharya, Ph.D. and Achyut Adhikari<br />
Desert Research Institute<br />
755 East Flamingo Road<br />
Las Vegas, Nevada 89119<br />
May 2010
ABSTRACT<br />
Increased run<strong>of</strong>f associated with rapid growth in the Las Vegas Valley has led to creation <strong>of</strong><br />
unique wetlands systems in Southern Nevada with abundance <strong>of</strong> biological diversity.<br />
Constructed and naturally created wetlands in the Las Vegas Valley watershed were studied to<br />
characterize and understand their potential role for pollutant removal <strong>from</strong> the system. Metals<br />
and nutrient dynamics study <strong>of</strong> the local plants, i.e., cattails and bulrushes were conducted to<br />
characterize their function in the local environment in four wetlands located in the Las Vegas<br />
Wash, Flamingo Wash, Demonstration Wetland at the City <strong>of</strong> Henderson <strong>Water</strong> Reclamation<br />
Facility and Pittman Wash Pilot Wetlands. The results suggest that nutrient uptake by plant<br />
tissue was dependent on the ambient nutrient concentrations in both the water column as well as<br />
sediments <strong>of</strong> specific wetlands, irrespective <strong>of</strong> the type <strong>of</strong> plants present. Nutrients in above and<br />
below ground plant tissues showed that removal <strong>of</strong> the root systems would be necessary for<br />
maximum phosphorus removal, whereas for nitrogen above-ground harvest would be sufficient.<br />
As for metalloids, bulrush species seem particularly more efficient, especially for arsenic and<br />
selenium, compared to cattails. Similar to phosphorus, below-ground plants had more metals per<br />
unit weight than above-ground parts for both species in our study. These findings have<br />
important implications for improving our ability to engineer ecological solutions to problems<br />
associated with nutrient-rich wastewater and to implement sustainable wetland management<br />
plans.<br />
Assessment and Monitoring <strong>of</strong> Wetlands<br />
ii
ACKNOWLEDGEMENTS<br />
This project was funded by the Southern Nevada <strong>Water</strong> Authority (SNWA), Las Vegas, Nevada,<br />
with a grant <strong>from</strong> the Bureau <strong>of</strong> Reclamation dedicated to Las Vegas Wash Coordination<br />
Committee activities. We thank Seth Shanahan, Xiaoping Zhou, Debbie Van Dooremolen, and<br />
Carol Lane with SNWA for providing water quality data, generous help during sample<br />
collection, and comments on this document. Finally, we would like to thank Tom Collela,<br />
Marisa Masles, and Cathy Kochert <strong>of</strong> the Goldwater Environmental Laboratory, Arizona State<br />
University, Mary Miller <strong>of</strong> <strong>Water</strong> <strong>Quality</strong> Laboratory, and Desert Research Institute, Reno, for<br />
their help in sample analysis.<br />
Assessment and Monitoring <strong>of</strong> Wetlands<br />
iii
A <strong>Comparison</strong> <strong>of</strong> <strong>Water</strong> <strong>Quality</strong> <strong>Improvements</strong> <strong>from</strong> <strong>Three</strong><br />
<strong>Different</strong> Wetland Types in the Las Vegas Valley <strong>Water</strong>shed<br />
Table <strong>of</strong> Contents<br />
Page No.<br />
Abstract........................................................................................................................................... ii<br />
Acknowledgements........................................................................................................................iii<br />
Table <strong>of</strong> Contents........................................................................................................................... iv<br />
List <strong>of</strong> Tables .................................................................................................................................. v<br />
List <strong>of</strong> Figures................................................................................................................................. v<br />
List <strong>of</strong> Appendices .......................................................................................................................viii<br />
1.0 INTRODUCTION................................................................................................................... 1<br />
2.0 MATERIALS AND METHODS ........................................................................................... 3<br />
2.1 Site Description .............................................................................................................. 3<br />
2.2 Sampling and Analysis .................................................................................................. 7<br />
2.2.1 <strong>Water</strong>................................................................................................................... 7<br />
2.2.2 Sediment.............................................................................................................. 8<br />
2.2.3 Plant .................................................................................................................... 8<br />
2.3 Statistical Analysis ......................................................................................................... 8<br />
3.0 RESULTS ................................................................................................................................9<br />
3.1 Plant Biomass ................................................................................................................. 9<br />
3.2 Nutrients ......................................................................................................................... 9<br />
3.2.1 Phosphorus (P) ................................................................................................. 10<br />
3.2.2 Nitrogen (N)...................................................................................................... 10<br />
3.2.3 Metals................................................................................................................ 14<br />
3.2.4 Treatment Performance .................................................................................. 18<br />
3.3 Temporal Variation (Nutrients and Metals) ............................................................. 22<br />
4.0 DISCUSSION ........................................................................................................................ 25<br />
4.1 Plant Biomass ............................................................................................................... 25<br />
4.2 Plant Nutrients ............................................................................................................. 26<br />
4.3 Nutrient Removal Among Wetland Types ................................................................ 27<br />
Assessment and Monitoring <strong>of</strong> Wetlands<br />
iv
Page No.<br />
4.4 Metals............................................................................................................................ 29<br />
4.5 Temporal Variation (Nutrients and Metals) ............................................................. 32<br />
4.6 Ecosystem Function <strong>of</strong> Wetlands................................................................................ 32<br />
5.0 CONCLUSION ..................................................................................................................... 33<br />
6.0 LITERATURE CITED ........................................................................................................ 35<br />
List <strong>of</strong> Tables<br />
Table 1. Locations <strong>of</strong> the four wetland sites in the Valley ...................................................... 5<br />
Table 2. Average biomass and nutrient storage <strong>of</strong> individual plants (Typha domingensis and<br />
Schoenoplectus spp.) at the four wetland sites. Two digits after a ± indicate<br />
Table 3.<br />
standard errors............................................................................................................ 9<br />
Average annual trace metal concentrations in sediments at the four wetland sites.<br />
Two digits after a ± indicate standard errors .......................................................... 15<br />
Table 4.<br />
Average annual trace metal concentrations in individual plants (Typha domingensis<br />
and Schoenoplectus spp.) at the four wetland sites. Two digits after a ± indicate<br />
standard errors. DL = less than detection limit. Detection limits for each element<br />
are based on DL <strong>of</strong> ICP-MS manufacturers............................................................. 15<br />
List <strong>of</strong> Figures<br />
Figure 1. Map showing different wetlands sites located within the Las Vegas Valley <strong>Water</strong>shed<br />
- FW: Flamingo Wash, PW: Pitman Wash Pilot Wetlands, HD: Demonstration<br />
Wetland at the City <strong>of</strong> Henderson <strong>Water</strong> Reclamation Facility, and LVW: Las Vegas<br />
Wash (adapted <strong>from</strong> Reginato and Piechota, 2004)...................................................... 4<br />
Figure 2. LVW showing inlet and outlet sampling locations for sediment and water sampling<br />
(Zhou et al., 2009)......................................................................................................... 5<br />
Figure 3. FW showing inlet and outlet sampling locations for sediment and water sampling .... 6<br />
Assessment and Monitoring <strong>of</strong> Wetlands<br />
v
Page No.<br />
Figure 4. PW showing inlet and outlet sampling locations for sediment and water sampling<br />
(LVWCC, 2009) ........................................................................................................... 6<br />
Figure 5. HD showing inlet and outlet locations for sediment and water sampling (Zhou and<br />
VanDooremolen, 2007)................................................................................................. 7<br />
Figure 6. Average annual total phosphorus concentrations in (A) plants (Typha domingensis<br />
and Schoenoplectus spp.), (B) sediments, and (C) water at the four wetland sites.<br />
Error bars represent standard errors............................................................................ 11<br />
Figure 7. Average annual (A) total phosphorus, and (B) total nitrogen concentrations in shoot<br />
and root parts <strong>of</strong> plant tissues (Typha domingensis and Schoenoplectus spp.) at the<br />
four wetland sites. Error bars represent standard errors ............................................ 12<br />
Figure 8. Average annual total phosphorus concentration in sediments at inlets and outlets <strong>of</strong><br />
the four wetland sites. Error bars represent standard errors....................................... 12<br />
Figure 9. Average annual total nitrogen concentrations in: (A) plants (Typha domingensis and<br />
Schoenoplectus spp.), (B) sediments, and (C) water at the four wetland sites. Error<br />
bars represent standard errors ..................................................................................... 13<br />
Figure 10. Annual average total nitrogen concentrations <strong>of</strong> sediment at inlets and outlets <strong>of</strong> the<br />
four wetland sites. Error bars represent standard errors ............................................ 14<br />
Figure 11. Average annual (A) Arsenic and (B) Selenium concentrations in plants (Typha<br />
domingensis and Schoenoplectus spp.) at the four wetland sites. Error bars represent<br />
standard errors............................................................................................................. 16<br />
Figure 12. Average annual arsenic concentrations in: (A) plants (Typha domingensis and<br />
Schoenoplectus spp.), (B) sediments, and (C) water at the four wetland sites. Error<br />
bars represent standard errors ..................................................................................... 17<br />
Figure 13. Average annual sediment arsenic concentrations at the inlets and outlets <strong>of</strong> the four<br />
wetland sites. Error bars represent standard errors .................................................... 18<br />
Figure 14. Average annual selenium concentrations in (A) plants (Typha domingensis and<br />
Schoenoplectus spp.), (B) sediments, and (C) water at the four wetland sites. Error<br />
bars represent standard errors ..................................................................................... 19<br />
Assessment and Monitoring <strong>of</strong> Wetlands<br />
vi
Page No.<br />
Figure 15. Annual average selenium concentrations <strong>of</strong> sediment at the inlets and outlets <strong>of</strong> the<br />
four wetland sites. Error bars represent standard errors ............................................ 20<br />
Figure 16. Overall correlations between annual average plant tissue and sediment total<br />
phosphorus concentrations (TP%) in the four wetland sites. The line shown is a least<br />
square linear regression............................................................................................... 20<br />
Figure 17. Overall correlations between annual average plant tissue (TP%) and water column<br />
(mg/L) total phosphorus concentrations in the four wetland sites. The line shown is a<br />
least square linear regression ...................................................................................... 21<br />
Figure 18. Overall correlations between annual average plant tissue (μg/g) and water column<br />
(μg/L) arsenic concentrations in the four wetland sites. The line shown is a least<br />
square linear regression............................................................................................... 21<br />
Figure 19. Overall correlations between annual average plant tissue and sediment arsenic<br />
concentrations (μg/g) in the four wetland sites. The line shown is a least square linear<br />
regression .................................................................................................................... 22<br />
Figure 20. Overall correlations between annual average plant tissue (μg/g) and water column<br />
(μg/L) in the four wetland sites. The line shown is a least square linear regression .. 22<br />
Figure 21. Average seasonal total phosphorus concentrations in plants (Typha domingensis and<br />
Schoenoplectus spp.) at the four wetland sites. Error bars represent standard errors. 23<br />
Figure 22. Average seasonal total nitrogen concentrations in plants (Typha domingensis and<br />
Schoenoplectus spp.) at the four wetland sites. Error bars represent standard errors. 24<br />
Figure 23. Average seasonal total arsenic concentrations in plants (Typha domingensis and<br />
Schoenoplectus spp.) at the four wetland sites. Error bars represent standard errors. 24<br />
Figure 24. Average seasonal selenium concentrations in plants (Typha domingensis and<br />
Schoenoplectus spp.) at the four wetland sites. Error bars represent standard errors 25<br />
Figure 25. General relationships between plant biomass and nutrient concentrations in the water<br />
column and soil surface (Reddy and DeBusk, 1987).................................................. 27<br />
Assessment and Monitoring <strong>of</strong> Wetlands<br />
vii
List <strong>of</strong> Appendices<br />
Appendix A<br />
Appendix B<br />
Appendix C<br />
Appendix D<br />
Appendix E<br />
Appendix F<br />
Photographs showing (a) sample collection, processing, and analysis, and (b)<br />
plant types found at four wetland sites<br />
Total phosphorus data <strong>from</strong> plant tissues, water columns, and sediments at four<br />
wetland sites<br />
Total nitrogen data <strong>from</strong> plant tissues, water column, and sediment at four<br />
wetland sites<br />
Arsenic data <strong>from</strong> plant tissues, water column, and sediment at four wetland sites<br />
Selenium data <strong>from</strong> plant tissues, water column, and sediment at four wetland<br />
sites<br />
Plant tissue nutrient concentration <strong>from</strong> fall 2008 samplings <strong>from</strong> four wetland<br />
sites<br />
Assessment and Monitoring <strong>of</strong> Wetlands<br />
viii
1.0 INTRODUCTION<br />
Wetlands have a higher rate <strong>of</strong> biological activity than most ecosystems; they can transform<br />
many <strong>of</strong> the common pollutants that occur in conventional wastewater into harmless byproducts<br />
or essential nutrients that can be used for additional biological productivity (Kadlec, 1998).<br />
Wetlands with a variety <strong>of</strong> hydrologic, vegetation, and soil conditions can occur naturally or be<br />
constructed in many landscape positions (Kadlec and Wallace, 2009). Wetlands are <strong>of</strong>ten highly<br />
productive systems where numerous biological transformations are taking place, driven by the<br />
natural energies <strong>of</strong> the sun, soil, wind, and by microorganisms, plants, and animals (Thullen et<br />
al., 2005 and the references therein). These biological transformations can sometimes provide an<br />
effective means to convert, release to the atmosphere, or sequester unwanted and excess<br />
chemicals <strong>from</strong> the system. The use <strong>of</strong> constructed wetlands for wastewater treatment has been<br />
tested widely in recent years, especially to reduce nitrogen and phosphorus loads (Vymazal,<br />
2007). It has been found that the performance efficiencies <strong>of</strong> constructed or natural wetlands<br />
depend on several variables, such as the quality and quantity <strong>of</strong> effluent to be treated, and<br />
biological, physical, and chemical activities in that particular wetlands system (Greenway and<br />
Woolley, 2001; Greenway, 2003).<br />
Until recently, nitrogen and phosphorus used to be the main nutrients <strong>of</strong> concern in wetland<br />
systems, with their concentrations varying depending on the source <strong>of</strong> wastewater (Vymazal,<br />
2006; Toet et al., 2003) and the extent <strong>of</strong> nonpoint source pollution in the region. However,<br />
recently other pollutants, such as heavy metals, radioactive chemicals, and pharmaceutical and<br />
industrial organic chemicals have also emerged as pollutants <strong>of</strong> concern. Wetland plants play a<br />
wide range <strong>of</strong> roles in constructed wetlands for wastewater treatment. Roles include the physical<br />
effects <strong>of</strong> the plants themselves in affecting sedimentation, erosion control and providing surface<br />
area for microbial growth (bi<strong>of</strong>ilms) thus increasing microbial assisted processes including<br />
nitrification and denitrification. Aquatic plants also have a metabolic role in wastewater<br />
treatment with the potential to release oxygen into the rhizosphere aiding in nitrification and by<br />
the direct uptake <strong>of</strong> nutrients (Brix, 1997; Greenway and Woolley, 2001). Plants are the<br />
dominant structural component <strong>of</strong> most wetland treatment systems. Therefore, availability <strong>of</strong><br />
nutrients affects plant growth responses and resource allocation as well as possibly influencing<br />
removal efficiency in wetlands (Tanner, 2001; Zhang et al., 2007). A basic understanding <strong>of</strong> the<br />
growth requirements and characteristics <strong>of</strong> these wetland plants is essential for successful<br />
treatment wetlands design and operation.<br />
Emergent aquatic plant species such as cattails (Typha spp.), bulrushes (Schoenoplectus spp.),<br />
and common reed (Phragmites australis) have been widely used in the U.S. and elsewhere<br />
around the world for nutrient removal in constructed wetlands. Researchers argue that nutrient<br />
removal can be optimized by selecting suitable species with higher capacity for inorganic<br />
nitrogen and phosphorus absorption and conversion into plant biomass (Greenway, 2003;<br />
Vymazal, 2007; Mitsch and Gosselink, 2000). However, in the case <strong>of</strong> trace metals and<br />
radioactive and industrial organic chemicals, there is very little information available. The<br />
limited research that is available suggests that trace amounts <strong>of</strong> metals have been reported in<br />
plants growing in natural and constructed wetlands for wastewater treatment (Lesage et al., 2007;<br />
Vymazal and Krása, 2005; Vymazal et al., 2007). Also, a few others report that the<br />
bioaccumulation process is found to be effective in reducing some metals such as arsenic and<br />
Assessment and Monitoring <strong>of</strong> Wetlands 1
selenium into insoluble forms in some constructed wetlands (Zhang and Moore, 1997; Zhang and<br />
Frankenberge, 2003; Lin and Terry, 2003).<br />
Wetlands in arid and semi-arid regions <strong>of</strong>ten experience a lack <strong>of</strong> water due to water shortages<br />
and higher evaporation. Rapid population growth and economic development have caused<br />
deterioration or total destruction <strong>of</strong> many wetlands in these regions. In the semi-arid regions <strong>of</strong><br />
the U.S., wetlands and riparian areas constitute less than 2% <strong>of</strong> the surface area, but provide<br />
partial habitat for 80% <strong>of</strong> the wildlife species (McKinstry et al., 2004). The Las Vegas Valley<br />
(Valley) watershed located in Southern Nevada, also an arid region <strong>of</strong> the U.S., supports many<br />
ecologically significant wetlands <strong>of</strong>ten regarded as an oasis in the desert (SNWA, 2004). The<br />
Las Vegas Wash (Wash), a primary drainage channel for the 1,600 square-miles <strong>of</strong> the Valley<br />
watershed, supports a substantial riparian area (Eckberg and Shanahan, 2009). In the early<br />
1970s, the Wash provided an excellent wetland habitat as the desert soil was transformed into<br />
wet marshy wetland soils. However recently, the Wash has experienced considerable change as<br />
a result <strong>of</strong> rapid urban development in the valley (last 50 years). The wetland areas have<br />
decreased significantly, <strong>from</strong> about 2,000 acres in 1975 to about 300 acres in 1999 (LVWCC,<br />
2000). Excessive erosion along the channel has resulted in loss <strong>of</strong> wetlands and wildlife habitat,<br />
loss <strong>of</strong> property, damage to infrastructure, excessive sediment transport and water quality<br />
concerns in Lake Mead (LVWCC, 2000). As a restoration initiative, many erosion controls<br />
structures are being built to stabilize the channel, lands that are adjacent to these structures are<br />
being revegetated with plants that are native to Mojave Desert riparian ecosystems. As <strong>of</strong> March<br />
2008, 181 acres <strong>of</strong> land have been revegetated in the Wash. Also, construction <strong>of</strong> the 2,900 acre<br />
Clark County Wetlands Park has been initiated (Cizdziel and Zhou, 2005).<br />
There are several other wetlands in the area, either naturally formed as a result <strong>of</strong> flood control<br />
structures, or purposely constructed to improve ecosystem services. Like wetlands in many other<br />
rapidly growing urban centers, the wetlands in Las Vegas receive relatively high amounts <strong>of</strong><br />
nutrients <strong>from</strong> wastewater discharge and potential pollutants <strong>from</strong> nonpoint sources. Most <strong>of</strong> the<br />
wetlands in the valley are <strong>of</strong> free water surface (FWS) type, which have areas <strong>of</strong> open water and<br />
are similar in appearance to natural marshes. As the wastewater flows through the wetlands, it is<br />
treated by the process <strong>of</strong> sedimentation, filtration, oxidation, reduction, adsorption and<br />
precipitation. Since the FWS wetlands closely mimic natural wetlands, they attract a wide<br />
variety <strong>of</strong> wildlife (Kadlec and Wallace, 2009). Besides FWS types, a few pilot scale<br />
demonstration ponds have also been constructed. The details <strong>of</strong> individual wetlands are provided<br />
in the next section (site description). Since the Valley also has problems <strong>of</strong> naturally occurring<br />
trace metals such as selenium and arsenic in higher concentrations in some places, the wetlands<br />
in the Valley have the potential to function as natural filters by improving water quality <strong>from</strong><br />
wastewater discharge and urban run<strong>of</strong>f. However, performance <strong>of</strong> these wetlands has not been<br />
cumulatively assessed. To understand the functions and services that these wetlands provide, it<br />
is important to develop assessment methods based on weather, geomorphology, plant types, and<br />
other water quality parameters. Not only will this allow the maximization <strong>of</strong> ecosystem services,<br />
but more broadly, lessons learned <strong>from</strong> these wetlands can be applied to similar wetlands in other<br />
arid and semi-arid systems.<br />
The goal <strong>of</strong> this research was to compare and contrast the key characteristics <strong>of</strong> various types <strong>of</strong><br />
wetlands in the Valley and to assess their capability to remove nutrients and metalloids as has<br />
been documented for other wetland systems in the literature. We investigated changes in the<br />
Assessment and Monitoring <strong>of</strong> Wetlands 2
concentration <strong>of</strong> nutrients (nitrogen and phosphorus) and metalloids (selenium and arsenic) in the<br />
water column and sediments at wetland inlets and outlets in systems with established populations<br />
<strong>of</strong> two widespread wetlands plants (one species <strong>of</strong> cattail and three species <strong>of</strong> bulrush). A variety<br />
<strong>of</strong> above-ground and below-ground plant tissues were analyzed for nutrient and metalloid<br />
concentrations and values were compared across wetland sites to quantify the allocation and<br />
storage <strong>of</strong> these compounds with respect to ambient concentrations in the water column and<br />
sediments. This study confirms that the created and natural wetlands <strong>of</strong> the arid Las Vegas<br />
Valley are providing many <strong>of</strong> the ecosystem services predicted by the literature for wetlands in<br />
more temperate regions. This work also provides guidance for future research in refining the<br />
operation and maintenance <strong>of</strong> these wetland systems to maximize water quality improvements.<br />
2.0 MATERIALS AND METHODS<br />
2.1 Site Description<br />
The study was carried out in four wetlands types in the Valley (Figure 1; Table 1) including: (1)<br />
a constructed wastewater effluent treatment wetland, Demonstration Wetlands at the City <strong>of</strong><br />
Henderson <strong>Water</strong> Reclamation Facility (HD); (2) a constructed urban run<strong>of</strong>f treatment wetlands,<br />
Pitman Wash Pilot Wetland (PW); (3) a naturally occurring in-situ urban run<strong>of</strong>f treatment<br />
wetlands, Flamingo Wash (FW); and, (4) a wetlands created by backwater behind the Pabco<br />
Road Weir in the mainstream Las Vegas Wash (LVW).<br />
LVW: The Wash is the major drainage for the Valley which drains into Las Vegas Bay in Lake<br />
Mead. The Wash currently discharges, at >290 cubic feet per second (cfs;<br />
http://waterdata.usgs.gov/nwis/annual) providing nearly 2% <strong>of</strong> the inflow to the reservoir<br />
(Leising, 2003; SNWA, 2004). The Wash also conveys untreated urban run<strong>of</strong>f, resurfacing<br />
groundwater, and stormwater run<strong>of</strong>f (SNWA, 2004). The LVW wetlands site, fed mostly by<br />
treated wastewater effluent <strong>from</strong> the three municipal facilities, is located in the main channel <strong>of</strong><br />
the Wash and was created <strong>from</strong> the backwater pool behind Pabco Road Weir (Figure 2). It has a<br />
well established, dense population <strong>of</strong> vegetation (>100 feet wide at many places) and provides<br />
habitat to many aquatic and avian species. There is also a large amount <strong>of</strong> standing water in this<br />
wetland potentially forming very rich sediment deposits. The wetland vegetation in this area is<br />
dominated by cattails (T. domingensis) and common reeds (P. australis).<br />
FW: These wetlands are located in the Flamingo Wash, a tributary to the Wash, and are fed by<br />
urban run<strong>of</strong>f (Figure 3). The Flamingo Wash stretches for several miles but the wetlands are<br />
somewhat patchy and sparsely located. Dense vegetation <strong>of</strong> annual weeds mixed with cattails<br />
exists throughout the channel and provides habitat to many aquatic and avian species. FW has<br />
an average discharge <strong>of</strong> ~5 cfs.<br />
PW: The Pittman Wash is a demonstration-type pilot wetland created to study water quality<br />
<strong>from</strong> urban run<strong>of</strong>f before it enters the Wash (Figure 4). The PW wetlands are experimental<br />
wetlands (20 m x 20 m) and have both surface and sub-surface flow components. The main<br />
plants in the PW wetlands are three species <strong>of</strong> bulrushes (S. acutus, S. americanus, and S.<br />
californicus).<br />
Assessment and Monitoring <strong>of</strong> Wetlands 3
Figure 1: Map showing different wetlands sites located within the Valley - FW: Flamingo Wash, PW: Pitman<br />
Wash Pilot Wetlands, HD: Demonstration Wetland at the City <strong>of</strong> Henderson <strong>Water</strong> Reclamation Facility,<br />
and LVW: Las Vegas Wash (adapted <strong>from</strong> Reginato and Piechota, 2004).<br />
Assessment and Monitoring <strong>of</strong> Wetlands 4
Project Sites LAT (N) LON (W)<br />
Las Vegas Wash (LVW) 36.088061 114.986333<br />
Demonstration Wetland at the City<br />
36.075497 115.001964<br />
<strong>of</strong> Henderson <strong>Water</strong> Reclamation<br />
Facility (HD)<br />
Pittman Wash Pilot Wetlands (PW) 36.046747 115.053628<br />
Flamingo Wash (FW) 36.113675 115.148103<br />
Table 1: Locations <strong>of</strong> the four wetland sites in the Valley.<br />
Figure 2: LVW showing inlet and outlet sampling locations for sediment and water sampling.<br />
Assessment and Monitoring <strong>of</strong> Wetlands 5
Figure 3: FW showing inlet and outlet sampling locations for sediment and water sampling<br />
(Zhou et al., 2009).<br />
Figure 4: PW showing inlet and outlet sampling locations for sediment and water sampling (LVWCC, 2009).<br />
Assessment and Monitoring <strong>of</strong> Wetlands 6
HD: This is another demonstration-type wetlands located at the City <strong>of</strong> Henderson <strong>Water</strong><br />
Reclamation Facility (Figure 5). These wetlands were constructed to test partially treated<br />
effluent discharge. The vegetation types here are mostly three species <strong>of</strong> bulrushes (S. acutus, S.<br />
americanus, and S. californicus) that exist in specially designed vegetation hummocks. The<br />
standing water in HD wetlands not only provides an opportunity for treatment but is also a<br />
popular destination for birds and other animals.<br />
Based on distribution and dominance, cattails at FW and LVW and the three species <strong>of</strong> bulrush<br />
(S. acutus, S. americanus, and S. californicus) at PW and HD were selected for our study.<br />
Figure 5: HD showing inlet and outlet locations for sediment and water sampling (Zhou and Van<br />
Dooremolen, 2007).<br />
2.2 Sampling and Analysis<br />
2.2.1 <strong>Water</strong><br />
<strong>Water</strong> samples were collected monthly <strong>from</strong> all four sites beginning in July 2008 and ending in<br />
June 2009. PW was only sampled through January 2009 because <strong>of</strong> storm damage. Various<br />
parameters were measured including total dissolved nitrogen (TN, measured as NO 3 +NO 2 +NH 4 )<br />
and total phosphorus (TP, measured as orthophosphate) and physical parameters such as<br />
dissolved oxygen (DO), pH, specific conductivity, and temperature. Nalgene sample bottles (1<br />
liter) used during sampling were acid rinsed prior to the sampling. Samples were collected <strong>from</strong><br />
the inlet and outlet locations for all four wetland sites. <strong>Water</strong> samples were then immediately<br />
stored on ice. TP content was determined using the colorimetric analysis after persulfate<br />
digestion (APHA, 2005). TN was analyzed using an automated colorimetric method using a<br />
Lachat QC8000. <strong>Water</strong> sampling was conducted in conjunction with Southern Nevada <strong>Water</strong><br />
Assessment and Monitoring <strong>of</strong> Wetlands 7
Authority (SNWA) regular water quality monitoring. Sites not covered under SNWA<br />
monitoring locations were sampled separately by Desert Research Institute (DRI) crews.<br />
2.2.2 Sediment<br />
Sediment samples were collected <strong>from</strong> the same inlet and outlet locations as the water samples at<br />
all four wetlands in four seasons (Fall 2008, Winter 2008, Spring 2009 and Summer 2009).<br />
Vertically mixed sediment samples were collected using a plastic scoop with a depth <strong>of</strong> up to<br />
~10 cm and transferred into 100 ml glass bottles with polyvinyl caps. Samples were kept in the<br />
refrigerator until analysis. Samples were then dried in a convection oven at 70 o C until they were<br />
completely dry. Subsamples <strong>of</strong> dry sediment (~1 g) <strong>from</strong> each sample were processed for metal<br />
digestion following USEPA Method 3050B at the DRI Ecological Engineering Laboratory.<br />
Only samples collected in Winter 2008 and Spring and Summer 2009 were analyzed for metals.<br />
Sediment samples were digested with repeated addition <strong>of</strong> 70% HNO 3 and 3% H 2 O 2 . A low<br />
temperature thermostat (Lauda Ecoline, U.S. version) was used to provide uniform heating <strong>of</strong><br />
95oC. The resultant digest was diluted to 100 ml, centrifuged, and stored at 4oC until analysis.<br />
Samples were analyzed for trace metals using inductively coupled plasma mass spectroscopy<br />
(ICP-MS) at the Goldwater Environmental Laboratory at Arizona State University. Sediment TP<br />
content was analyzed for 1g dry subsamples using the colorimetric method mentioned above<br />
(APHA, 2005). Sediment TN content was analyzed on a dry subsample (~1 g) using a<br />
PerkinElmer 2400 CHN analyzer.<br />
2.2.3 Plant<br />
Plant samples were collected at the center <strong>of</strong> all four wetlands in four seasons using 50 cm x 50<br />
cm quadrants. However, in some cases there were not enough live plants available, e.g., FW<br />
wetlands in winter and PW wetlands in summer <strong>of</strong> 2009. Analysis <strong>of</strong> seasonal variation in<br />
wetland vegetation is based on the plant sampling made in Fall 2008, Winter 2008, Spring 2009<br />
and Summer 2009. Quadrant locations were chosen randomly to represent the whole wetlands.<br />
There were a total <strong>of</strong> 14 quadrants, 5 in LVW and 3 each in the three remaining wetlands. All<br />
plant materials (above- and below-ground) in each quadrant was harvested and processed for<br />
biomass, nutrients (TN and TP), and metals (29 trace metals) for all seasons. Plant biomass was<br />
calculated using methods developed by APHA (2005) for dry plant weight by storing for 72<br />
hours at 70 o C or until a consistent dry weight was obtained. Dry plant samples were separated<br />
into rhizomes, roots, stems, and leaves prior to sub-sampling for nutrients and metals analysis. A<br />
Cyclone Sample Mill (UDY Corporation, Fort Collins, Colorado) was used to grind plant<br />
samples (homogenized samples were < 1 mm) for nutrients and metals analysis. Plant TP and<br />
TN contents were determined using the methods used for sediment analysis explained above.<br />
For metals, 200 mg ground plant samples were digested following USEPA Method 3050B.<br />
Digested samples were processed using ICP-MS, similar to the sediment samples.<br />
2.3 Statistical Analysis<br />
Statistical analyses were carried out using JMP s<strong>of</strong>tware (SAS Institute, Cary, North Carolina).<br />
One-way analysis <strong>of</strong> variance (ANOVA) was used to study the effect <strong>of</strong> wetland type and plant<br />
species on the nutrient and metal concentrations in plants. Two-way ANOVA was also used to<br />
study the interactions <strong>of</strong> wetlands type and species distribution with TP, TN, and metals<br />
concentrations, for both the seasonal and annual means. Differences detected in ANOVAs <strong>from</strong><br />
the wetland sites were compared using the Tukey pair-wise comparison test. For all <strong>of</strong> the tests,<br />
Assessment and Monitoring <strong>of</strong> Wetlands 8
p-values < 0.05 (95% confidence interval) were considered significant. Plant, water and<br />
sediment nutrients and metals were regressed between sites to see correlations between them,<br />
which would then allow us to determine if plant uptake was regulated by water and sediment<br />
concentrations.<br />
3.0 RESULTS<br />
3.1 Plant Biomass<br />
Biomass production values can be used as an indicator to estimate the nutrient uptake capacity <strong>of</strong><br />
a species (Tanner, 1996: Greenway and Wolley, 2001). The majority <strong>of</strong> the plants in the LVW<br />
and FW wetlands were monospecific stands <strong>of</strong> cattails whereas the HD and PW wetlands were<br />
inhabited by three species <strong>of</strong> bulrushes. The total dry weight <strong>of</strong> cattails and bulrushes varied<br />
significantly among the four wetlands sites (Table 2). Cattails in the LVW wetlands had a higher<br />
total average biomass production (9.7 kg/m 2 ) compared to the FW wetlands (2.6 kg/m 2 ).<br />
Similarly, the total average biomass <strong>of</strong> bulrush species was found to be higher in HD wetlands<br />
than in PW wetlands. All three bulrush species had higher biomass in HD than in PW wetlands<br />
(S. americanus and S. californicus ~11 kg/m 2 vs. 4.0 kg/m 2 and S. acutus 4.0 vs. 2.2 kg/m 2 ).<br />
Overall, total biomass harvested per quadrant was highest in HD wetlands compared to the other<br />
three wetlands.<br />
Site Plants<br />
Culm per Biomass per Biomass TN TP<br />
Quadrant Culm<br />
Storage Storage<br />
(number) (kg) (kg/m 2 ) (g/m 2 ) (g/m 2 )<br />
LVW T. domingensis 14 ± 5 0.27±0.05 9.69±0.21 135.7±12 6.6±0.6<br />
HD S. americanus 17 ± 6 0.26±0.04 11.37±0.17 152.4±9.3 16.0±1.0<br />
S. californicus 13 ± 5 0.35±0.07 11.20±0.29 170.2±17.8 13.4±1.4<br />
S. acutus 15 ± 6 0.11±0.04 4.09±0.15 48.3±6.9 4.7±0.7<br />
PW S. americanus 11 ± 4 0.16±0.05 4.61±0.19 44.7±7.2 2.2±0.4<br />
S. californicus 14 ± 9 0.16±0.03 3.79±0.13 37.5±5.4 1.5±0.2<br />
S. acutus 14 ± 9 0.11±0.03 2.26±0.11 15.8±3.0 0.5±0.1<br />
FW T. domingensis 11 ± 3 0.08±0.03 2.62±0.12 28.6±5.2 1.5±0.3<br />
Table 2: Average biomass and nutrient storage <strong>of</strong> individual plants (Typha domingensis and Schoenoplectus<br />
spp.) at the four wetland sites. Two digits after ± sign indicate standard errors.<br />
3.2 Nutrients<br />
Plant, sediment and water column nutrient data measured at the various wetlands differed in<br />
concentrations (ANOVA, p
3.2.1 Phosphorus (P)<br />
Plant tissue analyses indicate that TP concentration varied significantly among the four wetlands<br />
(p
a<br />
(A)<br />
b<br />
c<br />
bc<br />
(B)<br />
a<br />
b<br />
b<br />
c<br />
a<br />
(C)<br />
b<br />
b<br />
b<br />
(~4<br />
Figure 6: Average annual total phosphorus concentrations in: (A) plants (Typha domingensis and<br />
Schoenoplectus spp.), (B) sediments, and (C) water at the four wetland sites. Error bars represent standard<br />
errors.<br />
Assessment and Monitoring <strong>of</strong> Wetlands 11
(A)<br />
(B)<br />
a<br />
a<br />
b<br />
b<br />
Figure 7: Average annual (A) total phosphorus, and (B) total nitrogen concentrations in shoot and root parts<br />
<strong>of</strong> plant tissues (Typha domingensis and Schoenoplectus spp.) at the four wetland sites. Error bars represent<br />
standard errors.<br />
Figure 8: Average annual total phosphorus concentration in sediments at inlets and outlets <strong>of</strong> the four<br />
wetland sites. Error bars represent standard errors.<br />
Assessment and Monitoring <strong>of</strong> Wetlands 12
a<br />
a<br />
(A)<br />
b<br />
b<br />
(B)<br />
a<br />
a<br />
b<br />
b<br />
a<br />
(C)<br />
c<br />
b<br />
d<br />
Figure 9: Average annual total nitrogen concentrations in: (A) plants (Typha domingensis and Schoenoplectus<br />
spp.), (B) sediments, and (C) water at the four wetland sites. Error bars represent standard errors.<br />
Assessment and Monitoring <strong>of</strong> Wetlands 13
Figure 10: Annual average total nitrogen concentrations <strong>of</strong> sediment at inlets and outlets <strong>of</strong> the four wetland<br />
sites. Error bars represent standard errors.<br />
wetlands was lower than at the LVW wetlands (~9 mg/L), followed by the FW wetlands the HD<br />
wetlands had a lower mean TN (~ 5 mg/L) than the LVW and PW wetlands. This might be due<br />
to the City <strong>of</strong> Henderson’s efforts to denitrify discharged water since March 2008. That is<br />
perhaps the reason why the concentration in the water is so low and also may explain, at least in<br />
part, why the plant tissues have higher concentrations than the water and sediment. The plants<br />
have been growing in the HD for several years and were thus growing when N concentrations in<br />
the water and sediment were much higher than when this study was ongoing.<br />
3.2.3 Metals<br />
Twenty-nine trace metals were analyzed for the plant, sediment, and water samples. Not all the<br />
metals were detected but the ones that were detected in the sediments are As, Cd, Co, Cr, Cu,<br />
Hg, Fe, Li, Ni, Pb, Se and Zn and in plant tissues are As, Hg, Pb, Zn, Cd, Mo, Li, Cr, Cu, Se and<br />
Fe (Table 3 and 4). Among the detected metals, selenium and arsenic were paid special attention<br />
in this study because <strong>of</strong> their higher concentrations and known presence in the valley and<br />
potential adverse impact on water quality and aquatic wildlife. They have not been listed in the<br />
table below but analyzed separately (Figures 11-15). Metal concentrations in plant tissues were<br />
compared with the inlet and outlet sediment and water column concentrations for each <strong>of</strong> the<br />
four wetlands sites. The plant tissue concentrations were also compared with the ambient<br />
sediment and water column data measured at the various wetlands and no significant<br />
relationships were found (p>0.05).<br />
Arsenic: Comparing above-ground and below-ground concentrations, As concentrations were<br />
significantly higher in the below-ground parts <strong>of</strong> either species than in the above-ground parts, at<br />
all sites (p = 0.01; Figure 11A). Among the four wetlands, PW wetlands had the highest average<br />
As concentrations in plants, sediments, and water. PW plants (bulrushes) had ~6.0 µg/g As,<br />
which was significantly higher than the As levels in the other wetland sites (p = 0.001; Figure<br />
12A). LVW plants (cattails) had the second highest As concentration (~3.5 µg/g).<br />
Concentrations <strong>of</strong> As were lower in FW and HD wetland plants.<br />
Assessment and Monitoring <strong>of</strong> Wetlands 14
Trace Metals in<br />
Sediment<br />
(µg/g)<br />
Wetland Sites<br />
LVW HD PW FW<br />
Cd 0.12±0.03 0.23±0.15 0.12±0.03 0.06±0.04<br />
Co 2.43±0.54 3.72±0.85 3.9±0.79 1.4±0.36<br />
Cr 7.71±1.66 9.10±4.12 5.89±1.98 5.11±1.35<br />
Cu 10.66±3.11 11.42±3.76 11.39±2.99 12.88±8.11<br />
Fe 1208.53±140.83 911.74±183.16 509.50±122.72 821.05±129.53<br />
Hg 0.36±0.10 1.60±0.71 2.15±0.65 0.49±0.11<br />
Mo 144.10±59.60 120.53±52.10 86.75±31.61 44.51±18.65<br />
Ni 10.09±7.75 18.39±3.08 21.26±10.26 14.79±12.13<br />
Pb 5.51±1.28 11.40±3.67 8.83±1.70 8.89±4.49<br />
Zn 68.58±16.01 32.29±6.68 45.29±9.04 88.57±57.20<br />
Table 3: Average annual trace metal concentrations in sediments at the four wetland sites. Two digits after ±<br />
sign indicate standard errors.<br />
Trace Metals in<br />
Plant tissue<br />
(µg/g)<br />
Wetland Sites<br />
LVW HD PW FW<br />
Cd DL DL 0.4±0.1 0.6±0.3<br />
Co 15.4±3.9 15.8±5.1 3.4±1.4 1.0±0.5<br />
Cr 5.9±0.7 4.05±0.3 7.2±0.7 2.5±0.15<br />
Cu 287.1±53 83.9±18.5 47.2±22.5 14.7±7.3<br />
Fe 1233.9±270 449.5±83.1 570.4±150.2 1032.3±672<br />
Hg 0.3±0.2 0.4±0.1 2.1±0.63 3.1±0.89<br />
Li 3.6±0.7 2.1±0.4 2.7±0.3 1.97±1.73<br />
Mn 255.6±59.5 279.2±53.4 303.9±90.2 498.1±10.7<br />
Mo 9.6±4.4 5.5±1.3 4.6±1.3 10.0±3.5<br />
Ni 4.27±0.6 3.7±0.4 5.1±1.5 5.0±1.5<br />
Pb 3.3±0.9 4.3±0.7 5.4±2.3 6.8±2.16<br />
Zn 57.7±5.3 118.7±19.5 212.9±45.2 150.6±59.03<br />
Table 4: Average annual trace metal concentrations in individual plants (Typha domingensis and<br />
Schoenoplectus spp.) at the four wetland sites. Two digits after ± sign indicate standard errors. DL = Less<br />
than detection limit. Detection limits for each element are based on DL <strong>of</strong> ICP-MS manufacturers.<br />
Similarly, annual mean sediment As concentrations were different in different wetlands (p =<br />
0.001; Figure 12B) but consistent with plant tissue concentrations. As with the plants, the PW<br />
wetlands had the highest concentration (~6.06 µg/g) followed by LVW (~4.71 µg/g), FW (~3.65<br />
µg/g), and HD (~3.36 µg/g). As with the plants and sediments, the water column As<br />
concentrations differed between sites (p = 0.01), but the trend was not always consistent with the<br />
plant and sediment concentrations (Figure 12C). There was no significant decrease in As<br />
concentrations in sediment <strong>from</strong> inlet to outlet in any <strong>of</strong> the wetland sites (p
LVW (~7.1 µg/L), FW (~4.47 µg/L), and HD (~3.42 µg/L). Generally, As concentrations at the<br />
outflow sites were similar to those at the inflow sites and did not show any significant reduction.<br />
(A)<br />
(B)<br />
Figure 11: Average annual (A) Arsenic and (B) Selenium concentrations in plants (Typha domingensis and<br />
Schoenoplectus spp.) at the four wetland sites. Error bars represent standard errors.<br />
Assessment and Monitoring <strong>of</strong> Wetlands 16
(A)<br />
a<br />
b<br />
c<br />
c<br />
(B)<br />
b<br />
c<br />
a<br />
c<br />
a<br />
(C)<br />
a<br />
c<br />
c<br />
Figure 12: Average annual arsenic concentrations in: (A) plants (Typha domingensis and Schoenoplectus<br />
spp.), (B) sediments, and (C) water at the four wetland sites. Error bars represent standard errors.<br />
Assessment and Monitoring <strong>of</strong> Wetlands 17
Figure 13: Average annual sediment arsenic concentrations at the inlets and outlets <strong>of</strong> the four wetland sites.<br />
Error bars represent standard errors.<br />
Selenium: As with the As concentrations, Se concentrations were also higher in the belowground<br />
parts for both species (Figure 11B) in all the wetlands. There was a remarkably high Se<br />
concentration (~9.80 µg/L) detected in the bulrush plant tissues in the PW wetlands. The rest <strong>of</strong><br />
the wetlands each had about one fourth <strong>of</strong> the concentration <strong>of</strong> Se as in the PW wetlands.<br />
Cattails appeared to have lower Se concentrations at both the LVW (~2.32 µg/L) and FW<br />
wetlands (~1.29 µg/L), compared to the bulrushes <strong>of</strong> the HD and PW wetlands (Figure 14A).<br />
The LVW and FW wetlands sediments measured higher concentrations than the HD and PW<br />
wetlands (p = 0.001; Figure 14B). The annual mean sediment Se concentrations in FW and<br />
LVW were about 1.27 µg/g, followed by PW (~0.77 µg/g), and HD (~0.55 µg/g). Annual<br />
average Se concentrations in the water column were significantly different among the four<br />
wetlands sites (p = 0.001). The PW and FW wetlands were significantly higher than the LVW<br />
and HD wetlands (Figure 14C). Se concentration in the sediments did not show any significant<br />
differences between the inlets and the outlets (p = 0.001; Figure 15). The PW wetlands had the<br />
highest concentration <strong>of</strong> Se in the water (~10.68 µg/L), followed by FW (~8.2 µg/L), LVW (~3.2<br />
µg/L), and HD (~1.91 µg/L).<br />
3.2.4 Treatment Performance<br />
Treatment performance <strong>of</strong> the wetlands can also be explained using linear regression analysis<br />
among different variables. The annual average nutrient and metal concentrations in sediment<br />
and water column were positively correlated with plant tissue concentrations among sites. Plant<br />
tissue TP concentration was highly correlated with sediment (R 2 = 0.83; Figure16) and water<br />
column (R 2 = 0.85; Figure 17) concentrations. However, this correlation was not seen in plant<br />
tissue TN with either sediment or water. Similarly, plant tissue arsenic concentration showed a<br />
strong positive correlation with water (R 2 = 0.88; Figure 18) and sediment (R 2 = 0.99; Figure 19).<br />
On the other hand, the selenium in plant tissues had weaker correlations with both water<br />
(R 2 =.039; Figure 20) and sediment (R 2
(A)<br />
a<br />
b<br />
b<br />
b<br />
(B)<br />
ab<br />
a<br />
bc<br />
c<br />
(C)<br />
a<br />
b<br />
c<br />
d<br />
Figure 14: Average annual selenium concentrations in: (A) plants (Typha domingensis and Schoenoplectus<br />
spp.), (B) sediments, and (C) water at the four wetland sites. Error bars represent standard errors.<br />
Assessment and Monitoring <strong>of</strong> Wetlands 19
Figure 15: Annual average selenium concentrations <strong>of</strong> sediment at the inlets and outlets <strong>of</strong> the four wetland<br />
sites. Error bars represent standard errors.<br />
Figure 16: Overall correlations between annual average plant tissue and sediment total phosphorus<br />
concentrations (TP%) in the four wetland sites. The line shown is a least square linear regression.<br />
Assessment and Monitoring <strong>of</strong> Wetlands 20
Figure 17: Overall correlations between annual average plant tissue (TP%) and water column(mg/L) total<br />
phosphorus concentrations in the four wetland sites. The line shown is a least square linear regression.<br />
Figure 18: Overall correlations between annual average plant tissue (µg/g) and water column (µg/L) arsenic<br />
concentrations in the four wetland sites. The line shown is a least square linear regression.<br />
Assessment and Monitoring <strong>of</strong> Wetlands 21
Figure 19: Overall correlations between annual average plant tissue and sediment arsenic concentrations<br />
(µg/g) in the four wetland sites. The line shown is a least square linear regression.<br />
Figure 20: Overall correlations between annual average plant tissue (µg/g) and water column (µg/L) in the<br />
four wetland sites. The line shown is a least square linear regression.<br />
3.3 Temporal Variation (Nutrients and Metals)<br />
Seasonal average TP concentrations in the cattails were significantly higher in LVW for the<br />
summer season but there was no apparent difference between spring and winter. Similar trends<br />
were seen for seasonal distribution at HD and PW wetlands for TP% in bulrush plants with<br />
typically higher concentrations in summer followed by lower concentrations in spring and winter<br />
Assessment and Monitoring <strong>of</strong> Wetlands 22
(Figure 21). Our sampling locations in the FW wetlands did not have any live plants in the<br />
winter season therefore they were not included in the analysis. FW cattails also had higher<br />
concentrations in summer followed by spring. Seasonal mean TN% in cattail and bulrush plant<br />
tissues were similar to that <strong>of</strong> TP in all the wetlands (Figure 22).<br />
Seasonal As concentrations (µg/g) in cattail plants at the LVW wetlands appeared generally<br />
higher in summer followed by spring and winter seasons but were not statistically significant<br />
(Figure 23); whereas bulrush plants As concentrations were generally consistent during winter,<br />
summer and spring. Unlike the HD wetlands, bulrush species had higher As concentrations in<br />
summer than winter season. Temporal data were not available for comparison in FW wetlands.<br />
Se concentrations (µg/g) in both cattails and bulrush were higher in winter at the LVW, HD and<br />
PW wetlands (Figure 24).<br />
Figure 21: Average seasonal total phosphorus concentrations in plants (Typha domingensis and<br />
Schoenoplectus spp.) at the four wetland sites. Error bars represent standard errors.<br />
Assessment and Monitoring <strong>of</strong> Wetlands 23
Figure 22: Average seasonal total nitrogen concentrations in plants (Typha domingensis and Schoenoplectus<br />
spp.) at the four wetland sites. Error bars represent standard errors.<br />
Figure 23: Average seasonal total arsenic concentrations in plants (Typha domingensis and Schoenoplectus<br />
spp.) at the four wetland sites. Error bars represent standard errors.<br />
Assessment and Monitoring <strong>of</strong> Wetlands 24
Figure 24: Average seasonal selenium concentrations in plants (Typha domingensis and Schoenoplectus spp.)<br />
at the four wetland sites. Error bars represent standard errors.<br />
4.0 DISCUSSION<br />
4.1 Plant Biomass<br />
Plant composition in the LVW and FW wetlands was dominated by a high density <strong>of</strong> cattails.<br />
Cattails are common plants in naturally occurring surface run<strong>of</strong>f wetlands in the Southwestern<br />
U.S. (Seiler et al., 2003). Plant composition in the HD and PW wetlands is dominated by three<br />
species <strong>of</strong> bulrush. The HD and PW wetlands are constructed wetlands fed by partially treated<br />
wastewater effluent and urban run<strong>of</strong>f, respectively. Bulrush were chosen since these plants are<br />
native, fit a wide variety <strong>of</strong> niches in wetland ecosystems, planting stock is <strong>of</strong>ten available<br />
through commercial plant nurseries, and they spread through lateral rhizomes, which allow the<br />
relatively rapid development <strong>of</strong> an emergent plant canopy. Biomass is most frequently defined<br />
as the mass <strong>of</strong> all living tissue at the given time in a given unit <strong>of</strong> Earth’s surface (Lieth and<br />
Whittaker, 1975). In our study, we measured the peak standing crops, also known as the single<br />
largest value <strong>of</strong> plant material present during a year’s growth (Richardson and Vymazal, 2000).<br />
Plant productivity and nutrient accumulation in plant biomass varied widely for cattail and<br />
bulrush species among the four different wetland sites (Table 2). This variation could be due to<br />
differences in environmental parameters such as incoming nutrients and hydrology in the<br />
wetlands systems. For example, bulrushes, especially S. americanus, showed a high density <strong>of</strong><br />
stem growth in the HD wetlands, but relatively less density and biomass in the PW wetlands.<br />
Similarly, cattails in the LVW wetlands yielded higher plant density and biomass per quadrant<br />
compared to the FW wetlands. The LVW and HD wetlands receive high nutrient loads <strong>from</strong><br />
wastewater treatment plants, whereas the PW and FW wetlands receive relatively lower nutrient<br />
loads as they are fed by urban run<strong>of</strong>f systems. In both <strong>of</strong> these cases, incoming nutrients might<br />
have played a major role. Aquatic plants take up large quantities <strong>of</strong> nutrients and assimilate<br />
them efficiently (Cronk and Fennessy, 2001). The present results show that the plants may be<br />
capable <strong>of</strong> growing better by taking up more nutrients (if available in the wetlands system) and<br />
producing more biomass. Similarly, plant nutrient concentrations in both cattails and bulrush<br />
were highest during the peak growing season <strong>of</strong> summer, followed by the early growing season<br />
Assessment and Monitoring <strong>of</strong> Wetlands 25
<strong>of</strong> spring, and much lower during the winter season for both TN and TP in our study.<br />
Differences in biomass accumulation and tissue N and P concentrations between species are<br />
likely to reflect species and developmental stage differences in efficiency <strong>of</strong> nutrient uptake and<br />
use (Güsewell and Bollens, 2003; Tanner, 1996). Relatively low plant density was observed for<br />
cattail species in FW compared to LVW, as well as for bulrush species in PW compared to HD<br />
suggesting the roles nutrients, water availability, retention times, among other factors, might<br />
have played in shaping plant production in these different systems. However, the other three<br />
sites did not have the space limitation as HD (i.e., the hummocks) that might have also played a<br />
role in plant density. The biomass <strong>of</strong> cattail and bulrush species ranged <strong>from</strong> 2.2-11.3 kg/m 2 /yr<br />
in our study and are comparable with the constructed wetlands <strong>of</strong> highly productive ecosystems.<br />
Total plant productivity at the end <strong>of</strong> the vegetation cycle was estimated to be 13-20 kg/m 2 /yr for<br />
cattails and bulrush species in constructed ecosystems, but was only 3-5 kg/m 2 /yr in natural and<br />
less polluted areas (Vymazal, 1998; Mitsch and Gosselink, 2000; Reddy and De Busk, 1987).<br />
The biomass values measured in our study represent maximum seasonal biomass values and are<br />
higher than productivity estimates that include a carryover <strong>of</strong> biomass <strong>from</strong> the previous season.<br />
Since we did not know the exact age <strong>of</strong> the plant, some plants might represent two growing<br />
seasons in our random sampling; but plants representing two growing seasons do not necessarily<br />
carry maximum nutrient concentration (Reddy and De Busk, 1987).<br />
4.2 Plant Nutrients<br />
TN and TP contents <strong>of</strong> living biomass in different wetlands vary considerably among species,<br />
plant parts, and wetland sites. Wetland plants in constructed wetlands are <strong>of</strong>ten nutrient enriched<br />
and display higher values <strong>of</strong> tissue nutrient concentrations than natural wetlands (Boyd, 1978). It<br />
is known <strong>from</strong> growth experiments that both plant growth and tissue nutrient concentration (per<br />
unit dry weight) tend to be positively correlated with nutrient supply when all other resources are<br />
sufficiently available (Garnier, 1998). Our results support the hypothesis suggested by Reddy<br />
and De Busk (1987), regarding typical plant growth response to increased concentrations <strong>of</strong><br />
nitrogen and phosphorus (Figure 25). Adding wastewater to wetlands generally increases the<br />
availability <strong>of</strong> water and nutrients and consequently results in the stimulation <strong>of</strong> gross and net<br />
primary productivity <strong>of</strong> these ecosystems. The maximum rate <strong>of</strong> plant growth is attained as<br />
nutrient levels are initially increased. However, at higher nutrient levels, plant growth levels <strong>of</strong>f<br />
while luxury nutrient uptake continues, and at higher nutrient concentration toxic responses are<br />
observed.<br />
Despite their differences in total biomass, nutrient concentrations in plant tissues were similar<br />
between cattail and bulrush species. Nutrient content per unit <strong>of</strong> biomass were generally more<br />
site-specific than species-specific. This is not unique to our system, for example, nutrient<br />
removal efficiency <strong>of</strong> a system depends on the plant type, growth rate, nutrient composition <strong>of</strong><br />
the water, and physicochemical environment in the water-sediment system (Reddy et al., 1983).<br />
Our data suggest that nutrient concentration tended to be highest for S. californicus plants than in<br />
the other two bulrush species. Cattails were also found to have relatively higher nutrient<br />
concentrations. Cattail plants in our wetlands sites had high nutrient uptake compared with the<br />
similar constructed wetlands in different parts <strong>of</strong> the U.S. Similar to our study, in two free-water<br />
surface treatment cells at the Iron Bridge Wetland in Florida, S. californicus, and T. latifolia<br />
removed N and P to a similar extent (EPA, 2000). Nitrogen uptake by cattails and bulrushes was<br />
in the range <strong>of</strong> 100-300 g N/ m 2 at different constructed treatment wetlands in the U.S. (Kadlec<br />
Assessment and Monitoring <strong>of</strong> Wetlands 26
Figure 25: General relationships between plant biomass and nutrient concentrations in the water column and<br />
soil surface (Reddy and De Busk, 1987).<br />
and Wallace, 2009), which was comparable to our results. However, the nutrient storage per m 2<br />
in our study differs significantly because <strong>of</strong> the varying plant biomass values among the four<br />
wetlands (Table 2). High densities <strong>of</strong> bulrush species carried large amount <strong>of</strong> nutrients in the<br />
system, up to 170.2 g N/m 2 and 16.0 g P/m 2 . Our results are on the high end compared to the<br />
findings <strong>of</strong> Vymazal (2006), who reported that the nitrogen standing stock for emergent species<br />
was in the range <strong>of</strong> 14 to 156 g N/m 2 . Similarly, Tanner (2001) showed that bulrush plant tissues<br />
accumulated 8.8-13.4 g P/ m 2 and 48-69g N/ m 2 in total biomass (root and shoot). These data are<br />
within a close range <strong>of</strong> our wetland systems.<br />
Also in our study, below-ground parts appear to be more efficient in phosphorus uptake<br />
compared to the above-ground plant parts (<strong>of</strong> both cattails and bulrushes). However, in contrast,<br />
above-ground plant parts had higher nitrogen concentrations compared to the below-ground parts<br />
for both species. Our results are in agreement with Greenway (2005), who compared nitrogen<br />
and phosphorus in root/rhizomes and leaf/stem tissues for a variety <strong>of</strong> native wetlands species<br />
<strong>from</strong> constructed wetlands <strong>of</strong> Queensland and found that the nitrogen content was highest in the<br />
above-ground parts and the phosphorus was highest in the below-ground parts. Similarly, our<br />
data suggest that the fibrous roots have higher TP concentrations for both cattails and bulrush<br />
species (0.11% for cattail and 0.13% for bulrush) than rhizome (0.07% for cattail and 0.10% for<br />
bulrush). Higher nutrient uptake by fibrous roots was also recognized by Yang et al. (2007) in<br />
their study <strong>of</strong> five different emergent plants. They found that removal efficiency was a function<br />
<strong>of</strong> the amount <strong>of</strong> fibrous roots present in the plant rather than the plant’s total biomass.<br />
4.3 Nutrient Uptake Among Wetland Types<br />
Phosphorus: Constructed and natural wetlands are capable <strong>of</strong> absorbing new phosphorus loads,<br />
and in appropriate circumstances can provide a low cost alternative to chemical and biological<br />
treatment. Phosphorus interacts strongly with wetland sediment, water column and plant species,<br />
which provides both short term and sustainable long term storage <strong>of</strong> this nutrient (Kadlec, 1998).<br />
Our nutrient dynamics results suggest the efficiency <strong>of</strong> TP uptake was not specific to any<br />
particular species but was more dependent on the ambient concentration <strong>of</strong> nutrients in sediments<br />
<strong>of</strong> the specific wetland sites. Sites with higher ambient nutrients had generally higher nutrients<br />
in the plants. This is not completely unexpected because plants have higher plasticity for<br />
Assessment and Monitoring <strong>of</strong> Wetlands 27
nutrients than other organisms. This has also been found in many algal nutrient studies, for<br />
example, algae grown in higher nutrient concentrations have higher algal N and P concentrations<br />
due to weaker homeostasis in plants compared to other organisms (Acharya, 2004; Sterner and<br />
Elser, 2002). Similarly, Zhang et al. (2008) investigated the concentration <strong>of</strong> nutrients (N and P)<br />
in wastewater fed wetlands and found results consistent with our findings.<br />
Also, our data suggested that TP concentration in plant tissues had relatively higher correlation<br />
with the sediment concentration than water column (Figures 16, 17). This is not surprising due<br />
to higher P availability in the sediments than in the water columns. Correlations were<br />
particularly strong in the HD wetlands. This is perhaps expected considering that the HD<br />
wetland received partially treated effluent (primary treatment only) for a long period <strong>of</strong> time<br />
before water was denitrified. Furthermore, HD had the longest retention time <strong>of</strong> any wetland<br />
studied. Similarly, other previous studies suggest, for P removal, contact time may play a major<br />
role in the distribution within constructed wetlands (Drizo et al., 2000) and it has been suggested<br />
that the removal efficiency <strong>of</strong> P is positively correlated with retention time (Klomjek and<br />
Nitisoravut, 2005). In our study, among the four wetlands, HD is considered a terminal<br />
wetlands, whereas the other wetlands lack significant storage <strong>of</strong> water due to their regular flow.<br />
Nutrient contents <strong>of</strong> the water column can be quite unrelated to plant growth <strong>of</strong> emergent species<br />
having ready access to the abundant nutrient supply in the sediments (Wetzel, 2001). There was<br />
a noticeable reduction at the inlet and outlet sediment TP concentration for all the wetlands<br />
(Figure 8). However, reduction was less significant and highly variable for TP in the water<br />
column. Phosphorus removal in the water column is highly variable and depends on many<br />
factors such as settling <strong>of</strong> fine particles among others. This is also suggested in a study by<br />
Kadlec and Wallace (2009) that showed <strong>from</strong> 250 different free water surface wetlands that the<br />
reduction <strong>of</strong> phosphorus <strong>from</strong> inflow to outflow is unpredictable and variable.<br />
Nitrogen: Wetland treatment systems consistently reduce nitrogen concentrations for many types<br />
<strong>of</strong> wastewater. The magnitude <strong>of</strong> these reductions depends on many factors including inflow<br />
concentrations, chemical form <strong>of</strong> nitrogen, water temperature, season, organic carbon and<br />
dissolved oxygen. Regardless <strong>of</strong> the complexity in nitrogen cycling, organic nitrogen<br />
compounds are a significant fraction <strong>of</strong> the wetland plants, sediment and water column<br />
(Vymazal, 2007; Kadlec and Wallace, 2009). In our study, nitrogen uptake by plants was not<br />
significantly correlated with ambient water and sediment concentrations as suggested by poor<br />
regression coefficients for both water column and sediment. However, there were significant<br />
differences among wetlands in plant nitrogen concentrations. <strong>Different</strong> hydrological regimes<br />
observed in our wetlands might have contributed to different N and P concentrations in the<br />
plants, sediments, and water columns. Despite less nitrogen input and lower water and sediment<br />
concentrations, TN recovery through plant assimilation was remarkably high in the HD wetlands<br />
compared to PW wetlands. Better performance <strong>of</strong> the HD wetlands might be due to better<br />
vegetation management practice <strong>of</strong> using hummocks. Despite less nitrogen input and lower<br />
water and sediment concentrations, TN recovery through plant assimilation was remarkably high<br />
in the HD wetlands compared to PW wetlands. As discussed before, it may be due to the<br />
denitrifying <strong>of</strong> pond water by Henderson <strong>Water</strong> Reclamation Facility in March 2008, just prior to<br />
our sampling date (pers. comm., Debbie Van Dooremolen). Also the plants have been growing<br />
in the HD wetlands for several years and were thus growing when N concentrations in the water<br />
and sediment were much higher than during our study period.<br />
Assessment and Monitoring <strong>of</strong> Wetlands 28
A study in the Southwestern U.S. by Thullen et al. (2005) concluded that properly configured<br />
hummocks in a constructed wastewater treatment wetlands can be used to maintain a proper<br />
balance <strong>of</strong> vegetation necessary to optimize treatment function. This may also be due to less<br />
favorable conditions for nitrogen loss via other processes, such as denitrification, which in<br />
general is a major sink <strong>of</strong> nitrogen in pond systems. In the HD wetlands, the high plant density<br />
may impair this denitrification process. This argument is also supported by the findings <strong>of</strong><br />
Gebremarian and Beutel (2008) in their comparative study to understand the effectiveness <strong>of</strong><br />
nitrate removal by cattail and bulrush species. They observed that bulrush plants enhanced the<br />
nitrification process by enhancing rhizosphere oxygenation, which limits the denitrification<br />
process. Total nitrogen measured in water and sediments were higher in the LVW wetlands than<br />
in other wetlands, in our study. The source <strong>of</strong> higher nitrogen input (~14 mg/L) is the effluent<br />
coming <strong>from</strong> the wastewater discharge (~250-350 cfs) in the LVW wetlands. Whereas, the FW<br />
wetlands, which is similar to and a tributary <strong>of</strong> the LVW wetlands (in terms <strong>of</strong> hydrology, and<br />
wetlands type), receives much smaller discharge (~ 5 cfs) and has much less nitrogen in the<br />
system but higher differences between the inlet and outlet (removal). Comparing inlet with<br />
outlet data, FW wetlands were more efficient at removing nutrients <strong>from</strong> the sediment surface.<br />
Higher volume <strong>of</strong> discharge in the LVW wetlands might be too much to overcome for the<br />
existing wetlands in LVW to noticeably increase removal <strong>of</strong> nitrogen <strong>from</strong> the system. Despite a<br />
loss in total nitrogen at the outlet <strong>of</strong> the FW wetlands, cattail plants in the FW wetlands generally<br />
had lower TN concentrations than in the LVW wetlands. This may be due to a seasonal<br />
fluctuation in FW surface run<strong>of</strong>f, which ultimately limits the regeneration capacity <strong>of</strong> wetland<br />
vegetation and gives it less space to flourish. Furthermore, nutrient inputs can directly modify or<br />
change biological communities. Fluctuations in hydrological conditions induce changes in<br />
nutrient inputs. Therefore, high dependence on hydrology is particularly important in semi-arid<br />
and arid areas, where surface water levels fluctuate seasonally (Mitsch and Gosselink, 1993).<br />
4.4 Metals<br />
Metal distribution in plant tissue: Metals are essential micronutrients for plant growth, but in<br />
wastewater they may be found in concentrations that are toxic to aquatic life. Biomagnification<br />
through the food chain occurs with a number <strong>of</strong> metals (e.g., Al, As, Se, Ag, Zn, Fe, Pb, Mn, Hg,<br />
Ni, Cr, and Cu) in treatment wetlands. The accumulation <strong>of</strong> metals in plants may be short lived<br />
since a portion <strong>of</strong> the metals are released back to the system upon senescence (Kadlec and<br />
Knight 1996). Among the 29 different trace elements analyzed, As and Se were detected at all<br />
wetlands sites and were studied in more detail due to their history in the Valley watershed.<br />
Several other trace metals (e.g., Hg, Pb, Zn, Cd, Fe, and Mo) were detected in the plant tissues as<br />
well, but all were under the maximum MCL (maximum contaminant level; USEPA, 2004). The<br />
concentrations <strong>of</strong> plant tissue Pb (3-8µg/g), Fe (0.7-2.3mg/g), Ni (3-7mg/g), and Cu (0.01-0.2<br />
mg/g) measured in our wetland sites were found to be in a similar range as Mays and Edwards’<br />
(2001) natural and constructed wetlands data. There was no significant trend observed in plant<br />
tissue variation <strong>of</strong> trace metals besides As and Se for specific sites or species. As with nutrients,<br />
both cattail and bulrush species were effective bioaccumulators <strong>of</strong> these metalloid pollutants (As<br />
and Se) <strong>from</strong> the wetland systems.<br />
Our study suggested that As and Se uptake capacity was significantly higher in bulrushes than in<br />
cattails. Among the three species <strong>of</strong> bulrush, S. americanus was the most effective at As and Se<br />
uptake, followed by S. acutus and S. californicus. However, both <strong>of</strong> these latter species are also<br />
known to acquire heavy metals in their root, rhizome, and leaf tissues, as found in different<br />
Assessment and Monitoring <strong>of</strong> Wetlands 29
studies <strong>of</strong> wetlands ecosystems (Schwartz and Boyd, 1995; Cardwell et al., 2002). Similarly,<br />
below-ground plant tissues (root) had higher concentrations <strong>of</strong> both Se and As than aboveground<br />
(shoot) parts (Figure 11). Our results are comparable with the study by Vymazal et al.<br />
(2009) that found that concentrations decreased in the order <strong>of</strong> roots > rhizomes > leaf > stems<br />
for 19 different trace elements, including As and Se, for Phragmites australis plants growing in<br />
constructed wetlands with subsurface flow for treatment <strong>of</strong> municipal sewage in the Czech<br />
Republic.<br />
Metal distribution in wetlands: A number <strong>of</strong> trace metals are essential micronutrients at low<br />
concentrations, but some trace metals may occur in wastewater at concentrations that are toxic to<br />
aquatic wildlife (Hamilton, 2004). Sediment metal concentration for trace metals such as Cd,<br />
Co, Cr, Cu, Hg, Fe, Li, Mg, Ni, Pb and Zn generally showed no significant differences between<br />
the samples taken at the inlets versus those taken at the outlets for any <strong>of</strong> our wetland sites. The<br />
levels <strong>of</strong> metals that may be tolerated by sensitive organisms have been promulgated in the form<br />
<strong>of</strong> guidelines for the protection <strong>of</strong> receiving waters and associated sediments. The values<br />
measured <strong>from</strong> different metal concentrations in our wetland sites were within the threshold<br />
levels provided by Wisconsin (WDNR, 2003; U.S.EPA, 2006) in guidelines for metal<br />
concentrations in sediments and water. Plant tissue in all wetlands sites also had significant<br />
concentrations <strong>of</strong> iron (Fe) ranging <strong>from</strong> 450-1233 µg/g. Our results are consistent with the<br />
range 200-2000 µg/g dry mass reported by (Vymazal, 1998) in Chez Republic. The wetlands<br />
vegetation in the wetlands in our study was found to be quite efficient on iron uptake <strong>from</strong> the<br />
system. However the plant senescence and leaching action <strong>of</strong> iron needed to be further<br />
investigated since some studies document wetlands are net sinks for iron in most <strong>of</strong> the seasons<br />
(Batty and Younger, 2002). Molybdenum (Mo) was measured in a reasonable amount in the<br />
sediments but was not in significant amount in the plant tissue in any <strong>of</strong> the four wetlands sites.<br />
Hg and As in the PW wetlands sediment are near the probable effect concentration (PEC) and<br />
need a closer look. The concentrations are not yet under the threat level but appear close to PEC<br />
as defined by USEPA sediment quality benchmark (SQB) values (USDE, 1998). These values<br />
are being used to predict potential toxicity to sensitive ecological receptors. The water column<br />
concentrations for those elements were found to be slightly higher at the FW and PW wetlands.<br />
LVW had relatively smaller concentrations <strong>of</strong> these trace elements (Cizdziel and Zhou, 2005).<br />
Plant tissue concentrations in the four wetland sites were consistent with the ambient sediment<br />
and water column metal concentrations. Since the four wetlands sites are open to biota, they<br />
may be exposed to potentially higher levels <strong>of</strong> metals, primarily in the wetlands sediment. The<br />
removal <strong>of</strong> metals <strong>from</strong> the water column can result in storage in the sediments that is inimical to<br />
the subset <strong>of</strong> wetlands organisms that live or feed in those sediments.<br />
As is <strong>of</strong> concern in aqueous environments because it is a known human carcinogen and is<br />
chronically toxic to aquatic organisms. As concentrations in plant tissues <strong>of</strong> the four wetlands<br />
were significantly consistent with the trend in ambient concentrations in the sediments and water<br />
columns. The regression analysis showed that the arsenic in plants is significantly correlated<br />
with sediment and water column (Figure 18, 19) concentrations. Overall, the highest measured<br />
As uptake in plants was in the PW wetlands, followed by the LVW wetlands. The HD and FW<br />
wetlands had the lowest plant As concentrations. Among the four wetland sites, the PW<br />
wetlands also had the highest sediment and water column As concentrations, followed by LVW<br />
wetlands. As concentration (13.12 µg/L) measured in the water column <strong>of</strong> the PW wetlands<br />
Assessment and Monitoring <strong>of</strong> Wetlands 30
appears to exceed the drinking water standard (10 µg/L). It is thought that the As in PW is<br />
naturally occurring through the groundwater system rather than <strong>from</strong> anthropogenic sources<br />
(Cizdziel and Zhou, 2005). Sediment <strong>from</strong> the outlets <strong>of</strong> the PW and HD wetlands showed a<br />
small but significant drop in concentrations, which was not the case in the FW and LVW<br />
wetlands. The speciation <strong>of</strong> As in wetland sediment is complex because As forms a bond with<br />
organic and inorganic elements at diverse proportions (Keon et al., 2001; Fox and Doner, 2003).<br />
Se is a naturally occurring metalloid that is distributed widely in nature in most rocks and soils<br />
and usually combines with sulfide or with silver, copper, lead, and nickel minerals. Groundwater<br />
can leach Se <strong>from</strong> rocks and soil, and <strong>from</strong> agricultural and industrial waste. Some Se<br />
compounds will dissolve in water, and some will remain as solid particles (Zhang and Moore,<br />
1997; Lin and Terry, 2003). Soluble forms <strong>of</strong> Se are very mobile and may accumulate up the<br />
food chain in vegetation and animal tissue. Constructed wetlands remove Se by reduction to<br />
insoluble forms which are deposited in the sediments, by accumulation into plant tissues, and by<br />
volatilization to the atmosphere (Lin and Terry, 2003). The metalloid Se presents a challenge for<br />
environmental regulatory managers because it demonstrates a narrow concentration range<br />
between essentiality and toxicity (Lemly, 1998; Sappington, 2002). In contrast to As, among the<br />
four wetlands, Se concentrations in plant tissues were relatively consistent with water column Se<br />
concentrations than sediment concentrations (Figure 20). The PW wetlands had the highest<br />
measured Se concentrations in plant tissues and water. In contrast with their relatively lower Se<br />
plant concentrations, the FW and LVW wetlands had higher Se sediment concentrations than<br />
found in the PW and HD wetlands. However, Se concentrations in the sediments <strong>of</strong> the four<br />
wetlands (3.0 µg/g) are similar to those found in the study by Seiler, et al. (2003) in the<br />
Western U.S. Our results for plant Se concentrations in the LVW, FW, and HD wetlands are<br />
similar to those <strong>of</strong> Pollard, et al. (2007) for bulrushes and cattails <strong>from</strong> the Clark County<br />
Wetlands Park Nature Preserve and Hansen, et al. (1998) for shoot and root tissues <strong>of</strong> wetland<br />
plants in the constructed wetlands <strong>of</strong> the San Francisco Bay. Seiler, et al. (2003) provided a<br />
typical background level for plant tissue Se (1.5 µg/g) and dietary effect levels in these tissues<br />
(~3 µg/g). Se concentration in plant tissues <strong>from</strong> LVW, HD, and FW were below these levels<br />
and only plant tissues in PW exceeded (~10 µg/g) this level. The PW wetlands’ relatively high<br />
Se concentrations could pose an elevated risk for birds and wildlife <strong>of</strong> bioaccumulation and<br />
transfer to higher trophic levels in the food chain. Se concentration in the PW wetlands <strong>from</strong><br />
bulrush plant tissue, sediment and water columns is similar to Se concentration in constructed<br />
wetlands <strong>from</strong> other parts <strong>of</strong> the world (Kadlec and Wallace, 2009). They compiled Se<br />
concentrations in vegetation in treatment wetlands exposed to Se which were typically in the<br />
range <strong>of</strong> 1-20 µg/g for plants and 1-10 µg/g for sediments.<br />
Assessment and Monitoring <strong>of</strong> Wetlands 31
4.5 Temporal variation (Nutrients and Metals)<br />
The growth and senescence <strong>of</strong> wetland macrophytes commonly used for wastewater treatment all<br />
follow a seasonal pattern in different climates. New plant growth proceeds <strong>from</strong> small shoots<br />
that may be initiated as early as late summer <strong>of</strong> the preceding year for Typha species (Bernard,<br />
1999), but remain tiny and dormant over the winter season. Above-ground biomass increases<br />
rapidly in spring in warm temperate climates. Then growth tapers <strong>of</strong>f, causing above-ground<br />
biomass to peak in late summer. The size <strong>of</strong> the peak standing crop varies considerably with<br />
plant species and degree <strong>of</strong> nutrient availability (Tanner, 2001).<br />
Plant growth changes proportions <strong>of</strong> stored phosphorus in various plant parts as each season<br />
progresses. Nutrient storage in plant tissue increases in growing seasons to a maximum and<br />
decrease to a minimum after senescence <strong>of</strong> plant (Tanner, 2001). Seasonal variation was<br />
analyzed based on the seasonal data on nutrient concentration <strong>of</strong> plant tissues taken <strong>from</strong> the four<br />
wetland sites. The annual mean seasonal data <strong>from</strong> cattail and bulrush tissue nutrient<br />
concentrations were not statistically significant among three different seasons. However, there<br />
were generally higher nutrient concentrations in summer followed by spring and winter seasons<br />
for both plant species among four wetland sites. Several studies have shown that nutrient<br />
concentrations in plant biomass generally decrease over the course <strong>of</strong> the growing season (Van<br />
der Linden, 1980; Ganzert & Pfadenhauer, 1986). Several studies have explored whether<br />
seasonal changes in nutrient concentrations are indicators <strong>of</strong> nutrient limitation and found that N:<br />
P ratio is more closely related to nutrient availability rather than N or P concentration only and<br />
was a better indicator <strong>of</strong> nutrient limitation (Güsewell and Koerselman, 2002).<br />
Our data did not show any significant temporal variation in As concentrations. Other studies<br />
have found similar results (Jackson et al., 1991; Zayed et al., 1998; Mays and Edwards, 2001).<br />
They noticed the seasonal variation <strong>of</strong> As was less significant but was significantly associated<br />
with the substrate concentrations in which they are found. Also, Pollard et al. (2007) measured<br />
seasonal plant tissue Se concentration for five wetland plants (including cattails and bulrushes) in<br />
the Clark County Wetlands Park Nature Preserve. They found that the fall samples generally had<br />
higher concentrations in shoots compared to spring and summer seasons. <strong>Three</strong> <strong>of</strong> our wetlands<br />
sites (LVW, HD and PW) were somewhat similar in that winter samples (not particularly fall)<br />
generally had higher metal and nutrient concentrations in shoots for both plant types. This may<br />
be because <strong>of</strong> higher volatilization <strong>of</strong> Se in summer and spring season. It has been reported that<br />
the complexity in Se due to volatilization might cause differences in seasonal distribution and<br />
bioaccumulation in various plant tissues (Hansen et al., 1998; De Souza et al., 2000; Pollard et<br />
al., 2007).<br />
4.6 Ecosystem Function <strong>of</strong> Wetlands<br />
<strong>Comparison</strong> <strong>of</strong> annual average nutrient storage in standing biomass <strong>of</strong> cattail plants in the peak<br />
growing season showed that nutrient removal <strong>from</strong> the LVW wetlands was significantly higher<br />
than the FW wetlands. This can perhaps be attributed to a higher productivity by cattails in the<br />
LVW wetlands, and therefore more efficient nutrient removal. Total nutrient uptake potential by<br />
a particular species at particular wetlands site was not estimated because we do not have data on<br />
plant coverage on these wetlands (beyond the scope <strong>of</strong> this study), especially LVW and FW<br />
wetlands which cover a large area. However, based on our annual average nutrient storage in<br />
plants (g/m 2 /yr) and approximate estimation <strong>of</strong> the coverage in the HD and PW wetlands, we<br />
calculated that the HD and PW wetlands plants stored ~44 and ~5 tons <strong>of</strong> nitrogen/yr,<br />
Assessment and Monitoring <strong>of</strong> Wetlands 32
espectively. Similarly, the HD wetland plants sequestered ~4 tons <strong>of</strong> phosphorus/yr compared<br />
to ~0.2 tons/yr at the PW wetlands. Better ecosystem function <strong>of</strong> the HD wetlands is not only<br />
due to higher plant biomass and nutrient concentrations but also due to a larger surface area <strong>of</strong><br />
the wetlands (11634 m 2 at HD vs. 40 m 2 at PW).<br />
Metal uptake among the four wetland plants suggests that annual average metal storage by plant<br />
tissue measured as g/m 2 /yr was higher at the PW and FW wetlands compared to the HD and<br />
LVW wetlands. It appears that larger the surface area <strong>of</strong> wetlands vegetation the higher the<br />
metal accumulation and therefore higher flux suggesting that wetlands acreage is important as<br />
well. Similarly metals, especially As, Se, Fe, were efficiently taken up by plant species in all the<br />
wetland sites. Annual As and Se removal by the PW wetlands were less (
wetlands sites. Overall, this study suggests that different plant species have different capacities<br />
to take up nutrients mostly determined by ambient nutrient and hydrologic conditions. These<br />
findings have important implications for improving our ability to engineer ecological solutions to<br />
problems associated with nutrient-rich wastewater and to implement sustainable wetlands<br />
management plans.<br />
Bioaccumulation <strong>of</strong> Se leading to toxicological impact and change in aquatic communities has<br />
been intensively investigated in the Wash in recent years. Investigation <strong>of</strong> Se in tributaries,<br />
urban run<strong>of</strong>f, and rain suggested that the source <strong>of</strong> the elevated Se is likely due to groundwater<br />
seeps located within a relatively narrow geographic band on the southeast side <strong>of</strong> the Valley<br />
(Cizdziel and Zhou, 2005). Constructed and naturally created wetlands in the Valley appear to<br />
be functioning quite efficiently to uptake metalloid pollutants <strong>from</strong> the wetlands system by<br />
means <strong>of</strong> plant tissues. Bulrush species seem particularly more efficient for metals such as As<br />
and Se, compared to cattails. Also, the belowground plants for both species seemed to store<br />
metals more efficiently than above ground parts. Harvesting plant roots might be necessary for<br />
maximum removal <strong>from</strong> the treatment wetlands. Higher metal accumulation in the PW wetland<br />
plants suggested that there is a potential for wildlife exposure and may become a problem in the<br />
future. Besides the PW wetlands, none <strong>of</strong> the metals were measured under elevated<br />
concentrations with possible toxic effects. Although As and Hg concentrations were moderate in<br />
the PW and FW wetlands, regular monitoring is needed to further explore their complex<br />
distribution in wetlands ecosystem.<br />
Proper vegetation management could be utilized to enhance the bioremediation potential for Se<br />
using existing wetlands in the Wash. Better bioaccumulative property <strong>of</strong> bulrush species in the<br />
wetlands in this study might provide clues for Se removal using existing wetlands plants in these<br />
wetlands. Our data provide only a glimpse <strong>of</strong> what might be happening in the wetlands in the<br />
desert southwest using a few wetlands and a few species <strong>of</strong> plants. A more detailed and longterm<br />
(multi-year) study including many plant species will be necessary to understand the<br />
possible effect <strong>of</strong> metals and nutrients on trophic transfer in the food chain.<br />
Based on the results <strong>from</strong> the interaction <strong>of</strong> plant tissues with the water column and sediment, we<br />
can somewhat quantify and characterize the ecological efficiency <strong>of</strong> the wetlands. Cattail plants<br />
in the LVW wetlands had high standing biomass and nutrient concentrations in comparison to<br />
the FW wetlands. Although the total nutrients removed by both wetlands were not estimated, the<br />
LVW wetlands were found to be functioning more efficiently than the FW wetlands for nutrient<br />
uptake. Similarly, nutrient uptake performance <strong>of</strong> the HD wetlands appeared better than the PW<br />
wetlands. Bulrush species in the HD plants had higher standing biomass and nutrient<br />
concentrations, resulting in better ecosystem functions than the PW wetlands. Metals uptake by<br />
plant tissues among the four wetlands were relatively less significant compared to nutrients.<br />
There was some seasonal variation with higher nutrient uptake in summer seasons for all<br />
wetlands but there was not any difference for nutrient distribution in spring and winter seasons in<br />
our study. This interpretation is only based on a single year study; a long term study in the future<br />
would be necessary to provide conclusive evidence <strong>of</strong> temporal variations.<br />
Assessment and Monitoring <strong>of</strong> Wetlands 34
6.0 LITERATURE CITED<br />
Acharya, K., Kyle, M., Elser, J., 2004. Effects <strong>of</strong> stoichiometric dietary mixing on Daphnia<br />
growth and reproduction. Oecologia 138, 333-340.<br />
Anderson, C.J., Mitsch, W.J., 2005. Effect <strong>of</strong> pulsing on macrophyte productivity and nutrient<br />
uptake: A wetland mesocosm experiment, American Midland Naturalist 154, 305-319.<br />
APHA, 2005. Standard Methods for the Examination <strong>of</strong> <strong>Water</strong> and Wastewater. American Public<br />
Health Association/<strong>Water</strong> Environment Federation, Washington, D.C.<br />
Batty, L.C., Younger, P.L., 2002. Critical role <strong>of</strong> macrophytes in achieving low iron<br />
concentration in mine water treatment wetlands, Environ. Sci. Technol. 36, 3997-4002.<br />
Bernard, J.M., 1999. Seasonal growth pattern in wetland plants growing in landfill leachate. In:<br />
Mulamoottil, G., McBean, E., Rovers, F. A. (Eds.), Constructed Wetlands for the Treatment <strong>of</strong><br />
Landfill Lechate. CRC Press: Boca Raton, Florida, pp. 223-234.<br />
Brix, H., 1997. Functions <strong>of</strong> macrophytes in constructed wetland. <strong>Water</strong> Sci. Technol. 29, 71-78.<br />
Bollens, U., Güsewell, S., Klötzli, F., 2001. Vegetation changes in two Swiss fens affected by<br />
eutrophication and desiccation. Botanic Helvetica 111, 139-155.<br />
Boyd, C.E., 1978. Chemical composition <strong>of</strong> wetland plants. In: Good, R.E., Whigham, D.F.,<br />
Simpson, R.L. (Eds.), Freshwater Wetlands: Ecological Processes and Management Potential.<br />
Academic Press, New York, pp. 155-167<br />
Cardwell, A.J., Hawker, D.W., Greenway, M., 2002. Metal accumulation <strong>from</strong> aquatic<br />
macrophytes <strong>from</strong> southeast Queensland, Australia. Chemosphere 48, 653-663.<br />
Copper, P.F., Findlater, B.C., 1990. Constructed Wetlands in <strong>Water</strong> Pollution Control. (Eds),<br />
Pergamon Press, Oxford, UK. 605 pp.<br />
Cizdziel, J.V., Zhou, X., 2005. Sources and concentrations <strong>of</strong> Hg and Se in compartments within<br />
the Las Vegas Wash during period <strong>of</strong> rapid change. Environmental Monitoring and Assessment<br />
107, 81-99.<br />
Cronk, J.K., Fennessy, M.S., 2001.Wetland plants: Biology and Ecology. Lewis Publishers, Boca<br />
Raton, Florida.<br />
Cronk, J.K., Mitsch, W.J., 1994. Aquatic metabolism in four newly constructed freshwater<br />
wetlands with different hydrologic inputs. Ecological Engineering 3, 449-468.<br />
De Souza, M.P., Pilon-Smiths, E. A. H., Terry, N., 2000. The physiology and biochemistry <strong>of</strong><br />
selenium in plants. In: Raskin, I., Ensley, B.D. (Eds.), Phytomediation <strong>of</strong> toxic metals, using<br />
plants to clean up the environment. New York, USA.<br />
Assessment and Monitoring <strong>of</strong> Wetlands 35
Drizo A., Forget, C., Grace, J., Smith, K.A., 2000. Phosphate and ammonium distribution in a<br />
pilot-scale constructed wetland with horizontal subsurface flow using shale as a substrate. <strong>Water</strong><br />
Research 39, 2438-2490.<br />
Eckberg, J.R., Shanahan, S.A., 2009. Las Vegas Wash Vegetation Monitoring Report, 2008,<br />
Southern Nevada <strong>Water</strong> Authority, Las Vegas, Nevada.<br />
Friborg, T., Soegaard, H., Christensen, T. R., Lloyd, C. R., Panikov, N. S., 2003. Siberian<br />
wetlands: Where a sink is a source. Geophys. Res. Lett. 30, 21-29.<br />
Fox, P.M., Doner, H.E., 2003. Accumulation, release and solubility <strong>of</strong> arsenic, molybdenum, and<br />
vanadium in wetland sediments. Journal <strong>of</strong> Environmental <strong>Quality</strong> 32, 2428-2435.<br />
Ganzert, C., Pfadenhauer, J., 1986. Seasonal dynamics <strong>of</strong> shoot nutrients in Schoenus<br />
ferrugineus (Cyperaceae). Holarctic Ecology 9, 137-142.<br />
Garnier, E., 1998. Interspecific variation in plasticity <strong>of</strong> grasses in response to nitrogen supply.<br />
In: Cheplick, G.P. (Ed.), Polpulation Biology <strong>of</strong> Grasses. Cambridge University Press,<br />
Cambridge, pp. 155-181.<br />
Gebremarian, S.Y., Beutel, M.W., 2008. Nitrate removal and DO levels in batch wetland<br />
mesocosms: Cattail (Typha spp.) versus bulrush (Scirpus spp.). Eco.Eng.<br />
doi:10.1016/j.ecoleng.2008.06.005<br />
Greenway, M., Simpson, J.S., 1996. Artificial wetlands for wastewater treatment, water reuse<br />
and wildlife in Queensland, Australia. <strong>Water</strong>.Sci.Tech. 33, 221-229.<br />
Greenway, M., 1997. Nutrient content <strong>of</strong> wetland plants in constructed wetlands receiving<br />
municipal effluent in tropical Australia. <strong>Water</strong>.Sci.Tech. 35, 135-142.<br />
Greenway, M., Wolley, A., 2001. Changes in plant biomass and nutrient removal over 3 years<br />
in a constructed free water surface flow wetland in Cairns, Australia. Wat. Sci. Tech. 44, 303-<br />
320.<br />
Greenway, M., Bolton, K., 2002. Role <strong>of</strong> constructed Melaleuca wetlands in water pollution<br />
control in Australia. In: Treatment wetlands for water quality improvement. CH2M Hill, Canada<br />
Ltd.<br />
Greenway, M., 2003. Suitability <strong>of</strong> macrophytes for nutrient removal <strong>from</strong> surface flow<br />
constructed wetlands receiving secondary treated sewage effluent in Queensland, Australia.<br />
<strong>Water</strong> Science and Technology 48, 121-128.<br />
Greenway, M., 2005. The role <strong>of</strong> constructed wetlands in secondary effluent treatment and water<br />
reuse in subtropical and arid Australia. Ecol. Eng. 25, 501-509.<br />
Gough, L., Grace, J.B., 1998. Herbivore effects on plant species density at varying productivity<br />
levels. Ecology 79, 1586-1594.<br />
Assessment and Monitoring <strong>of</strong> Wetlands 36
Gumbricht, T., 1993. Nutrient removal processes in freshwater submersed macrophyte systems.<br />
Eco. Eng. 2, 1-30.<br />
Güsewell, S., Bollens, U., 2003. Composition <strong>of</strong> plant species mixtures grown at various N: P<br />
ratios and levels <strong>of</strong> nutrient supply. Basic and Applied Ecology 4, 435-466.<br />
Güsewell, S., Koerselman, W., 2002. Variation in nitrogen and phosphorus concentrations <strong>of</strong><br />
wetland plants. Urban & Fischer Verlag 5, 37-61.<br />
Hamilton, S.J., 2004. Review <strong>of</strong> selenium toxicity in the aquatic food chain. Science <strong>of</strong> the Total<br />
Environment 326, 1-31.<br />
Hammer, D.A., Bastion, R.K., 1989. Wetlands ecosystems: Natural water purifiers In: Hammer,<br />
D.A. (Ed.), Constructed wetlands for wastewater treatment. Lewis publishers, Chelsea,<br />
Michigan, pp. 5-20.<br />
Hansen, D., Duda, P.J., Zayed, A.,Terry, N., 1998. Selenium removal by constructed wetlands;<br />
role <strong>of</strong> biological volatilization. Environmental Science and Technology 32, 591-597.<br />
Jackson, L.J., Rasmussen, J.B., Peters, R.H., Kalff, J., 1991. Empirical relationships between the<br />
element composition <strong>of</strong> aquatic macrophytes and their underlying sediments. Biogeochemistry<br />
12, 71-86.<br />
Jensen, P.D., Krogstad, T., 2005. Design <strong>of</strong> constructed wetlands using phosphorus sorbing<br />
lightweight aggregate. In: Mander, U., Jenssen, P.D. (Eds.), Constructed wetlands for wastewater<br />
treatment in cold climates. Southampton, UK, WIT Press, pp. 259-71.<br />
Kadlec, R.H., Knight, R.L., 1996. Treatment Wetlands, Lewis Publisher, Boca Raton, FL, USA.<br />
893pp.<br />
Kadlec, R.H., 1998. Wetland utilization for management <strong>of</strong> community wastewater, 1997<br />
operation summary (March 1998). Report to Michigan Department <strong>of</strong> Natural Resources.<br />
Kadlec, R.H., 2008. The effects <strong>of</strong> wetland vegetation and morphology on nitrogen processing.<br />
Ecol. Eng. 33, 126-141.<br />
Kadlec, R.H., 2009. <strong>Comparison</strong> <strong>of</strong> free water and horizontal subsurface treatment wetlands.<br />
Ecological Engineering 35, 159-174.<br />
Kadlec, R.H., Wallace, S.D., 2009. Treatment Wetlands, Second edition, CRS Press, Boca<br />
Raton, FL. 1061 pp.<br />
Keon, N.E., Swartz, C.H., Brabander, D.J., Harvey, C., Hemond, H.F., 2001. Validation <strong>of</strong> an<br />
arsenic sequential extraction method for evaluating mobility in sediments. Environmental<br />
Science and Technology 35, 2778-2784.<br />
Klomjek, P., Nitisorvaut, S., 2005. Constucted treatment wetland; a study <strong>of</strong> eight plant species<br />
under saline conditions. Chemosphere 5, 585-593.<br />
Assessment and Monitoring <strong>of</strong> Wetlands 37
Leising, J.F., 2003. Dye traces help quantify flow at Las Vegas Wash. Southwest Hydrol. 2, 8-9.<br />
Lemly, A.D., 1998. Pathology <strong>of</strong> selenium poisoning in fish. In: Frankenberger, J., Engberg,<br />
W.T., Engberg, R.A. (Eds.), Environmental chemistry <strong>of</strong> selenium. Marcel Dekker Inc., New<br />
York, pp. 281-95.<br />
Lesage, E., Rousseau, D.P.L., Meers, E., Van de Moortel, A.M.G., Du Laing, G., Tack, F.M.G.,<br />
De Pauw, N., Verloo, M.G., 2007. Accumulation <strong>of</strong> metals in the sediment and reed biomass <strong>of</strong> a<br />
combined constructed wetland treating domestic wastewater. <strong>Water</strong> Air Soil Poll. 183, 253-264.<br />
Lieth, H., Whittaker, R.H., 1975. Primary productivity <strong>of</strong> the biosphere. Springer-Verlag: Berlin,<br />
Germany.<br />
Lijklema, L., 1994. Nutrient dynamics in shallow lakes: effects <strong>of</strong> changes in loading and role <strong>of</strong><br />
sediment-water interactions. Hydrobiologia 275, 335-348.<br />
Lin, Z., Terry, N., 2003. Selenium removal by constructed wetlands: Quantitative importance <strong>of</strong><br />
biological volatilization in the treatment <strong>of</strong> selenium laden agricultural drainage water.<br />
Enviornmental Science and Technology, 3, 606-615.<br />
LVWCC, 2000. Las Vegas Wash Comprehensive Adaptive Management Plan, Las Vegas Wash<br />
Coordination Committee, Jan. 2000. http://www.lvwash.org/resources/docs/lvwcamp.html<br />
LVWCC, 2009. Las Vegas Wash Coordinating Committee website, Retrieved <strong>from</strong><br />
http://www.lvwash.org on 19 th December 2009.<br />
Mays, P.A., Edwards, G.S., 2001. <strong>Comparison</strong> <strong>of</strong> heavy metal accumulation in a natural wetland<br />
and constructed wetlands receiving acid mine drainage. Ecological Engineering 16, 487-500.<br />
McKinstry, M. C., Hubert, W. A., Anderson, S. H. (Eds.), 2004. Wetland and Riparian Areas in<br />
the Intermountain West: Ecology and Management. University <strong>of</strong> Texas Press, Austin, Texas,<br />
USA. 335 pp.<br />
Meyer, J.L., Edwards, R.T. 1990. Ecosystem metabolism and turnover <strong>of</strong> organic carbon along a<br />
black water river continuum. Ecology 71, 668-677.<br />
Mitsch, W.J., Gosselink, J.G., 1993. Wetlands. Second Edition, Van Nostrand Reinhold<br />
Company, New York.<br />
Mitsch, W.J., Gosselink, J.G., 2000. Wetlands. Third Edition, Van Nostrand Reinhold Company,<br />
New York.<br />
Moss, B., 1998. The E numbers <strong>of</strong> eutrophication – errors, ecosystem effects, economics,<br />
eventualities, environment and education. Wat.Sci.Tech. 37, 75-84.<br />
Nolte and Associates, 1998. Sacramento Regional Wastewater Treatment Plant Demonstration<br />
Wetlands Project: Five Year Summary Report 1994-1998, Report to Sacramento Regional<br />
County Sanitation District, http://www.srcsd.com/cw.html.<br />
Assessment and Monitoring <strong>of</strong> Wetlands 38
Peer, W.A., Baxter, I.R., Richards, E.L., Freeman, J.L., Murphy, A.S., 2005. Phytoremediation<br />
and hyperaccumulator plants. Tropics in Current Genetics 14, 299-340.<br />
Pollard, J., Cizdiel, J., Stave, K., Reid, M., 2007. Selenium concentrations in water and plant<br />
tissues <strong>of</strong> a newly formed arid wetland in Las Vegas, Nevada. Environ. Monit. Assess.135, 447-<br />
457.<br />
Reddy, K.R., Sacco, P.D., Graetz, D.A., Campbell, K.L., Porter, K.M., 1983. Effect <strong>of</strong> aquatic<br />
macrophytes on physic-chemical parameters <strong>of</strong> agricultural drainage water. Journal <strong>of</strong> Aquatic<br />
Plant Management 21, 1-7.<br />
Reddy, K.R., De Busk, W.F., 1987. Nutrient storage capabilities <strong>of</strong> aquatic and wetland plants.<br />
In: Reddy, K.R., Smith, W.H. (Eds.), Aquatic Plants for <strong>Water</strong> Treatment. Magnolia Publishing,<br />
Orlando, Florida, pp. 337-357.<br />
Reginato, M., Piechota, T.C., 2004. Nutrient contribution <strong>of</strong> nonpoint source run<strong>of</strong>f in the Las<br />
Vegas Valley, Journal <strong>of</strong> the American <strong>Water</strong> Resources Association 40, 1537-1551.<br />
Richardson, C.J., Vymazal, J. 2000. Sampling macrophytes in wetlands. In: Rader, R.B., Barter,<br />
D.P., Wissinger, S.A. (Eds.), Bioassessment and Mangement <strong>of</strong> North American Freshwater<br />
Wetlands. John Wiley & Sons, New York, pp. 297-337.<br />
Sappington, K.G., 2002. Development <strong>of</strong> aquatic life criteria for selenium: a regulatory<br />
perspective on critical issues and research needs. Aquat.Toxicol. 57, 101-113.<br />
Schwartz, M.E., Boyd, C.E., 1995. Constructed wetlands for treatment <strong>of</strong> channel catfish pond<br />
effluents. The Progressive Fish-Culturist 57, 255-266.<br />
Seiler, R.L., Skorupa, J.P., Naftz, D.L., Moland, B.T., 2003. Irrigation induced contamination <strong>of</strong><br />
water, sediment and biota in the western United States: Synthesis <strong>of</strong> data <strong>from</strong> the National<br />
Irrigation <strong>Water</strong> <strong>Quality</strong> Program. USGS Pr<strong>of</strong>essional Paper 1655.<br />
Sim, C.H., Yus<strong>of</strong>f, M.K., Shutes, B., Ho, S.C., Mansor, M., 2008. Nutrient removal in a pilot and<br />
full scale constructed wetland Putrajaya city, Malaysia. J. Environ. Mgmt. 88, 307-317.<br />
SNWA, 2004. What is the “Wash” Las Vegas Wash Coordination Committee, Las Vegas,<br />
Nevada, Retrieved <strong>from</strong> http://www.lvwash.org/wash/main<br />
Sterner, R.W., Elser, J.J., 2002. Ecological Stoichiometry: The Biology <strong>of</strong> Elements <strong>from</strong><br />
Molecules to the Biosphere. Princeton University Press, Princeton, NJ.<br />
Tanner, C., 1996. Plants for constructed wetland treatment systems: A comparison <strong>of</strong> the growth<br />
and nutrient uptake <strong>of</strong> eight emergent species. Ecological Engineering 7, 59-83.<br />
Tanner, C., 2001. Growth and nutrient dynamics <strong>of</strong> s<strong>of</strong>t-stem bulrush in constructed wetlands<br />
treating nutrient-rich wastewaters. Wetlands Ecology and Management 9, 49-73.<br />
Assessment and Monitoring <strong>of</strong> Wetlands 39
Thormann, M.N., Bayley, S.E., 1997. Aboveground plant production and nutrient content <strong>of</strong> the<br />
vegetation in six peatlands in Alberta, Canada. Plant Ecology 131, 1-16.<br />
Toet, S., Bouwman, M., Cevall, A., Verhoeven, J., 2005. Nutrient removal through autumn<br />
harvest <strong>of</strong> Phargmites australis and Typha latifolia shoots in relation to nutrient loading in a<br />
wetland system used for polishing sewage treatment plant effluent. J Environ Sci. Health 40,<br />
1133-1156.<br />
Thiebaut, G., Guerold, F., Muller, S., 2002. Are trophic and diversity indices based on<br />
macrophyte communities pertinent tools to monitor water quality <strong>Water</strong> Research 36, 3602-<br />
3610.<br />
Thullen, J.S., Sartoris, J.J., Nelson, S.M., 2005. Managing vegetation in surface-flow wastewater<br />
treatment wetlands for optimal treatment performance. Eco. Eng. 25, 583-593.<br />
USDE, 1998. A guide to the ORNL ecotoxicological screening benchmarks: Background,<br />
development and application. U.S. Department <strong>of</strong> Energy, Environmental Sciences Division,<br />
Publication No. 4783. http://homer.ornl.gov/nuclearsafety/env/guidance/risk/benchmk.pdf<br />
U.S. EPA, 2000. Consturcted wetlands treatment <strong>of</strong> municipal wastewaters, EPA 625/r-99/010,<br />
U.S.EPA Office <strong>of</strong> Research and Development, Washington D.C.<br />
USEPA, 2004. Wate <strong>Quality</strong> Criteria, Ambient Aquatic Life, Selenium, U.S. Environmental<br />
Protection Agency, Washington D.C. www.epa.gov/ost/selenium/factsheet.html<br />
USEPA, 2004. <strong>Water</strong> <strong>Quality</strong> Criteria. U.S. Department <strong>of</strong> Environmental Protection Agency,<br />
Washington, D.C. http://www.epa.gov/waterscience/criteria/wqctable/index.htm<br />
U.S. EPA, 2006. Current National Recommended <strong>Water</strong> <strong>Quality</strong> Citeria, Available at<br />
http://www.epa.gov/waterscience/criteria/wqcriteia.html, U.S.EPA Office <strong>of</strong> <strong>Water</strong> and Office <strong>of</strong><br />
Science and Technology, Washington D.C.<br />
Van der Linden, M., 1980. Nitrogen economy <strong>of</strong> reed vegetation in the Zuidelijk Flevoland<br />
Polder, Distribution <strong>of</strong> nitrogen among shoots and rhizomes during the growing season and loss<br />
<strong>of</strong> nitrogen due to fire management. Acta Oecologica/Oecologia Plantarum 1, 219-230.<br />
Vymazal, J., Brix, H., Copper, P.F., Green, M.B., Haberl, R. (Eds.), 1998. Constructed Wetlands<br />
for Wastewater Treatment in Europe. Backhuys Publishers, Leiden, The Netherlands, 366pp.<br />
Vymazal, J., Kràsa, P., 2005. Heavy metals budget for constructed wetland treating municipal<br />
sewage. In: Vymazal, J. (Ed.), Natural and Constructed Wetlands: Nutrients, Metals and<br />
Management. Backhuys Publishers, Leiden, The Netherlands, pp. 135-142.<br />
Vymazal, J., 2006. Constructed wetlands with emergent macrophyte: From experiments to a high<br />
quality treatment technology. In: Dias, V., Vymazal, J. (Eds.), Proceedings <strong>of</strong> the 10 th<br />
International Conferences on Wetland Systems for <strong>Water</strong> Pollution Control. Lisbon, Portugal,<br />
pp. 3-27.<br />
Assessment and Monitoring <strong>of</strong> Wetlands 40
Vymazal, J., 2007. Removal <strong>of</strong> nutrients in various types <strong>of</strong> constructed wetlands. Sci.Total<br />
Environ. 380, 45-65.<br />
Vymazal, J., Kröpfelová, L., Švehla, J., Chrastny,V., Štíchová, J., 2009. Trace elements in<br />
Phragmites australis growing in constructed wetlands for treatment <strong>of</strong> municipal wastewater.<br />
Ecol.Eng. 35, 303-309.<br />
Wetzel, R.G., 2001. Limnology, Lake and River Ecosystems, Third edition, Academic press,<br />
California, USA.<br />
Wisconsin Department <strong>of</strong> Natural Resources (WDNR), 2003. Consensus Based Sediment<br />
<strong>Quality</strong> Guidelines, Report WT- 732, Wisconsin Department <strong>of</strong> Natural Resources: Madison,<br />
Wisconsin.<br />
Wolverton, B.C., McDonald, R.C., 1979. Upgrading Facultative Wastewater Lagoons with<br />
Vascular Aquatic Plants. Journal <strong>of</strong> <strong>Water</strong> Pollution Control Federation 51, 305-313.<br />
Wu, L., 2004. Review <strong>of</strong> 15 years <strong>of</strong> research on ecotoxicology and remediation <strong>of</strong> land<br />
contaminated by agricultural drainage sediment rich in selenium. Ecotoxicology and<br />
Environmental Safety 57, 257-269.<br />
Yang, Q., Chen, Z. H., Zhao, J. G., Gu, B. H., 2007. Contaminant removal <strong>of</strong> domestic<br />
wastewater by constructed wetlands: Effects <strong>of</strong> plant species. Integrative Plant Biology 49, 437-<br />
446.<br />
Zayed, A., Gowthaman, S., Terry, N., 1998. Phytoaccumulation <strong>of</strong> trace elements by wetland<br />
plants: 1. Duckweed. J. Environ. Qual. 27, 715-721.<br />
Zhang, Y., Moore, J.N., 1997. Reduction potential <strong>of</strong> selenate in wetland sediment. Journal <strong>of</strong><br />
Environmental <strong>Quality</strong> 32, 910-916.<br />
Zhang, Y., Frankenberger, W.T., 2002. Determination <strong>of</strong> selenium fractionation and speciation<br />
in wetland sediments by parallel extraction. Int. J. Environ. Anal. Chem. 83, 315-326.<br />
Zhang, Z., Rengel, Z., Meney, K., 2007. Interactive effects <strong>of</strong> nitrogen and phosphorus loadings<br />
on nutrient removal <strong>from</strong> simulated wastewater using Schoenoplectus validus in wetland<br />
microcosms. Chemosphere 72, 1823-182.<br />
Zhonghua, J., Luo, W., 2006. Modeling net water requirements for wetlands in semi-arid<br />
regions. <strong>Water</strong> Resources Research Institute, Xian University <strong>of</strong> Technology, China.<br />
Zhou, X., Peggy, R., Kimberly, Z., 2004. Las Vegas Wash Monitoring and Chaaracterization<br />
Study: Results for <strong>Water</strong> <strong>Quality</strong> in the Wash and Tributaries, Southern Nevada <strong>Water</strong><br />
Authority, Las Vegas, Nevada.<br />
Zhou, X., Van Dooremolen, D.M., 2007. Demonstration Wetlands Study in the City <strong>of</strong><br />
Henderson <strong>Water</strong> Reclamation Facility, Final Report, Southern Nevada <strong>Water</strong> Authority, Las<br />
Vegas, Nevada.<br />
Assessment and Monitoring <strong>of</strong> Wetlands 41
Appendix A<br />
Photographs showing a) sample collection, processing and analysis and<br />
b) plant types found at four wetlands
Appendix A (a): (1) Field sampling and laboratory processing <strong>of</strong> plants and sediments at the<br />
Ecological Engineering Laboratory, Desert Research Institute, Las Vegas.<br />
1 2 3<br />
4 5 6<br />
Appendix A (b): Various plant species found at the Las Vegas Wash (LVW), Flamingo Wash<br />
(FW), Henderson Demonstration (HD) and Pittman Wash (PW) wetlands in the Valley.
Appendix B<br />
Total phosphorus data <strong>from</strong> plant tissues, water columns and sediments at four wetland sites
Appendix B1 - Plant tissue total phosphorous (TP) <strong>from</strong> the Las Vegas Wash (LVW), Flamingo<br />
Wash (FW), Demonstration Wetland at the City <strong>of</strong> Henderson <strong>Water</strong> Reclamation Facility (HD)<br />
and Pittman Wash Pilot Wetlands (PW) wetlands.<br />
Site Season<br />
Plant<br />
TP (%)<br />
Sample ID<br />
Species<br />
Shoot Root Total<br />
LVW Winter Typha P-1 0.043 0.082 0.063<br />
LVW Winter Typha P-2 0.052 0.061 0.057<br />
LVW Winter Typha P-3 0.045 0.065 0.055<br />
LVW Winter Typha P-4 0.049 0.054 0.052<br />
LVW Winter Typha P-5 0.061 0.081 0.071<br />
LVW Winter Typha P-6 0.051 0.071 0.061<br />
LVW Winter Typha P-7 0.032 0.049 0.041<br />
LVW Winter Typha P-8 0.046 0.052 0.049<br />
LVW Winter Typha P-9 0.053 0.067 0.060<br />
LVW Winter Typha P-10 0.042 0.045 0.044<br />
LVW Winter Typha P-11 0.053 0.061 0.057<br />
LVW Winter Typha P-12 0.053 0.078 0.066<br />
LVW Winter Typha P-13 0.046 0.049 0.048<br />
LVW Winter Typha P-14 0.042 0.083 0.063<br />
LVW Spring Typha P-1 0.070 0.068 0.069<br />
LVW Spring Typha P-2 0.074 0.072 0.073<br />
LVW Spring Typha P-3 0.047 0.053 0.050<br />
LVW Spring Typha P-4 0.042 0.059 0.051<br />
LVW Spring Typha P-5 0.023 0.057 0.040<br />
LVW Spring Typha P-6 0.056 0.054 0.055<br />
LVW Spring Typha P-7 0.070 0.098 0.084<br />
LVW Spring Typha P-8 0.058 0.067 0.063<br />
LVW Spring Typha P-9 0.033 0.088 0.061<br />
LVW Spring Typha P-10 0.046 0.071 0.059<br />
LVW Spring Typha P-11 0.036 0.073 0.055<br />
LVW Spring Typha P-12 0.042 0.052 0.047<br />
LVW Spring Typha P-13 0.034 0.133 0.084<br />
LVW Spring Typha P-14 0.039 0.136 0.088<br />
LVW Spring Typha P-15 0.048 0.065 0.057<br />
LVW Spring Typha P-16 0.028 0.056 0.042<br />
LVW Summer Typha P-1 0.084 0.139 0.112<br />
LVW Summer Typha P-2 0.089 0.157 0.123<br />
LVW Summer Typha P-3 0.116 0.170 0.143<br />
LVW Summer Typha P-4 0.103 0.148 0.126<br />
LVW Summer Typha P-6 0.073 0.145 0.109
Site Season<br />
Plant<br />
TP (%)<br />
Sample ID<br />
Species<br />
Shoot Root Total<br />
LVW Summer Sch-cal P-7 0.082 0.224 0.153<br />
LVW Summer Sch-cal P-9 0.082 0.259 0.171<br />
HD Winter Sch-ac P-1 0.048 0.087 0.068<br />
HD Winter Sch-ac P-2 0.044 0.083 0.064<br />
HD Winter Sch-am P-3 0.049 0.084 0.067<br />
HD Winter Sch-am P-4 0.063 0.076 0.070<br />
HD Winter Sch-cal P-5 0.061 0.089 0.075<br />
HD Winter Sch-cal P-6 0.069 0.079 0.074<br />
HD Winter Sch-cal P-7 0.086 0.088 0.087<br />
HD Winter Sch-cal P-8 0.066 0.076 0.071<br />
HD Spring Sch-ac P-1 0.169 0.205 0.187<br />
HD Spring Sch-ac P-2 0.120 0.170 0.145<br />
HD Spring Sch-am P-3 0.068 0.077 0.073<br />
HD Spring Sch-am P-4 0.064 0.650 0.357<br />
HD Spring Sch-cal P-5 0.060 0.171 0.116<br />
HD Spring Sch-cal P-6 0.056 0.019 0.038<br />
HD Spring Sch-cal P-7 0.069 0.126 0.098<br />
HD Spring Sch-cal P-8 0.075 0.123 0.099<br />
HD Spring Sch-cal P-9 0.086 0.153 0.120<br />
HD Spring Sch-cal P-10 0.084 0.169 0.127<br />
HD Spring Typha P-11 0.070 0.094 0.082<br />
HD Spring Typha P-12 0.060 0.097 0.079<br />
HD Spring Typha P-13 0.064 0.101 0.083<br />
HD Spring Typha P-14 0.071 0.105 0.088<br />
HD Spring Typha P-15 0.056 0.093 0.075<br />
HD Spring Typha P-16 0.052 0.091 0.072<br />
HD Summer Typha P-1 0.067 0.118 0.093<br />
HD Summer Typha P-2 0.082 0.138 0.110<br />
HD Summer Typha P-3 0.057 0.113 0.085<br />
HD Summer Typha P-4 0.091 0.146 0.119<br />
HD Summer Sch-cal P-5 0.188 0.225 0.207<br />
HD Summer Sch-cal P-6 0.229 0.251 0.240<br />
HD Summer Sch-cal P-7 0.143 0.179 0.161<br />
HD Summer Sch-cal P-8 0.155 0.186 0.171<br />
PW Winter Sch-ac P-1 0.015 0.020 0.018<br />
PW Winter Sch-ac P-2 0.017 0.022 0.020<br />
PW Winter Sch-am P-4 0.015 0.030 0.023
Site Season<br />
Plant<br />
TP (%)<br />
Sample ID<br />
Species<br />
Shoot Root Total<br />
PW Winter Sch-am P-6 0.013 0.016 0.015<br />
PW Winter Sch-cal P-7 0.022 0.024 0.023<br />
PW Winter Sch-cal P-8 0.018 0.020 0.019<br />
PW Spring Sch-ac P-1 0.024 0.030 0.027<br />
PW Spring Sch-ac P-2 0.019 0.028 0.024<br />
PW Spring Sch-am P-3 0.016 0.027 0.022<br />
PW Spring Sch-am P-4 0.029 0.030 0.030<br />
PW Spring Sch-cal P-5 0.039 0.048 0.044<br />
PW Spring Sch-cal P-6 0.056 0.058 0.057<br />
PW Spring Sch-cal P-7 0.031 0.048 0.040<br />
PW Spring Sch-cal P-8 0.038 0.047 0.043<br />
PW Summer Sch-am P-1 0.006 0.017 0.012<br />
PW Summer Sch-am P-2 0.009 0.030 0.020<br />
PW Summer Sch-am P-3 0.021 0.017 0.019<br />
PW Summer Sch-am P-4 0.018 0.024 0.021<br />
PW Summer Sch-am P-5 0.103 0.078 0.091<br />
PW Summer Sch-am P-6 0.078 0.082 0.080<br />
PW Summer Sch-am P-7 0.039 0.089 0.064<br />
PW Summer Sch-am P-8 0.043 0.063 0.053<br />
PW Summer Sch-am P-9 0.087 0.047 0.067<br />
PW Summer Sch-am P-10 0.091 0.061 0.076<br />
PW Summer Sch-am P-11 0.087 0.059 0.073<br />
PW Summer Sch-am P-12 0.091 0.064 0.078<br />
PW Summer Sch-am P-13 0.050 0.097 0.074<br />
PW Summer Sch-am P-14 0.035 0.069 0.052<br />
PW Summer Sch-am P-15 0.039 0.047 0.043<br />
PW Summer Sch-am P-16 0.041 0.059 0.050<br />
PW Summer Sch-am P-17 0.043 0.054 0.049<br />
PW Summer Sch-am P-18 0.095 0.032 0.064<br />
PW Summer Sch-am P-19 0.041 0.060 0.051<br />
PW Summer Sch-am P-20 0.047 0.049 0.048<br />
PW Summer Sch-am P-21 0.077 0.068 0.073<br />
PW Summer Sch-am P-22 0.076 0.082 0.079<br />
PW Summer Sch-cal P-23 0.029 0.048 0.039<br />
PW Summer Sch-cal P-24 0.046 0.048 0.047<br />
PW Summer Sch-cal P-25 0.021 0.038 0.030<br />
PW Summer Sch-cal P-29 0.049 0.051 0.05
Site Season<br />
Plant<br />
TP (%)<br />
Sample ID<br />
Species<br />
Shoot Root Total<br />
PW Summer Sch-cal P-28 0.04 0.04 0.04<br />
PW Summer Sch-cal P-30 0.02 0.07 0.05<br />
PW Summer Sch-cal P-26 0.02 0.04 0.03<br />
PW Summer Sch-cal P-31 0.02 0.05 0.03<br />
PW Summer Sch-cal P-32 0.02 0.05 0.03<br />
PW Summer Sch-cal P-33 0.07 0.07 0.07<br />
PW Summer Sch-cal P-34 0.07 0.06 0.06<br />
PW Summer Sch-cal P-35 0.03 0.05 0.04<br />
PW Summer Sch-cal P-36 0.02 0.06 0.04<br />
PW Summer Sch-cal P-37 0.03 0.07 0.05<br />
PW Summer Sch-cal P-38 0.03 0.08 0.06<br />
PW Summer Sch-cal P-39 0.03 0.04 0.04<br />
PW Summer Sch-cal P-40 0.03 0.07 0.05<br />
PW Summer Typha P-41 0.06 0.07 0.07<br />
PW Summer Typha P-42 0.07 0.05 0.06<br />
PW Summer Typha P-43 0.08 0.07 0.08<br />
PW Summer Typha P-44 0.06 0.05 0.06<br />
PW Summer Typha P-45 0.05 0.04 0.04<br />
FW Spring Typha P-1 0.02 0.04 0.03<br />
FW Spring Typha P-2 0.02 0.04 0.03<br />
FW Spring Typha P-3 0.02 0.02 0.02<br />
FW Spring Typha P-4 0.02 0.01 0.02<br />
FW Spring Typha P-5 0.02 0.02 0.02<br />
FW Spring Typha P-6 0.02 0.03 0.02<br />
FW Summer Typha P-1 0.05 0.10 0.07<br />
FW Summer Typha P-2 0.05 0.10 0.07<br />
FW Summer Typha P-3 0.06 0.08 0.07<br />
FW Summer Typha P-4 0.04 0.08 0.06<br />
FW Summer Typha P-5 0.05 0.11 0.08<br />
FW Summer Typha P-6 0.05 0.10 0.07<br />
FW Summer Typha P-7 0.05 0.08 0.06<br />
FW Summer Typha P-8 0.04 0.09 0.06<br />
FW Summer Typha P-9 0.07 0.08 0.08<br />
FW Summer Typha P-10 0.08 0.08 0.08<br />
Note: Sch-cal: Schoenoplectus californicus, Sch-am: Schoenoplectus americanus, Sch-ac:<br />
Schoenoplectus acutus and Typha: Typha domingensis
Appendix B2- <strong>Water</strong> column total phosphorus (mg/L) <strong>from</strong> the Las Vegas Wash (LVW),<br />
Flamingo Wash (FW), Demonstration Wetland at the City <strong>of</strong> Henderson <strong>Water</strong> Reclamation<br />
Facility (HD) and Pittman Wash Pilot Wetlands (PW) wetlands.<br />
TP (mg/L)<br />
Site<br />
Location<br />
SNWA<br />
Location<br />
Sampling<br />
Date<br />
<strong>Water</strong><br />
Column<br />
LVW Inlet LW 6.85 Oct-07 0.160<br />
LVW Inlet LW 6.85 Nov-07 0.120<br />
LVW Inlet LW 6.85 Dec-07 0.120<br />
LVW Inlet LW 6.85 Jan-07 0.094<br />
LVW Inlet LW 6.85 Feb-07 0.130<br />
LVW Inlet LW 6.85 Mar-07 0.093<br />
LVW Inlet LW 6.85 Apr-07 0.160<br />
LVW Inlet LW 6.85 Feb-08 0.084<br />
LVW Inlet LW 6.85 Mar-08 0.080<br />
LVW Inlet LW 6.85 Apr-08 0.130<br />
LVW Outlet LW 5.9 Feb-07 0.100<br />
LVW Outlet LW 5.9 Mar-07 0.150<br />
LVW Outlet LW 5.9 Apr-07 0.130<br />
LVW Outlet LW 5.9 Feb-08 0.140<br />
LVW Outlet LW 5.9 Mar-08 0.140<br />
LVW Inlet LW 5.9 May-07 0.150<br />
LVW Inlet LW 5.9 Jun-07 0.130<br />
LVW Inlet LW 5.9 Jul-07 0.120<br />
LVW Inlet LW 5.9 Aug-07 0.110<br />
LVW Outlet LW 5.9 May-07 0.150<br />
LVW Outlet LW 5.9 Jun-07 0.140<br />
LVW Outlet LW 5.9 Jul-07 0.130<br />
LVW Outlet LW 5.9 Aug-07 0.120<br />
HD Inlet HD1 Nov-08 1.610<br />
HD Inlet HD1 Dec-08 0.840<br />
HD Inlet HD1 Nov-07 0.600<br />
HD Inlet HD1 Dec-07 0.920<br />
HD Outlet HD4 Nov-08 1.120<br />
HD Outlet HD4 Dec-08 0.810<br />
HD Outlet HD4 Nov-07 0.950<br />
HD Outlet HD4 Dec-07 0.850<br />
HD Inlet HD1 Jan-07 1.020<br />
HD Inlet HD1 Feb-07 2.010<br />
HD Inlet HD1 Mar-07 0.940<br />
HD Inlet HD1 Apr-07 0.560
Site<br />
Location<br />
SNWA<br />
Location<br />
Sampling<br />
Date<br />
TP (mg/L)<br />
<strong>Water</strong><br />
Column<br />
HD Outlet HD4 Jan-07 1.830<br />
HD Outlet HD4 Feb-07 3.450<br />
HD Outlet HD4 Mar-07 4.130<br />
HD Inlet HD1 May-07 1.120<br />
HD Inlet HD1 Jun-07 0.370<br />
HD Inlet HD1 Jul-07 1.220<br />
HD Inlet HD1 Aug-07 0.510<br />
HD Outlet HD4 May-07 2.540<br />
HD Outlet HD4 Jun-07 1.290<br />
HD Outlet HD4 Jul-07 0.860<br />
HD Outlet HD4 Aug-07 2.620<br />
PW Inlet PW-Inlet Nov-07 0.038<br />
PW Inlet PW-Inlet Dec-07 0.045<br />
PW Outlet PW-Outlet Nov-07 0.033<br />
PW Outlet PW-Outlet Dec-07 0.033<br />
PW Inlet PW-Inlet Jan-07 0.160<br />
PW Inlet PW-Inlet Feb-07 0.096<br />
PW Inlet PW-Inlet Mar-07 0.034<br />
PW Inlet PW-Inlet Jan-08 0.110<br />
PW Outlet PW-Outlet Jan-07 0.025<br />
PW Outlet PW-Outlet Feb-07 0.040<br />
PW Outlet PW-Outlet Mar-07 0.072<br />
PW Inlet PW-Inlet May-07 0.041<br />
PW Inlet PW-Inlet Jun-07 0.110<br />
PW Outlet PW-Outlet May-07 0.030<br />
PW Outlet PW-Outlet Jun-07 0.030<br />
FW Inlet TW-DRI Jan-07 0.070<br />
FW Inlet TW-DRI Feb-07 0.020<br />
FW Inlet TW-DRI Mar-07 0.030<br />
FW Inlet TW-DRI Jan-08 0.010<br />
FW Outlet FW-0 Jan-07 0.020<br />
FW Outlet FW-0 Feb-07 0.060<br />
FW Outlet FW-0 Mar-07 0.030<br />
FW Outlet FW-0 Jan-08 0.020<br />
FW Inlet TW-DRI May-07 0.130<br />
FW Inlet TW-DRI Jun-07 0.110<br />
FW Inlet TW-DRI Jul-07 0.080<br />
FW Inlet TW-DRI Aug-07 0.050
Site<br />
Location<br />
SNWA<br />
Location<br />
Sampling<br />
Date<br />
TP (mg/L)<br />
<strong>Water</strong><br />
Column<br />
FW Outlet FW-0 May-07 0.010<br />
FW Outlet FW-0 Jun-07 0.020<br />
FW Outlet FW-0 Jul-07 0.030<br />
FW Outlet FW-0 Aug-07 0.050<br />
FW Inlet TW-DRI Nov-07 0.050<br />
FW Inlet TW-DRI Dec-07 0.060
Appendix B3 - Sediment total phosphorus (TP) <strong>from</strong> the Las Vegas Wash (LVW), Flamingo<br />
Wash (FW), Demonstration Wetland at the City <strong>of</strong> Henderson <strong>Water</strong> Reclamation Facility (HD)<br />
and Pittman Wash Pilot Wetlands (PW) wetlands.<br />
Site Season Location<br />
TP (%)<br />
Sediment<br />
LVW Winter 08 Inlet 0.048<br />
LVW Winter 08 Inlet 0.045<br />
LVW Winter 08 Inlet 0.044<br />
LVW Winter 08 Inlet 0.042<br />
LVW Spring 09 Outlet 0.036<br />
LVW Spring 09 Outlet 0.038<br />
LVW Spring 09 Outlet 0.058<br />
LVW Spring 09 Outlet 0.056<br />
LVW Summer 09 Outlet 0.049<br />
LVW Summer 09 Outlet 0.047<br />
LVW Summer 09 Outlet 0.056<br />
LVW Summer 09 Inlet 0.057<br />
HD Winter 08 Inlet 1.610<br />
HD Winter 08 Inlet 0.840<br />
HD Winter 08 Inlet 0.600<br />
HD Winter 08 Inlet 0.920<br />
HD Winter 08 Inlet 1.120<br />
HD Winter 08 Inlet 0.810<br />
HD Winter 08 Outlet 0.950<br />
HD Winter 08 Outlet 0.850<br />
HD Spring 09 Outlet 1.020<br />
HD Spring 09 Outlet 2.010<br />
HD Spring 09 Outlet 0.940<br />
HD Spring 09 Inlet 0.560<br />
HD Spring 09 Inlet 1.830<br />
HD Spring 09 Inlet 3.450<br />
HD Spring 09 Inlet 4.130<br />
HD Spring 09 Outlet 1.800<br />
HD Summer 09 Outlet 1.120<br />
HD Summer 09 Outlet 0.370<br />
HD Summer 09 Inlet 1.290<br />
HD Summer 09 Outlet 1.220<br />
HD Summer 09 Inlet 0.510<br />
HD Summer 09 Inlet 0.860<br />
HD Summer 09 Outlet 2.620<br />
PW Winter 08 Outlet 0.030
Site Season Location<br />
TP (%)<br />
Sediment<br />
PW Winter 08 Outlet 0.025<br />
PW Winter 08 Outlet 0.031<br />
PW Winter 08 Inlet 0.026<br />
PW Spring 09 Inlet 0.041<br />
PW Spring 09 Inlet 0.042<br />
PW Spring 09 Inlet 0.037<br />
PW Spring 09 Outlet 0.034<br />
PW Summer 09 Outlet 0.054<br />
PW Summer 09 Outlet 0.057<br />
PW Summer 09 Outlet 0.052<br />
PW Summer 09 Inlet 0.051<br />
FW Spring 09 Inlet 0.041<br />
FW Spring 09 Inlet 0.044<br />
FW Spring 09 Inlet 0.019<br />
FW Spring 09 Outlet 0.016<br />
FW Summer 09 Outlet 0.021<br />
FW Summer 09 Outlet 0.034<br />
FW Summer 09 Outlet 0.020<br />
FW Summer 09 Inlet 0.013<br />
FW Winter 08 Inlet 0.021<br />
FW Winter 08 Inlet 0.027<br />
FW Winter 08 Inlet 0.021<br />
FW Winter 08 Outlet 0.014
Appendix C<br />
Total nitrogen data <strong>from</strong> plant tissues, water column and sediment at four wetland sites
Appendix C1 - Plant tissue total nitrogen (TN) <strong>from</strong> the Las Vegas Wash (LVW), Flamingo<br />
Wash (FW), Demonstration Wetland at the City <strong>of</strong> Henderson <strong>Water</strong> Reclamation Facility (HD)<br />
and Pittman Wash Pilot Wetlands (PW) wetlands.<br />
Site Season Plant Plant ID<br />
TN (%)<br />
Shoot Root Total<br />
LVW Spring Typha P-1 1.77 1.20 1.48<br />
LVW Spring Typha P-1 1.68 1.25 1.46<br />
LVW Spring Typha P-2 1.81 1.12 1.46<br />
LVW Spring Typha P-2 1.71 1.60 1.65<br />
LVW Spring Typha P-3 1.40 1.12 1.26<br />
LVW Spring Typha P-3 1.40 1.05 1.22<br />
LVW Spring Typha P-3 0.94 0.84 0.89<br />
LVW Spring Typha P-3 0.86 0.73 0.79<br />
LVW Spring Typha P-5 1.90 1.30 1.60<br />
LVW Spring Typha P-5 1.88 1.35 1.61<br />
LVW Spring Typha P-5 1.88 1.14 1.51<br />
LVW Spring Typha P-6 1.69 1.21 1.45<br />
LVW Spring Typha P-6 1.69 1.24 1.46<br />
LVW Spring Typha P-6 0.89 0.51 0.70<br />
LVW Spring Typha P-6 0.96 1.15 1.05<br />
LVW Spring Typha P-7 1.56 1.95 1.75<br />
LVW Spring Typha P-8 1.83 1.44 1.63<br />
LVW Spring Typha P-8 2.74 1.03 1.88<br />
LVW Spring Typha P-8 2.68 1.04 1.86<br />
LVW Spring Typha P-9 2.05 1.26 1.65<br />
LVW Spring Typha P-10 1.56 1.42 1.49<br />
LVW Spring Typha P-11 0.83 1.69 1.26<br />
LVW Spring Typha P-11 0.92 2.12 1.52<br />
LVW Spring Typha P-11 1.34 1.00 1.17<br />
LVW Spring Typha P-11 2.91 1.52 2.21<br />
LVW Spring Typha P-12 1.68 1.03 1.35<br />
LVW Spring Typha P-12 1.18 0.86 1.02<br />
LVW Spring Typha P-12 1.95 0.89 1.42<br />
LVW Spring Typha P13 1.76 0.94 1.35<br />
LVW Spring Typha P-14 2.32 1.46 1.89<br />
LVW Spring Typha P-14 1.90 1.07 1.48<br />
LVW Spring Sch-cal P-15 1.86 1.64 1.75<br />
LVW Spring Sch-cal P-15 1.84 1.50 1.67<br />
LVW Spring Sch-cal P-16 2.10 1.20 1.65<br />
LVW Spring Sch-cal P-18 2.57 1.42 1.99
Site Season Plant Plant ID<br />
TN (%)<br />
Shoot Root Total<br />
LVW Spring Sch-cal P-19 2.62 1.34 1.98<br />
LVW Winter Typha P-1 1.58 1.10 1.34<br />
LVW Winter Typha P-2 1.18 0.82 1.00<br />
LVW Winter Typha P-3 0.94 0.84 0.89<br />
LVW Winter Typha P-3 0.86 0.79 0.82<br />
LVW Winter Typha P-3 1.39 1.46 1.42<br />
LVW Winter Typha P-4 0.95 0.78 0.86<br />
LVW Winter Typha P-5 2.32 1.07 1.69<br />
LVW Winter Typha P-6 0.97 0.78 0.88<br />
LVW Winter Typha P-7 1.05 1.29 1.17<br />
LVW Winter Typha P-8 1.36 0.86 1.11<br />
LVW Winter Typha P-8 1.92 1.12 1.52<br />
LVW Winter Typha P-8 2.32 1.26 1.79<br />
LVW Summer Typha P-1 2.23 1.55 1.89<br />
LVW Summer Typha P-2 1.96 1.48 1.72<br />
LVW Summer Typha P-3 1.79 1.04 1.41<br />
LVW Summer Typha P-4 2.17 1.01 1.59<br />
LVW Summer Typha P-5 1.82 1.80 1.81<br />
LVW Summer Typha P-6 1.73 1.76 1.74<br />
LVW Summer Sch-cal P-7 2.41 2.13 2.27<br />
LVW Summer Sch-cal P-8 2.51 2.15 2.33<br />
LVW Summer Sch-cal P-9 1.53 1.21 1.37<br />
LVW Summer Sch-cal P-10 1.70 1.42 1.56<br />
HD Spring Sch-ac P-20 1.01 1.06 1.03<br />
HD Spring Sch-ac P-21 1.26 1.06 1.16<br />
HD Spring Sch-am P-22 1.37 1.19 1.28<br />
HD Spring Sch-am P-23 1.43 1.24 1.33<br />
HD Spring Sch-cal P-24 1.68 1.36 1.52<br />
HD Spring Sch-cal P-25 1.70 1.35 1.52<br />
HD Spring Sch-cal P-26 0.80 1.30 1.05<br />
HD Spring Sch-cal P-27 0.97 1.27 1.12<br />
HD Spring Sch-cal P-28 1.41 1.47 1.44<br />
HD Spring Sch-cal P-29 1.42 1.58 1.50<br />
HD Spring Typha P-30 1.89 1.44 1.66<br />
HD Spring Typha P-31 1.77 1.7 1.73<br />
HD Spring Typha P-32 1.36 1.81 1.58<br />
HD Spring Typha P-34 1.77 1.51 1.64
Site Season Plant Plant ID<br />
TN (%)<br />
Shoot Root Total<br />
HD Spring Typha P-35 1.79 1.51 1.65<br />
HD Winter Sch-ac P-9 1.15 1.15 1.15<br />
HD Winter Sch-ac P-10 1.40 1.43 1.42<br />
HD Winter Sch-am P-11 2.41 0.71 1.56<br />
HD Winter Sch-am P-12 1.26 1.12 1.19<br />
HD Winter Sch-cal P-13 1.26 1.40 1.33<br />
HD Winter Sch-cal P-14 1.58 1.05 1.31<br />
HD Winter Sch-cal P-15 1.25 2.41 1.83<br />
HD Winter Sch-cal P-16 1.30 0.85 1.07<br />
HD Summer Typha P-11 2.10 1.85 1.97<br />
HD Summer Typha P-11 2.10 1.90 2.00<br />
HD Summer Typha P-12 1.54 1.21 1.37<br />
HD Summer Typha P-12 1.32 1.27 1.29<br />
HD Summer Sch-cal P-13 2.09 1.41 1.75<br />
HD Summer Sch-cal P-14 2.21 2.02 2.11<br />
HD Summer Sch-cal P-15 2.33 1.52 1.92<br />
HD Summer Sch-cal P-16 2.46 1.25 1.85<br />
PW Summer Typha P-17 1.17 0.77 0.97<br />
PW Summer Typha P-18 0.63 0.91 0.77<br />
PW Summer Sch-cal P-19 0.58 1.27 0.92<br />
PW Summer Sch-cal P-19 1.46 1.25 1.35<br />
PW Summer Sch-cal P-19 1.57 1.28 1.43<br />
PW Summer Sch-cal P-20 1.29 0.86 1.07<br />
PW Summer Sch-cal P-20 1.18 0.89 1.04<br />
PW Summer Sch-cal P-21 1.04 1.06 1.05<br />
PW Summer Sch-cal P-22 1.22 0.90 1.06<br />
PW Summer Sch-cal P-23 0.92 1.02 0.97<br />
PW Summer Sch-cal P-23 0.79 0.47 0.63<br />
PW Summer Sch-am P-24 1.25 1.16 1.21<br />
PW Summer Sch-am P-25 1.58 1.25 1.42<br />
PW Summer Sch-am P-26 1.13 1.23 1.18<br />
PW Summer Sch-am P-27 1.38 0.72 1.05<br />
PW Summer Sch-am P-28 0.96 0.54 0.75<br />
PW Summer Sch-am P-28 1.90 1.42 1.66<br />
PW Summer Sch-am P-29 0.89 0.81 0.85<br />
PW Summer Sch-am P-29 0.94 0.73 0.84<br />
PW Spring Sch-ac P-36 0.85 0.72 0.78
Site Season Plant Plant ID<br />
TN (%)<br />
Shoot Root Total<br />
PW Spring Sch-ac P-37 0.76 0.71 0.73<br />
PW Spring Sch-am P-38 0.91 0.79 0.85<br />
PW Spring Sch-am P-39 0.79 0.65 0.72<br />
PW Spring Sch-cal P-40 0.86 0.76 0.81<br />
PW Spring Sch-cal P-41 0.92 0.82 0.87<br />
PW Spring Sch-cal P-42 0.91 0.78 0.84<br />
PW Winter Sch-ac P-17 0.80 0.53 0.66<br />
PW Winter Sch-am P-18 0.73 0.63 0.68<br />
PW Winter Sch-am P-19 0.91 0.82 0.86<br />
PW Winter Sch-am P-20 0.63 0.52 0.57<br />
PW Winter Sch-cal P-21 0.82 0.75 0.78<br />
PW Winter Sch-ac P-22 0.68 0.61 0.64<br />
FW Spring Typha P-43 1.20 0.49 0.84<br />
FW Spring Typha P-44 1.15 0.58 0.86<br />
FW Spring Typha P-45 0.85 0.54 0.69<br />
FW Spring Typha P-46 0.50 0.45 0.47<br />
FW Spring Typha P-47 0.75 0.40 0.57<br />
FW Summer Typha P-48 1.24 0.81 1.02<br />
FW Summer Typha P-49 1.34 1.17 1.25<br />
FW Summer Typha P-50 1.56 1.05 1.30<br />
FW Summer Typha P-50 1.60 1.07 1.33<br />
FW Summer Typha P-50 1.16 0.73 0.94<br />
FW Summer Typha P-50 1.18 1.38 1.27<br />
FW Summer Typha P-51 1.33 0.74 1.03<br />
FW Summer Typha P-51 1.34 0.74 1.03<br />
FW Summer Typha P-51 1.12 0.81 0.96<br />
FW Summer Typha P-52 1.07 0.79 0.92<br />
FW Summer Typha P-52 1.53 0.91 1.21<br />
FW Summer Typha P-52 1.52 0.90 1.20<br />
FW Summer Typha P-53 1.67 0.99 1.32<br />
FW Summer Typha P-53 1.70 1.00 1.34<br />
FW Summer Typha P-53 1.56 0.99 1.27<br />
FW Summer Typha P-53 1.83 1.03 1.42<br />
FW Summer Typha P-54 1.30 1.10 1.19<br />
FW Summer Typha P-55 1.50 0.91 1.20
Appendix C2 - <strong>Water</strong> column total nitrogen (TN) <strong>from</strong> the Las Vegas Wash (LVW), Flamingo<br />
Wash (FW), Demonstration Wetland at the City <strong>of</strong> Henderson <strong>Water</strong> Reclamation Facility (HD)<br />
and Pittman Wash Pilot Wetlands (PW) wetlands. (Ref: SNWA-database).<br />
TN (mg/L)<br />
Site<br />
Location<br />
SNWA<br />
Location<br />
Sampling<br />
Date<br />
<strong>Water</strong><br />
Column<br />
LVW Inlet LW 6.85 Jan-07 14<br />
LVW Inlet LW 6.85 Feb-07 15<br />
LVW Inlet LW 6.85 Mar-07 16<br />
LVW Inlet LW 6.85 Apr-07 13<br />
LVW Inlet LW 6.85 Jan-07 14<br />
LVW Inlet LW 6.85 Feb-07 15<br />
LVW Outlet LW 5.9 Jan-07 14<br />
LVW Outlet LW 5.9 Feb-07 14<br />
LVW Outlet LW 5.9 Mar-07 14<br />
LVW Outlet LW 5.9 Apr-07 14<br />
LVW Outlet LW 5.9 Jan-07 14<br />
LVW Outlet LW 5.9 Feb-07 15<br />
LVW Inlet LW 6.85 Sep-07 16<br />
LVW Inlet LW 6.85 Oct-07 14<br />
LVW Inlet LW 6.85 Nov-07 17<br />
LVW Inlet LW 6.85 Dec-07 14<br />
LVW Inlet LW 6.85 Sep-07 17<br />
LVW Inlet LW 6.85 Oct-07 15<br />
LVW Inlet LW 6.85 Nov-07 14<br />
LVW Inlet LW 6.85 Dec-07 16<br />
LVW Inlet LW 6.85 Oct-07 13<br />
LVW Outlet LW 5.9 Sep-07 14<br />
LVW Outlet LW 5.9 Oct-07 15<br />
LVW Outlet LW 5.9 Nov-07 16<br />
LVW Outlet LW 5.9 Dec-07 13<br />
LVW Outlet LW 5.9 Sep-07 14<br />
LVW Outlet LW 5.9 Oct-07 15<br />
LVW Outlet LW 5.9 Nov-07 14<br />
LVW Outlet LW 5.9 Dec-07 14<br />
LVW Outlet LW 5.9 Oct-07 15<br />
LVW Outlet LW 5.9 Nov-07 14<br />
LVW Outlet LW 5.9 Dec-07 15<br />
LVW Inlet LW 6.85 May-07 13<br />
LVW Inlet LW 6.85 Jun-07 16<br />
LVW Inlet LW 6.85 Jul-07 14
Site<br />
Location<br />
SNWA<br />
Location<br />
Sampling<br />
Date<br />
TN (mg/L)<br />
<strong>Water</strong><br />
Column<br />
LVW Inlet LW 6.85 Aug-07 14<br />
LVW Inlet LW 6.85 Jun-07 15<br />
LVW Inlet LW 6.85 Jul-07 13<br />
LVW Inlet LW 6.85 Aug-07 16<br />
LVW Outlet LW 5.9 May-07 16<br />
LVW Outlet LW 5.9 Jun-07 17<br />
LVW Outlet LW 5.9 Jul-07 14<br />
LVW Outlet LW 5.9 Aug-07 14<br />
LVW Outlet LW 5.9 May-07 16<br />
LVW Outlet LW 5.9 Jun-07 17<br />
LVW Outlet LW 5.9 Jul-07 11<br />
LVW Outlet LW 5.9 Aug-07 14<br />
HD Inlet HD1 Jan-07 17<br />
HD Inlet HD1 Feb-07 13<br />
HD Inlet HD1 Mar-07 13<br />
HD Outlet HD4 Jan-07 2.43<br />
HD Outlet HD4 Feb-07 17<br />
HD Outlet HD4 Mar-07 2.44<br />
HD Outlet HD4 Apr-07 18<br />
HD Inlet HD1 Sep-07 1.45<br />
HD Inlet HD1 Oct-07 4.32<br />
HD Inlet HD1 Nov-07 5.60<br />
HD Inlet HD1 Dec-07 1.67<br />
HD Inlet HD1 Nov-07 3.83<br />
HD Outlet HD4 Oct-07 3.65<br />
HD Outlet HD4 Nov-07 1.01<br />
HD Outlet HD4 Dec-07 1.86<br />
HD Inlet HD1 May-07 13<br />
HD Inlet HD1 Jun-07 6.63<br />
HD Inlet HD1 Jul-07 6.50<br />
HD Inlet HD1 Aug-07 12<br />
HD Inlet HD1 Jul-07 2.28<br />
HD Inlet HD1 Aug-07 1.08<br />
HD Outlet HD4 May-07 11<br />
HD Outlet HD4 Jun-07 2.83<br />
HD Outlet HD4 Jul-07 1.13<br />
HD Outlet HD4 Aug-07 12<br />
HD Outlet HD4 Jul-07 2.04
Site<br />
Location<br />
SNWA<br />
Location<br />
Sampling<br />
Date<br />
TN (mg/L)<br />
<strong>Water</strong><br />
Column<br />
HD Outlet HD4 Aug-07 1.07<br />
PW Inlet PW-Inlet May-07 8.10<br />
PW Inlet PW-Inlet Jul-07 10<br />
PW Inlet PW-Inlet Aug-07 8.50<br />
PW Outlet PW-Outlet May-07 8.10<br />
PW Outlet PW-Outlet Jun-07 10<br />
PW Outlet PW-Outlet Jul-07 9.50<br />
PW Outlet PW-Outlet Aug-07 8.50<br />
PW Outlet PW-Outlet May-07 7.80<br />
PW Outlet PW-Outlet Jun-07 10<br />
PW Outlet PW-Outlet Jul-07 9.60<br />
PW Outlet PW-Outlet Aug-07 8.30<br />
PW Inlet PW-Inlet Jan-08 8.80<br />
PW Inlet PW-Inlet Feb-08 9.60<br />
PW Inlet PW-Inlet Mar-08 10<br />
PW Outlet PW-Outlet Jan-08 8.90<br />
PW Outlet PW-Outlet Feb-08 9.60<br />
PW Outlet PW-Outlet Mar-08 9.00<br />
PW Outlet PW-Outlet Feb-07 8.80<br />
PW Outlet PW-Outlet Mar-07 9.50<br />
PW Outlet PW-Outlet Apr-07 10<br />
PW Inlet PW-Inlet Feb-07 9.90<br />
PW Inlet PW-Inlet Mar-07 9.10<br />
PW Inlet PW-Inlet Apr-07 8.90<br />
PW Outlet PW-Outlet Feb-07 9.50<br />
PW Outlet PW-Outlet Mar-07 8.90<br />
PW Outlet PW-Outlet Apr-07 8.80<br />
PW Outlet PW-Outlet Jan-08 7.50<br />
PW Outlet PW-Outlet Feb-08 8.10<br />
PW Outlet PW-Outlet Mar-08 9.60<br />
PW Outlet PW-Outlet Jan-08 8.80<br />
PW Outlet PW-Outlet Feb-08 8.70<br />
PW Inlet PW-Inlet Sep-07 8.10<br />
PW Inlet PW-Inlet Oct-07 8.80<br />
PW Outlet PW-Outlet Sep-07 9.00<br />
PW Outlet PW-Outlet Oct-07 8.70<br />
PW Outlet PW-Outlet Sep-07 8.90<br />
PW Outlet PW-Outlet Oct-07 8.60
Site<br />
Location<br />
SNWA<br />
Location<br />
Sampling<br />
Date<br />
TN (mg/L)<br />
<strong>Water</strong><br />
Column<br />
PW Inlet PW-Inlet Aug-07 9.40<br />
PW Outlet PW-Outlet Sep-07 9.10<br />
FW Outlet FW-0 Jan-07 4.30<br />
FW Outlet FW-0 Feb-07 4.83<br />
FW Outlet FW-0 Mar-07 4.56<br />
FW Outlet FW-0 Jan-08 4.26<br />
FW Inlet TW-DRI Jan-07 2.04<br />
FW Inlet TW-DRI Feb-07 5.34<br />
FW Inlet TW-DRI Mar-07 3.50<br />
FW Inlet TW-DRI Feb-08 4.33<br />
FW Inlet TW-DRI Mar-08 4.28<br />
FW Inlet TW-DRI Jan-08 3.93<br />
FW Inlet TW-DRI Jan-07 5.20<br />
FW Inlet TW-DRI Feb-07 3.41<br />
FW Inlet TW-DRI Mar-07 5.15<br />
FW Inlet TW-DRI Jan-08 4.31<br />
FW Inlet TW-DRI Jan-07 3.01<br />
FW Outlet FW-0 May-07 4.57<br />
FW Outlet FW-0 Jun-07 3.63<br />
FW Outlet FW-0 Jul-07 3.85<br />
FW Outlet FW-0 Aug-07 3.49<br />
FW Outlet FW-0 May-08 3.39<br />
FW Outlet FW-0 Jun-08 4.14<br />
FW Outlet FW-0 Jul-08 3.36<br />
FW Outlet FW-0 Aug-08 3.64<br />
FW Inlet TW-DRI Oct-07 3.56<br />
FW Inlet TW-DRI Nov-07 5.40<br />
FW Inlet TW-DRI Dec-07 2.86<br />
FW Outlet FW-0 Nov-07 4.31<br />
FW Outlet FW-0 Dec-07 4.78<br />
Note: Nearby sites were sampled for nutrients and metals in water column whenever insufficient<br />
samples were found in one location.
Appendix C3- Sediment total nitrogen (TN) <strong>from</strong> the Las Vegas Wash (LVW), Flamingo Wash<br />
(FW), Demonstration Wetland at the City <strong>of</strong> Henderson <strong>Water</strong> Reclamation Facility (HD) and<br />
Pittman Wash Pilot Wetlands (PW) wetlands.<br />
Site Season Location<br />
TN (%)<br />
Sediment<br />
LVW Spring 09 Inlet 0.09<br />
LVW Spring 09 Inlet 0.07<br />
LVW Spring 09 Outlet 0.06<br />
LVW Spring 09 Outlet 0.08<br />
LVW Winter 08 Inlet 0.11<br />
LVW Winter 08 Inlet 0.15<br />
LVW Winter 08 Inlet 0.11<br />
LVW Winter 08 Outlet 0.13<br />
LVW Winter 08 Outlet 0.16<br />
LVW Winter 08 Outlet 0.14<br />
LVW Summer 08 Inlet 0.05<br />
LVW Summer 08 Inlet 0.07<br />
LVW Summer 08 Inlet 0.10<br />
LVW Summer 08 Outlet 0.06<br />
LVW Summer 08 Outlet 0.06<br />
LVW Summer 08 Outlet 0.06<br />
HD Spring 09 Inlet 0.05<br />
HD Spring 09 Inlet 0.05<br />
HD Spring 09 Outlet 0.05<br />
HD Spring 09 Outlet 0.06<br />
HD Winter 08 Inlet 0.07<br />
HD Winter 08 Inlet 0.07<br />
HD Winter 08 Inlet 0.06<br />
HD Winter 08 Outlet 0.04<br />
HD Winter 08 Outlet 0.04<br />
HD Winter 08 Outlet 0.04<br />
HD Summer 08 Inlet 0.08<br />
HD Summer 08 Inlet 0.07<br />
HD Summer 08 Inlet 0.09<br />
HD Summer 08 Outlet 0.07<br />
HD Summer 08 Outlet 0.05<br />
HD Summer 08 Outlet 0.06<br />
PW Summer 08 Inlet 0.05<br />
PW Summer 08 Inlet 0.05<br />
PW Summer 08 Inlet 0.04<br />
PW Summer 08 Outlet 0.05
Site Season Location<br />
TN (%)<br />
Sediment<br />
PW Summer 08 Outlet 0.05<br />
PW Spring 09 Inlet 0.07<br />
PW Spring 09 Inlet 0.07<br />
PW Spring 09 Outlet 0.10<br />
PW Spring 09 Outlet 0.10<br />
PW Winter 08 Inlet 0.08<br />
PW Winter 08 Inlet 0.08<br />
PW Winter 08 Outlet 0.07<br />
PW Winter 08 Outlet 0.06<br />
PW Winter 08 Outlet 0.06<br />
PW Winter 08 Inlet 0.06<br />
FW Spring 09 Outlet 0.02<br />
FW Spring 09 Outlet 0.03<br />
FW Spring 09 Inlet 0.15<br />
FW Spring 09 Inlet 0.11<br />
FW Summer 08 Inlet 0.11<br />
FW Summer 08 Inlet 0.16<br />
FW Summer 08 Inlet 0.12<br />
FW Summer 08 Outlet 0.08<br />
FW Summer 08 Outlet 0.08<br />
FW Summer 08 Outlet 0.08<br />
FW Winter 08 Inlet 0.14<br />
FW Winter 08 Inlet 0.13<br />
FW Winter 08 Inlet 0.14<br />
FW Winter 08 Outlet 0.05<br />
FW Winter 08 Outlet 0.05<br />
FW Winter 08 Outlet 0.05
Appendix D<br />
Arsenic data <strong>from</strong> plant tissues, water column and sediment at four wetland sites
Appendix D1 - Arsenic concentrations (As) in plant tissues <strong>from</strong> the Las Vegas Wash (LVW),<br />
Flamingo Wash (FW), Demonstration Wetland at the City <strong>of</strong> Henderson <strong>Water</strong> Reclamation<br />
Facility (HD) and Pittman Wash Pilot Wetlands (PW) wetlands.<br />
Site Season Plant Sample ID<br />
Arsenic (µg/g)<br />
Shoot Root Total<br />
LVW Spring Typha P-1 5.21 1.32 3.26<br />
LVW Spring Typha P-1 4.23 2.12 3.17<br />
LVW Spring Typha P-2 5.31 2.86 4.08<br />
LVW Summer Typha P-3 10.10 1.39 5.74<br />
LVW Summer Typha P-3 9.86 1.16 5.51<br />
LVW Summer Typha P-4 9.16 1.12 5.14<br />
LVW Summer Typha P-4 3.60 1.53 2.56<br />
LVW Summer Sch-cal P-1 5.60 0.13 2.86<br />
LVW Summer Sch-cal P-2 3.02 1.44 2.23<br />
LVW Summer Sch-cal P-2 4.54 0.63 2.58<br />
LVW Winter Typha P-5 5.80 0.40 3.10<br />
LVW Winter Typha P-5 3.35 0.95 2.15<br />
HD Summer Sch-cal P-3 1.02 0.86 0.94<br />
HD Summer Sch-cal P-3 1.89 0.16 1.02<br />
HD Spring Sch-ac P-4 1.52 0.62 1.07<br />
HD Spring Sch-cal P-5 1.64 0.35 0.99<br />
HD Spring Typha P-6 2.06 0.25 1.19<br />
HD Winter Sch-ac P-6 2.05 0.84 1.44<br />
HD Winter Sch-ac P-6 2.00 0.70 1.35<br />
HD Winter Sch-am P-7 2.05 1.05 1.55<br />
HD Winter Sch-am P-8 2.56 0.4 1.48<br />
HD Winter Sch-cal P-9 2.51 0.25 1.37<br />
HD Winter Sch-cal P-9 1.72 0.35 1.02<br />
PW Winter Sch-ac P-10 8.05 1.60 4.80<br />
PW Winter Sch-ac P-11 6.24 1.51 3.87<br />
PW Winter Sch-am P-12 9.65 1.90 5.77<br />
PW Winter Sch-am P-13 8.41 2.60 5.50<br />
PW Winter Sch-cal P-14 10.2 1.25 5.72<br />
PW Summer Sch-ac P-15 10.21 3.90 7.05<br />
PW Summer Sch-ac P-16 8.34 2.30 5.32<br />
PW Summer Sch-am P-17 10.60 3.50 7.05<br />
PW Summer Sch-am P-17 9.41 4.88 7.14<br />
PW Summer Sch-cal P-18 13.91 0.20 7.05<br />
PW Summer Sch-cal P-18 12.28 0.35 6.31<br />
PW Summer Sch-cal P-19 5.85 1.20 3.52<br />
PW Summer Sch-cal P-19 6.85 3.54 5.19<br />
PW Winter Sch-cal P-20 12.21 0.96 6.58
Site Season Plant Sample ID<br />
Arsenic (µg/g)<br />
Shoot Root Total<br />
PW Winter Sch-cal P-21 5.15 3.65 4.40<br />
FW Summer Typha P-7 3.50 0.6 2.05<br />
FW Summer Typha P-8 0.35 0.85 0.60<br />
FW Summer Typha P-9 2.21 0.56 1.38<br />
FW Summer Typha P-10 1.63 0.74 1.17
Appendix D2 - Arsenic concentrations (As) <strong>from</strong> the Las Vegas Wash (LVW), Flamingo Wash<br />
(FW), Demonstration Wetland at the City <strong>of</strong> Henderson <strong>Water</strong> Reclamation Facility (HD) and<br />
Pittman Wash Pilot Wetlands (PW) wetlands. (Ref: SNWA database)<br />
Arsenic<br />
Site Location<br />
Sampling (µg/L)<br />
Date <strong>Water</strong><br />
Column<br />
LVW Inlet Jan-07 5.9<br />
LVW Inlet Feb-07 6.5<br />
LVW Inlet Mar-07 7.2<br />
LVW Inlet May-07 7.5<br />
LVW Inlet Jun-07 6.2<br />
LVW Inlet Jul-07 6.5<br />
LVW Inlet Aug-07 5.7<br />
LVW Inlet Sep-07 3.0<br />
LVW Inlet Oct-07 1.8<br />
LVW Inlet Nov-07 2.6<br />
LVW Inlet Dec-07 5.1<br />
LVW Inlet Sep-07 6.6<br />
LVW Inlet Oct-07 6.6<br />
LVW Inlet Nov-07 4.1<br />
LVW Inlet Dec-07 7.3<br />
LVW Outlet Jan-07 9.2<br />
LVW Outlet Feb-07 9.8<br />
LVW Outlet Mar-07 11<br />
LVW Outlet May-07 9.4<br />
LVW Outlet Jun-07 8.3<br />
LVW Outlet Jul-07 8.4<br />
LVW Outlet Aug-07 9.3<br />
LVW Outlet Nov-07 8.9<br />
LVW Outlet Dec-07 10<br />
LVW Outlet Oct-07 9.7<br />
LVW Outlet Nov-07 7.2<br />
LVW Outlet Dec-07 9.7<br />
HD Inlet Jul-07 3.3<br />
HD Inlet Aug-07 3.8<br />
HD Inlet Nov-07 4.8<br />
HD Outlet Feb-07 3.2<br />
HD Outlet May-07 3.0<br />
HD Outlet Jun-07 3.0<br />
HD Outlet Jul-07 3.1
Site Location<br />
Arsenic<br />
Sampling (µg/L)<br />
Date <strong>Water</strong><br />
Column<br />
HD Outlet Aug-07 3.0<br />
HD Outlet May-07 3.1<br />
HD Outlet Jun-07 3.6<br />
HD Outlet Jul-07 3.0<br />
HD Outlet Aug-07 3.1<br />
HD Outlet Sep-07 3.4<br />
HD Outlet Nov-07 4.0<br />
HD Outlet Dec-07 3.1<br />
PW Inlet Feb-07 14<br />
PW Inlet Mar-07 15<br />
PW Inlet Apr-07 10<br />
PW Inlet Feb-07 14<br />
PW Inlet Mar-07 12<br />
PW Inlet Apr-07 14<br />
PW Inlet May-07 14<br />
PW Inlet Jun-07 14<br />
PW Inlet Jul-07 15<br />
PW Inlet Aug-07 15<br />
PW Inlet Sep-07 14<br />
PW Inlet Oct-07 15<br />
PW Inlet Nov-07 15<br />
PW Outlet Feb-07 13<br />
PW Outlet Mar-07 15<br />
PW Outlet Apr-07 15<br />
PW Outlet Feb-07 9.9<br />
PW Outlet Mar-07 14<br />
PW Outlet Apr-07 11<br />
PW Outlet Feb-07 14<br />
PW Outlet Mar-07 14<br />
PW Outlet Apr-07 12<br />
PW Outlet Feb-07 15<br />
PW Outlet Mar-07 13<br />
PW Outlet Apr-07 15<br />
PW Outlet Feb-07 15<br />
PW Outlet Mar-07 9.8<br />
PW Outlet Jun-07 14<br />
PW Outlet Jul-07 16<br />
PW Outlet Aug-07 15
Site Location<br />
Arsenic<br />
Sampling (µg/L)<br />
Date <strong>Water</strong><br />
Column<br />
PW Outlet May-07 14<br />
PW Outlet Jun-07 14<br />
PW Outlet Jul-07 15<br />
PW Outlet Aug-07 15<br />
PW Outlet Sep-07 15<br />
PW Outlet Oct-07 15<br />
PW Outlet Nov-07 15<br />
FW Outlet Jan-01 6.4<br />
FW Outlet Apr-01 7.5<br />
FW Outlet Jan-02 8.1<br />
FW Outlet Apr-02 7.2<br />
FW Outlet Jan-03 5.2<br />
FW Outlet Apr-03 4.8<br />
FW Outlet Jan-04 7.4<br />
FW Outlet Apr-04 5.4<br />
FW Outlet Apr-05 7.0<br />
FW Outlet Apr-06 5.2<br />
FW Outlet Jan-07 4.1<br />
FW Outlet Apr-07 4.9<br />
FW Outlet Jan-08 4.5<br />
FW Outlet Apr-08 4.5<br />
FW Outlet Jul-01 6.2<br />
FW Outlet Jul-02 9.2<br />
FW Outlet Jul-03 5.8<br />
FW Outlet Jul-04 5.1<br />
FW Outlet Jul-05 8.5<br />
FW Outlet Jul-06 5.5<br />
FW Outlet Jul-07 5.5<br />
FW Outlet Oct-02 6.7<br />
FW Outlet Oct-03 4.9<br />
FW Outlet Oct-04 6.8<br />
FW Outlet Oct-05 4.4<br />
FW Outlet Oct-06 5.8<br />
FW Outlet Oct-01 8.8<br />
Note: <strong>Water</strong> quality data in LVW, HD & PW were selected for year 2007/08, for FW years<br />
2001-2008, due to less frequent sampling.
Appendix D3 – Arsenic concentrations (As) <strong>from</strong> the Las Vegas Wash (LVW), Flamingo Wash<br />
(FW), Demonstration Wetland at the City <strong>of</strong> Henderson <strong>Water</strong> Reclamation Facility (HD) and<br />
Pittman Wash Pilot Wetlands (PW) wetlands.<br />
Arsenic<br />
Site Location Season (µg/g)<br />
Sediment<br />
LVW Inlet Spring 09 3.50<br />
LVW Inlet Spring 09 3.69<br />
LVW Inlet<br />
Summer<br />
09<br />
3.86<br />
LVW Inlet<br />
Summer<br />
09<br />
4.72<br />
LVW Inlet<br />
Summer<br />
09<br />
4.71<br />
LVW Inlet<br />
Summer<br />
09<br />
5.49<br />
LVW Inlet Winter 08 5.68<br />
LVW Inlet Winter 08 5.33<br />
LVW Outlet<br />
Summer<br />
09<br />
3.63<br />
LVW Outlet<br />
Summer<br />
09<br />
4.12<br />
LVW Outlet<br />
Summer<br />
09<br />
5.78<br />
LVW Outlet<br />
Summer<br />
09<br />
5.27<br />
LVW Outlet Winter 08 4.72<br />
LVW Outlet Winter 08 5.56<br />
HD Inlet Spring 09 3.53<br />
HD Inlet Spring 09 3.46<br />
HD Inlet<br />
Summer<br />
09<br />
5.94<br />
HD Inlet<br />
Summer<br />
09<br />
3.23<br />
HD Inlet<br />
Summer<br />
09<br />
2.53<br />
HD Inlet<br />
Summer<br />
09<br />
2.57<br />
HD Inlet Winter 08 4.32<br />
HD Inlet Winter 08 3.85<br />
HD Outlet<br />
Summer<br />
09<br />
2.74<br />
HD Outlet<br />
Summer<br />
09<br />
3.05
Site Location Season<br />
Arsenic<br />
(µg/g)<br />
Sediment<br />
HD Outlet<br />
Summer<br />
09<br />
3.38<br />
HD Outlet<br />
Summer<br />
09<br />
3.64<br />
HD Outlet Winter 08 2.32<br />
HD Outlet Winter 08 2.52<br />
PW Inlet<br />
Summer<br />
09<br />
5.99<br />
PW Inlet<br />
Summer<br />
09<br />
6.21<br />
PW Inlet Winter 08 6.35<br />
PW Outlet Spring 09 5.61<br />
PW Outlet Spring 09 4.03<br />
PW Outlet<br />
Summer<br />
09<br />
6.81<br />
PW Outlet<br />
Summer<br />
09<br />
6.90<br />
PW Outlet<br />
Summer<br />
09<br />
4.11<br />
PW Outlet<br />
Summer<br />
09<br />
3.63<br />
PW Outlet<br />
Summer<br />
09<br />
5.80<br />
PW Outlet<br />
Summer<br />
09<br />
8.30<br />
PW Outlet Winter 08 6.38<br />
PW Outlet Winter 08 7.25<br />
FW Inlet<br />
Summer<br />
09<br />
2.44<br />
FW Inlet<br />
Summer<br />
09<br />
3.02<br />
FW Inlet<br />
Summer<br />
09<br />
1.99<br />
FW Inlet<br />
Summer<br />
09<br />
2.45<br />
FW Inlet Winter 08 3.03<br />
FW Inlet Winter 08 3.56<br />
FW Outlet Spring 09 3.86<br />
FW Outlet Spring 09 2.51<br />
FW Outlet Spring 09 3.06<br />
FW Outlet Summer 4.37
Site Location Season<br />
Arsenic<br />
(µg/g)<br />
Sediment<br />
09<br />
FW Outlet<br />
Summer<br />
09<br />
3.89<br />
FW Outlet<br />
Summer<br />
09<br />
2.38<br />
FW Outlet<br />
Summer<br />
09<br />
2.53<br />
FW Outlet Winter 08 3.61
Appendix E<br />
Selenium data <strong>from</strong> plant tissues, water column and sediment at four wetland sites
Appendix E1 - Selenium concentrations (Se) in plant tissues <strong>from</strong> the Las Vegas Wash (LVW),<br />
Flamingo Wash (FW), Demonstration Wetland at the City <strong>of</strong> Henderson <strong>Water</strong> Reclamation<br />
Facility (HD) and Pittman Wash Pilot Wetlands (PW) wetlands.<br />
Site Season Plant Sample ID<br />
Selenium (µg/g)<br />
Shoot Root Total<br />
LVW Spring Typha P-1 2.60 0.96 1.78<br />
LVW Spring Typha P-1 1.36 0.87 1.11<br />
LVW Spring Typha P-2 1.70 1.02 1.36<br />
LVW Spring Typha P-2 3.62 0.58 2.10<br />
LVW Summer Typha P-3 1.80 1.34 1.57<br />
LVW Summer Typha P-3 1.82 0.72 1.27<br />
LVW Summer Typha P-4 2.20 0.76 1.48<br />
LVW Summer Typha P-5 1.54 0.67 1.10<br />
LVW Summer Sch-cal P-1 1.58 0.58 1.08<br />
LVW Summer Sch-cal P-3 1.32 0.69 1.00<br />
LVW Winter Typha P-6 8.30 4.45 6.37<br />
LVW Winter Typha P-6 14.35 2.95 8.65<br />
HD Summer Sch-cal P-4 2.48 0.64 1.56<br />
HD Summer Sch-cal P-5 2.10 0.72 1.41<br />
HD Spring Sch-am P-6 1.80 1.80 1.80<br />
HD Spring Sch-ac P-7 4.46 1.80 3.13<br />
HD Spring Sch-cal P-8 2.90 1.50 2.20<br />
HD Spring Typha P-7 1.62 0.72 1.17<br />
HD Spring Typha P-8 2.38 0.59 1.48<br />
HD Winter Sch-ac P-9 6.40 2.45 4.42<br />
HD Winter Sch-ac P-10 6.85 3.50 5.17<br />
HD Winter Sch-am P-11 6.45 1.00 3.72<br />
HD Winter Sch-am P-12 5.45 2.15 3.80<br />
HD Winter Sch-cal P-13 1.95 0.50 1.22<br />
HD Winter Sch-cal P-14 1.40 2.40 1.90<br />
PW Winter Sch-ac P-15 11.65 9.30 10.47<br />
PW Winter Sch-ac P-15 14.80 8.70 11.75<br />
PW Winter Sch-am P-16 20.15 11.45 15.80<br />
PW Winter Sch-am P-16 18.11 14.53 16.32<br />
PW Winter Sch-cal P-17 8.60 6.45 7.52<br />
PW Summer Sch-ac P-18 12.00 2.45 7.22<br />
PW Summer Sch-ac P-18 9.65 3.27 6.46<br />
PW Summer Sch-am P-19 21.75 11.75 16.75<br />
PW Summer Sch-am P-19 17.56 15.28 16.42<br />
PW Summer Sch-cal P-20 5.90 2.20 4.05<br />
PW Summer Sch-cal P-21 7.54 5.21 6.37<br />
PW Summer Sch-cal P-21 8.00 4.15 6.07
Site Season Plant Sample ID<br />
Selenium (µg/g)<br />
Shoot Root Total<br />
PW Summer Sch-cal P-22 6.38 0 6.38<br />
PW Winter Sch-cal P-22 5.20 4.21 4.70<br />
PW Winter Sch-cal P-23 14.70 3.65 9.17<br />
PW Winter Sch-cal P-23 17.51 5.36 11.43<br />
FW Summer Typha P-9 2.45 1.20 1.82<br />
FW Summer Typha P-10 1.90 0.15 1.02<br />
FW Summer Typha P-11 1.32 0.82 1.07<br />
FW Summer Typha P-12 1.76 0.72 1.24
Appendix E2 - Selenium concentrations (Se) in <strong>Water</strong> Column <strong>from</strong> the Las Vegas Wash<br />
(LVW), Flamingo Wash (FW), Demonstration Wetland at the City <strong>of</strong> Henderson <strong>Water</strong><br />
Reclamation Facility (HD) and Pittman Wash Pilot Wetlands (PW) wetlands. (Ref: SNWA<br />
database).<br />
Selenium<br />
Sampling<br />
Date<br />
Site Location<br />
(µg/L)<br />
<strong>Water</strong> Column<br />
LVW Inlet Jan-07 2.6<br />
LVW Inlet Feb-07 2.9<br />
LVW Inlet Mar-07 2.8<br />
LVW Inlet Jan-07 3.8<br />
LVW Inlet Feb-07 4.1<br />
LVW Inlet Mar-07 3.9<br />
LVW Inlet May-07 2.7<br />
LVW Inlet Jun-07 2.7<br />
LVW Inlet Jul-07 2.9<br />
LVW Inlet Aug-07 2.6<br />
LVW Inlet May-07 3.7<br />
LVW Inlet Jun-07 3.3<br />
LVW Inlet Jul-07 3.6<br />
LVW Inlet Aug-07 3.3<br />
LVW Inlet Sep-07 3.0<br />
LVW Inlet Oct-07 2.6<br />
LVW Inlet Nov-07 2.9<br />
LVW Inlet Dec-07 2.7<br />
LVW Inlet Sep-07 3.6<br />
LVW Inlet Oct-07 4.0<br />
LVW Inlet Nov-07 3.9<br />
LVW Inlet Dec-07 3.7<br />
LVW Inlet Nov-07 3.1<br />
LVW Inlet Dec-07 4.2<br />
LVW Outlet Jan-07 3.4<br />
LVW Outlet Feb-07 3.7<br />
LVW Outlet Mar-07 3.6<br />
LVW Outlet May-07 3.2<br />
LVW Outlet Jun-07 2.8<br />
LVW Outlet Jul-07 2.9<br />
LVW Outlet Aug-07 3.1<br />
LVW Outlet Oct-07 4.0<br />
LVW Outlet Nov-07 3.4<br />
LVW Outlet Dec-07 3.1
Site Location<br />
Selenium<br />
Sampling<br />
(µg/L)<br />
Date<br />
<strong>Water</strong> Column<br />
LVW Outlet Nov-07 3.2<br />
LVW Outlet Dec-07 3.3<br />
HD Inlet Jan-07 1.6<br />
HD Inlet Feb-07 2.6<br />
HD Inlet Jul-07 2.1<br />
HD Inlet Aug-07 2.2<br />
HD Inlet Dec-07 2.0<br />
HD Outlet May-07 2.0<br />
HD Outlet Jun-07 1.9<br />
HD Outlet Jul-07 1.6<br />
HD Outlet Aug-07 1.8<br />
HD Outlet May-07 2.0<br />
HD Outlet Jun-07 1.3<br />
HD Outlet Jul-07 1.2<br />
HD Outlet Aug-07 2.1<br />
PW Inlet Jan-07 9.3<br />
PW Inlet Feb-07 11<br />
PW Inlet Mar-07 9.8<br />
PW Inlet Jan-07 11<br />
PW Inlet Feb-07 12<br />
PW Inlet Mar-07 11<br />
PW Inlet May-07 10<br />
PW Inlet Jun-07 11<br />
PW Inlet Jul-07 11<br />
PW Inlet Aug-07 10<br />
PW Inlet Oct-07 9.8<br />
PW Inlet Nov-07 11<br />
PW Inlet Dec-07 11<br />
PW Outlet Jan-07 9.1<br />
PW Outlet Feb-07 10<br />
PW Outlet Mar-07 12<br />
PW Outlet Jan-07 11<br />
PW Outlet Feb-07 11<br />
PW Outlet Mar-07 11<br />
PW Outlet Jan-07 11<br />
PW Outlet Feb-07 11<br />
PW Outlet Mar-07 12<br />
PW Outlet Jan-07 12
Site Location<br />
Selenium<br />
Sampling<br />
(µg/L)<br />
Date<br />
<strong>Water</strong> Column<br />
PW Outlet Feb-07 8.6<br />
PW Outlet Mar-07 9.2<br />
PW Outlet Jan-08 11<br />
PW Outlet Feb-08 10<br />
PW Outlet May-07 10<br />
PW Outlet Jul-07 11<br />
PW Outlet Aug-07 11<br />
PW Outlet May-07 9.9<br />
PW Outlet Jun-07 11<br />
PW Outlet Jul-07 11<br />
PW Outlet Aug-07 11<br />
PW Outlet Oct-07 11<br />
PW Outlet Nov-07 11<br />
PW Outlet Dec-07 11<br />
FW Inlet Jan-07 8.6<br />
FW Inlet Feb-07 8.4
Appendix E3-Selenium concentrations (Se) in sediment <strong>from</strong> the Las Vegas Wash (LVW),<br />
Flamingo Wash (FW), Demonstration Wetland at the City <strong>of</strong> Henderson <strong>Water</strong> Reclamation<br />
Facility (HD) and Pittman Wash Pilot Wetlands (PW) wetlands.<br />
Selenium<br />
Site Location Season (µg/g)<br />
Sediment<br />
LVMW Inlet Spring 09 3.50<br />
LVMW Inlet Spring 09 3.69<br />
LVMW Inlet<br />
Summer<br />
09<br />
3.86<br />
LVMW Inlet<br />
Summer<br />
09<br />
4.72<br />
LVMW Inlet<br />
Summer<br />
09<br />
4.71<br />
LVMW Inlet<br />
Summer<br />
09<br />
5.49<br />
LVMW Inlet Winter 08 5.68<br />
LVMW Inlet Winter 08 5.33<br />
LVMW Outlet<br />
Summer<br />
09<br />
3.63<br />
LVMW Outlet<br />
Summer<br />
09<br />
4.12<br />
LVMW Outlet<br />
Summer<br />
09<br />
5.78<br />
LVMW Outlet<br />
Summer<br />
09<br />
5.27<br />
LVMW Outlet Winter 08 4.72<br />
LVMW Outlet Winter 08 5.56<br />
HD Inlet Spring 09 3.53<br />
HD Inlet Spring 09 3.46<br />
HD Inlet<br />
Summer<br />
09<br />
5.94<br />
HD Inlet<br />
Summer<br />
09<br />
3.23<br />
HD Inlet<br />
Summer<br />
09<br />
2.53<br />
HD Inlet<br />
Summer<br />
09<br />
2.57<br />
HD Inlet Winter 08 4.32<br />
HD Inlet Winter 08 3.85<br />
HD Outlet<br />
Summer<br />
09<br />
2.74<br />
HD Outlet<br />
Summer<br />
09<br />
3.38
Site Location Season<br />
Selenium<br />
(µg/g)<br />
Sediment<br />
HD Outlet<br />
Summer<br />
09<br />
3.64<br />
HD Outlet Winter 08 2.32<br />
HD Outlet Winter 08 2.52<br />
PW Inlet<br />
Summer<br />
09<br />
5.99<br />
PW Inlet<br />
Summer<br />
09<br />
6.21<br />
PW Inlet Winter 08 7.60<br />
PW Inlet Winter 08 6.35<br />
PW Outlet Spring 09 5.60<br />
PW Outlet Spring 09 4.03<br />
PW Outlet<br />
Summer<br />
09<br />
6.80<br />
PW Outlet<br />
Summer<br />
09<br />
6.90<br />
PW Outlet<br />
Summer<br />
09<br />
4.11<br />
PW Outlet<br />
Summer<br />
09<br />
3.63<br />
PW Outlet<br />
Summer<br />
09<br />
5.80<br />
PW Outlet<br />
Summer<br />
09<br />
8.30<br />
PW Outlet Winter 08 6.38<br />
PW Outlet Winter 08 7.25<br />
FW Inlet<br />
Summer<br />
09<br />
2.44<br />
FW Inlet<br />
Summer<br />
09<br />
3.02<br />
FW Inlet<br />
Summer<br />
09<br />
1.99<br />
FW Inlet<br />
Summer<br />
09<br />
2.45<br />
FW Inlet Winter 08 3.03<br />
FW Inlet Winter 08 3.56<br />
FW Outlet Spring 09 3.86<br />
FW Outlet Spring 09 2.51<br />
FW Outlet Spring 09 3.06<br />
FW Outlet<br />
Summer<br />
09<br />
4.37
Site Location Season<br />
Selenium<br />
(µg/g)<br />
Sediment<br />
FW Outlet<br />
Summer<br />
09<br />
3.89<br />
FW Outlet<br />
Summer<br />
09<br />
2.38<br />
FW Outlet<br />
Summer<br />
09<br />
2.53<br />
FW Outlet Winter 08 3.61
Appendix F<br />
Plant tissue nutrient concentration <strong>from</strong> fall 2008 samplings <strong>from</strong> four wetland sites
Appendix F: Plant tissue total phosphorous (TP) and total nitrogen (TN) <strong>from</strong> the Las Vegas<br />
Wash (LVW), Demonstration Wetland at the City <strong>of</strong> Henderson <strong>Water</strong> Reclamation Facility<br />
(HD), Pittman Wash Pilot Wetlands (PW) and Flamingo Wash (FW)<br />
TP (%)<br />
Site Season Plant Plant ID Shoot Root Total<br />
LVW Fall Typha P-1 0.07 0.12 0.09<br />
LVW Fall Typha P-2 0.18 0.15 0.17<br />
LVW Fall Typha P-3 0.07 0.09 0.08<br />
LVW Fall Typha P-4 0.09 0.07 0.08<br />
HD Fall Sch-cal P-1 0.05 0.08 0.06<br />
HD Fall Sch-cal P-2 0.08 0.07 0.07<br />
HD Fall Sch-cal P-3 0.10 0.16 0.13<br />
HD Fall Sch-cal P-4 0.07 0.14 0.10<br />
PW Fall Sch-cal P-1 0.05 0.09 0.07<br />
PW Fall Sch-cal P-2 0.01 0.04 0.03<br />
PW Fall Sch-cal P-3 0.02 0.03 0.03<br />
PW Fall Sch-cal P-4 0.02 0.05 0.04<br />
FW Fall Typha P-1 0.02 0.08 0.05<br />
FW Fall Typha P-2 0.02 0.04 0.03<br />
FW Fall Typha P-3 0.02 0.05 0.03<br />
FW Fall Typha P-4 0.02 0.04 0.03<br />
TN (%)<br />
Site Season Plant Plant ID Shoot Root Total<br />
LVW Fall Typha P-1 2.28 1.12 1.70<br />
LVW Fall Typha P-2 3.18 1.05 2.12<br />
LVW Fall Typha P-3 0.75 0.84 0.80<br />
LVW Fall Typha P-4 0.96 0.73 0.85<br />
HD Fall Sch-cal P-1 1.46 1.58 1.52<br />
HD Fall Sch-cal P-2 1.24 1.09 1.17<br />
HD Fall Sch-cal P-3 2.88 1.04 1.96<br />
HD Fall Sch-cal P-4 1.69 1.31 1.50<br />
PW Fall Sch-cal P-1 2.58 0.68 1.63<br />
PW Fall Sch-cal P-2 2.08 0.91 1.50<br />
PW Fall Sch-cal P-3 1.28 0.78 1.03<br />
PW Fall Sch-cal P-4 2.13 0.95 1.54<br />
FW Fall Typha P-1 1.24 0.72 0.98<br />
FW Fall Typha P-2 1.18 0.87 1.03<br />
FW Fall Typha P-3 1.15 0.63 0.89<br />
FW Fall Typha P-4 1.35 0.83 1.09