Survey of Seat Belt - Road Safety Authority
Survey of Seat Belt - Road Safety Authority
Survey of Seat Belt - Road Safety Authority
- No tags were found...

Create successful ePaper yourself
Turn your PDF publications into a flip-book with our unique Google optimized e-Paper software.
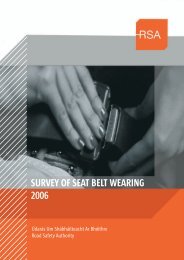
<strong>Survey</strong> <strong>of</strong> <strong>Seat</strong> <strong>Belt</strong> Wearing 2007<br />
Primary schools<br />
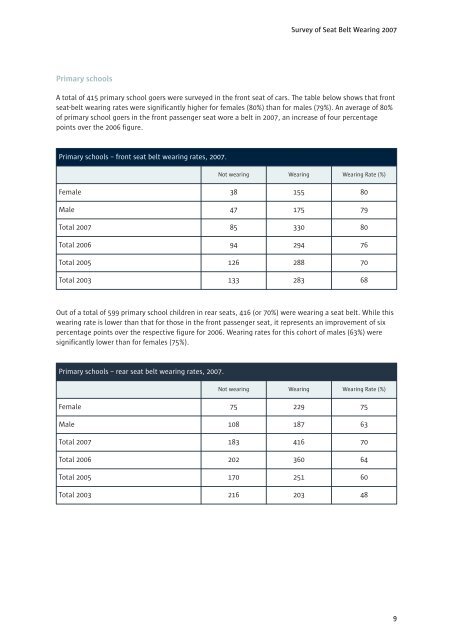
A total <strong>of</strong> 415 primary school goers were surveyed in the front seat <strong>of</strong> cars. The table below shows that front<br />
seat-belt wearing rates were significantly higher for females (80%) than for males (79%). An average <strong>of</strong> 80%<br />
<strong>of</strong> primary school goers in the front passenger seat wore a belt in 2007, an increase <strong>of</strong> four percentage<br />
points over the 2006 figure.<br />
Primary schools – front seat belt wearing rates, 2007.<br />
Not wearing Wearing Wearing Rate (%)<br />
Female 38 155 80<br />
Male 47 175 79<br />
Total 2007 85 330 80<br />
Total 2006 94 294 76<br />
Total 2005 126 288 70<br />
Total 2003 133 283 68<br />
Out <strong>of</strong> a total <strong>of</strong> 599 primary school children in rear seats, 416 (or 70%) were wearing a seat belt. While this<br />
wearing rate is lower than that for those in the front passenger seat, it represents an improvement <strong>of</strong> six<br />
percentage points over the respective figure for 2006. Wearing rates for this cohort <strong>of</strong> males (63%) were<br />
significantly lower than for females (75%).<br />
Primary schools – rear seat belt wearing rates, 2007.<br />
Not wearing Wearing Wearing Rate (%)<br />
Female 75 229 75<br />
Male 108 187 63<br />
Total 2007 183 416 70<br />
Total 2006 202 360 64<br />
Total 2005 170 251 60<br />
Total 2003 216 203 48<br />
9