2007 Annual Report - Jones Soda
2007 Annual Report - Jones Soda
2007 Annual Report - Jones Soda
- No tags were found...

Create successful ePaper yourself
Turn your PDF publications into a flip-book with our unique Google optimized e-Paper software.
<strong>2007</strong> ANNUAL REPORT
Comparison Of 5-year Cumulative Total Return*<br />
Among <strong>Jones</strong> <strong>Soda</strong> Co., The S & P 500 Index, a new peer group and an old peer group<br />
$6,000<br />
$5,000<br />
$4,000<br />
$3,000<br />
$2,000<br />
$1,000<br />
$0<br />
12/02<br />
12/03 12/04 12/05 12/06 12/07<br />
<strong>Jones</strong> <strong>Soda</strong> Co.<br />
S & P 500 New Peer Group Old Peer Group<br />
* $100 invested on 12/31/02 in stock or index-including reinvestment of dividends. Fiscal year ending December 31.<br />
12/02 12/03 12/04 12/05 12/06 12/07<br />
<strong>Jones</strong> <strong>Soda</strong> Co. 100.00 874.48 1443.51 2259.41 5146.44 3112.97<br />
S & P 500 100.00 128.68 142.69 149.70 173.34 182.87<br />
New Peer Group 100.00 146.47 152.31 187.16 274.03 287.05<br />
Old Peer Group 100.00 148.53 155.60 192.61 279.44 272.36<br />
The stock price performance included in this graph is not necessarily indicative of future stock price performance.<br />
The graph above compares the cumulative 5-year total return of holders of <strong>Jones</strong> <strong>Soda</strong> Co.’s common stock with the cumulative total<br />
returns of the S & P 500 Index as well as Old and New peer groups of companies. The New a peer group consists of five companies,<br />
which are: Clearly Canadian Beverage Corp., Cott Corp., Hansen Natural Corp., Leading Brands Inc and National Beverage<br />
Corportaion. The Old Peer Group consists of six companies which are Clearly Canadian Beverage Corp., Cott Corp., Hansen Natural<br />
Corp., Leading Brands Inc, National Beverage Corp. and Triarc Companies Inc. The graph assumes that the value of the investment<br />
in the company’s common stock, in each of the peer groups, and the index (including reinvestment of dividends) was $100 on<br />
12/31/2002 and tracks it through 12/31/<strong>2007</strong>.
Dear Shareholders,<br />
In Fiscal <strong>2007</strong>, <strong>Jones</strong> <strong>Soda</strong> Co. experienced both major successes and challenges. Most importantly, the<br />
transition from a niche business to main market availability helped to generate case sales volume and revenue<br />
levels for <strong>2007</strong> that were the highest in our history, which we believe proves that continued prudent investments<br />
in expansion are appropriate. However, extraordinary expenses were incurred to achieve these results, leading to<br />
disappointing financial performance. Specifically, <strong>Jones</strong> <strong>Soda</strong> reported a loss of $11 million or ($0.42 cents per<br />
share) for <strong>2007</strong>. We also recognize that our stock price fluctuated significantly over the course of the year. I<br />
would like to expand on these topics, discuss our near-term business objectives, and expand on our vision for the<br />
future.<br />
As you know, at year-end Peter van Stolk resigned as Chairman & Chief Executive Officer. Peter has been a<br />
creative and dynamic leader who not only invented an extraordinary brand but a revolutionary marketing model<br />
for how consumers connect to and define a brand. He was the marketing campaign behind <strong>Jones</strong>, with endless<br />
appearances and promotion of the brand. He will be missed by his <strong>Jones</strong> compatriots but will remain an<br />
inspirational leader on the board.<br />
Following Peter’s resignation, the board appointed Scott Bedbury Chairman and me Interim Chief<br />
Executive Officer. I intend to remain CEO at least through the current year in order to maintain continuity in our<br />
management team as we execute on our 2008 initiatives. We are rebuilding the senior leadership ranks with new<br />
high performing talent. Joth Ricci, whose varied working experience includes seven years in the beverage<br />
industry at Columbia Distributing, most recently as General Manager, has joined <strong>Jones</strong> as Chief Operating<br />
Officer and he has already made significant changes to our distribution infrastructure and in-store execution<br />
capability. We continue to strengthen our great team of people with important systems and processes that are<br />
designed to help them achieve a much higher level of success. The entire management team is committed to<br />
making <strong>Jones</strong> a high growth, profitable enterprise.<br />
<strong>Jones</strong> <strong>Soda</strong> is in the middle of a transition from a niche business model to a main market business model,<br />
which began in 2006. The objective of the transition is to create more sources of growth for the company through<br />
additional channels, retailers, packages, products, and ultimately more people enjoying our products.<br />
This transition continued throughout <strong>2007</strong> with many exciting initiatives. <strong>Jones</strong> introduced 12 ounce cans in<br />
multi-packs through our partnership with National Beverage Corp. allowing us to compete in more retail<br />
channels including mass merchandisers and grocery stores across the U.S. and Canada. We ended <strong>2007</strong> with<br />
<strong>Jones</strong> <strong>Soda</strong> cans on the shelves in approximately 15,000 new outlets that gave us an in-store presence in<br />
approximately 25% of the market for canned soda. The expansion to cans and more grocery outlets is an<br />
important new source of growth and is critical to our transition to main market availability.<br />
Early in <strong>2007</strong>, we improved the quality of our product by converting from high fructose corn syrup to pure<br />
cane sugar, which we believe is a superior quality sweetener that adds more flavor and creates a smoother taste.<br />
This leadership initiative continues to differentiate <strong>Jones</strong> from other national brands.<br />
We introduced <strong>Jones</strong> Cola, which we also sweetened with pure cane sugar, allowing us to compete in the<br />
largest CSD flavor category. National roll out is well under way and you should be able to purchase it at a local<br />
store soon.<br />
In late spring, <strong>Jones</strong> secured the pouring rights at Qwest Field and launched an important partnership with<br />
the Seattle Seahawks. This hometown community initiative provides us with a new opportunity to expand our<br />
presence in the Northwest and draw new consumers to the brand.<br />
Discussions with Alaska Airlines, another hometown leader, started later in <strong>2007</strong> and we are pleased to<br />
announce that the April 1 st kickoff as Alaska Airlines’ and Horizon Air’s official soft drink provider was a great<br />
success. We look forward to introducing our products to millions of Alaska and Horizon customers on their 1000<br />
daily flights across the country and beyond.
We believe the introduction of cans, <strong>Jones</strong> Cola, 15,000 more listings, a better sweetener system and<br />
business partnerships all create new sustainable sources of growth for the <strong>Jones</strong> <strong>Soda</strong> Co. and legitimize the<br />
brand as a national main market player with very edgy brand spirit.<br />
We also entered the bottled water market, which ACNielsen estimates at just over a $7 billion market with<br />
the introduction of 24C, an enhanced water beverage, which we believe presents a higher growth opportunity for<br />
our business. Since our <strong>2007</strong> test market exceeded our expectations, we are working to roll out 24C rapidly to<br />
more distributors and customers. We are pleased with the progress we have made in this market.<br />
Despite the quality of our transition strategy and everyone’s hard work, we were disappointed in our <strong>2007</strong><br />
financial results. While record case sales and 22% year-over-year case sales growth were achieved, these results<br />
were well short of our expectations. Consequently, revenue did not meet our expectations. In addition, we made<br />
considerable investments in listing fees and price discounts, wrote off raw materials, packages and finished<br />
goods, and incurred unexpected severance costs. We recorded a $9.4 million loss before taxes and a valuation<br />
allowance on our deferred taxes which resulted in a total loss of $11 million or $0.42 cents per share.<br />
As we move forward, our transition agenda is focused on six very important initiatives.<br />
1) We are strengthening and expanding our distribution infrastructure. This is the backbone of our<br />
business. Stronger distribution capability will enable us to increase our reach into additional<br />
markets more effectively. We recently reached agreement with Phoenix in Manhattan and<br />
reconnected with Haralambos in Los Angeles, both examples of upgrading our system.<br />
2) We are upgrading our sales and customer management team with a focus on maximizing our sales<br />
potential at current retail outlets and expanding into new outlets where appropriate. As part of this<br />
initiative, we are implementing new in-store merchandising programs that are designed to increase<br />
volume at each of our current outlets thereby leveraging our new listings. We are reducing out of<br />
stocks and working to make our brands available at multiple locations through each store.<br />
Efficient in-store inventory management is a high priority for us in 2008.<br />
3) We will improve Supply Chain Management to increase average margin per case.<br />
4) We will upgrade our marketing team and develop programs that are capable of generating brand<br />
love, buzz and purchases.<br />
5) New products, packages and approaches are imperative to growth. We are investing in the<br />
innovation and commercialization of products and packages to attract new users.<br />
6) Systems and processes which enable us to control our business and help us make better judgments<br />
are keys to improving performance. Our people are getting the tools they need to perform well.<br />
The <strong>Jones</strong> <strong>Soda</strong> transition is focused on these six initiatives in order to create new sources of growth and<br />
return us to a profitable enterprise. And while <strong>2007</strong> was a difficult year for everyone, we are excited about our<br />
transition to the main market and we are confident that profitable growth is attainable in the future.<br />
To all of our employees, partners and customers who are working hard to implement these initiatives, I<br />
would like to thank you for your dedication and determination to succeed.<br />
I’d also like to thank our many shareholders for your continued support.<br />
Sincerely,<br />
Stephen C. <strong>Jones</strong><br />
Interim Chief Executive Officer
UNITED STATES<br />
SECURITIES AND EXCHANGE COMMISSION<br />
Washington, D.C. 20549<br />
FORM 10-K<br />
È ANNUAL REPORT PURSUANT TO SECTION 13 OR 15(d) OF THE SECURITIES<br />
EXCHANGE ACT OF 1934<br />
For the fiscal year ended December 31, <strong>2007</strong><br />
‘ TRANSITION REPORT PURSUANT TO SECTION 13 OR 15(d) OF THE SECURITIES<br />
EXCHANGE ACT OF 1934<br />
For the transition period from<br />
to<br />
Commission File Number: 000-28820<br />
JONES SODA CO.<br />
(Exact name of registrant as specified in its charter)<br />
Washington 91-1696175<br />
(State or other jurisdiction of<br />
incorporation or organization)<br />
(I.R.S. Employer<br />
Identification No.)<br />
234 Ninth Avenue North<br />
Seattle, WA 98109<br />
(Address of principal executive offices)<br />
(206) 624-3357<br />
(Registrant’s telephone number)<br />
Securities registered under Section 12(b) of the Exchange Act<br />
Name of Each Exchange on<br />
Title of Each Class<br />
Which Registered<br />
Common Stock, no par value<br />
The NASDAQ Stock Market LLC<br />
Securities registered under Section 12(g) of the Exchange Act: None<br />
Check whether the registrant is a well-known seasoned issuer, as defined in Rule 405 of the Securities<br />
Act. Yes ‘ No È<br />
Check whether the registrant is not required to file reports pursuant to Section 13 or 15(d) of the Exchange Act. ‘<br />
Check whether the registrant (1) filed all reports required to be filed by Section 13 or 15(d) of the Exchange Act during<br />
the past 12 months (or for such shorter period that the registrant was required to file such reports), and (2) has been subject to<br />
such filing requirements for the past 90 days. Yes È No ‘<br />
Check if no disclosure of delinquent filers in response to Item 405 of Regulation S-K is contained in this form, and no<br />
disclosure will be contained, to the best of registrant’s knowledge, in definitive proxy or information statements incorporated<br />
by reference in Part III of this Form 10-K or any amendment to this Form 10-K. ‘<br />
Indicate by check mark whether the registrant is a large accelerated filer, an accelerated filer, a non-accelerated filer, or<br />
a smaller reporting company. See definition of “accelerated filer” in Rule 12b-2 of the Exchange Act. (Check one):<br />
Large Accelerated Filer ‘ Accelerated Filer È<br />
Non-Accelerated Filer ‘ (Do not check if a smaller reporting company) Smaller <strong>Report</strong>ing Company ‘<br />
Check whether the registrant is a shell company (as defined in Rule 12b-2 of the Exchange Act). Yes ‘ No È<br />
Registrant’s revenues for its most recent fiscal year: $39,830,933<br />
As of March 6, 2008, there were 26,273,388 shares of the Company’s common stock issued and outstanding. As of the<br />
last business day of the second fiscal quarter, June 30, <strong>2007</strong>, the aggregate market value of such common stock held by<br />
non-affiliates was approximately $345,780,000 using the closing price on that day of $14.02.<br />
Documents Incorporated By Reference: The information required by Part III of this <strong>Report</strong>, to the extent not set<br />
forth herein, is incorporated in this <strong>Report</strong> by reference to the Company’s definitive proxy statement relating to its 2008<br />
annual meeting of shareholders. The definitive proxy statement will be filed with the Securities and Exchange Commission<br />
within 120 days after the end of the <strong>2007</strong> fiscal year.
EXPLANATORY NOTE<br />
Unless otherwise indicated or the context otherwise requires, all references in this <strong>Annual</strong> <strong>Report</strong> on Form<br />
10-K to “we,” “us,” “our,” and the “Company” are to <strong>Jones</strong> <strong>Soda</strong> Co. ® , a Washington corporation, and our<br />
wholly-owned subsidiaries <strong>Jones</strong> <strong>Soda</strong> Co. (USA) Inc., <strong>Jones</strong> <strong>Soda</strong> (Canada) Inc., my<strong>Jones</strong>.com Inc. and<br />
Whoopass USA Inc.<br />
In addition, unless otherwise indicated or the context otherwise requires, all references in this <strong>Annual</strong><br />
<strong>Report</strong> to “<strong>Jones</strong> <strong>Soda</strong>” and “<strong>Jones</strong> Pure Cane <strong>Soda</strong>” refer to our premium soda sold under the trademarked<br />
brand name “<strong>Jones</strong> <strong>Soda</strong> Co.”<br />
CAUTIONARY NOTICE REGARDING FORWARD LOOKING STATEMENTS<br />
We desire to take advantage of the “safe harbor” provisions of the Private Securities Litigation Reform Act<br />
of 1995. This <strong>Annual</strong> <strong>Report</strong> on Form 10-K and the documents incorporated herein by reference contain a<br />
number of forward-looking statements that reflect management’s current views and expectations with respect to<br />
our business, strategies, products, future results and events and financial performance. All statements made in<br />
this <strong>Report</strong> other than statements of historical fact, including statements that address operating performance,<br />
events or developments that management expects or anticipates will or may occur in the future, including<br />
statements related to distributor channels, volume growth, revenues, profitability, new products, adequacy of<br />
funds from operations, statements expressing general optimism about future operating results and non-historical<br />
information, are forward looking statements. In particular, the words such as “believe,” “expect,” “intend,”<br />
“anticipate,” “estimate,” “may,” “will,” “should,” “plan,” “predict,” “could,” “future,” “stock,” “target,”<br />
variations of such words, and similar expressions identify forward-looking statements, but are not the exclusive<br />
means of identifying such statements and their absence does not mean that the statement is not forward-looking.<br />
Readers should not place undue reliance on these forward-looking statements, which are based on<br />
management’s current expectations and projections about future events, are not guarantees of future<br />
performance, are subject to risks, uncertainties and assumptions and apply only as of the date of this <strong>Report</strong>. Our<br />
actual results, performance or achievements could differ materially from historical results as well the results<br />
expressed in, anticipated or implied by these forward-looking statements. Except as required by law, we<br />
undertake no obligation to publicly update or revise any forward-looking statements, whether as a result of new<br />
information, future events or otherwise.<br />
For a discussion of some of the factors that may affect our business, results and prospects, see “Item 1A.<br />
RISK FACTORS.” Readers are urged to carefully review and consider the various disclosures made by us in this<br />
<strong>Report</strong> and in our other reports we file with the Securities and Exchange Commission, including our periodic<br />
reports on Forms 10-Q and 8-K, and those described from time to time in our press releases and other<br />
communications, which attempt to advise interested parties of the risks and factors that may affect our business,<br />
prospects and results of operations.
JONES SODA CO.<br />
ANNUAL REPORT ON FORM 10-K FOR THE FISCAL YEAR ENDED DECEMBER 31, <strong>2007</strong><br />
Table of Contents<br />
Page<br />
PART I<br />
Item 1. Our Business .................................................................. 1<br />
Item 1A. Risk Factors .................................................................. 15<br />
Item 1B. Unresolved Staff Comments ..................................................... 27<br />
Item 2. Property ..................................................................... 27<br />
Item 3. Legal Proceedings ............................................................. 27<br />
Item 4. Submission of Matters to a Vote of Security Holders .................................. 28<br />
PART II<br />
Item 5. Market for Common Stock, Related Shareholder Matters and Issuer Purchases of Equity<br />
Securities .................................................................. 29<br />
Item 6. Selected Financial Data ......................................................... 30<br />
Item 7. Management’s Discussion and Analysis of Financial Condition and Results of Operations .... 30<br />
Item 7A. Quantitative and Qualitative Disclosures About Market Risk ............................ 44<br />
Item 8. Financial Statements and Supplementary Data ....................................... 44<br />
Item 9. Changes in and Disagreements with Accountants on Accounting and Financial Disclosure .... 44<br />
Item 9A. Controls and Procedures ......................................................... 44<br />
Item 9B. Other Information .............................................................. 49<br />
PART III<br />
Item 10. Directors, Executive Officers and Corporate Governance ............................... 49<br />
Item 11. Executive Compensation ........................................................ 49<br />
Item 12. Security Ownership of Certain Beneficial Owners and Management and Related Shareholder<br />
Matters .................................................................... 49<br />
Item 13. Certain Relationships and Related Transactions, and Director Independence ................ 50<br />
Item 14. Principal Accountant Fees and Services ............................................ 50<br />
PART IV<br />
Item 15. Exhibits and Financial Statement Schedules ......................................... 50<br />
SIGNATURES ........................................................................ 54
PART I<br />
ITEM 1. OUR BUSINESS.<br />
Overview<br />
We develop, produce, market and distribute “New Age” or “Premium” beverages. We currently produce,<br />
market and distribute six beverage brands:<br />
• <strong>Jones</strong> Pure Cane <strong>Soda</strong>, a “premium” soda;<br />
• <strong>Jones</strong> 24C, an enhanced water beverage;<br />
• <strong>Jones</strong> Organics, a ready-to-drink organic tea;<br />
• <strong>Jones</strong> Energy, a citrus energy drink;<br />
• Whoop Ass Energy Drink ® , a citrus energy drink; and<br />
• <strong>Jones</strong> Naturals ® , a non-carbonated juice & tea.<br />
Our business strategy is to increase sales by expanding distribution of our brands in new and existing<br />
markets, stimulating consumer trial of our products and increasing consumer awareness of, and brand loyalty to,<br />
our brands and products. Key elements of our business strategy include:<br />
• creating strong distributor relationships and key accounts;<br />
• stimulating strong consumer demand for our existing brands and products, with primary emphasis in the<br />
United States and Canada;<br />
• developing innovative alternative beverage brands and products; and<br />
• licensing our brand equity for the creation of other beverage or non-beverage products.<br />
We currently sell and distribute our products throughout the United States and Canada through our network<br />
of independent distributors, which we refer to as our “direct store delivery” channel (DSD) and our national retail<br />
accounts, which we refer to as our “direct to retail” channel (DTR), as well as through licensing and distribution<br />
arrangements.<br />
We also participate in the carbonated soft drink (CSD) industry through distribution and sales of our<br />
12-ounce cans of <strong>Jones</strong> Pure Cane <strong>Soda</strong> through an exclusive arrangement with National Beverage Corp. in<br />
grocery and mass merchant channels in the U.S.<br />
With respect to our “direct store delivery” channel (DSD), we have focused our sales and marketing<br />
resources on the expansion and penetration of our products through our independent distributor network in our<br />
core markets consisting of the Northwest, Southwest and Midwest U.S., and Western Canada, as well as targeted<br />
expansion into our less penetrated markets consisting of the Northeast and Southeast U.S., and Eastern Canada.<br />
We launched our “direct to retail” business strategy in 2003 as a complementary channel of distribution to<br />
our DSD channel, targeting large national retail accounts. Through these programs, we negotiate directly with<br />
large national retailers, primarily premier food-service based businesses, to carry our products, serviced through<br />
the retailer’s appointed distribution system. We currently have distribution arrangements with Barnes & Noble,<br />
Inc., Panera Bread Company, Target Corporation, Sam’s Club and Wal-Mart Stores, Inc.<br />
Beginning in 2004, we launched our licensing business strategy as a method to extend our brand into<br />
non-alternative beverage products and non-beverage products. We currently have licensing arrangements with<br />
two companies: Big Sky Brands, Inc. and J&J Snack Food Corp. With these licensing agreements, we believe<br />
that we are able to partner with companies that can manufacture <strong>Jones</strong> related-products and extend our <strong>Jones</strong><br />
brand into select products that we feel enhance our brand image.<br />
1
In December 2006, we announced the transition from high-fructose corn syrup to pure cane sugar for all our<br />
bottled and canned products. Our co-packers commenced production of <strong>Jones</strong> Pure Cane <strong>Soda</strong> in January <strong>2007</strong><br />
and it was launched in the second quarter of <strong>2007</strong>.<br />
We entered into Sponsorship Agreements with Football Northwest LLC (d/b/a Seattle Seahawks) and<br />
First & Goal, Inc. on May 22, <strong>2007</strong>, and Brooklyn Arena LLC and New Jersey Nets Basketball, LLC on<br />
November 8, <strong>2007</strong> that provide us with the exclusive beverage rights for certain soft drinks as well as signage,<br />
advertising and other promotional benefits to enhance our brand awareness.<br />
Our company is a Washington corporation formed in 2000 as a successor to Urban Juice and <strong>Soda</strong> Company<br />
Ltd., a Canadian company formed in 1987. Our principal place of business is located at 234 Ninth Avenue North,<br />
Seattle, Washington 98109. Our telephone number is (206) 624-3357.<br />
The New Age or Alternative Beverage Industry<br />
<strong>Jones</strong> Pure Cane <strong>Soda</strong>, <strong>Jones</strong> Organics, <strong>Jones</strong> Energy, Whoop Ass Energy Drink ® and <strong>Jones</strong><br />
Naturals ® , which are classified as New Age or alternative beverages, as well as other brands and products that<br />
we may develop in the future, compete with beverage products of all types, including soft drinks, fruit juices and<br />
drinks and bottled water.<br />
The New Age or alternative beverage markets are estimated at over $16 billion in total annual sales.<br />
New Age or alternative beverages are distinguishable from mainstream carbonated soft drinks in that they<br />
tend to contain natural ingredients combined with less sugar and carbonation. As a general rule, three criteria<br />
have been established for the New Age or alternative beverage classification: (1) relatively new introduction to<br />
the market-place; (2) a perception by consumers that consumption is healthful compared to mainstream<br />
carbonated soft drinks; and (3) the use of natural ingredients and flavors in the products. According to market<br />
research, the New Age or alternative beverage categories include: energy drinks; premium soda; ready-to-drink<br />
(RTD) coffee; RTD tea; RTD tea (nutrient-enhanced); shelf-stable dairy (regular/diet); shelf-stable dairy<br />
(nutrient-enhanced); single-serve-fruit beverages (regular/diet); single-serve-fruit beverages (nutrient enhanced);<br />
smoothies; sparkling water; sports drinks; vegetable/fruit juice blends; and other New Age beverages.<br />
The Carbonated Soft Drink (CSD) Industry<br />
We currently participate in the carbonated soft drink (CSD) industry through the distribution and sale of our<br />
12-ounce cans of <strong>Jones</strong> Pure Cane <strong>Soda</strong>.<br />
The CSD industry includes all soda products that are sold primarily in 12-ounce cans and generally compete<br />
on price. The carbonated soft drink category is estimated at approximately $70.0 billion in total annual sales.<br />
Following many years of growth, in 1999, the CSD category began to experience six straight years of sub-1%<br />
growth and showed per capita consumption declines. However, the CSD category remains significant in size, in<br />
terms of both volume and sales, and its market share is far larger than any other beverage category. The primary<br />
companies participating in this category include The Coca-Cola Company, PepsiCo, Inc., Cadbury Schweppes<br />
plc, Cott Corporation and National Beverage Corp.<br />
In October 2004, we entered the mainstream segment of the carbonated soft drink industry with the launch<br />
of our <strong>Jones</strong> <strong>Soda</strong> product in the 12-ounce can format. These 12-ounce cans of <strong>Jones</strong> <strong>Soda</strong> were sold under a<br />
two-year exclusive marketing and distribution agreement with Target Corporation, which expired on<br />
December 31, 2006.<br />
In September 2006, we entered into an exclusive manufacturing and distribution agreement with National<br />
Beverage Corp. to manufacture and distribute <strong>Jones</strong> <strong>Soda</strong> 12-ounce cans and <strong>Jones</strong> Energy in 16-ounce cans to<br />
the grocery and mass merchant channel in the U.S. Beginning in January <strong>2007</strong>, National Beverage Corp. started<br />
selling <strong>Jones</strong> Pure Cane <strong>Soda</strong> to retailers in the U.S.<br />
2
Business Strategy<br />
In late 1995, we launched <strong>Jones</strong> <strong>Soda</strong>, our premium soda product under our trademarked brand. By<br />
launching <strong>Jones</strong> <strong>Soda</strong>, we believed we were creating a new category in the New Age beverage market and that<br />
we were offering distributors something new to sell. In its January 1998 issue, Beverage Aisle magazine changed<br />
the name of the “all-natural soda” segment to the “premium soda” segment and cited <strong>Jones</strong> <strong>Soda</strong> as an example<br />
of a beverage in this category. Thus, we believe that the <strong>Jones</strong> <strong>Soda</strong> brand and product line helped to create a<br />
new segment in the New Age or alternative beverage industry. In developing the <strong>Jones</strong> <strong>Soda</strong> brand, we have<br />
marketed our products with a distinct fashion component consisting of black and white photos on our labels,<br />
which we believe is representative of current overall fashion trends.<br />
Utilizing creative but relatively low cost marketing and brand promotion techniques, we have focused on<br />
building a strong distributor network and presence with national retail accounts for our lead brand, <strong>Jones</strong> <strong>Soda</strong>.<br />
We believe that our past experience as a distributor of licensed and non-licensed New Age beverage brands has<br />
given, and will continue to give, our company credibility in connection with our efforts to build a quality network<br />
of independent distributors. Sales of our products through our distributor network, and the strength of our brand,<br />
provided us with opportunities to implement and grow our DTR strategy through national retail accounts. We<br />
have also entered into sports franchise sponsorship arrangements with the Seattle Seahawks of the National<br />
Football League and the New Jersey Nets of the National Basketball Association. The sponsorship arrangements<br />
provide us with exclusive rights to sell our beverages at sports venues. We expect these national accounts and<br />
sponsorship arrangements to continue to increase the public awareness and strength of our brand and provide us<br />
with other cross-selling opportunities through our licensing business strategy.<br />
Our business strategy is to attempt to increase sales by expanding product distribution in new and existing<br />
markets (primarily within North America), stimulating consumer trial of our products and creating and increasing<br />
consumer awareness of, and brand loyalty to, our brands and products. In <strong>2007</strong>, through our independent<br />
distributor network, we continued to focus on our core markets, as well as targeted expansion into our less<br />
penetrated markets consisting of the Northeast and Southeast U.S., and Eastern Canada.<br />
Since 2003, we grew our “direct to retail” distribution strategy to large national retail accounts, currently<br />
consisting of Target Corporation, Panera Bread Company, Barnes & Noble, Inc., Sam’s Club and Wal-Mart<br />
Stores, Inc. During 2008, we intend to continue servicing and expanding our “direct to retail” channel to national<br />
retail accounts.<br />
In 2004, we also launched our licensing business strategy as a method to extend our brand into<br />
non-alternative beverage products and non-beverage products. In July 2004, we entered into a licensing<br />
agreement with Target Corporation to market and sell <strong>Jones</strong> <strong>Soda</strong> in a 12-ounce can format and we now compete<br />
directly in the carbonated soft drink industry. This agreement with Target expired on December 31, 2006. In<br />
September 2005, we entered into a licensing agreement with Big Sky Brands, Inc. to manufacture and distribute<br />
<strong>Jones</strong> <strong>Soda</strong> Flavor Booster hard candy. In February <strong>2007</strong>, we entered into a licensing agreement with J&J Snack<br />
Foods for the use of our flavors and brand name for their slurpee and iced beverages.<br />
<strong>Jones</strong> <strong>Soda</strong> understands the importance of creating new beverage items and enhancing our existing beverage<br />
items to meet the ever changing consumer taste profile. Our strategy is to be focused on innovative products that<br />
will be accepted by retailers, distributors and consumers. We believe this is accomplished by keeping open dialog<br />
with our retail and distributor partners to ensure we are current with the consumer trends in the beverage<br />
industry.<br />
Key elements of our business strategy include the following:<br />
Building our Brand<br />
We believe the market for alternative beverages is dependent to a large extent on image as well as taste, and<br />
that this market is driven by trendy, young consumers between the ages of 12 and 29. Accordingly, our strategy<br />
3
is to develop innovative brand names, slogans and trade dress. In addition to creative labeling on our products,<br />
we provide each of our distributors with point-of-sale promotional materials and branded apparel items. We<br />
promote interaction with our customers through the use of these point-of-sale items, such as posters, stickers,<br />
table cards, shelf danglers, post cards, hats, pins, T-shirts, and our proprietary lighted display box. In addition,<br />
through the labels on our bottles, we invite consumers to access our website and to send in photographs to be<br />
featured on the <strong>Jones</strong> <strong>Soda</strong> and <strong>Jones</strong> Naturals labels. We believe that our labeling, marketing and promotional<br />
materials are important elements to creating and increasing distributor, retailer and consumer awareness of our<br />
brands and products.<br />
Independent Distributor Network (“DSD”)<br />
We distribute our finished products through a network of independent distributors in the United States and<br />
Canada. We have also obtained listings for selected skus of our <strong>Jones</strong> Pure Cane <strong>Soda</strong>, <strong>Jones</strong> Organics,<br />
<strong>Jones</strong> Energy, Whoop Ass Energy Drink ® and <strong>Jones</strong> Naturals ® brands with certain key retail grocery accounts,<br />
including Quality Food Centers (QFC), Meijer, Allsups Convenience Stores, The Kroger Co., Albertsons,<br />
Safeway Inc., and Speedway Super America LLC, which are serviced through our independent distributor<br />
network. We have pursued this strategy both in an effort to increase sales and to encourage distributors to<br />
distribute our brands and products to our key accounts and other accounts of our distributors.<br />
We usually grant independent distributors the exclusive right to distribute finished cases of one or more of<br />
our brands in a particular region, province, state or local territory, subject to our overall management directives.<br />
We have entered into written agreements with many of our top distributors for varying terms of years. However,<br />
most of our distribution relationships are oral (based solely on purchase orders) and are terminable by either<br />
party. In most of our written agreements, we would have to pay a fee to a distributor with an exclusive territory<br />
in the event we provided product directly to one of our national retailers located in the distributor’s region. We<br />
are also obligated to pay termination fees for cancellations of most of these written distributor agreements, which<br />
have terms ranging from one to three years.<br />
We select distributors who we believe will have the ability to get our brands and products on the “street<br />
level” retail shelves in convenience stores, delicatessens, sandwich shops and selected supermarkets.<br />
Ultimately, we have chosen, and will continue to choose, our distributors based on their perceived ability to<br />
build our brand franchise. We currently maintain a network of approximately 265 distributors in 48 states in the<br />
United States and 9 provinces in Canada.<br />
“Direct to Retail” National Accounts (“DTR”)<br />
Beginning in 2003, we launched our “direct to retail” business strategy as a complementary channel of<br />
distribution, targeting large national retail accounts. Through these programs, we negotiate directly with large<br />
national retailers, primarily premier food-service based businesses, to carry our products, serviced by the<br />
retailer’s appointed distribution system. As of the date of this <strong>Report</strong>, our most significant “direct to retail”<br />
accounts are the following:<br />
• Target Corporation—launched in October 2004, currently for 3 flavors of <strong>Jones</strong> <strong>Soda</strong>;<br />
• Panera Bread Company—launched in June 2003, currently for 4 flavors of <strong>Jones</strong> <strong>Soda</strong>, 3 flavors of <strong>Jones</strong><br />
Naturals, and 2 flavors of <strong>Jones</strong> Organics in all Panera bakery-cafes in the United States;<br />
• Barnes & Noble, Inc.—launched in February 2003, currently for 5 flavors of <strong>Jones</strong> Naturals in all<br />
Barnes & Noble stores in the United States;<br />
• Sam’s Club—launched in March <strong>2007</strong>, currently for a 6 flavor, 24-bottle <strong>Jones</strong> <strong>Soda</strong> variety pack; and<br />
• Wal-Mart—launched in May <strong>2007</strong>, currently for 4 flavors of <strong>Jones</strong> <strong>Soda</strong>.<br />
4
These arrangements are not long term and are terminable at any time by these retailers. There are no<br />
minimum purchase commitments for these retailers.<br />
Carbonated Soft Drink<br />
In October 2004, we entered the carbonated soft drink industry with the launch of our <strong>Jones</strong> <strong>Soda</strong> product in<br />
the 12-ounce can format under a two-year exclusive marketing and distribution agreement with Target<br />
Corporation. With the expiration of this exclusive agreement on December 31, 2006, beginning in <strong>2007</strong> we<br />
expanded distribution to the grocery and mass merchant channel in the United States with our exclusive<br />
manufacturing and distribution agreement with National Beverage Corp. Through this arrangement, we are<br />
identifying and securing retailers across the United States for our premium carbonated 12-ounce soft drinks and<br />
16-ounce energy drink products, and we are solely responsible for all sales efforts, marketing, advertising and<br />
promotion. Using concentrate supplied by <strong>Jones</strong>, National Beverage will both manufacture and sell on an<br />
exclusive basis the products directly to retailers. National Beverage is responsible for the manufacturing, delivery<br />
and invoicing of the sales of our products in this channel.<br />
Licensing Arrangements<br />
Beginning in 2004, we launched our licensing business strategy as a method to extend our brand into<br />
non-alternative beverage products and non-beverage products. We currently have licensing arrangements with<br />
two companies. In September 2005, we entered into a licensing agreement with Big Sky Brands, Inc. to<br />
manufacture and distribute <strong>Jones</strong> <strong>Soda</strong> Flavor Booster hard candy. In February <strong>2007</strong>, we entered into a licensing<br />
agreement with J&J Snack Foods for the use of our flavors and brand name for their slurpee and iced beverages.<br />
With these licensing agreements, we believe that we are able to partner with companies that are able to<br />
manufacture <strong>Jones</strong> related products and extend our <strong>Jones</strong> brand into select products that we feel enhance our<br />
brand image.<br />
Sponsorship Arrangements<br />
In May <strong>2007</strong>, we entered into a Sponsorship Agreement with the Seattle Seahawks of the National Football<br />
League and First and Goal, Inc. in exchange for exclusive beverage rights for certain soft drinks at Qwest Field<br />
as well as signage, advertising and other promotional benefits to enhance our brand awareness, including<br />
sponsorship and trademark rights regarding the use of Seattle Seahawks trademarks. In consideration for our<br />
rights under the agreement, we are obligated to pay annual sponsorship fees, as well as provide beverage<br />
products as payment-in-kind. The agreement has an effective date of July 1, <strong>2007</strong> and expires on February 28,<br />
2012, and provides <strong>Jones</strong> <strong>Soda</strong> with a right of first renewal with respect to its renewal or extension. Generally,<br />
either party may terminate the agreement only if the other breaches any material term of the agreement and fails<br />
to cure such breach within 30 days of receiving notice of the breach. In addition, the Seattle Seahawks may<br />
terminate the agreement if <strong>Jones</strong> <strong>Soda</strong> fails to make a required payment and such failure continues for 30 days<br />
after <strong>Jones</strong> <strong>Soda</strong> receives written notice of the failure.<br />
In November <strong>2007</strong>, we announced our entry into a Sponsorship & Beverage Availability Agreement with<br />
Brooklyn Arena, LLC and New Jersey Nets Basketball, LLC. The agreement has a commencement date of<br />
October 29, <strong>2007</strong>; however, the agreement is subject to the approval of NBA Properties, Inc. and will not be<br />
effective until expressly approved by NBA Properties. As of the date of the filing of this <strong>Annual</strong> <strong>Report</strong> on Form<br />
10-K, NBA Properties has not approved the agreement.<br />
The agreement with Brooklyn Arena LLC and New Jersey Nets Basketball, LLC provides us with exclusive<br />
beverage rights for all carbonated soft-drinks and certain other non-alcoholic beverages, as well as sponsorship,<br />
promotional, media, hospitality and other rights in connection with the New Jersey Nets basketball team and a<br />
proposed new sports and entertainment arena that the Brooklyn Arena and the New Jersey Nets intend to develop<br />
in Brooklyn, New York. In consideration for our rights under the agreement, we are obligated to pay annual<br />
5
sponsorship fees, as well as provide beverage products as payment-in-kind. The Brooklyn Arena and the New<br />
Jersey Nets may terminate the agreement if we commit one of several events of default and subsequently fail to<br />
cure such event of default within the applicable cure period. We may terminate the agreement only if the<br />
Brooklyn Arena and the New Jersey Nets commit one of several events of default and subsequently fail to cure<br />
such event of default within the applicable cure period, but only if equitable adjustment, make-goods or other<br />
remedies implemented by the Brooklyn Arena and the New Jersey Nets are not suitable or appropriate for such<br />
event of default.<br />
In-House Brand and Product Development<br />
We have developed and intend to continue to develop the majority of our brands and products in-house. We<br />
used a similar process initially to create the <strong>Jones</strong> <strong>Soda</strong> brand, and we intend to continue utilizing this process in<br />
connection with the creation of our future brands. This process primarily consists of the following steps:<br />
Market Evaluation. We evaluate the strengths and weaknesses of certain categories and segments of<br />
the beverage industry with a view to pinpointing potential opportunities.<br />
Distributor Evaluation. We prepare an analysis of existing and potential distribution channels,<br />
whether DSD or DTR. This analysis addresses, among other things, which companies will distribute<br />
particular beverage brands and products, where such companies may distribute such brands and products,<br />
and what will motivate these distributors to distribute such brands and products.<br />
Production Evaluation. We review all aspects of production in the beverage industry, including<br />
current contract packing capacity, strategic production locations, and quality control, and prepare a cost<br />
analysis of the various considerations that will be critical to producing our brands and products.<br />
Image and Design. In light of our market, distributor and production evaluations, we create and<br />
develop the concept for a beverage brand or product extension. Although we control all aspects of the<br />
creation of each brand or product extension, we contract with outside creative artists to help design our<br />
brand labels and imagery. Our technical services department then works with various flavor concentrate<br />
houses to test, choose and develop product flavors for the brand.<br />
Due to the limited life cycle of beverages in the New Age or alternative category, we believe that the<br />
ongoing process of creating new brands, products and product extensions will be an important factor in our longterm<br />
success.<br />
Products<br />
We currently produce, market and distribute six beverage brands: <strong>Jones</strong> Pure Cane <strong>Soda</strong>, <strong>Jones</strong> 24C<br />
<strong>Jones</strong> Organics, <strong>Jones</strong> Energy, Whoop Ass Energy Drink ® , and <strong>Jones</strong> Naturals ® . We are also in the process of<br />
developing a new product, <strong>Jones</strong> GABA.<br />
<strong>Jones</strong> Pure Cane <strong>Soda</strong><br />
We believe that our trademarked <strong>Jones</strong> <strong>Soda</strong> brand and product line is a leader in the Premium <strong>Soda</strong><br />
segment of the New Age beverage category. We originally launched <strong>Jones</strong> <strong>Soda</strong> in November 1995.<br />
In December 2006, we announced a changeover to pure cane sugar for our entire product line-up. We started<br />
producing pure cane soda products in the first quarter of <strong>2007</strong>. We have rebranded our soda to <strong>Jones</strong> Pure Cane<br />
<strong>Soda</strong>. The <strong>Jones</strong> <strong>Soda</strong> product line currently consists of 11 flavors.<br />
6
In 2003, we launched a sugar-free version of our <strong>Jones</strong> <strong>Soda</strong> line. These sugar-free sodas are sweetened<br />
with Splenda ® and have zero calories and zero carbohydrates. We believe that the launch of our sugar-free <strong>Jones</strong><br />
<strong>Soda</strong> provides a healthier alternative to our regular <strong>Jones</strong> <strong>Soda</strong> line and is an important product extension,<br />
especially in light of the recent concern and media coverage regarding obesity in young people. We currently<br />
have five flavors of sugar-free <strong>Jones</strong> <strong>Soda</strong>.<br />
<strong>Jones</strong> <strong>Soda</strong> beverage products come in 12-ounce (355 ml) clear long-neck bottles with primarily black and<br />
white photos on our labels displaying a variety of urban images. We also encourage consumers of <strong>Jones</strong> <strong>Soda</strong>,<br />
through the labels on our bottles, to send in photographs that may potentially be used on one of the <strong>Jones</strong> <strong>Soda</strong><br />
labels. We launched the 12-ounce can format in 2004.<br />
<strong>Jones</strong> 24C<br />
In June 2006, we purchased the trademark rights to 24C. <strong>Jones</strong> 24C, an enhanced water beverage, has 100%<br />
natural flavors and contains daily vitamin requirements and is available in six flavors. We began production and<br />
distribution of <strong>Jones</strong> 24C in the first quarter of <strong>2007</strong>. 24C is available in 20oz PET bottles and a powdered drink<br />
mix.<br />
<strong>Jones</strong> Organics<br />
In April 2005, we launched <strong>Jones</strong> Organics, a ready-to-drink organic tea, with 60 calories per serving,<br />
sweetened with organic cane sugar. <strong>Jones</strong> Organics comes in 14-ounce proprietary clear glass bottles with a<br />
design of the fruit on the front label, but does not contain the usual black and white photograph labels used on<br />
<strong>Jones</strong> <strong>Soda</strong> and <strong>Jones</strong> Naturals product labels. The <strong>Jones</strong> Organics line currently consists of six flavors.<br />
<strong>Jones</strong> Energy<br />
In November 2001, we launched <strong>Jones</strong> Energy, a citrus energy drink containing vitamin B6, riboflavin,<br />
niacin, thiamin, caffeine and coQ-10. <strong>Jones</strong> Energy is currently available in a 16-ounce can and in an 8.4 ounce<br />
“four-pack” carrier format in three different flavors. Our <strong>Jones</strong> Energy products compete in the Energy Drink<br />
category of the New Age beverage industry.<br />
Whoop Ass Energy Drink ®<br />
We originally launched Whoop Ass in October 1999. Whoop Ass is a citrus energy drink in an 8.4- ounce<br />
(250 ml) slim can containing riboflavin, niacin, vitamin B6 and thiamin. In 2005, we launched a 16-ounce<br />
version of our Whoop Ass Energy Drink. Whoop Ass competes in the Energy Drink category of the New Age<br />
beverage industry.<br />
<strong>Jones</strong> Naturals ®<br />
In April 2001, we launched <strong>Jones</strong> Naturals, our non-carbonated beverage. The <strong>Jones</strong> Naturals products<br />
have 100% natural flavors and contain ingredients such as ginseng, zinc, and various vitamins. <strong>Jones</strong> Naturals<br />
comes in 20-ounce (591 ml) clear bottles with primarily black and white photograph labels, similar to the <strong>Jones</strong><br />
<strong>Soda</strong> product labels. The <strong>Jones</strong> Naturals line currently consists of six flavors. In <strong>2007</strong>, we introduced <strong>Jones</strong><br />
Naturals in 14-ounce glass bottles.<br />
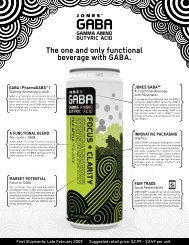
<strong>Jones</strong> GABA<br />
In line with producing new beverage items, in June <strong>2007</strong>, we entered into an agreement with Pharma Foods<br />
International Co., LTD., of Kyoto, Japan; Mitsubishi Corporation (MC), of Tokyo, Japan; and Mitsubishi<br />
International Food Ingredients, Inc. (MIFI), of Dublin, Ohio that grants us rights in the United States, Canada and<br />
7
Mexico to use PHARMA GABA in beverage applications subject to certain purchase commitments. PHARMA<br />
GABA is a naturally produced form of the amino acid gamma aminobutyric acid (GABA), a key<br />
neurotransmitter in the human brain that exerts a number of anti-stress effects, among other benefits. We intend<br />
to introduce our first beverage product containing PHARMA GABA during 2008.<br />
Marketing, Sales and Distribution<br />
Marketing<br />
Our pricing policies for our products take into consideration competitors’ prices and our perception of what<br />
a consumer is willing to pay for the particular brand and product. The goal is to price our products at a premium<br />
to other premium sodas and New Age beverages.<br />
We primarily use point-of-sale materials such as posters, stickers, table cards, shelf danglers, post cards,<br />
hats, pins, T-shirts and jackets to create and increase consumer awareness of our proprietary products and brands.<br />
In response to consumer demand, we also sell our products and our wearables on our website. Through<br />
cooperative advertising, the majority of our independent distributors fund a portion of our marketing budget,<br />
based upon case sales. In selected cities, we participate on a “grass roots” level at certain events in an attempt to<br />
create and increase brand awareness and loyalty. We also have a program of sponsoring alternative sport athletes<br />
to promote our products, and we have signed up several athletes in the skateboard, snowboard and BMX bike<br />
arenas. We also use recreational vehicles and vans painted with the <strong>Jones</strong> colors and logos to create consumer<br />
awareness and enthusiasm to assist distributors as they open new retail accounts and markets. In addition to these<br />
marketing techniques, we also pursue cross-promotional campaigns with other companies.<br />
We maintain and utilize our website to allow our <strong>Jones</strong> <strong>Soda</strong> consumers to create their own personalized<br />
12-pack of <strong>Jones</strong> <strong>Soda</strong> (12-ounce bottles) with their unique photo in the labels. The strategy of<br />
www.myjones.com is to provide a personalized product offering to our consumers as well as provide an<br />
innovative marketing opportunity for our <strong>Jones</strong> <strong>Soda</strong> brand. Consumers can upload their photos through the web<br />
and crop and create their own “myjones” labels. The personalized labels are downloaded at our warehouse and<br />
we send out 12-packs of the personalized soda to the consumer. We believe this strategy has increased awareness<br />
for the <strong>Jones</strong> <strong>Soda</strong> brand as well as provided for increased consumer interactivity with the <strong>Jones</strong> <strong>Soda</strong> brand, and<br />
we anticipate that it will continue to do so. In December 2002, we received notice of issuance of a patent (Patent<br />
No. 6,493,677) from the U.S. Patent and Trademark Office for our myjones.com business operation. The patent<br />
is titled “Method and Apparatus for Creating and Ordering Branded Merchandise over a Computer Network.” In<br />
January 2005, we were granted a second patent by the U.S. Patent and Trademark Office (Patent No. 6,845,362<br />
B2) which is also entitled “Method and Apparatus for Creating and Ordering Branded Merchandise over a<br />
Computer Network.”<br />
In 2002, we launched the yourjones program, which allows the customization of the front panel of the label<br />
of <strong>Jones</strong> <strong>Soda</strong> in a manner similar to our myjones business, but on a larger, commercial scale. The premise<br />
behind “yourjones” is to create customized <strong>Jones</strong> <strong>Soda</strong> or <strong>Jones</strong> Naturals bottles, with a personalized photo or<br />
brand image, for cross promotion and co-branding purposes or for sale in retail accounts. Like myjones.com, the<br />
<strong>Jones</strong> <strong>Soda</strong> name always appears on the labels and customers can add their own photo/brand and words. We have<br />
negotiated arrangements with our co-packing facilities to create short-run productions for these purposes.<br />
In September <strong>2007</strong>, we selected Cole & Weber United to create an advertising campaign that will support<br />
the sale of our <strong>Jones</strong> <strong>Soda</strong> products throughout the United States. Cole & Weber is a full-service marketing<br />
agency known for creating innovative campaigns. Our goal is to increase awareness of our products as we<br />
expand distribution in the marketplace.<br />
Sales<br />
Our products are sold in 48 states in the United States and 9 provinces in Canada primarily in convenience<br />
stores, delicatessens, sandwich shops and selected supermarkets, as well as through our national accounts with<br />
8
several large retailers. During 2006, sales in the U.S. represented approximately 88% of total sales, while sales in<br />
Canada represented approximately 11%, and we had approximately 1% in other international sales. In <strong>2007</strong>, sales<br />
in the U.S. represented approximately 85% of total sales, while sales in Canada represented approximately 14%,<br />
and we had approximately 1% in other international sales. We may consider expanding sales of our products to<br />
select international markets in the future.<br />
During <strong>2007</strong>, our DSD sales force was organized into seven regional groups, consisting of the Northwest,<br />
Southwest, Midwest, Northeast and Southeast regions of the United States and Western and Eastern regions of<br />
Canada. Our Chief Operating Officer oversees all sales and marketing efforts and has five Vice Presidents of<br />
DSD Sales, one of whom is responsible for each of the following regions: Midwest U.S., Eastern and Southern<br />
U.S., Northwest U.S., Western U.S. and Canada. Regional Managers are ultimately responsible for the separate<br />
regions. Senior sales personnel are responsible for large retail grocery accounts located in their regions, the<br />
management of existing independent distributor relations and the selection of new independent distributors as<br />
may be required. Junior sales personnel work closely with our independent distributors and their sales<br />
representatives to help them open street level retail accounts and train them in our sales and marketing<br />
techniques.<br />
During <strong>2007</strong>, our CSD sales were coordinated and led by our Executive Vice President of Sales and our<br />
Vice President Sales CSD East. They and the CSD Regional Managers are responsible for calling on all national<br />
and regional grocery and mass merchant accounts in the CSD category. National Beverage Corp. manufactures,<br />
packs and distributes directly to retailers.<br />
Distribution<br />
We sell a majority of our products through our DSD network, and we currently have relationships with<br />
approximately 265 independent distributors throughout North America. Our policy is to grant our distributors<br />
exclusive rights to sell particular brands within a defined territory. We believe that substantially all of our<br />
distributors also carry other beverage products. Agreements with our distributors vary. We have entered into<br />
written agreements with many of our top distributors for varying terms of years. However, most of our<br />
distribution relationships are oral (based solely on purchase orders) and are terminable by either party. In most of<br />
our written agreements, we would have to pay a fee to a distributor with an exclusive territory in the event we<br />
provided product directly to one of our national retailers located in the distributor’s region. We are also obligated<br />
to pay termination fees for cancellations of most of these written distributor agreements, which have terms<br />
ranging from one to three years.<br />
In addition, we sell our products directly to certain large national retail accounts, such as Target<br />
Corporation, Panera Bread Company, Barnes & Noble, Inc., Sam’s Club and Wal-Mart Stores, Inc. Distribution<br />
of our products into these DTR accounts is handled by the retailer’s distribution system or by its designated foodservice<br />
or other distributors.<br />
For the year ended December 31, <strong>2007</strong>, three of our customers represented approximately 29% of total<br />
revenues, with sales to Wal-Mart Stores, Inc. (including Sam’s Club) representing revenues of approximately<br />
13%. We anticipate that, as consumer awareness of our brands develops and increases, we will continue to<br />
upgrade and expand our distributor network and DTR accounts, which may result in a decreased dependence on<br />
any one or more of our independent distributors or accounts.<br />
We generally require our independent distributors to place their purchase orders for our products at least 10<br />
days in advance of delivery. To the extent we have additional product available in inventory, we will fulfill other<br />
purchase orders when and as received. We contract with independent trucking companies to have product<br />
shipped from our contract packers to independent warehouses, and then on to our distributors. Distributors then<br />
sell and deliver our products either to subdistributors or directly to retail outlets, and such distributors or<br />
subdistributors stock the retailers’ shelves with our products. We recognize revenue upon receipt by our<br />
9
distributors and customers of our products, net of discount and allowances, and all sales are final with a “no<br />
return” policy; however, in limited instances, due to credit issues, quality or damage issues, or distributor<br />
changes, we may take back product.<br />
Production<br />
Contract Packing Arrangements<br />
We do not directly manufacture our products but instead outsource the manufacturing process to third party<br />
bottlers and contract packers.<br />
For our bottle products, we purchase certain raw materials such as concentrates, flavors, supplements, sugar,<br />
bottles, labels, trays and caps and other ingredients for our beverage products; the raw materials are delivered to<br />
our various third party co-packers. We currently use six primary independent contract packers known as<br />
“co-packers” to prepare, bottle and package our bottle products. Our contract packers are located in the Canadian<br />
Provinces of British Columbia and Ontario, Oregon, Washington, Minnesota, and California. Once the product is<br />
manufactured, we purchase and store the finished product in nearby third party warehouses.<br />
We continually review our contract packing needs in light of regulatory compliance and logistical<br />
requirements and may add or change co-packers based on those needs. A majority of our co-packing is handled<br />
in Canada, and with the recent strengthening of the Canadian dollar against the U.S. dollar, our co-packing costs<br />
have increased. We experienced increases in co-packing fees for <strong>2007</strong> and expect these increases to continue into<br />
2008. We expect to continue to look for alternative or lower-cost co-packing arrangements for our products in the<br />
United States and in Canada.<br />
As is customary in the contract packing industry, we are expected to arrange for our contract packing needs<br />
sufficiently in advance of anticipated requirements. Accordingly, it is our business practice to require our<br />
independent distributors to place their purchase orders for our products at least 10 days in advance of delivery.<br />
Other than minimum case volume requirements per production run for most co-packers, we do not have annual<br />
minimum production commitments with our co-packers. Our co-packers may terminate their arrangements with<br />
us at any time, in which case we could experience disruptions in our ability to deliver products to our customers.<br />
With respect to our 12-ounce cans of <strong>Jones</strong> <strong>Soda</strong> and 16-ounce cans of <strong>Jones</strong> Energy sold by National<br />
Beverage Corp. through the grocery products and mass merchant channel, National Beverage is responsible for<br />
all manufacturing, packing and distribution. Under the agreement, sales of product may be made only to our<br />
authorized retail accounts purchasing through warehouse distribution, and we are solely responsible for all sales<br />
efforts, marketing, advertising and promotion. We sell concentrate to National Beverage Corp. for the<br />
manufacture of the product, and National Beverage Corp. is responsible for the manufacture, storage, inventory,<br />
delivery, invoicing, customer credit review and approval, and receivables collection with respect to sales of<br />
products to our authorized accounts. National Beverage carries, stores and maintains the finished products.<br />
The agreement has an initial term of five years, expiring on December 31, 2011. Thereafter, the agreement<br />
automatically renews in perpetuity for successive additional five-year periods, unless terminated by either party<br />
as specified in the agreement. We may not terminate the agreement prior to that date unless National Beverage is<br />
in material default, and National Beverage will have the right to terminate our agreement upon six months notice<br />
at any time after December 31, 2009. The agreement also provides National Beverage Corp. the first right to pack<br />
and distribute any new products that we desire to sell through warehouse distribution.<br />
Raw Materials<br />
Substantially all of the raw materials used in the preparation, bottling and packaging of our bottle products<br />
are purchased by us or by our contract packers in accordance with our specifications. The raw materials used in<br />
10
the preparation and packaging of our products consist primarily of concentrate, flavors, supplements, sugar,<br />
bottles, labels, trays, caps and packaging. These raw materials are purchased from suppliers selected by us or by<br />
our contract packers.<br />
We believe that we have adequate sources of raw materials, which are available from multiple suppliers.<br />
The prices of raw materials such as bottles, sugar and certain other ingredients continued to increase in<br />
<strong>2007</strong>. These increased costs, together with increased costs primarily of energy, gas and freight resulted in<br />
increases in certain product costs which are ongoing and expected to continue to exert pressure on our gross<br />
margins in 2008.<br />
Currently, we purchase our flavor concentrate from our three flavor concentrate suppliers. Generally, flavor<br />
suppliers hold the proprietary rights to the flavors. Consequently, we do not have the list of ingredients or<br />
formulae for our flavors. In connection with the development of new products and flavors, independent suppliers<br />
bear a large portion of the expense for product development, thereby enabling us to develop new products and<br />
flavors at relatively low cost. We anticipate that for future flavors and additional products, we may purchase<br />
flavor concentrate from other flavor houses with the intention of developing other sources of flavor concentrate<br />
for each of our products. If we have to replace a flavor supplier, we could experience disruptions in our ability to<br />
deliver products to our customers, which could have a material adverse effect on our results of operations.<br />
In addition, with our shift to production using pure cane sugar rather than high fructose corn syrup, we<br />
utilize considerable quantities of pure cane sugar. We have four pure cane sugar suppliers and usually enter into<br />
one to two year supply agreements.<br />
The water used to produce our products is filtered and is also treated to reduce alkalinity.<br />
Quality Control<br />
Our products are made from high quality ingredients and natural and/or artificial flavors. We seek to ensure<br />
that all of our products satisfy our quality standards. Contract packers are selected and monitored by our own<br />
quality control representatives in an effort to assure adherence to our production procedures and quality<br />
standards. Samples of our products from each production run undertaken by each of our contract packers are<br />
analyzed and categorized in a reference library.<br />
For every run of product, our contract packer undertakes extensive on-line testing of product quality and<br />
packaging. This includes testing levels of sweetness, carbonation, taste, product integrity, packaging and various<br />
regulatory cross checks. For each product, the contract packer must transmit all quality control test results to us<br />
for reference following each production run.<br />
Testing includes microbiological checks and other tests to ensure the production facilities meet the standards<br />
and specifications of our quality assurance program. Water quality is monitored during production and at<br />
scheduled testing times to ensure compliance with beverage industry standards. Flavors are pre-tested before<br />
shipment to contract packers from the flavor manufacturer. We are committed to an on-going program of product<br />
improvement with a view toward ensuring the high quality of our product through a program for stringent<br />
contract packer selection, training and communication.<br />
We believe we source and select only those suppliers that use quality components.<br />
Regulation<br />
The production and marketing of our licensed and proprietary beverages are subject to the rules and<br />
regulations of various federal, provincial, state and local health agencies, including in particular Health Canada,<br />
11
Agriculture and Agri-Food Canada and the U.S. Food and Drug Administration (“FDA”). The FDA and<br />
Agriculture and Agri-Food Canada also regulate labeling of our products. From time to time, we may receive<br />
notifications of various technical labeling or ingredient reviews with respect to our licensed products. We believe<br />
that we have a compliance program in place to ensure compliance with production, marketing and labeling<br />
regulations on a going-forward basis.<br />
Packagers of our beverage products presently offer non-refillable, recyclable containers in the United States<br />
and various other markets. Some of these packagers also offer refillable containers, which are also recyclable.<br />
Legal requirements have been enacted in jurisdictions in the United States and Canada requiring that deposits or<br />
certain ecotaxes or fees be charged for the sale, marketing and use of certain non-refillable beverage containers.<br />
The precise requirements imposed by these measures vary. Other beverage container–related deposit, recycling,<br />
ecotax and/or product stewardship proposals have been introduced in various jurisdictions in the United States<br />
and Canada. We anticipate that similar legislation or regulations may be proposed in the future at local, state and<br />
federal levels, both in the United States and Canada.<br />
Trademarks, Flavor Concentrate Trade Secrets and Patent<br />
We own a number of trademarks, including, in the United States and Canada, “<strong>Jones</strong> <strong>Soda</strong> Co. ® ,” “<strong>Jones</strong><br />
Pure Cane <strong>Soda</strong>,” “<strong>Jones</strong> Naturals ® ”, “<strong>Jones</strong> Energy”, “Whoop Ass Energy Drink ® ”, and “<strong>Jones</strong> 24C.” In<br />
the United States our trademarks expire 10 years from the registration date and in Canada 15 years from the<br />
registration date, although in both Canada and the United States, they may be renewed for a nominal fee. In<br />
addition, we have trademark protection in the United States and Canada for a number of other trademarks for<br />
slogans and product designs, including “Wet Yourself ® ,” “I’ve Got A <strong>Jones</strong> For A <strong>Jones</strong> ® ,” “<strong>Jones</strong> <strong>Soda</strong> Co. and<br />
Design,” “Whoop Ass and Design ® ”, “Corn Is For Cars… Sugar Is For <strong>Soda</strong>,” “Run with the Little Guy! ® ”<br />
and “My <strong>Jones</strong> ® ”. We have also applied for trademark protection for several marks, including “<strong>Jones</strong> <strong>Soda</strong><br />
Co. ® ”, in the United Kingdom, Germany, Japan, and other foreign jurisdictions.<br />
We have the exclusive rights to 37 flavor concentrates developed with our current flavor concentrate<br />
suppliers, which we protect as trade secrets. We will continue to take appropriate measures, such as entering into<br />
confidentiality agreements with our contract packers and exclusivity agreements with our flavor houses, to<br />
maintain the secrecy and proprietary nature of our flavor concentrates.<br />
We have two patents on our “myjones.com” business operation. In December 2002, the U.S. Patent and<br />
Trademark Office issued us Patent No. 6,493,677, and in January 2005 they issued to us Patent No. 6,845,365<br />
B2, both entitled “Method and Apparatus for Creating and Ordering Customized Branded Merchandise over a<br />
Computer Network”. The term of U.S. patents is 20 years from the date of filing. We intend to explore potential<br />
licensing arrangements with third parties to commercialize this patented methodology and defend patent<br />
violations.<br />
We consider our trademarks, patent and trade secrets to be of considerable value and importance to our<br />
business.<br />
Competition<br />
The beverage industry is highly competitive. Principal methods of competition in the beverage industry<br />
include:<br />
• distribution;<br />
• sponsorships;<br />
• licensing;<br />
• brand name;<br />
12
• brand image;<br />
• price;<br />
• labeling and packaging;<br />
• advertising;<br />
• product quality and taste;<br />
• trade and consumer promotions; and<br />
• development of new brands, products and product extensions.<br />
We compete with other beverage companies not only for consumer acceptance but also for shelf space in<br />
retail outlets and for marketing focus by our distributors, all of whom also distribute other beverage brands. Our<br />
products compete with all non-alcoholic beverages, most of which are marketed by companies with substantially<br />
greater financial resources than ours. We also compete with regional beverage producers and “private label” soft<br />
drink suppliers. Our direct competitors in the alternative beverage industry include Cadbury Schweppes<br />
(Stewarts and IBC) and Thomas Kemper. We also compete against Coca Cola, Pepsi, Hansen’s, Stewarts, IBC<br />
and other traditional soft drink manufacturers and distributors, as well as against other category leaders such as<br />
Red Bull and Monster for the energy drink category.<br />
In order to compete effectively in the beverage industry, we believe that we must convince independent<br />
distributors that <strong>Jones</strong> Pure Cane <strong>Soda</strong> is a leading brand in the premium soda segment of the alternative or<br />
New Age beverage industry. In connection with or as a follow-up to the establishment of an independent<br />
distributor relationship for the <strong>Jones</strong> Pure Cane <strong>Soda</strong> brand, we sell <strong>Jones</strong> Organics, <strong>Jones</strong> Energy, Whoop<br />
Ass Energy Drink ® , <strong>Jones</strong> Natural ® and <strong>Jones</strong> 24C as complementary products that may replace other<br />
non-carbonated single-serve fruit beverages or ready-to-drink (RTD) teas or energy drinks. In addition, we have<br />
created <strong>Jones</strong> Pure Cane <strong>Soda</strong> in a 12-ounce can format that allows us to compete directly in the carbonated<br />
soft drink industry. As a means of maintaining and expanding our distribution network, we intend to introduce<br />
new products and product extensions, and when warranted, new brands. Although we believe that we will be able<br />
to continue to create fashionable brands, there can be no assurance that we will be able to do so or that other<br />
companies will not be more successful in this regard over the long term.<br />
In addition, in light of the competition for product placement with independent distributors, we obtained<br />
several national retail accounts as an additional distribution channel for our products. We currently have<br />
distribution arrangements with National Beverage, Target Corporation, Panera Bread Company, Barnes & Noble,<br />
Sam’s Club and Wal-Mart Stores, Inc. We believe that this diversification strategy is helpful in alleviating the<br />
risk inherent in competition for independent distributors.<br />
Pricing of the products is also important. We believe that our <strong>Jones</strong> Pure Cane <strong>Soda</strong>, <strong>Jones</strong> Organics,<br />
<strong>Jones</strong> Energy, Whoop Ass Energy Drink ® , <strong>Jones</strong> 24C and <strong>Jones</strong> Naturals ® products are priced in the same<br />
price range or higher than competitive New Age beverage brands and products.<br />
Seasonality<br />
As is typical in the beverage industry, our sales are seasonal. In a typical year, approximately 60% of our<br />
sales by volume occur from April to September and approximately 40% occur from October to March. As a<br />
result, our working capital requirements and cash flow vary substantially throughout the year. Consumer demand<br />
for our products is also affected by weather conditions. Cool, wet spring or summer weather could result in<br />
decreased sales of our beverages and could have an adverse effect on our results of operations.<br />
13
Employees<br />
As of December 31, <strong>2007</strong>, we had 82 full-time employees: 46 were employed in sales and marketing<br />
capacities, 18 were employed in administrative capacities, and 18 were employed in manufacturing and quality<br />
control capacities. None of our employees is represented by labor unions. We believe that our relationships with<br />
our employees are good.<br />
Securities Exchange Act <strong>Report</strong>s and other Available Information<br />
We make available on or through our website at www.jonessoda.com (under “About <strong>Jones</strong>—Investor<br />
Relations—Financial <strong>Report</strong>s”) certain reports and amendments to those reports that we file with or furnish to the<br />
Securities and Exchange Commission (the “SEC”) in accordance with the Securities Exchange Act of 1934, as<br />
amended (the “Exchange Act”). These include our annual reports on Form 10-K, our quarterly reports on Form<br />
10-Q, our current reports on Form 8-K, and Section 16 filings. We make this information available on our<br />
website free of charge as soon as reasonably practicable after we electronically file the information with, or<br />
furnish it to, the SEC.<br />
In addition, the following corporate governance materials are also available on our website under “About<br />
<strong>Jones</strong>—Investor Relations—Corporate Governance:”<br />
• Audit Committee Charter.<br />
• Code of Conduct applicable to all directors, officers and employees of <strong>Jones</strong> <strong>Soda</strong> Co.<br />
• Code of Ethics for our CEO and senior financial officers.<br />
If we waive any material provision of our Code of Conduct or Code of Ethics for our CEO and senior<br />
financial officers or substantively change the codes, we will disclose that fact on our website within four business<br />
days. A copy of any of the materials filed with or furnished to the SEC or copies of the corporate governance<br />
materials described above are also available free of charge and can be mailed to you upon request to <strong>Jones</strong> <strong>Soda</strong><br />
Co., Corporate Offices, 234 Ninth Avenue North, Seattle, Washington 98109.<br />
EXECUTIVE OFFICERS<br />
Our executive officers as of March 17, 2008 are as follows:<br />
Name Age Position<br />
Officer<br />
Since<br />
Scott Bedbury ........ 51 Interim Chairman of the Board and Director 2008<br />
Stephen <strong>Jones</strong> ........ 52 Interim Chief Executive Officer and Director 2008<br />
Joth Ricci ........... 39 Chief Operating Officer 2008<br />
Hassan Natha ........ 48 Chief Financial Officer and Secretary 2006<br />
Peter Burns .......... 47 Senior Executive Vice President of Sales and<br />
<strong>2007</strong><br />
Marketing<br />
Lars P. Nilsen ........ 46 Executive Vice President of Sales 2006<br />
Mr. Bedbury has served as one of the Company’s directors since August 2003. Mr. Bedbury is also chief<br />
executive officer of Brandstream, an independent brand consultancy, and a speaker for the Leigh Bureau.<br />
Mr. Bedbury was a senior vice president of marketing at Starbucks Coffee Company from 1995 to 1998. Prior to<br />
that, he spent seven years as head of advertising for Nike, Inc. In addition, Mr. Bedbury is the author of A New<br />
Brand World: Eight Principles for Achieving Brand Leadership in the 21st Century. Mr. Bedbury holds a<br />
Bachelor of Arts degree from the University of Oregon.<br />
Mr. <strong>Jones</strong> has served as one of the Company’s directors since March 2006. Mr. <strong>Jones</strong> is also a consultant to<br />
Denneen and Company, a Boston-based strategy consulting business, where he served as president and partner<br />
14
from October 2006 to June <strong>2007</strong>. Since June <strong>2007</strong>, Mr. <strong>Jones</strong> has also served as vice president of Calabria Mia<br />
Fine Foods, an Italian food producer and distributor, and since 2003 he has been the chief executive officer of<br />
Brand Ignition Group, a private company that works with private equity funds to identify and acquire emerging<br />
high growth consumer products companies, of which he was also a founder. From 1986 to 2003, Mr. <strong>Jones</strong><br />
worked in various positions with The Coca-Cola Company, most recently serving as its chief marketing officer.<br />
Mr. Ricci joined <strong>Jones</strong> <strong>Soda</strong> as Chief Operating Officer in January 2008. From May 2003 to January of<br />
2008, Mr. Ricci served as General Manager of Columbia Distributing Company, a beverage distribution<br />
company, and previously served as its Vice President of Human Resources and Process Improvement from<br />
November 2002 to May 2003 and as its Regional Vice President of Sales and Marketing from November 2000<br />
until October 2002. Mr. Ricci received a B.S. in Business Education from Oregon State University.<br />
Mr. Natha joined <strong>Jones</strong> <strong>Soda</strong> in April 2006. Prior to joining <strong>Jones</strong> <strong>Soda</strong>, Mr. Natha served as an associate<br />
with CFO Selections, a professional CFO services firm from August 2005 to January 2006, a principal of<br />
B2BCFO, a CFO professional services firm, from March 2003 to July 2005, and Chief Financial Officer of<br />
Washington Gaming Inc., a private real estate and gaming company, from January 2002 to December 2002.<br />
From October 2000 to December 2001, he served as senior manager of Accenture Inc. Mr. Natha is Certified<br />
Public Accountant and received a Bachelor of Commerce (Accounting) from Concordia University and a<br />
Graduate Diploma of Public Accountancy from McGill University.<br />
Mr. Burns was hired as our Senior Executive Vice President of Sales and Marketing in April <strong>2007</strong>. His<br />
employment with the Company will terminate on March 31, 2008. From July 2005 to October 2006, Mr. Burns<br />
was the Vice-President of Sales for Izze Beverage Company, a new age beverage company. Prior to that, from<br />
January 2001 to June 2005, he was the Executive Vice-President of Sales of Mauna Loa Macadamia Nut<br />
Corporation, a food manufacturer and distributor. Mr. Burns received a Bachelor of Science from Randolph<br />
Macon College.<br />
Mr. Nilsen was hired as our Executive Vice President of Sales in February 2006. Mr. Nilsen joined us from<br />
Northwest Horticulture, where he served in the roles of Chief Operating Officer and President/CEO, from<br />
September 2001 to December 2005. Mr. Nilsen’s education includes an MBA from the University of<br />
Washington, a B.Sc. from the University of Utah with a major in Finance and an extensive management training<br />
program from Coca-Cola University.<br />
ITEM 1A. RISK FACTORS.<br />
The following factors may materially adversely affect our business, financial condition or results of<br />
operations. In that event, the trading price of our common stock could decline and shareholders may lose part or<br />
all of their investment. Therefore, shareholders should carefully consider the risks described below before<br />
making an investment decision.<br />
Risk Factors Relating to Our Company and Our Business<br />
Our business plan and future growth is dependent to a significant extent on our CSD strategy. If we are<br />
unable to successfully implement this strategy, our results of operations and financial condition could be<br />
adversely affected.<br />
We have allocated significant resources to our efforts to penetrate the CSD market through the introduction<br />
of our canned soda product. These efforts may prove to be unsuccessful or unprofitable, in which case our results<br />
of operations and financial condition will suffer. Our ability to establish a market for our brands and products in<br />
the CSD channel is dependent on our ability to establish and maintain successful relationships with retailers,<br />
including grocery stores and other retailers who will carry our CSD products. Our success in the CSD channel will<br />
therefore depend on our ability to secure and maintain favorable listing arrangements with retailers.<br />
15
Our ability to maintain our network of retailers and attract additional retailers will depend on a number of<br />
factors, many of which are outside our control. Some of these factors include:<br />
• the level of demand for our brands and products in a particular regions;<br />
• our ability to price our products at competitive levels;<br />
• our ability to promote and advertise our products; and<br />
• our ability, through National Beverage Corp., to deliver products in the quantity and at the time ordered<br />
by retailers.<br />
We may not be able to perform on all or any of these factors in any of our current or prospective geographic<br />
areas of distribution, which would have a material adverse effect on our revenues and financial results.<br />
Because products in the CSD industry compete primarily on price, we may not be able to distinguish our<br />
CSD products from those of larger, more well-established and substantially better financed companies in this<br />
industry, such as the Coca- Cola Company and PepsiCo, Inc., and may not be able to compete with these<br />
companies based solely on price. Our inability to successfully execute on our CSD strategy will adversely affect<br />
our revenues and financial results.<br />
We are dependent on National Beverage’s production capacity and capabilities to meet the demand for<br />
<strong>Jones</strong> products in the grocery and mass merchant channel in the U.S.<br />
In 2006, we entered into an agreement with National Beverage Corp, pursuant to which, beginning in <strong>2007</strong>,<br />
National Beverage Corp. generally has the exclusive right in the United States to manufacture and distribute<br />
<strong>Jones</strong> <strong>Soda</strong> 8-ounce and 12-ounce cans and 1-liter PET bottles and <strong>Jones</strong> Energy in 16-ounce cans in the grocery<br />
and mass merchant channel. The agreement has an initial term of five years, expiring on December 31, 2011, and<br />
we may not terminate the agreement prior to that date unless National Beverage is in material default. As a result,<br />
our success in the CSD industry will depend to a significant extent on the performance of National Beverage. If<br />
National Beverage fails to perform adequately, because, for example, it is unable to manufacture our products in<br />
sufficient quantities to meet demand in a timely manner (due to a shortfall in agreed upon capacity in one or all<br />
of their factories or significantly increased demand or other reasons) or does not provide acceptable customer<br />
service to our grocery and mass merchant customers, our ability to gain market acceptance in the CSD industry<br />
could be materially adversely affected and our results of operations would suffer. In addition, National Beverage<br />
may be unable to pass cost increases to retailers, thereby reducing our profits from sales in the CSD channel.<br />
Moreover, National Beverage will have the right to terminate our agreement upon six months notice at any<br />
time after December 31, 2009. If National Beverage were to terminate the agreement, we would need to find<br />
alternative manufacturing and distribution arrangements for the CSD channel, which we may be unable to do in a<br />
timely manner or on favorable terms, which could adversely affect our results of operations.<br />
Finally, National Beverage Corp. purchases concentrate from us in order to manufacture our products, and it<br />
places orders for concentrate as required by its production and inventory needs. National Beverage is not required<br />
to place any minimum monthly or quarterly concentrate orders with us. This could lead to fluctuating sales of<br />
concentrate during any given quarter or year and have an adverse effect on our results of operations. For<br />
example, in light of lower than expected retail customer orders and its existing inventory levels during the fourth<br />
quarter of <strong>2007</strong>, National Beverage did not place any concentrate orders in the fourth quarter, which adversely<br />
impacted our results of operations for the quarter.<br />
16
We rely on our distributors, retailers and brokers, and this could affect our ability to efficiently and<br />
profitably distribute and market our products, maintain our existing markets and expand our business into<br />
other geographic markets.<br />
Our ability to establish a market for our brands and products in new geographic distribution areas, as well as<br />
maintain and expand our existing markets, is dependent on our ability to establish and maintain successful<br />
relationships with reliable distributors, retailers and brokers strategically positioned to serve those areas. Most of<br />
our distributors, retailers and brokers sell and distribute competing products, including non-alcoholic and<br />
alcoholic beverages, and our products may represent a small portion of their business. To the extent that our<br />
distributors, retailers and brokers are distracted from selling our products or do not employ sufficient efforts in<br />
managing and selling our products, including re-stocking the retail shelves with our products, our sales and<br />
profitability will be adversely affected. Our ability to maintain our distribution network and attract additional<br />
distributors, retailers and brokers will depend on a number of factors, some of which are outside our control.<br />
Some of these factors include:<br />
• the level of demand for our brands and products in a particular distribution area;<br />
• our ability to price our products at levels competitive with those offered by competing products; and<br />
• our ability to deliver products in the quantity and at the time ordered by distributors, retailers and<br />
brokers.<br />
We may not be able to meet all or any of these factors in any of our current or prospective geographic areas of<br />
distribution. Our inability to achieve any of these factors in a geographic distribution area will have a material<br />
adverse effect on our relationships with our distributors, retailers and brokers in that particular geographic area, thus<br />
limiting our ability to expand our market, which will likely adversely effect our revenues and financial results.<br />
We generally do not have long-term agreements with our distributors, and we incur significant time and<br />
expense in attracting and maintaining key distributors.<br />
Our marketing and sales strategy depends in large part on the availability and performance of our<br />
independent distributors. We have entered into written agreements with many of our top distributors for varying<br />
terms and duration; however, most of our other distribution relationships are based solely on purchase orders and<br />
are terminable by either party at will. We currently do not have, nor do we anticipate in the future that we will be<br />
able to establish, long-term contractual commitments from many of our distributors. In addition, despite the<br />
terms of the written agreements with many of our top distributors, there are no minimum levels of purchases<br />
under many of those agreements, and any of the agreements may be terminated at any time. We may not be able<br />
to maintain our current distribution relationships or establish and maintain successful relationships with<br />
distributors in new geographic distribution areas. Moreover, there is the additional possibility that we may have<br />
to incur additional expenditures to attract and maintain key distributors in one or more of our geographic<br />
distribution areas in order to profitably exploit our geographic markets.<br />
Because our distributors are not required to place minimum orders with us, we need to carefully manage<br />
our inventory levels, and it is difficult to predict the timing and amount of our sales.<br />
Our independent distributors are not required to place minimum monthly or annual orders for our products.<br />
In order to reduce inventory costs, independent distributors endeavor to order products from us on a “just in<br />
time” basis in quantities, and at such times, based on the demand for the products in a particular distribution area.<br />
Accordingly, there is no assurance as to the timing or quantity of purchases by any of our independent<br />
distributors or that any of our distributors will continue to purchase products from us in the same frequencies and<br />
volumes as they may have done in the past. In order to be able to deliver our products on a timely basis, we need<br />
to maintain adequate inventory levels of the desired products, but we cannot predict the number of cases sold by<br />
any of our distributors. If we fail to meet our shipping schedules, we could damage our relationships with<br />
distributors and/or retailers, increase our shipping costs or cause sales opportunities to be delayed or lost, which<br />
would unfavorably impact our future sales and adversely affect our operating results. In addition, if the inventory<br />
of our products held by our distributors and/or retailers is too high, they will not place orders for additional<br />
products, which would also unfavorably impact our future sales and adversely affect our operating results.<br />
17
Our business plan and future growth is dependent in part on our distribution arrangements directly with<br />
retailers and national retail accounts. If we are unable to establish and maintain these arrangements, our<br />
results of operations and financial condition could be adversely affected.<br />
We currently have distribution arrangements with several large national retail accounts to distribute our<br />
products directly through their stores; these retailers include Barnes & Noble, Panera Bread Company, Target<br />
Corporation, Sam’s Club and Wal-Mart Stores, Inc. We believe that our “direct to retail” program has increased<br />
our national visibility among consumers; however there are several risks associated with this distribution<br />
strategy. First, we do not have long-term agreements in place with any of these accounts. We operate based<br />
solely on purchase orders we receive from them. We may not be able to maintain continuing relationships with<br />
any of these national accounts, and we may not be able to renew any of these accounts upon expiration of the<br />
term of the existing arrangements. Any of these agreements may be terminated by the retailer at any time. A<br />
decision by any of these retailers, or any other large retail accounts we may obtain, to decrease the amount<br />
purchased from us or to cease carrying our products could have a material adverse effect on our reputation,<br />
financial condition and consolidated results of operations. For example, in <strong>2007</strong>, Starbucks Coffee Company<br />
stopped carrying our product in its U.S. stores, which negatively impacted our sales and results of operations in<br />
<strong>2007</strong>. In addition, we may not be able to establish additional distribution arrangements with other national<br />
retailers.<br />
Second, as we become more dependent on national retail chains, these retailers may assert pressure on us to<br />
reduce our pricing to them or seek significant product discounts. In general, our margins are lower on our sales to<br />
these customers because of these pressures. Any increase in our costs for these retailers to carry our product,<br />
reduction in price, or demand for product discounts could have a material adverse effect on our profit margin.<br />
Finally, our “direct to retail” distribution arrangements may have an adverse impact on our existing<br />
relationships with our independent regional distributors, who may view our “direct to retail” accounts as<br />
competitive with their business, making it more difficult for us to maintain and expand our relationships with<br />
independent distributors.<br />
We have dedicated, and will continue to dedicate, significant resources to our sponsorship agreements and<br />
may not realize the benefits expected from those agreements.<br />
Our sponsorship agreements with the Seattle Seahawks and the New Jersey Nets require us to make<br />
substantial annual payments in exchange for certain promotional and branding benefits. There can be no<br />
assurance, however, that the benefit we anticipate from those and similar agreements, including exclusive<br />
beverage rights and other branding opportunities, will compensate for the annual payment commitments required<br />
by the agreements. These commitments are significant, representing approximately 50% of our purchase<br />
obligations outstanding as of December 31, <strong>2007</strong> (see the table of “Contractual Obligations” included under<br />
Item 7 of this <strong>Report</strong>). Moreover, there can be no assurance that our association with these particular teams will<br />
have a positive effect on our image and brand. There is a risk that we will be unable to recover the costs<br />
associated with our sponsorship agreements, which would have an adverse effect on our results of operations.<br />
We rely on third-party packers of our products, and this dependence could make management of our<br />
marketing and distribution efforts inefficient or unprofitable.<br />
We do not own the plants and equipment required to manufacture and package our beverage products and<br />
do not anticipate having such capabilities in the future. As a consequence, we depend on third parties and<br />
contract packers to produce our beverage products and deliver them to distributors. Our ability to attract and<br />
maintain effective relationships with contract packers and other third parties for the production and delivery of<br />
our beverage products in a particular geographic distribution area is important to the achievement of successful<br />
operations within each distribution area. Competition for contract packers’ business is intense, especially in the<br />
western United States, and this could make it more difficult for us to obtain new or replacement packers, or to<br />
18
locate back-up contract packers, in our various distribution areas, and could also affect the economic terms of our<br />
agreements with our packers. Our co-packers may terminate their arrangements with us at any time, in which<br />
case we could experience disruptions in our ability to deliver products to our customers. We may not be able to<br />
maintain our relationships with current contract packers or establish satisfactory relationships with new or<br />
replacement contract packers, whether in existing or new geographic distribution areas. The failure to establish<br />
and maintain effective relationships with contract packers for a distribution area could increase our<br />
manufacturing costs and thereby materially reduce profits realized from the sale of our products in that area. In<br />
addition, poor relations with any of our contract packers could adversely affect the amount and timing of product<br />
delivered to our distributors for resale, which would in turn adversely affect our revenues and financial condition.<br />
As is customary in the contract packing industry for comparably sized companies, we are expected to<br />
arrange for our contract packing needs sufficiently in advance of anticipated requirements. To the extent demand<br />
for our products exceeds available inventory and the capacities produced by contract packing arrangements, or<br />
orders are not submitted on a timely basis, we will be unable to fulfill distributor orders on demand. Conversely,<br />
we may produce more product than warranted by the actual demand for it, resulting in higher storage costs and<br />
the potential risk of inventory spoilage. Our failure to accurately predict and manage our contract packaging<br />
requirements may impair relationships with our independent distributors and key accounts, which, in turn, would<br />
likely have a material adverse effect on our ability to maintain profitable relationships with those distributors and<br />
key accounts.<br />
Our business and financial results depend on the continuous supply and availability of raw materials.<br />
The principal raw materials used by us include aluminum cans, glass bottles and PET plastic bottles as well<br />
as juices, sucrose/inverted cane sugar and sucralose, the costs of which are subject to fluctuations. In addition,<br />
with our shift to production using pure cane sugar rather than high fructose corn syrup, we utilize considerable<br />
quantities of pure cane sugar. If our supply of these raw materials is impaired or if prices increase significantly,<br />
our business would be adversely affected.<br />
Due to the consolidations that have taken place in the glass industry over the past few years, the prices of<br />
glass bottles continue to increase. The prices of PET plastic bottles and aluminum cans increased in 2006 and<br />
again in <strong>2007</strong>. The prices of pure cane sugar, sucrose, trays and labels increased in <strong>2007</strong> and certain of these<br />
ingredients continued to increase in early 2008. These increased costs, together with increased costs primarily of<br />
energy, gas and freight resulted in increases in certain product costs which are ongoing and are expected to<br />
continue to exert pressure on our gross margins in 2008. In addition, certain of our co-packing arrangements<br />
allow such co-packers to increase their charges based on certain of their own cost increases. We are uncertain<br />
whether the prices of any of the above or any other raw materials or ingredients will continue to rise in the future<br />
and whether we will be able to pass any such increases on to our customers.<br />
We may not correctly estimate demand for our products. Our ability to estimate demand for our products is<br />
imprecise, particularly with new products, and may be less precise during periods of rapid growth, particularly in<br />
new markets. If we materially underestimate demand for our products or are unable to secure sufficient<br />
ingredients or raw materials including, but not limited to, PET plastic bottles, cans, glass, labels, flavors,<br />
supplements, certain sweeteners, or packing arrangements, we might not be able to satisfy demand on a shortterm<br />
basis. Moreover, industry-wide shortages of certain concentrates, supplements and sweeteners have been<br />
and could, from time to time in the future, be experienced, which could interfere with and/or delay production of<br />
certain of our products and could have a material adverse effect on our business and financial results. We do not<br />
use hedging agreements or alternative instruments to manage this risk.<br />
Disruption of our supply chain could have an adverse effect on our business, financial condition and results<br />
of operations.<br />
Our ability and that of our suppliers, business partners (including packagers), contract manufacturers,<br />
independent distributors and retailers to make, move and sell products is critical to our success. Damage or<br />
19
disruption to our or their manufacturing or distribution capabilities due to weather, natural disaster, fire or<br />
explosion, terrorism, pandemics such as avian flu, strikes or other reasons, could impair our ability to<br />
manufacture or sell our products. Failure to take adequate steps to mitigate the likelihood or potential impact of<br />
such events, or to effectively manage such events if they occur, could adversely affect our business, financial<br />
condition and results of operations, as well as require additional resources to restore our supply chain.<br />
We rely upon our ongoing relationships with our key flavor suppliers. If we are unable to source our flavors<br />
on acceptable terms from our key suppliers, we could suffer disruptions in our business.<br />
Currently, we purchase our flavor concentrate from three flavor concentrate suppliers, and we anticipate that<br />
we will purchase flavor concentrate from other flavor houses for future flavors and additional products, with the<br />
intention of developing other sources of flavor concentrate for each of our products. The price of our<br />
concentrates is determined by our flavor houses and us, and may be subject to change. Generally, flavor suppliers<br />
hold the proprietary rights to their flavors. Consequently, we do not have the list of ingredients or formulae for<br />
our flavors and concentrates and we may be unable to obtain these flavors or concentrates from alternative<br />
suppliers on short notice. If we have to replace a flavor supplier, we could experience disruptions in our ability to<br />
deliver products to our customers, which could have a material adverse effect on our results of operations.<br />
If we are unable to maintain brand image and product quality, or if we encounter other product issues such<br />
as product recalls, our business may suffer.<br />
Our success depends on our ability to maintain brand image for our existing products and effectively build<br />
up brand image for new products and brand extensions. There can be no assurance, however, that additional<br />
expenditures and our advertising and marketing will have the desired impact on our products’ brand image and<br />
on consumer preferences. Product quality issues, real or imagined, or allegations of product contamination, even<br />
when false or unfounded, could tarnish the image of the affected brands and may cause consumers to choose<br />
other products. Moreover, we focused significant resources in <strong>2007</strong> in introducing our canned soda product in the<br />
CSD channel. There can be no assurance that our canned soda product will not have a negative impact on our<br />
brand image, particularly with respect to our traditional bottled product.<br />
In addition, because of changing government regulations or implementation thereof, allegations of product<br />
contamination or lack of consumer interest in certain products, we may be required from time to time to recall<br />
products entirely or from specific markets. Product recalls could affect our profitability and could negatively<br />
affect brand image. Also, adverse publicity surrounding obesity concerns, water usage and the like could<br />
negatively affect our overall reputation and our products’ acceptance by consumers.<br />
The inability to attract and retain key personnel would directly affect our efficiency and results of<br />
operations.<br />
Our success depends on our ability to attract and retain highly qualified employees in such areas as<br />
production, distribution, sales, marketing and finance. We compete to hire new employees, and, in some cases,<br />
must train them and develop their skills and competencies. Our operating results could be adversely affected by<br />
increased costs due to increased competition for employees, higher employee turnover or increased employee<br />
benefit costs. Any unplanned turnover, particularly involving one of our key personnel, could negatively impact<br />
our operations, financial condition and employee morale.<br />
Peter M. van Stolk, our founder, President and Chief Executive Officer, and a member of our Board of<br />
Directors, stepped down as an employee and officer of the Company effective December 31, <strong>2007</strong>. Since our<br />
inception, we have been dependent upon the creative skills and leadership of Mr. van Stolk, and there can be no<br />
assurance that his departure will not have a material adverse effect on our business, including our relationships<br />
with key customers and independent distributors, and employee morale. The Board of Directors has appointed<br />
Stephen C. <strong>Jones</strong>, a member of our Board since 2006, to the position of interim Chief Executive Officer. Our<br />
20
success will depend in part on Mr. <strong>Jones</strong>’ interim leadership and, in the future, on our ability to attract and retain<br />
a highly qualified permanent chief executive officer.<br />
We need to effectively manage our growth and resources in order to execute on our business plan. Any<br />
failure to do so would negatively impact our results of operations.<br />
To manage operations effectively, we must continue to improve our operational, financial and other<br />
management processes and systems. Our success also depends largely on our ability to maintain high levels of<br />
employee utilization, manage our production costs, sales and marketing costs and general and administrative<br />
expenses, and otherwise execute on our business plan. In addition, in order to grow and execute on our business<br />
plan and opportunities, we need to have available to us adequate resources, including capital and personnel,<br />
which may not be available when needed. We also need to maintain adequate operational controls and focus as<br />
we add new brands and products, distribution channels, and business strategies. We may not be able to<br />
effectively and efficiently manage our growth. Any inability to do so could increase our expenses and negatively<br />
impact our results of operations.<br />
Our growth and operating results could be impaired if we are unable to meet our future capital needs.<br />
Our ultimate success depends on our ability to continue to generate revenue through our operations. If our<br />
operations are impaired for any reason, including an impairment in the availability of our Key Bank loan facility<br />
to supply working capital for operations and we do not have another source of funding readily available to fund<br />
our continued operations, we may be unable to meet our future capital needs. If we encounter some impairment<br />
in our ability to operate, there is no assurance that funds will be available from any source or, if available, that<br />
they can be obtained on terms acceptable to us. If unavailable, our operations could be severely limited, and we<br />
may not be able to implement our business plan in a timely manner or at all. If equity financing is used to raise<br />
additional working capital, the ownership interests of our existing shareholders will be diluted.<br />
Our inability to protect our trademarks, patent and trade secrets may prevent us from successfully<br />
marketing our products and competing effectively.<br />
Failure to protect our intellectual property could harm our brand and our reputation, and adversely affect our<br />
ability to compete effectively. Further, enforcing or defending our intellectual property rights, including our<br />
trademarks, patents, copyrights and trade secrets, could result in the expenditure of significant financial and<br />
managerial resources. We regard our intellectual property, particularly our trademarks, patent and trade secrets to<br />
be of considerable value and importance to our business and our success. We rely on a combination of trademark,<br />
patent, and trade secrecy laws, confidentiality procedures and contractual provisions to protect our intellectual<br />
property rights. We are pursuing the registration of our trademarks in the United States, Canada and<br />
internationally. There can be no assurance that the steps taken by us to protect these proprietary rights will be<br />
adequate or that third parties will not infringe or misappropriate our trademarks, trade secrets or similar<br />
proprietary rights. In addition, there can be no assurance that other parties will not assert infringement claims<br />
against us, and we may have to pursue litigation against other parties to assert our rights. Any such claim or<br />
litigation could be costly. In addition, any event that would jeopardize our proprietary rights or any claims of<br />
infringement by third parties could have a material adverse effect on our ability to market or sell our brands,<br />
profitably exploit our products or recoup our associated research and development costs.<br />
As part of the licensing strategy of our brands, we enter into licensing agreements under which we grant our<br />
licensing partners certain rights to use our trademarks and other designs. Although our agreements require that<br />
the licensing partner’s use of our trademarks and designs is subject to our control and approval, any breach of<br />
these provisions, or any other action by any of our licensing partners that is harmful to our brands, goodwill and<br />
overall image, could have a material adverse impact on our business.<br />
21
We have obtained two U.S. patents on our “myjones.com” methodology. While the number of business<br />
method patents issued by the U.S. Patent and Trademark Office has been growing substantially in recent years,<br />
there is still a significant degree of uncertainty associated with these patents. It is possible that our patent may be<br />
construed by a court of competent jurisdiction in a very limited manner such that it offers little or no basis for us<br />
to deter competitors from employing similar processes or does not allow us to defend against third party claims<br />
of patent infringement.<br />
Litigation or legal proceedings (including pending securities class actions) could expose us to significant<br />
liabilities and damage our reputation.<br />
Securities class action derivative lawsuits have been filed against us and current officers and members of the<br />
Board of Directors. These lawsuits are described more fully in Part I, Item 3. “Legal Proceedings” and in Note 12<br />
to our consolidated financial statements contained in this Form 10-K. Defending these lawsuits will result in<br />
significant expenditures and the continued diversion of our management’s time and attention from the operation<br />
of our business, which could have a negative effect on our business operations.<br />
We may also become party to other litigation claims and legal proceedings. Litigation involves significant<br />
risks, uncertainties and costs, including distraction of management attention away from our current business<br />
operations. We evaluate litigation claims and legal proceedings to assess the likelihood of unfavorable outcomes<br />
and to estimate, if possible, the amount of potential losses. Based on these assessments and estimates, we<br />
establish reserves and/or disclose the relevant litigation claims or legal proceedings, as appropriate. These<br />
assessments and estimates are based on the information available to management at the time and involve a<br />
significant amount of management judgment. We caution you that actual outcomes or losses may differ<br />
materially from those envisioned by our current assessments and estimates. Our policies and procedures require<br />
strict compliance by our employees and agents with all United States and local laws and regulations applicable to<br />
our business operations, including those prohibiting improper payments to government officials. Nonetheless,<br />
there can be no assurance that our policies, procedures and related training programs will always ensure full<br />
compliance by our employees and agents with all applicable legal requirements. Improper conduct by our<br />
employees or agents could damage our reputation in the United States and internationally or lead to litigation or<br />
legal proceedings that could result in civil or criminal penalties, including substantial monetary fines, as well as<br />
disgorgement of profits.<br />
Failure to remediate a material weakness in our internal control over financial reporting could adversely<br />
impact our ability to report accurate financial results in a timely manner.<br />
In connection with management’s assessment of the effectiveness of our internal control over financial<br />
reporting as of December 31, <strong>2007</strong>, management identified the following material weakness: the Company has<br />
limited accounting personnel with expertise in generally accepted accounting principles and regulatory financial<br />
reporting requirements. This lack of sufficient accounting personnel with an appropriate level of accounting<br />
knowledge and training reduced the likelihood that the Company could detect the need for a material adjustment<br />
to the Company’s books and records or anticipate, identify, and resolve accounting issues in the normal course of<br />
performing their assigned functions. As a result of this material weakness, management concluded that our<br />
internal control over financial reporting and our disclosure controls and procedure were not effective as of<br />
December 31, <strong>2007</strong>. The material weakness and some of the steps we are taking to remediate such material<br />
weakness are described in Item 9A “Controls and Procedures” of this report.<br />
We are taking steps to improve the reliability of our internal controls and eliminate the material weakness.<br />
Until we are successful in our effort to remediate the weakness in our internal control over financial reporting, it<br />
may prevent us from accurately reporting our financial results, result in material misstatements in our financial<br />
statements or cause us to fail to meet our reporting obligations. In addition, we cannot assure you that we will not<br />
in the future identify further material weaknesses in our internal control over financial reporting that we have not<br />
discovered to date, which may impact the reliability of our financial reporting and financial statements. Deficient<br />
22
internal controls could also cause investors to lose confidence in our reported financial information, which could<br />
lead to a decline in our stock price, limit our ability to access the capital markets in the future, and require us to<br />
incur additional costs to improve our internal control systems and procedures.<br />
Changes in accounting standards and subjective assumptions, estimates and judgments by management<br />
related to complex accounting matters could significantly affect our financial results.<br />
Generally accepted accounting principles and related pronouncements, implementation guidelines and<br />
interpretations with regard to a wide variety of matters that are relevant to our business, such as, but not limited<br />
to, revenue recognition, stock-based compensation, trade promotions, sports sponsorship agreements and income<br />
taxes are highly complex and involve many subjective assumptions, estimates and judgments by our<br />
management. Changes to these rules or their interpretation or changes in underlying assumptions, estimates or<br />
judgments by our management could significantly change our reported or expected financial performance.<br />
If we are unable to build and sustain proper information technology infrastructure, our business could<br />
suffer.<br />
We depend on information technology as an enabler to improve the effectiveness of our operations and to<br />
interface with our customers, as well as to maintain financial accuracy and efficiency. If we do not allocate and<br />
effectively manage the resources necessary to build and sustain the proper technology infrastructure, we could be<br />
subject to transaction errors, processing inefficiencies, the loss of customers, business disruptions, or the loss of<br />
or damage to intellectual property through security breach. Our information systems could also be penetrated by<br />
outside parties intent on extracting information, corrupting information or disrupting business processes. Such<br />
unauthorized access could disrupt our business and could result in the loss of assets.<br />
We face currency risks associated with fluctuating foreign currency valuations.<br />
For the year ended December 31, <strong>2007</strong>, approximately 14.0% of our sales were denominated in the<br />
Canadian dollar. A decrease in the value of the Canadian dollar in relation to the U.S. dollar after establishing<br />
prices and before our receipt of payment and conversion of such payment to U.S. dollars would have an adverse<br />
effect on our operating results. Although the recent strengthening of the Canadian dollar has had a positive<br />
impact on our revenues attributable to sales in Canada, it has also negatively impacted our costs of goods. The<br />
majority of our products are produced and bottled in Canada through two of our co-packers. Accordingly, an<br />
increase in the value of the Canadian dollar in relation to the U.S. dollar has an adverse effect on our production<br />
costs. In addition, the financial statements for our Canadian subsidiary are denominated in Canadian dollars;<br />
accordingly, on a consolidated financial statement reporting basis, these numbers are converted into U.S. dollars<br />
and are affected by currency conversion rates. As of December 31, <strong>2007</strong>, we have not entered into foreign<br />
currency contracts or other derivatives to mitigate the potential impact of foreign currency fluctuations.<br />
Risk Factors Relating to Our Industry<br />
We compete in an industry that is brand-conscious, so brand name recognition and acceptance of our<br />
products are critical to our success.<br />
Our business is substantially dependent upon awareness and market acceptance of our products and brands<br />
by our target market, consumers between the ages of 12 and 29. In addition, our business depends on acceptance<br />
by our independent distributors and retailers of our brands as beverage brands that have the potential to provide<br />
incremental sales growth. Although we believe that we have been relatively successful in establishing our brands<br />
as recognizable brands in the New Age beverage industry, it may be too early in the product life cycle of these<br />
brands to determine whether our products and brands will achieve and maintain satisfactory levels of acceptance<br />
by independent distributors and retail consumers. We believe that the success of the <strong>Jones</strong> Energy, <strong>Jones</strong><br />
Naturals, Whoop Ass, <strong>Jones</strong> Organics and <strong>Jones</strong> 24C brands will also be substantially dependent upon<br />
23
acceptance of the <strong>Jones</strong> Pure Cane <strong>Soda</strong> brand. Accordingly, any failure of our <strong>Jones</strong> Pure Cane <strong>Soda</strong> brand to<br />
maintain or increase acceptance or market penetration would likely have a material adverse effect on our<br />
revenues and financial results.<br />
Competition from traditional non-alcoholic beverage manufacturers may adversely affect our distribution<br />
relationships and may hinder development of our existing markets, as well as prevent us from expanding our<br />
markets.<br />
The beverage industry is highly competitive. We compete with other beverage companies not only for<br />
consumer acceptance but also for shelf space in retail outlets and for marketing focus by our distributors, all of<br />
whom also distribute other beverage brands. Our products compete with a wide range of drinks produced by a<br />
relatively large number of manufacturers, most of which have substantially greater financial, marketing and<br />
distribution resources than ours. Some of these competitors are placing severe pressure on independent<br />
distributors not to carry competitive alternative or New Age beverage brands such as ours. We also compete with<br />
regional beverage producers and “private label” soft drink suppliers.<br />
Our direct competitors in the alternative beverage industry include Cadbury Schweppes (Stewarts and IBC)<br />
and Thomas Kemper. We also compete against Coca Cola, Pepsi, Hansen’s and other traditional soft drink<br />
manufacturers and distributors. We compete against other category leaders such as Red Bull and Monster for the<br />
energy drink category. These national and international competitors have advantages such as lower production<br />
costs, larger marketing budgets, greater financial and other resources and more developed and extensive<br />
distribution networks than ours. There can be no assurance that we will be able to grow our volumes or be able to<br />
maintain our selling prices in existing markets or as we enter new markets.<br />
Increased competitor consolidations, market-place competition, particularly among branded beverage<br />
products, and competitive product and pricing pressures could impact our earnings, market share and volume<br />
growth. If, due to such pressure or other competitive threats, we are unable to sufficiently maintain or develop<br />
our distribution channels, we may be unable to achieve our current revenue and financial targets. As a means of<br />
maintaining and expanding our distribution network, we intend to introduce product extensions and additional<br />
brands. There can be no assurance that we will be able to do so or that other companies will not be more<br />
successful in this regard over the long term. Competition, particularly from companies with greater financial and<br />
marketing resources than ours, could have a material adverse effect on our existing markets, as well as on our<br />
ability to expand the market for our products.<br />
We compete in an industry characterized by rapid changes in consumer preferences and public perception,<br />
so our ability to continue developing new products to satisfy our consumers’ changing preferences will<br />
determine our long-term success.<br />
Our current market distribution and penetration may be too limited with respect to the population as a whole<br />
to determine whether the brand has achieved initial consumer acceptance, and there can be no assurance that this<br />
acceptance will ultimately be achieved. Based on industry information and our own experience, we believe that,<br />
in general, alternative or New Age beverage brands and products may be successfully marketed for five to nine<br />
years after the product is introduced in a geographic distribution area before consumers’ taste preferences<br />
change, although some brands or products have longer lives. In light of the limited life of alternative or New Age<br />
beverage brands and products, a failure to introduce new brands, products or product extensions into the<br />
marketplace as current ones mature could prevent us from achieving long-term profitability. In addition,<br />
customer preferences also are affected by factors other than taste, such as health and nutrition considerations and<br />
obesity concerns, shifting consumer needs, changes in consumer lifestyles, increased consumer information and<br />
competitive product and pricing pressures. Sales of our products may be adversely affected by the negative<br />
publicity associated with these issues. If we do not adjust to respond to these and other changes in customer<br />
preferences, our sales may be adversely affected.<br />
24
Our results of operations may fluctuate from quarter to quarter for many reasons, including seasonality.<br />
As is typical in the beverage industry, our sales are seasonal. In a typical year, approximately 60% of our<br />
sales by volume occur from April to September and approximately 40% occur from October to March. As a<br />
result, our working capital requirements and cash flow vary substantially throughout the year. Consumer demand<br />
for our products is also affected by weather conditions. Cool, wet spring or summer weather could result in<br />
decreased sales of our beverages and could have an adverse effect on our results of operations.<br />
We have experienced significant fluctuations in quarterly results that have been the result of many factors.<br />
In particular, like many other companies in the beverage industry, we generate a substantial percentage of our<br />
revenues during the warm weather months of April through September. Management believes that the demand<br />
for our products will continue to reflect such seasonal consumption patterns.<br />
In addition, our operating results may fluctuate due to a number of other factors including, but not limited to:<br />
• Our ability to secure favorable and timely listing arrangements with retailers in the CSD channel in an<br />
effort to increase the distribution of our product, the timing of the retailers’ reset periods, competitive<br />
response by much larger, well-funded and established companies currently operating in the CSD<br />
channel, our ability to manage all the expenses of our continuing CSD roll-out, our ability to execute<br />
our CSD marketing programs to increase the sales velocity of our products and product sell- through,<br />
market acceptance of our products, our ability to attract qualified employees with experience in the<br />
CSD channel, our ability to fully recover our investment in slotting fees and the impact of the can<br />
expansion on our other distribution channels;<br />
• Our ability to develop and expand distribution channels for current and new products, develop<br />
favorable arrangements with third party distributors of our products and minimize or reduce issues<br />
associated with engaging new distributors and retailers, including, but not limited to, transition costs<br />
and expenses and down time resulting from the initial deployment of our products in each new<br />
distributor’s network;<br />
• Our ability to manage our operating expenses to sufficiently support general operating activities,<br />
slotting fees, promotion and sales activities, and capital expansion, and our ability to sustain<br />
profitability;<br />
• Our ability to meet the competitive response by much larger, well-funded and established companies<br />
currently operating in the beverage industry, as we introduce new competitive products, such as cola,<br />
diet cola, lemon lime, vitamin-enhanced water beverages and energy drinks and enter into sponsorship<br />
agreements;<br />
• Our ability to meet the financial covenants of our Key Bank Loan Agreement if and when we borrow<br />
any funds under this arrangement;<br />
• Our ability to develop, expand and implement our direct-to-retail sales channels and national retail<br />
accounts, as well as our “myjones” programs;<br />
• Our ability to increase distribution in our four core regions consisting of the Northwest, the Southwest,<br />
the Midwest and Western Canada, and our ability to expand and manage distributor growth in areas<br />
outside of the core regions;<br />
• Unilateral decisions by distributors, grocery store chains, specialty chain stores, club stores, mass<br />
merchandisers and other customers to discontinue carrying all or any of our products that they are<br />
carrying at any time;<br />
• Competitive products and pricing pressures and our ability to gain or maintain share of sales in the<br />
marketplace as a result of actions by competitors; and<br />
• Our ability to develop and market various products under our sports sponsorship agreements.<br />
25
Due to these and other factors, our results of operations have fluctuated from period to period and may<br />
continue to do so in the future, which could cause our operating results in a particular quarter to fail to meet<br />
market expectations.<br />
We could be exposed to product liability claims for personal injury or possibly death.<br />
Although we have product liability insurance in amounts we believe are adequate, there can be no assurance<br />
that the coverage will be sufficient to cover any or all product liability claims. To the extent our product liability<br />
coverage is insufficient, a product liability claim would likely have a material adverse effect upon our financial<br />
condition. In addition, any product liability claim successfully brought against us may materially damage the<br />
reputation of our products, thus adversely affecting our ability to continue to market and sell that or other<br />
products. Additionally, we may be required from time to time to recall products entirely or from specific<br />
co-packers, markets or batches. Product recalls could adversely affect our profitability and our brand image. We<br />
do not maintain recall insurance.<br />
Our business is subject to many regulations and noncompliance is costly.<br />
The production, marketing and sale of our beverages, including contents, labels, caps and containers, are<br />
subject to the rules and regulations of various federal, provincial, state and local health agencies. If a regulatory<br />
authority finds that a current or future product or production run is not in compliance with any of these<br />
regulations, we may be fined, or production may be stopped, thus adversely affecting our financial condition and<br />
results of operations. Similarly, any adverse publicity associated with any noncompliance may damage our<br />
reputation and our ability to successfully market our products. Furthermore, the rules and regulations are subject<br />
to change from time to time and while we closely monitor developments in this area, we have no way of<br />
anticipating whether changes in these rules and regulations will impact our business adversely. Additional or<br />
revised regulatory requirements, whether labeling, environmental, tax or otherwise, could have a material<br />
adverse effect on our financial condition and results of operations.<br />
Significant additional labeling or warning requirements may inhibit sales of affected products.<br />
Various jurisdictions may seek to adopt significant additional product labeling or warning requirements<br />
relating to the chemical content or perceived adverse health consequences of certain of our products. These types<br />
of requirements, if they become applicable to one or more of our major products under current or future<br />
environmental or health laws or regulations, may inhibit sales of such products. In California, a law requires that<br />
a specific warning appear on any product that contains a component listed by the state as having been found to<br />
cause cancer or birth defects. This law recognizes no generally applicable quantitative thresholds below which a<br />
warning is not required. If a component found in one of our products is added to the list, or if the increasing<br />
sensitivity of detection methodology that may become available under this law and related regulations as they<br />
currently exist, or as they may be amended, results in the detection of an infinitesimal quantity of a listed<br />
substance in one of our beverages produced for sale in California, the resulting warning requirements or adverse<br />
publicity could affect our sales.<br />
Risk Factors Related to Our Common Stock<br />
The price of our common stock may be volatile, and a shareholder’s investment in our common stock could<br />
suffer a decline in value.<br />
There has been significant volatility in the volume and market price of our common stock, and this volatility<br />
may continue in the future. In addition, factors such as quarterly variations in our operating results, changes in<br />
financial estimates by securities analysts or our failure to meet our or their projected financial and operating<br />
results, litigation involving us, general trends relating to the beverage industry, actions by governmental<br />
agencies, national economic and stock market considerations as well as other events and circumstances beyond<br />
our control could have a significant impact on the future market price of our common stock and the relative<br />
volatility of such market price.<br />
26
If we are not able to achieve our objectives for our business, the value of an investment in our Company<br />
could be negatively affected.<br />
In order to be successful, we believe that we must, among other things:<br />
• increase the sales volume and gross margins for our brands and products;<br />
• achieve and maintain efficiencies in operations;<br />
• manage our operating expenses to sufficiently support operating activities;<br />
• maintain fixed costs at or near current levels; and<br />
• avoid significant increases in variable costs relating to production, marketing and distribution.<br />
We may not be able to meet these objectives, which could have a material adverse affect on our results of<br />
operations. We have incurred significant operating expenses in the past and may do so again in the future and, as<br />
a result, will need to increase revenues in order to improve our results of operations. Our ability to increase sales<br />
will depend primarily on success in expanding our current markets, improving our distribution base, entering into<br />
“direct to retail” arrangements with national accounts, and introducing new brands, products or product<br />
extensions to the market. Our ability to successfully enter new distribution areas and obtain national accounts<br />
will, in turn, depend on various factors, many of which are beyond our control, including, but not limited to, the<br />
continued demand for our brands and products in target markets, the ability to price our products at competitive<br />
levels, the ability to establish and maintain relationships with distributors in each geographic area of distribution<br />
and the ability in the future to create, develop and successfully introduce one or more new brands, products, and<br />
product extensions.<br />
ITEM 1B. UNRESOLVED STAFF COMMENTS.<br />
None.<br />
ITEM 2. PROPERTY.<br />
We lease approximately 13,534 square feet of office space in Seattle, Washington for our principal<br />
executive and administrative offices, and for warehouse purposes. Effective September 1, 2006, we entered into a<br />
five-year lease agreement, with the first-year’s monthly rent equal to $12,710.00, plus payment of taxes and<br />
utilities. The rent is subject to annual four percent increases. The landlord may terminate the lease agreement at<br />
any time by delivering nine months’ advance written notice to us. Our new lease agreement is discussed in<br />
further detail in Note 12 to the Notes to Consolidated Financial Statements contained herein.<br />
We believe our leased premises are suitable and adequate for their use and, in the opinion of management,<br />
are adequately covered by insurance.<br />
We own no real property. We do not have a policy pertaining to investments in real estate. Our current<br />
practice is to invest solely in short-term money market securities.<br />
ITEM 3. LEGAL PROCEEDINGS.<br />
Federal Securities Class Action<br />
On September 4, <strong>2007</strong>, a putative class action complaint was filed against us, our former CEO, Peter van<br />
Stolk, and our CFO in the U.S. District Court for the Western District of Washington, alleging claims under<br />
Section 10(b) and 20(a) of the Securities Exchange Act of 1934, as amended, and Rule 10b-5 promulgated there<br />
under. The case is entitled Saltzman v. <strong>Jones</strong> <strong>Soda</strong> Company, et al., Case No. 07-cv-1366-RSL, and purports to<br />
be brought on behalf of a class of purchasers of our common stock during the period from March 9, <strong>2007</strong> to<br />
August 2, <strong>2007</strong>. Six substantially similar complaints subsequently were filed in the same court, some of which<br />
27
allege claims on behalf of a class of purchasers of our common stock during the period November 1, 2006 to<br />
August 2, <strong>2007</strong>. Some of the subsequently filed complaints added as defendants certain directors and another<br />
officer. The complaints generally allege violations of federal securities laws based on, among other things, false<br />
and misleading statements and omissions about our financial results and business prospects. The complaints seek<br />
unspecified damages, interest, attorneys’ fees, costs, and expenses. All seven lawsuits have been consolidated<br />
into one action, captioned In re <strong>Jones</strong> <strong>Soda</strong> Company Securities Litigation, Case No. 07-cv-1366-RSL. On<br />
March 5, 2008, the Court appointed a lead plaintiff and approved his selection of lead counsel. No consolidated<br />
complaint has yet been filed.<br />
Shareholder Derivative Litigation<br />
On September 5, <strong>2007</strong>, a shareholder derivative action was filed in the Superior Court for King County,<br />
Washington, allegedly on behalf of and for the benefit of the Company, against certain of our current and former<br />
officers and current directors. The case is entitled Cramer v. van Stolk, et al., Case No. 07-2-29187-3 SEA. The<br />
Company also was named as a nominal defendant. Four other shareholders filed substantially similar derivative<br />
cases. Two of these actions were filed in Superior Court for King County, Washington. One of these two actions<br />
has been consolidated with the Cramer Action. The shareholder who brought the unconsolidated state-court<br />
action voluntarily moved to have her suit dismissed on January 30, 2008, and on February 12, 2008 the Court<br />
dismissed that action. The two remaining shareholder derivative actions were filed in the U.S. District Court for<br />
the District of Washington. One of the shareholders in the two federal actions has moved to consolidate the<br />
federal derivative actions. The Court has not ruled on the motion to consolidate. All of the derivative complaints<br />
are based on the same allegations of fact as in the securities class actions filed in the U.S. District Court for the<br />
Western District of Washington and allege, among other things, that certain of our directors and officers<br />
breached their fiduciary duties and were unjustly enriched in connection with the public disclosures that are the<br />
subject of the federal securities class actions. The complaints seek unspecified damages, restitution,<br />
disgorgement of profits, equitable and injunctive relief, attorneys’ fees, costs, and expenses. The complaints are<br />
derivative in nature and do not seek monetary damages from us. However, we may be required, throughout the<br />
pendency of the action, to advance payment of legal fees and costs incurred by the defendants.<br />
We are unable to predict the outcome of these actions. These actions could result in significant liability and<br />
could have a material adverse effect on our business, results of operations, or financial condition.<br />
ITEM 4. SUBMISSION OF MATTERS TO A VOTE OF SECURITY HOLDERS.<br />
No matters were submitted to a vote of security holders during the fourth quarter of fiscal <strong>2007</strong>.<br />
28
PART II<br />
ITEM 5.<br />
MARKET FOR COMMON STOCK, RELATED SHAREHOLDER MATTERS AND ISSUER<br />
PURCHASES OF EQUITY SECURITIES.<br />
Market Information<br />
Our common stock is currently traded on the NASDAQ Capital Market under the symbol “JSDA” and in<br />
Canada on the TSX Venture Exchange under the symbol “JSD”.<br />
On November 28, 2005, we qualified for trading on the NASDAQ Capital Market. Prior to that time, our<br />
common stock had been traded on the OTC Bulletin Board since June 23, 2000. The following table shows, for<br />
each quarter of fiscal <strong>2007</strong> and 2006, the high and low closing sales prices as reported by the NASDAQ Capital<br />
Market.<br />
Nasdaq Capital Market<br />
High Low<br />
<strong>2007</strong>:<br />
Fourth quarter .................................................... $12.32 $ 5.94<br />
Third quarter .................................................... 17.93 8.80<br />
Second quarter ................................................... 31.54 13.83<br />
First quarter ..................................................... 22.20 11.67<br />
2006:<br />
Fourth quarter .................................................... $12.84 $ 8.52<br />
Third quarter .................................................... 9.45 7.57<br />
Second quarter ................................................... 10.94 7.41<br />
First quarter ..................................................... 8.44 5.28<br />
Holders<br />
As of March 6, 2008, there were 26,273,388 shares of common stock issued and outstanding, held by<br />
approximately 282 holders of record, although there are a much larger number of beneficial owners.<br />
Dividends<br />
We have never declared or paid any cash dividends with respect to our common stock. We anticipate that<br />
we will retain future earnings for use in the operation and expansion of our business and do not anticipate paying<br />
cash dividends on the common stock in the foreseeable future. Any future determination with regard to the<br />
payment of dividends will be at the discretion of the Board of Directors and will be dependent upon our future<br />
earnings, financial condition, applicable dividend restrictions and capital requirements and other factors deemed<br />
relevant by the Board of Directors.<br />
29
ITEM 6.<br />
SELECTED FINANCIAL DATA.<br />
The following selected financial and operating data are derived from our consolidated financial statements<br />
and should be read in conjunction with “Management’s Discussion and Analysis of Financial Condition and<br />
Results of Operations” and our consolidated financial statements.<br />
Dollars in thousands,<br />
Year Ended December 31,<br />
except per share data<br />
<strong>2007</strong> 2006 2005 2004 2003<br />
Results of Operations:<br />
Net Revenue ..................................... $39,831 $39,035 $33,511 $27,449 $20,101<br />
Income (loss) from Operations ....................... (11,629) 4,574 1,283 1,330 324<br />
Per Share Data:<br />
Income (loss) from Operations per Common Share ....... $ (0.45) $ 0.19 $ 0.06 $ 0.06 $ 0.02<br />
Dollars in thousands,<br />
As of December 31,<br />
except per share data<br />
<strong>2007</strong> 2006 2005 2004 2003<br />
Balance Sheet Data:<br />
Total Assets ...................................... $41,625 $47,952 $10,452 $ 7,851 $ 4,666<br />
Long-Term Indebtedness ........................... 474 15 88 114 20<br />
ITEM 7.<br />
MANAGEMENT’S DISCUSSION AND ANALYSIS OF FINANCIAL CONDITION AND<br />
RESULTS OF OPERATIONS.<br />
The following discussion of our financial condition and results of operations contains forward-looking<br />
statements that involve risks and uncertainties, such as statements of our plans, objectives, expectations and<br />
intentions. As described at the beginning of this <strong>Annual</strong> <strong>Report</strong>, our actual results could differ materially from<br />
those anticipated in these forward-looking statements. Factors that could contribute to such differences include<br />
those discussed below and in the section above entitled “Risk Factors.” You should not place undue reliance on<br />
these forward-looking statements, which apply only as of the date of this <strong>Annual</strong> <strong>Report</strong> on Form 10-K. Except as<br />
required by law, we undertake no obligation to update publicly any forward-looking statements to reflect new<br />
information, events or circumstances after the date of this <strong>Report</strong>, or to reflect the occurrence of unanticipated<br />
events You should read the following discussion and analysis in conjunction with our consolidated financial<br />
statements and the accompanying notes thereto included elsewhere in this <strong>Report</strong>.<br />
Our Business<br />
We develop, produce, market and distribute “Premium” or “New Age” beverages. We currently produce,<br />
market and distribute six beverage brands:<br />
• <strong>Jones</strong> Pure Cane <strong>Soda</strong>, a “premium” soda;<br />
• <strong>Jones</strong> 24C, an enhanced water beverage;<br />
• <strong>Jones</strong> Organics, a ready-to-drink organic tea;<br />
• <strong>Jones</strong> Energy, a citrus energy drink;<br />
• WhoopAss, a citrus energy drink; and<br />
• <strong>Jones</strong> Naturals ® , a non-carbonated juice & tea<br />
We currently sell and distribute our products throughout the United States and Canada through our network<br />
of independent distributors, which we refer to as our “direct store delivery” channel (DSD), and our national<br />
retail accounts, which we refer to as our “direct to retail” channel (DTR), as well as through licensing and<br />
distribution arrangements.<br />
30
In <strong>2007</strong>, we entered the carbonated soft drink market (CSD) with the introduction of 12-ounce cans of <strong>Jones</strong><br />
Pure Cane <strong>Soda</strong>, which are manufactured and distributed by National Beverage Corp. in grocery and mass<br />
merchant channels in the U.S. pursuant to an exclusive agreement we entered into with National Beverage in<br />
September 2006. Through this arrangement, we identify and secure retailers across the United States for our<br />
premium carbonated 12-ounce soft drinks and 16-ounce energy drink products, and we are responsible for all<br />
sales efforts, marketing, advertising and promotion. Using concentrate supplied by <strong>Jones</strong>, National Beverage both<br />
manufactures and sells on an exclusive basis the products directly to retailers. National Beverage is responsible<br />
for the manufacturing, delivery and invoicing of the sales of our products in this channel.<br />
With respect to our DSD channel, we have focused our sales and marketing resources on the expansion and<br />
penetration of our products through our independent distributor network in our core markets consisting of the<br />
Northwest, Southwest and Midwest U.S. and Western Canada, as well as targeted expansion into our less<br />
penetrated markets consisting of the Northeast and Southeast U.S. and Eastern Canada.<br />
We launched our DTR business strategy in 2003 as a complementary channel of distribution to our DSD<br />
channel, targeting large national retail accounts. Through these programs, we negotiate directly with large<br />
national retailers, primarily premier food service-based businesses, to carry our products, serviced through the<br />
retailer’s appointed distribution system. We currently have distribution arrangements with Barnes & Noble,<br />
Panera Bread Company, Target Corporation, Sam’s Club and Wal-Mart Stores, Inc.<br />
Beginning in 2004, we launched our licensing business strategy as a method to extend our brand into<br />
non-alternative beverage products and non-beverage products. We currently have licensing arrangements with<br />
two companies: Big Sky Brands, Inc. and J&J Snack Foods. With these licensing agreements, we believe that we<br />
are able to partner with companies that can manufacture <strong>Jones</strong> related products and extend our <strong>Jones</strong> brand into<br />
select products that we feel enhance our brand image. We do not expect this business to be a material part of our<br />
operations in 2008.<br />
Critical Accounting Estimates and Policies<br />
The discussion and analysis of our financial condition and results of operations is based upon our<br />
consolidated financial statements, which have been prepared in accordance with accounting principles generally<br />
accepted in the United States. The preparation of these financial statements requires us to make estimates and<br />
judgments that affect the reported amounts of assets, liabilities, revenues and expenses, and related disclosure of<br />
contingent assets and liabilities. On an on-going basis, we evaluate our estimates including, but not limited to,<br />
among others, those affecting revenues, the allowance for doubtful accounts, the salability of inventory, the<br />
useful lives of tangible and intangible assets, valuation allowances for receivables, stock-based compensation<br />
expense, valuation allowances for deferred income taxes and liabilities and contingencies. The brief discussion<br />
below is intended to highlight some of the judgments and uncertainties that can impact the application of these<br />
policies and the specific dollar amounts reported on our financial statements. We base our estimates on historical<br />
experience and on various other assumptions that we believe to be reasonable under the circumstances, the<br />
results of which form our basis for making judgments about the carrying values of assets and liabilities that are<br />
not readily apparent from other sources. Actual results may differ from these estimates under different<br />
assumptions or conditions, or if management made different judgments or utilized different estimates. Many of<br />
our estimates or judgments are based on anticipated future events or performance, and as such are forwardlooking<br />
in nature, and are subject to many risks and uncertainties, including those discussed below and elsewhere<br />
in this <strong>Report</strong>. We do not undertake any obligation to update or revise this discussion to reflect any future events<br />
or circumstances.<br />
We have identified below some of our accounting policies that we consider critical to our business<br />
operations and the understanding of our results of operations. This is not a complete list of all of our accounting<br />
policies, and there may be other accounting policies that are significant to us. For a detailed discussion on the<br />
application of these and our other accounting policies, see Note 2 to the Consolidated Financial Statements<br />
included in this <strong>Report</strong>.<br />
31
Revenue Recognition<br />
We recognize revenue when persuasive evidence of an arrangement exists, delivery has occurred, the sales<br />
price is fixed or determinable and collectability is reasonably assured.<br />
With respect to our DSD and DTR channels, our products are sold on various terms for cash or credit. Our<br />
credit terms, which are established in accordance with local and industry practices, typically require payment<br />
within 30 days of delivery. We recognize revenue upon receipt of our products by our distributors and retail<br />
customers in accordance with written sales terms, net of provisions for discounts and allowances. All sales to<br />
distributors and customers are final sales and we have a “no return” policy, however, in limited instances, due to<br />
credit issues, or product quality issues, we may take back product.<br />
With respect to our CSD channel, we recognize revenue from the sale of concentrate to National Beverage<br />
Corp. on a gross basis and recognize income upon receipt of concentrate by National Beverage. The selling price<br />
and terms of sale of concentrate to National Beverage are determined in accordance with our manufacturing and<br />
distribution agreement with them. Our credit terms from the sale of concentrate typically require payment within<br />
30 days of delivery. All sales of concentrate to National Beverage are final sales and we have a “no return”<br />
policy with them, however, in limited instances, due to product quality or other custom package commitments,<br />
we may take back product.<br />
Licensing revenue is recorded when we receive a sale confirmation from the third party.<br />
We pay for slotting fees or similar arrangements in accordance with Emerging Issues Task Force Issue<br />
(“EITF”) No. 01-9, Accounting for Consideration Given by a Vendor to a Customer (Including a Reseller of the<br />
Vendor’s Products). Generally, this incentive is recognized as a reduction in revenue at the later of the date on<br />
which the related revenue is recognized or a commitment is made. If we receive a benefit from any such<br />
incentives over a period of time and we meet certain other criteria, such as retailer performance, recoverability<br />
and enforceability, such incentives are recorded as an asset and are amortized as a reduction of revenue over the<br />
term of the arrangement. Typically, we amortize slotting fees over a period of 12 months. We evaluate the<br />
recoverability of any deferred slotting fees on a quarterly basis.<br />
Cash consideration and promotion allowances (including slotting fees) that we pay to customers or<br />
distributors are accounted for as a reduction of revenue when expensed or amortized in our statements of<br />
operations. For the years ended December 31, <strong>2007</strong> and 2006, our revenue was reduced by $5,499,000 and<br />
$480,000, respectively, on account of cash considerations, slotting fees, and promotion allowances.<br />
We entered into Sponsorship Agreements with Football Northwest LLC (d/b/a Seattle Seahawks) and<br />
First & Goal, Inc. on May 22, <strong>2007</strong> and Brooklyn Arena LLC and New Jersey Nets Basketball, LLC on<br />
November 8, <strong>2007</strong> that provide us with the exclusive beverage rights for certain soft drinks as well as signage,<br />
advertising and other promotional benefits to enhance our brand awareness. We have allocated amounts under<br />
the agreements to the identifiable benefits including signage, advertising and other promotional benefits based on<br />
their fair value and are recognizing such costs in promotion and selling expenses based on our existing policy for<br />
such expenses. The remaining amounts due under the agreement in excess of the fair value of the identifiable<br />
benefits, if any, are recorded as an expense.<br />
Allowance for Doubtful Accounts; Bad Debt Expense<br />
Management routinely estimates the collectability of our accounts receivable. Management analyzes<br />
accounts receivable, historical bad debts, customer concentrations, customer credit-worthiness, current economic<br />
trends and changes in our customer payment terms when evaluating the adequacy of the allowance for doubtful<br />
accounts. In general, we have historically, and continue today, to provide an allowance for doubtful accounts<br />
equal to 100% of any unpaid balance outstanding greater than 90 days since invoice, unless considered<br />
32
collectible. We believe that, in general, bad debt reserves for other companies in the beverage industry represent<br />
approximately 2% of total sales. Historically, our bad debt reserve has represented approximately 0.3% of total<br />
sales. Bad debt expense is classified within general and administrative expenses in our Consolidated Statements<br />
of Operations.<br />
Additionally, if we receive notice of a disputed receivable balance, we accrue such additional amount as<br />
management determines is reflective of the risk of non-collection. In considering the amount of bad debt<br />
allowance, we rely heavily on our history of no material write-offs and that our revenue is not dependent on one<br />
or a few customers, but is spread among a number of customers. However, other factors which could cause<br />
management to change its estimates would be a downturn in the economy that management determines has the<br />
potential to affect collections if we see a greater concentration of our receivables from fewer customers. In such<br />
events, we may be required to record additional charges to cover this exposure. Material differences may result in<br />
the amount and timing of our bad debt expenses for any period if management made different judgments or<br />
utilized different estimates.<br />
Inventory<br />
We hold raw materials and finished goods inventories, which are manufactured and procured based on our<br />
sales forecasts. We value inventory at the lower of cost and estimated net realizable value, and include<br />
adjustments for estimated obsolescence, on a first in-first out basis. These valuations are subject to customer<br />
acceptance and demand for the particular products, and our estimates of future realizable values based on these<br />
forecasted demands. We regularly review inventory detail to determine whether a write-down is necessary. We<br />
consider various factors in making this determination, including recent sales history and predicted trends,<br />
industry market conditions and general economic conditions. Differences could result in the amount and timing<br />
of write-downs for any period if we make different judgments or use different estimates. We also determine an<br />
allowance for obsolescence based on products that are over 12 months from production date. During the year<br />
ended December 31, <strong>2007</strong>, we recorded inventory provisions and write-downs of approximately $1,700,000 as<br />
we discontinued the production of high fructose corn syrup inventory and discontinued the sales of 16 ounce<br />
<strong>Jones</strong> <strong>Soda</strong> cans and various other special packs. At December 31, <strong>2007</strong> and 2006, we had an inventory<br />
obsolescence provision of $565,000 and $76,000, respectively.<br />
Deferred Income Taxes<br />
The determination of our provision of income taxes requires significant judgment, the use of estimates, and<br />
the interpretation and application of complex tax laws. To the extent management believes it is more likely than<br />
not that we will not be able to utilize some or all of our deferred tax assets prior to their expiration, we are<br />
required to establish valuation allowances against that portion of deferred tax assets. The determination of<br />
required valuation allowances involves significant management judgment and is based upon our best estimate of<br />
anticipated taxable profits in various jurisdictions with which the deferred tax assets are associated. Changes in<br />
expectations could result in significant adjustments to the valuation allowances and material changes to our<br />
provision for income taxes.<br />
Prior to the second quarter of 2006, we maintained a valuation allowance for all of the U.S. and foreign<br />
deferred taxes in accordance with Statement of Financial Accounting Standards 109 (“SFAS 109,”) “Accounting<br />
for Income Taxes” due to the uncertainty regarding the full utilization of our deferred tax asset.<br />
During the fourth quarter of fiscal <strong>2007</strong>, we concluded that it was appropriate to record a charge of<br />
approximately $5,482,785 to establish a full valuation allowance against the tax benefits arising from losses in<br />
our U.S operations. During the fourth quarter of fiscal <strong>2007</strong>, the Company experienced significant losses due to<br />
lower margins and the recording charges such as severance costs, promotions, slotting fee costs, inventory<br />
provisions for discontinued product and legal and professional fees which negatively impacted U.S. pretax<br />
income and caused the Company to be in the position as of December 31, <strong>2007</strong> of having cumulative losses in<br />
33
ecent years with respect to our U.S. operations. Although we do not expect to incur some of these costs in future<br />
years, we do not know yet if these investments are an aberration and the success of our incremental investments<br />
in the business remains unknown. In accordance with the relevant accounting guidance, we considered future<br />
projections of U.S. pretax income as a material factor in our analysis of the realizability of our net U.S. deferred<br />
tax assets, however, it was difficult to overcome the cumulative loss. The negative events mentioned above,<br />
while not necessarily recurring in nature and maybe beneficial to our long-term future prospects, were material to<br />
our decision to establish a full valuation allowance against our net U.S. deferred tax assets. This is due to the fact<br />
that the relevant accounting guidance puts more weight on the negative objective evidence of cumulative losses<br />
in recent years than the positive subjective evidence of future projections of pretax income. We continually<br />
analyze the realizability of our deferred tax assets, but reasonably expect to continue to record a full valuation<br />
allowance on future U.S. tax benefits until we sustain an appropriate level of taxable income through improved<br />
U.S. operations and tax planning strategies. No valuation allowance was recorded for deferred tax assets recorded<br />
in the Canadian subsidiary, as this subsidiary remains profitable.<br />
We adopted the provisions of Financial Accounting Standards Board Interpretation No. 48 (“FIN 48”) on<br />
January 1, <strong>2007</strong>. The adoption of FIN 48 did not impact the consolidated financial condition, results of<br />
operations or cash flows. We believe that we have appropriate support for the income tax positions taken and to<br />
be taken on our tax returns and that our accruals for tax liabilities are adequate for all open years based on an<br />
assessment of many factors including past experience and interpretations of tax law applied to the facts of each<br />
matter. Therefore, no reserves for uncertain income tax positions have been recorded for the year ended<br />
December 31, <strong>2007</strong> pursuant to FIN 48.<br />
Contingencies<br />
We are subject to the possibility of losses from various contingencies. See Item 3.—Legal Proceedings.<br />
Considerable judgment is necessary to estimate the probability and amount of loss from such contingencies. An<br />
accrual is made when it is probable that a liability has been incurred or an asset has been impaired and the<br />
amount of loss can be reasonably estimated. We accrue a liability and charge to operations for estimated costs of<br />
adjudication or settlement and unasserted claims existing as of the balance sheet date.<br />
As of December 31, <strong>2007</strong>, no loss contingencies have been accrued for any class action or derivative<br />
lawsuits, as we are unable to predict the outcome of these cases. An adverse court determination in any of these<br />
actions against us could result in significant liability and could have a material adverse effect on our business,<br />
results of operations or financial condition, subject to the limits of our insurance policies.<br />
Stock-based Compensation<br />
We have adopted Statement of Financial Accounting Standards No. 123R, “Share-Based Payment” (SFAS<br />
123R), using the modified prospective transition method in 2006. Under this method, stock-based compensation<br />
expense is recognized using the fair-value based method for all awards granted on or after the date of adoption.<br />
We have adopted the Black-Scholes option pricing model to estimate fair value of each option grant.<br />
Determining the fair value of share-based awards at the grant date requires judgment. In addition, judgment is<br />
also required in estimating the amount of share-based awards that are expected to be forfeited. If actual results<br />
differ significantly from these estimates, stock-based compensation expense and our results of operations could<br />
be materially impacted.<br />
During the year ended December 31, <strong>2007</strong>, the Board of Directors granted restricted stock awards of<br />
140,000 shares under our 2002 Stock Option and Restricted Stock Plan, which was amended and approved by<br />
our shareholders in May <strong>2007</strong>. Under the fair value recognition provision of SFAS 123R, share-based<br />
compensation cost for stock awards is measured at the grant date based on the fair value of the award and is<br />
recognized as expense over the requisite service period.<br />
34
We amortize stock-based compensation for both stock option grants and stock awards over a period of 42<br />
months, with the first 1/7th, vesting six months from the grant date and the balance vesting in equal amounts<br />
every six months thereafter.<br />
On May 22, <strong>2007</strong>, our Board of Directors determined that the following policy will apply to grants of stock<br />
options under any of the <strong>Jones</strong> <strong>Soda</strong> Co. existing stock option plans: Without the prior approval of the <strong>Jones</strong><br />
<strong>Soda</strong> Co.’s shareholders, stock option grants under any of the <strong>Jones</strong> <strong>Soda</strong> Co. stock option plans will not be<br />
repriced, replaced or regranted in the form of replacement options, stock awards, or by lowering the option<br />
exercise price of a previously granted option.<br />
Results of Operations for the Year Ended December 31, <strong>2007</strong><br />
For ease of presentation in the following discussions of “Results of Operations” and “Liquidity and Capital<br />
Resources”, we round amounts less than one million dollars to the nearest thousand dollars and amounts greater<br />
than one million dollars to the nearest hundred thousand dollars.<br />
Revenue<br />
Year Ended<br />
December 31,<br />
(Dollars in Thousands) <strong>2007</strong> 2006 2005<br />
Gross Revenue (1) ....................................... $45,330 $39,515 $33,804<br />
Less: Promotion allowances and slotting fees (2) ............... 5,499 480 293<br />
Net Revenues ........................................... $39,831 $39,035 $33,511<br />
Revenue increase ........................................ 2.0% 16.5% 22.1%<br />
(1) Gross revenues, which excludes the impact of slotting fees and promotional allowances, is a non-GAAP<br />
financial measure. The most directly comparable GAAP measure is net revenues. Under GAAP, slotting<br />
fees and promotional allowances are recorded as a reduction of revenue in calculating net revenues. Gross<br />
revenues is used by management to monitor operating performance, including in comparison to prior years,<br />
as it allows evaluation of sales performance before the effects of any slotting fees and promotional items,<br />
which can mask certain performance issues. Management believes that the presentation of gross revenues<br />
provides useful information to investors because it allows a more comprehensive presentation of the<br />
Company’s operating performance. However, gross revenues should not be used alone as an indicator of<br />
operating performance in place of net revenues. Gross revenues may not be realized in the form of cash<br />
receipts as slotting fees and promotional payments and allowances may be deducted from payments<br />
received from customers. This table reconciles gross revenues to net revenues.<br />
(2) Although the expenditures described in this line item are determined in accordance with GAAP and meet<br />
GAAP requirements, the disclosure thereof does not conform with GAAP presentation requirements.<br />
Additionally, the presentation of promotional allowances and slotting fees may not be comparable to similar<br />
items presented by other companies. The presentation of promotional allowances and slotting fees facilitates<br />
an evaluation of the impact thereof on the determination of net revenues and illustrates the spending levels<br />
incurred to secure such sales.<br />
Fiscal <strong>2007</strong> to 2006<br />
For the year ended December 31, <strong>2007</strong>, net revenues were approximately $39,831,000, an increase of<br />
$796,000, or 2% over the approximately $39,035,000 in net revenues for the year ended December 31, 2006. The<br />
increase in net revenues was primarily attributable to increased case sales through our DTR and DSD network, as<br />
well as a higher overall price per case in <strong>2007</strong>.<br />
For the year ended December 31, <strong>2007</strong>, our gross revenue was reduced by $5,499,000 on account of slotting<br />
fees and promotion allowances, compared to a reduction of $480,000 for the year ended December 31, 2006.<br />
35
During <strong>2007</strong>, the total amount of slotting fees recorded as a reduction of revenue was approximately $2,707,000,<br />
cash considerations and discounts amounted to approximately $738,000 and the remaining amount of<br />
approximately $2,054,000 was for promotion allowances. The slotting fees were incurred to gain entry into the<br />
CSD channel for our 12oz cans. We do not expect the same level of investments in slotting fees for 2008. We<br />
expect promotional allowance spending to be flat for 2008 compared to <strong>2007</strong> levels.<br />
The increase in revenues in our DTR channel for <strong>2007</strong> compared to 2006 was due to increased case sales of<br />
<strong>Jones</strong> <strong>Soda</strong> 12-ounce bottles to Wal-Mart, Sam’s Club and shipments of 24C to WinCo Foods. This was offset by<br />
the reduction of sales to Starbucks in <strong>2007</strong>, as Starbucks stopped purchasing <strong>Jones</strong> Pure Cane <strong>Soda</strong> for its stores<br />
in the U.S. in the second quarter of <strong>2007</strong>.<br />
Revenues in our DSD network increased for the year. Increased case sales in the Northeast, Southeast,<br />
Northwest, Eastern Canada and Western Canada were partially offset by decreased case sales in the Midwest and<br />
Southwest. The decreased case sales in the Midwest and Southwest were due to changeover of distributors and<br />
soft market conditions.<br />
Concentrate sales to National Beverage in <strong>2007</strong>, included primarily sales of <strong>Jones</strong> Pure Cane <strong>Soda</strong><br />
concentrate, were primarily made during the first three quarters of <strong>2007</strong>. There was very minimal shipment of<br />
concentrate in the fourth quarter of <strong>2007</strong> due to promotion programs not generating expected sell through to<br />
generate production orders from National Beverage. Concentrate case sales for the year ended December 31,<br />
<strong>2007</strong>, include sales of concentrate of <strong>Jones</strong> Pure Cane <strong>Soda</strong> and <strong>Jones</strong> Energy to National Beverage Corp.<br />
Concentrate case sales in fiscal 2006 consisted solely of sales during the second quarter of 2006 of <strong>Jones</strong> Energy<br />
concentrate to National Beverage for sale through Costco and <strong>Jones</strong> <strong>Soda</strong> concentrate sales in the fourth quarter.<br />
During <strong>2007</strong>, we have significantly increased the number of retail stores carrying our 12-ounce can product. The<br />
number of stores available to carry our product increased from approximately 1,400 stores in 2006 to<br />
approximately 14,500 stores in <strong>2007</strong>. We acquired this increased distribution through our sales and marketing<br />
efforts in the CSD channel throughout the year and also through the payment of slotting fees.<br />
In addition, revenues for the year ended December 31, <strong>2007</strong> include sales of 24C, our enhanced water<br />
beverage, and sales under our Sponsorship Agreement with the Seattle Seahawks, for which we had no<br />
comparable sales in fiscal 2006. In <strong>2007</strong>, we commenced shipment of 24C to retailers and distributors in various<br />
focus markets. We anticipate shipping out 24C to other markets in the U.S. and Canada in 2008.<br />
Consolidated case sales of all products (including all finished products and concentrate sales through our<br />
DSD, DTR and CSD channels) for the year ended December 31, <strong>2007</strong>, expressed as 288-ounce equivalent cases,<br />
were 5,796,000. This is an increase of 1,037,000 cases or 21.8% over total case sales for the year ended<br />
December 31, 2006.<br />
288-ounce equivalent case sales<br />
<strong>2007</strong> 2006 2005<br />
Finished products case sales ...................................... 3,126,000 2,592,000 2,569,000<br />
Concentrate case sales ........................................... 2,670,000 2,167,000 —<br />
Total case sales ................................................ 5,796,000 4,759,000 2,569,000<br />
Fiscal 2006 to 2005<br />
For the year ended December 31, 2006, revenues were approximately $39,035,000, an increase of<br />
$5,524,000, or 16.5% over the $33,511,000 in revenues for the year ended December 31, 2005. The increase in<br />
revenues in fiscal 2006 over fiscal 2005 was due to increased revenue through our DTR channel offset by a<br />
36
decrease in revenues in our DSD channel in 2006 compared to 2005. In addition to the above factor, the increase<br />
in revenue for 2006 reflects sales of our Valentines packs (for which we had no similar promotion in 2005) and<br />
sales of concentrate for our <strong>Jones</strong> Energy cans during the second quarter of 2006 and sales of concentrate for our<br />
<strong>Jones</strong> Pure Cane <strong>Soda</strong> cans during the fourth quarter of 2006. We had no concentrate sales in the comparable<br />
period in 2005.<br />
The overall decrease in revenues in our DSD network in 2006 compared to 2005 was due primarily to<br />
decreased case sales of <strong>Jones</strong> <strong>Soda</strong> and <strong>Jones</strong> Organics through our distributor network in the Northwest,<br />
Midwest and Southwest U.S. These decreases were partially offset by slight increases in case sales in the<br />
Northeast, Southeast, Eastern and Western Canada.<br />
The increase in revenues in our DTR network was also due to our strategy of growing national retail<br />
accounts. In 2006 we recorded increased revenues over fiscal 2005 from certain of our existing national retail<br />
accounts including Target Corporation, Starbucks Coffee Company, Panera Bread Company, and Barnes &<br />
Noble. Starbucks Coffee Company stopped ordering <strong>Jones</strong> Pure Cane <strong>Soda</strong> for its stores in the U.S. in the second<br />
quarter of <strong>2007</strong>.<br />
Revenues for the fiscal 2006 year also reflect a price increase for certain products implemented during the<br />
first quarter of 2006.<br />
Consolidated case sales of all products (finished products and concentrate) for the year ended December 31,<br />
2006 expressed as 288-ounce equivalent cases were 4,759,000, an increase of 85% or 2,190,000 cases from total<br />
case sales of 2,569,000 in 2005. We had no case sales of concentrate in 2005.<br />
Gross Profit<br />
Year Ended<br />
December 31,<br />
(Dollars in Thousands) <strong>2007</strong> 2006 2005<br />
Gross profit .............................................. $9,444 $15,305 $11,595<br />
Gross profit increase (decrease) .............................. (38.3)% 32.0% 21.2%<br />
Gross profit as a percentage of revenue ........................ 23.7% 39.2% 34.6%<br />
Fiscal <strong>2007</strong> to 2006<br />
For the year ended December 31, <strong>2007</strong>, gross profit decreased by approximately $5,861,000 or 38.3% as<br />
compared to $15,305,000 in gross profit for the year ended December 31, 2006. For fiscal <strong>2007</strong>, gross profit as a<br />
percentage of revenue decreased to 23.7% from 39.2% for fiscal 2006.<br />
The decrease in gross profit and gross profit as a percentage of revenue for the year ended December 31,<br />
<strong>2007</strong>, was attributable to increased recording of slotting fees and promotion allowances which reduced revenues<br />
by $5,499,000 and inventory provisions and write-downs of approximately $1,700,000 related to, among other<br />
items, the transition from high fructose corn syrup to pure cane sugar production during the first three quarters<br />
and the discontinuance of our 16-ounce <strong>Jones</strong> <strong>Soda</strong> cans and certain special packs and flavors in the fourth<br />
quarter. Changes in product mix and sales mix in the DSD and DTR channels also contributed to the lower<br />
margins as we shipped more product to our DTR customers where we receive lower gross margins than<br />
shipments to our distributors.<br />
We continued to experience higher co-packing costs for some of our products due to increases in energy<br />
costs, co-packing fees, currency fluctuations with the Canadian dollar and freight costs. During <strong>2007</strong>, we<br />
continued to shift a portion of our bottling requirements to our U.S co-packers in an effort to reduce freight and<br />
co-packing costs. We expect similar margin pressure from these factors in 2008.<br />
37
Fiscal 2006 to 2005<br />
For the year ended December 31, 2006, gross profit increased by approximately $3,710,000 or 32.0% over<br />
the $11,595,000 in gross profit for the year ended December 31, 2005. For fiscal 2006, gross profit as a<br />
percentage of revenue increased to 39.2% from 34.6% for fiscal 2005. The increase in gross profit was primarily<br />
attributable to increased revenues and improved product mix. The increase in gross profit as a percentage of<br />
revenue was primarily attributable to improved product mix and the overall increase in the average selling price<br />
per case. Higher margins on the sales of concentrate for the <strong>Jones</strong> Energy 16-ounce, <strong>Jones</strong> 12-ounce Pure Cane<br />
<strong>Soda</strong> and Valentines Packs improved the product mix and gross margin improvement.<br />
In 2006, we continued to experience higher co-packing costs for some of our products due to increases in<br />
energy costs, co-packing fees and freight costs. In response, we continued to shift a portion of our bottling<br />
requirements to our U.S co-packers in an effort to reduce freight and co-packing costs.<br />
Licensing Revenue<br />
Year Ended<br />
December 31,<br />
(Dollars in Thousands) <strong>2007</strong> 2006 2005<br />
Licensing revenue ........................................... $ 334 $684 $ 724<br />
Licensing revenue increase (decrease) ............................ (51.2)% (5.5)% 564.2%<br />
Fiscal <strong>2007</strong> to 2006<br />
Licensing revenue during the year ended December 31, <strong>2007</strong> was primarily due to our exclusive<br />
arrangements with Big Sky Brands for <strong>Jones</strong> <strong>Soda</strong> Flavor Booster Hard Candy and remaining royalties on the<br />
sale of remaining high fructose corn syrup inventory through Target Corporation. In contrast, for the year ended<br />
December 31, 2006, licensing revenue consisted primarily of royalty payments on the sale of 12-ounce cans<br />
pursuant to our exclusive licensing arrangement with Target Corporation that expired on December 31, 2006, and<br />
to a lesser extent our licensing arrangement with Big Sky Brands.<br />
For the year ended December 31, <strong>2007</strong>, we received royalty payments under these arrangements of<br />
approximately $334,000 as compared to licensing revenue of $684,000 for the year ended December 31, 2006, a<br />
decrease of 51.2%. We do not expect licensing revenue to represent a material portion of our overall revenues in<br />
2008.<br />
Fiscal 2006 to 2005<br />
For the year ended December 31, 2006, we received licensing revenue of approximately $684,000, a<br />
decrease of $40,000, or 5.5%, over licensing revenue of $724,000 for the year ended December 31, 2005. The<br />
majority of our licensing revenue was from our exclusive arrangement with Target Corporation to sell <strong>Jones</strong><br />
<strong>Soda</strong> in a 12-ounce can fridge pack. This agreement expired on December 31, 2006. During 2006, Target<br />
licensing revenue decreased from comparable periods in the prior year due to reduced promotion spending. Some<br />
of this decrease was offset by increased licensing revenue from Big Sky Brand for the <strong>Jones</strong> <strong>Soda</strong> Flavor Hard<br />
Candy.<br />
Licensing revenue also includes revenue from our license arrangements with Lime-Lite Marketing<br />
Corporation for <strong>Jones</strong> <strong>Soda</strong> lip balms and The Kroger Co. for <strong>Jones</strong> <strong>Soda</strong> Frozen <strong>Soda</strong> Pops. We discontinued the<br />
licensing agreement with Kroger for <strong>Jones</strong> <strong>Soda</strong> Frozen <strong>Soda</strong> Pops in 2006.<br />
38
Total Operating Expenses<br />
Year Ended<br />
December 31,<br />
(Dollars in Thousands) <strong>2007</strong> 2006 2005<br />
Promotion and selling ..................................... $11,857 $ 8,480 $ 7,667<br />
General and administrative ................................ $ 8,893 4,750 $ 3,347<br />
Total operating expenses .................................. $20,750 $13,230 $11,014<br />
Total operating expenses increase ........................... 56.8% 20.1% 31.4%<br />
Total operating expenses as a percentage of revenue ............ 52.1% 33.9% 32.9%<br />
Fiscal <strong>2007</strong> to 2006<br />
Total operating expenses for the year ended December 31, <strong>2007</strong>, were approximately $20,750,000, an<br />
increase of $7,520,000 or 56.8% over operating expenses of $13,230,000 for the year ended December 31, 2006.<br />
The increase in total operating expenses was primarily attributable to an increase in trade promotion expenses in<br />
the CSD and DSD channels, costs related to the Seahawks Sponsorship agreement, increased salaries for new<br />
employees in the sales group, recording of severance expense related to the termination of various employees,<br />
depreciation, stock-based compensation expenses, and professional and legal fees.<br />
For the year ended December 31, <strong>2007</strong>, total operating expenses as a percentage of revenue increased to<br />
52.1% from 33.9% in fiscal 2006. The increase in total operating expenses was primarily attributable to an<br />
increase in trade promotion expenses in the CSD and DSD channels, costs related to the Seahawks Sponsorship<br />
agreement, increased salaries for new employees in the sales group, recording of severance expense related to the<br />
termination of various executives, depreciation, stock-based compensation expenses, and professional and legal<br />
fees.<br />
Changes in promotion and general and administrative expenses are explained in greater detail below.<br />
Fiscal 2006 to 2005<br />
Total operating expenses for the year ended December 31, 2006 were approximately $13,230,000, an<br />
increase of $2,216,000 or 20.1% over operating expenses of $11,014,000 for the year ended December 31, 2005.<br />
For fiscal 2006, total operating expenses as a percentage of revenue increased to 33.9% from 32.9% over the<br />
comparable period in 2005. The increase in total operating expenses was primarily attributable to an increase in<br />
promotion and selling expenses which was due primarily to the recording of stock-based compensation expense,<br />
and to a lesser extent, an increase in general and administrative expense.<br />
Promotion and Selling Expenses<br />
Year Ended<br />
December 31,<br />
(Dollars in Thousands) <strong>2007</strong> 2006 2005<br />
Promotion and selling ....................................... $11,857 $8,480 $7,667<br />
Promotion and selling increase ............................... 39.8% 10.6% 28.8%<br />
Promotion and selling as a percentage of revenue ................. 29.8% 21.7% 22.9%<br />
Fiscal <strong>2007</strong> to 2006<br />
Promotion and selling expenses for the year ended December 31, <strong>2007</strong>, were $11,857,000, representing an<br />
increase of $3,377,000 over promotion and selling expenses of $8,480,000 for the year ended December 31,<br />
2006. Promotion and selling expenses as a percentage of revenue increased to 29.8% for the year ended<br />
39
December 31, <strong>2007</strong>, from 21.7% in fiscal 2006. The increase in promotion and selling expenses was due to an<br />
increase in promotion and selling expenses for the CSD and DSD channels. Increased promotion expenses were<br />
incurred in the CSD channel as we entered into this new category. DSD promotion increased due to the<br />
introduction of 24C in various markets and overall increased spending on various DSD customers. We will<br />
continue to make investments for these new channel and platform introductions in 2008 to increase penetration in<br />
the marketplace. Expenses for the year also include salaries for various senior and regional sales and marketing<br />
vice-presidents hired during <strong>2007</strong>. We did not have comparable executive level positions and expenses in 2006.<br />
The increase in promotion and selling expenses in <strong>2007</strong> was also due to hiring a national advertising agency<br />
to develop an advertising campaign for our <strong>Jones</strong> <strong>Soda</strong> products. We expect to develop more integrated<br />
marketing programs in 2008 to support the sell through of our products.<br />
This was the first year we incurred expenses related to our Sponsorship Agreement with the Seahawks and<br />
New Jersey Nets. A significant amount of the expenses incurred were for our Sponsorship Agreement with the<br />
Seahawks and included amortization of the sponsorship fees, product development costs and marketing costs.<br />
The agreement with the Nets is subject to the approval of NBA Properties, Inc. and will not be effective until<br />
expressly approved by NBA Properties. As of the date of the filing of this <strong>Annual</strong> <strong>Report</strong> on Form 10-K, NBA<br />
Properties has not approved the agreement.<br />
At December 31, <strong>2007</strong>, we had 46 employees in sales and marketing compared to 38 such employees at<br />
December 31, 2006. The increase in hiring additional personnel also contributed significantly to the total increase<br />
in promotion and selling expenses.<br />
Fiscal 2006 to 2005<br />
Promotion and selling expenses for the year ended December 31, 2006 were $8,480,000, an increase of<br />
$813,000, or 10.6% over promotion and selling expenses of $7,667,000 for the year ended December 31, 2005.<br />
Promotion and selling expenses as a percentage of revenue decreased to 21.7% for fiscal 2006 from 22.9% over<br />
the comparable period in 2005. The increase in promotion and selling expenses for the year ended December 31,<br />
2006 was attributable to an increase in consolidated case sales volume, an increase in salaries and wages,<br />
commissions and related DSD sales team expenses associated with our expanding DSD and CSD sales force, as<br />
well as expenses associated with the launch of the <strong>Jones</strong> Pure Cane <strong>Soda</strong> and <strong>Jones</strong> 24C product line and stock<br />
compensation expense. At December 31, 2006 we had 38 employees in sales and marketing, compared to 29<br />
such employees at December 31, 2005.<br />
General and Administrative Expenses<br />
Year Ended<br />
December 31,<br />
(Dollars in Thousands) <strong>2007</strong> 2006 2005<br />
General and administrative ................................... $8,893 $4,750 $3,347<br />
General and administrative increase ............................ 87.2% 41.9% 37.9%<br />
General and administrative as a percentage of revenue .............. 22.4% 12.2% 10.0%<br />
Fiscal <strong>2007</strong> to 2006<br />
General and administrative expenses for the year ended December 31, <strong>2007</strong> were $8,893,000, representing<br />
an increase of $4,143,000, or 87.2% compared to $4,750,000 for the year ended December 31, 2006. General and<br />
administrative expenses as a percentage of revenue increased to 22.4% for the year ended December 31, <strong>2007</strong>,<br />
from 12.2% in fiscal 2006. The increase in general and administrative expenses was due to the recording of<br />
severance expenses of approximately $1,147,300 for the termination of various employees, a significant increase<br />
40
in legal fees due to defending against the class action and derivative lawsuits and increased negotiation costs of<br />
various customer and supplier agreements, audit and consulting fees related to Sarbanes-Oxley Section 404<br />
compliance, depreciation and amortization and stock-based compensation.<br />
Fiscal 2006 to 2005<br />
General and administrative expenses for the year ended December 31, 2006 were $4,750,000, an increase of<br />
$1,402,000, or 41.9%, compared to $3,347,000 for the year ended December 31, 2005. General and<br />
administrative expenses as a percentage of revenue increased to 12.2% for fiscal 2006 from 10.0% for 2005. The<br />
increase in general and administrative expenses is primarily due to the recording of the stock-based<br />
compensation expense of approximately $734,000 (compared to approximately $6,000 of stock-based<br />
compensation expense in 2005) as well as increases in audit, consulting fees related to Sarbanes-Oxley<br />
Section 404 compliance regarding internal controls and legal fees related to general counsel work and contract<br />
negotiation for the DSD and CSD categories.<br />
Interest / Other Income, Net<br />
Fiscal <strong>2007</strong> to 2006<br />
For the year ended December 31, <strong>2007</strong>, interest/other income was approximately $1,498,000 compared to<br />
interest/other income of approximately $913,000 in fiscal 2006. The increase in interest income/other income<br />
was due to interest income from the funds we received from our June 2006 equity offering that were available for<br />
the entire year and foreign currency translation gains. Interest income consists of interest income earned on cash<br />
on-hand and short-term investments and increased cash from operations. Currently, cash and cash from<br />
operations are invested in money market and short-term fixed-income instruments.<br />
Fiscal 2006 to 2005<br />
For the year ended December 31, 2006 interest/other income was approximately $913,000 compared to<br />
approximately $29,000 in the same period in 2005. Interest income consisted of interest income earned on the<br />
proceeds from our equity offering in June 2006 and increased cash from operations during the year.<br />
Income Taxes<br />
Year Ended<br />
December 31,<br />
(Dollars in Thousands) <strong>2007</strong> 2006 2005<br />
Income tax benefit (expense) ................................ $(2,155) $ 903 $ (51)<br />
Effective tax rate ......................................... (22.35)% (25.6)% (3.9)%<br />
Fiscal <strong>2007</strong> to 2006<br />
For the year ended December 31, <strong>2007</strong>, we recorded a valuation allowance on our deferred taxes in the forth<br />
quarter and, thus, recorded a net income tax expense of $2,155,000 compared to an income tax benefit of<br />
$903,000 in fiscal 2006.<br />
The tax provision for the year ended December 31, <strong>2007</strong>, is based on an expected annual effective tax rate<br />
of (22.35)%, compared to a U.S. statutory rate of 34%. The actual effective tax rate for the year ended<br />
December 31, <strong>2007</strong> differs from 2006 due primarily to the recording of the valuation allowance on the U.S.<br />
deferred tax assets.<br />
The tax provision for the year ended December 31, 2006, is based on an effective tax rate of (25.6) %<br />
compared to a U.S. statutory rate of 34%.<br />
41
Our effective tax rate is based on recurring factors, including the forecasted mix of income before taxes in<br />
various jurisdictions, estimated permanent differences and the related effective tax rates in those jurisdictions. In<br />
addition, our effective tax rate will change based on discrete or other nonrecurring events that may not be<br />
predictable.<br />
Fiscal 2006 to 2005<br />
For the year ended December 31, 2006, we recorded an income tax benefit of approximately $903,000<br />
compared to a tax expense of $51,000 in fiscal 2005. The tax benefit is primarily due to the reversal of the<br />
valuation allowance on the deferred tax assets primarily to prior year’s tax losses.<br />
Net Income (Loss)<br />
Fiscal <strong>2007</strong> to 2006<br />
Net loss for the year ended December 31, <strong>2007</strong> was approximately ($11,629,000) as compared to net<br />
income of $4,574,000 for the year ended December 31, 2006. The decrease in net income was due to an increase<br />
in slotting fees costs, promotion allowances and operating expenses. Operating expenses increased due to<br />
increased trade promotion spending for CSD and DSD channels, increased expenses related to increased hiring in<br />
sales, marketing and operations departments, depreciation and amortization and legal and compliance costs.<br />
Fiscal 2006 to 2005<br />
Net income for the year ended December 31, 2006 was approximately $4,574,000 compared to net income<br />
of $1,283,000 for fiscal 2005. The increase in net income for the comparable year was due primarily to increased<br />
revenues from sales in the DTR channels and the sale of concentrate for <strong>Jones</strong> Energy and <strong>Jones</strong> Pure Cane <strong>Soda</strong>.<br />
Liquidity and Capital Resources<br />
Cash, cash equivalents and short-term investments were approximately $27,793,000 as of December 31,<br />
<strong>2007</strong> compared to approximately $30,224,000 as of December 31, 2006. Net cash used in operating activities<br />
was approximately $3,311,000 for the year ended December 31, <strong>2007</strong>, primarily due to loss from earnings<br />
partially offset by cash increases related to working capital items, such as accounts receivable, inventory and<br />
accounts payable and accrued liabilities. Investing activities provided approximately $5,786,000 for the year<br />
ended December 31, <strong>2007</strong>, primarily due to sale of short-term investments offset by purchases of capital assets<br />
and other assets. Net cash provided by financing activities was approximately $1,477,000 for the year ended<br />
December 31, <strong>2007</strong>, and consisted of primarily of proceeds from the exercise of stock options.<br />
As of December 31, <strong>2007</strong>, we had working capital of approximately $31,483,000 compared to working<br />
capital of approximately $39,474,000 as of December 31, 2006. The decrease in working capital was primarily<br />
due to cash used in operating activities of $3,311,000, due to the net loss for the year, reduced accounts<br />
receivable and inventory balances, the purchase of capital assets and other assets of $630,000, offset by proceeds<br />
from exercise of stock options of approximately $1,604,000.<br />
We expect cash flows from operations, cash, cash equivalents, short-term investments and our revolving<br />
line of credit with Key Bank to provide sufficient liquidity to meet our foreseeable cash requirements for<br />
operations, projected working capital requirements, planned capital expenditures and commitments for at least<br />
the next twelve months.<br />
Accounts receivable decreased from December 31, 2006, to December 31, <strong>2007</strong>, from approximately<br />
$6,914,000 to approximately $4,475,000. This decrease was primarily due to decreased shipments of our<br />
products in the fourth quarter of <strong>2007</strong>. Accounts payable increased from December 31, 2006 to December 31,<br />
<strong>2007</strong> from approximately $5,447,000 to approximately $6,993,000. This increase was primarily due to increased<br />
accruals for purchases of inventory, severance, professional fees and trade promotion expenses.<br />
42
Various class action lawsuits and derivative suits have been filed against us and certain directors and<br />
officers during the third quarter of <strong>2007</strong>. We are unable to predict the outcome of these cases. An adverse court<br />
determination in any of these actions against us could result in significant liability and could have a material<br />
adverse effect on our business, results of operations or financial condition, subject to the limits of our insurance<br />
policies.<br />
On June 8, 2006, we completed an equity offering of 3,157,895 shares of common stock and received<br />
approximately $28,077,000 in net proceeds after payment of offering expenses and commissions to our<br />
placement agent and financial advisor. Net proceeds will continue to be used for working capital and general<br />
corporate purposes, and to fund our growth objectives. Currently, the funds from the offering are invested in<br />
money market and short term fixed income instruments.<br />
On August 21, <strong>2007</strong>, we entered into a Loan Agreement with Key Bank National Association, providing for<br />
a revolving line of credit in principal amount of up to $15 million. The new credit facility replaces the $5 million<br />
revolving line of credit with Greater Bay Business Funding, which expired by its terms on August 25, <strong>2007</strong>, with<br />
no borrowings outstanding upon the expiration of the term. The new credit facility matures on August 21, 2009.<br />
The credit facility is not subject to any borrowing base computations or limitations, but does contain certain<br />
financial covenants that the Company must meet. We must maintain a minimum Current Ratio (Current Assets to<br />
Current Liabilities, each as defined in the Loan Agreement) of 2.00 to 1.00. Also, our ratio of Total Debt to<br />
Tangible Net Worth (each as defined in the Loan Agreement) cannot exceed 1.00 to 1.00. At our election, the<br />
interest rate on the credit facility will be based on either (a) Key Bank’s prime rate minus 1.50% per annum, or<br />
(b) LIBOR plus 1.00% per annum. The credit facility is secured by a grant of a first priority security interest in<br />
all of our assets. Concurrently with the Loan Agreement, on August 21, <strong>2007</strong>, we entered into a Security<br />
Agreement in favor of Key Bank. The Loan Agreement and Security Agreement contain customary<br />
representation and warranties, affirmative and negative covenants and events of default. Upon an event of<br />
default, outstanding amounts under the credit facility accrue interest at the prime rate plus 5.00%. As of the date<br />
of this <strong>Annual</strong> <strong>Report</strong>, we were in compliance with the above financial covenants and we had not borrowed any<br />
amounts under the credit facility.<br />
Contractual Obligations and Off-Balance Sheet Arrangements<br />
Our commitments as of December 31, <strong>2007</strong> with respect to known contractual obligations were as follows:<br />
Contractual obligations<br />
Total<br />
Payments Due by Period<br />
Less than 1<br />
year 2-3 years 4-5 years<br />
More than<br />
5 years<br />
Capital lease obligations .............. $ 740,726 $ 201,554 $ 346,185 $ 192,987 —<br />
Operating lease obligations ............ 648,548 190,988 339,611 117,949 —<br />
Purchase obligations .................. 21,908,568 3,658,627 11,958,500 4,227,350 2,064,091<br />
Capital expenditure commitments ....... 1,012,100 1,012,100 — — —<br />
TOTAL ............................ $24,309,942 $5,063,269 $12,644,296 $4,538,286 2,064,091<br />
Purchase obligations reflect commitments made by us to various suppliers of raw materials and finished<br />
goods and commitments under our Sponsorship Agreements with the Seattle Seahawks and the New Jersey Nets,<br />
which represent approximately 50% of the total purchase obligations. These obligations vary in terms and<br />
commit us to payments from 2008 to 2016.<br />
Capital expenditure commitments reflect the purchase of co-packing equipment related to the conversion to<br />
pure cane sugar.<br />
We have no off-balance sheet arrangements.<br />
43
ITEM 7A. QUANTITATIVE AND QUALITATIVE DISCLOSURES ABOUT MARKET RISK.<br />
In the normal course of our business, our financial position is routinely subject to a variety of risks. The<br />
principal market risks (i.e., the risk of loss arising from adverse changes in market rates and prices) to which we<br />
are exposed are fluctuations in energy and commodity prices affecting the cost of raw materials (including, but<br />
not limited to, increases in the price of aluminum for cans, resin for PET plastic bottles, as well as cane sugar),<br />
and the limited availability of certain raw materials and co-packer capacity. We are also subject to market risks<br />
with respect to the cost of commodities because our ability to recover increased costs through higher pricing is<br />
limited by the competitive environment in which we operate. In addition, we are subject to interest rate risk on<br />
our investment portfolio and foreign exchange risk due to our sales and co-packing operations in Canada. We are<br />
also subject to other risks associated with the business environment in which we operate, including the<br />
collectability of accounts receivable and obsolescence of inventory due to changes in market conditions or new<br />
product initiatives. We believe that our exposure to these risks as of December 31, <strong>2007</strong> is not material.<br />
We do not use derivative financial instruments to protect ourselves from fluctuations in interest rates or<br />
foreign currency fluctuations, and do not hedge against fluctuations in commodity prices. We do not use hedging<br />
agreements or alternative instruments to manage the risks associated with securing sufficient ingredients or raw<br />
materials, including, but not limited to, cans, PET plastic bottles, glass, labels, pure cane sugar or packaging<br />
arrangements, or protecting against shortages of raw materials.<br />
With respect to foreign currency risk, the functional currency for substantially all of our operations is the<br />
U.S. dollar. However, we held aggregate cash and operating assets in Canadian dollars valued at approximately<br />
U.S. $3,697,000 as of December 31, <strong>2007</strong>.<br />
At December 31, <strong>2007</strong>, the majority of our debt consisted of fixed rate debt under our capital leases and we<br />
have no long term debt. During the year ended December 31, <strong>2007</strong>, we did not make any draws on our line of credit.<br />
ITEM 8. FINANCIAL STATEMENTS AND SUPPLEMENTARY DATA.<br />
See Item 15 for an index to the consolidated Financial Statements and supplementary data required by this<br />
Item, which are included as a separate section beginning on page F-1 and which are incorporated herein by<br />
reference.<br />
ITEM 9. CHANGES IN AND DISAGREEMENTS WITH ACCOUNTANTS ON ACCOUNTING AND<br />
FINANCIAL DISCLOSURE.<br />
None.<br />
ITEM 9A. CONTROLS AND PROCEDURES.<br />
Disclosure Control and Procedures<br />
Under the supervision and with the participation of the Company’s management, including our Interim<br />
Chief Executive Officer and our Chief Financial Officer, the Company has evaluated the effectiveness of its<br />
disclosure controls and procedures (as defined in Rule 13a-15(e) under the Securities Exchange Act of 1934) as<br />
of December 31, <strong>2007</strong>, the end of the period covered by this report. Based upon that evaluation, our Interim<br />
Chief Executive Officer and our Chief Financial Officer have concluded that these disclosure controls and<br />
procedures were not effective as of December 31, <strong>2007</strong>. The basis for this determination was that, as discussed<br />
below, we have identified a material weakness in our internal control over financial reporting, which we view as<br />
an integral part of our disclosure controls and procedures.<br />
44
Management’s <strong>Report</strong> on Internal Control Over Financial <strong>Report</strong>ing<br />
Our management is responsible for establishing and maintaining adequate internal control over financial<br />
reporting, as defined in Exchange Act Rule 13a-15(f). Under the supervision and with the participation of our<br />
management, including our Interim Chief Executive Officer and our Chief Financial Officer, we conducted an<br />
evaluation of our internal control over financial reporting as of December 31, <strong>2007</strong>, based on the framework in<br />
Internal Control-Integrated Framework issued by the Committee of Sponsoring Organizations (“COSO”) of the<br />
Treadway Commission. Based on our evaluation under the framework in Internal Control—Integrated<br />
Framework, we have identified a material weakness in our internal control over financial reporting. As a result,<br />
our management has concluded that our internal control over financial reporting was not effective as of<br />
December 31, <strong>2007</strong>.<br />
A material weakness is a deficiency, or combination of deficiencies, in internal control over financial<br />
reporting such that there is a reasonable possibility that a material misstatement of our annual or interim<br />
consolidated financial statements will not be prevented or detected on at timely basis.<br />
Management has identified the following material weakness: The Company has limited accounting<br />
personnel with sufficient expertise, accounting knowledge and training in generally accepted accounting<br />
principles and financial reporting requirements. Specifically, we lack sufficient personnel to anticipate, identify,<br />
resolve and review complex accounting issues and to complete a timely review of the financial statements. This<br />
deficiency resulted in adjustments to the financial statements for stock based compensation and the recording of<br />
transactions associated with complex agreements and also resulted in adjustments to financial statement<br />
presentation. This control deficiency, which is pervasive in impact, did not result in any material adjustments to<br />
the financial statements: there is a reasonable possibility that a material misstatement of the annual or interim<br />
financial statements would not be prevented or detected on a timely basis.<br />
Management has discussed the material weaknesses and related corrective actions with the Audit<br />
Committee and our independent registered public accounting firm. Other than as described above, we are not<br />
aware of any other material weakness in our internal control over financial reporting. Because of its inherent<br />
limitations, internal control over financial reporting may not prevent or detect misstatements. Projections of any<br />
evaluation of effectiveness to future periods are subject to risk that controls may become inadequate because of<br />
changes in conditions, or that the degree of compliance with the policies or procedures may deteriorate.<br />
Our independent registered public accounting firm, KPMG LLP, has issued an attestation report on the<br />
Company’s internal control over financial reporting. The attestation report is included on page 47 of this report.<br />
The Remediation Plan and Changes in Internal Control Over Financial <strong>Report</strong>ing<br />
There were no changes in internal control over financial reporting during the fourth quarter that has<br />
materially affected, or are reasonably likely to materially affect, internal control over financial reporting.<br />
However, as discussed above, we have identified a material weakness in our internal control over financial<br />
reporting. Although we have not fully remediated the material weakness in our internal control over financial<br />
reporting as of December 31, <strong>2007</strong>, we have made and will continue to make, improvements to our policies,<br />
procedures, systems and staffing who have significant roles in internal control to address the internal control<br />
deficiencies identified by us and our independent registered public accounting firm. Consequently, management<br />
has initiated the following remediation steps to address the material weakness described above:<br />
• The Company will continue to add additional accounting and finance staff with the commensurate<br />
knowledge, experience and training necessary to complement the current staff in the financial reporting<br />
functions, in addition to the staff hired in <strong>2007</strong>.<br />
• In the first quarter of 2008, the Company hired a Manager of Legal Affairs to support all contract<br />
analysis and SEC compliance filings<br />
45
• The Company also hired in the first quarter of 2008 an experienced Manager of SEC and GAAP<br />
reporting to support and prepare all SEC filings in 2008.<br />
• In the first half of 2008, the Company intends to hire additional experienced accounting personnel with<br />
expertise in generally accepted accounting principles and regulatory financial reporting requirements.<br />
• We will continue to focus on improving the skill sets of our accounting and finance staff through<br />
education and training.<br />
• The Company has previously engaged qualified professional consultants where the Company did not<br />
have sufficient internal resources, with management reviewing both the inputs and outputs of the<br />
services provided. The Company will continue to seek employees for its accounting and finance staff<br />
with expertise with appropriate expertise and, as necessary, will continue to engage qualified<br />
professional consultants to supplement the Company’s accounting and finance staff.<br />
46
REPORT OF INDEPENDENT REGISTERED PUBLIC ACCOUNTING FIRM<br />
The Board of Directors and Stockholders of <strong>Jones</strong> <strong>Soda</strong> Co.:<br />
We have audited <strong>Jones</strong> <strong>Soda</strong> Co.’s internal control over financial reporting as of December 31, <strong>2007</strong>, based<br />
on criteria established in Internal Control—Integrated Framework issued by the Committee of Sponsoring<br />
Organizations of the Treadway Commission (COSO). <strong>Jones</strong> <strong>Soda</strong> Co.’s management is responsible for<br />
maintaining effective internal control over financial reporting and for its assessment of the effectiveness of<br />
internal control over financial reporting, included in the accompanying Management’s <strong>Report</strong> on Internal<br />
Control Over Financial <strong>Report</strong>ing. Our responsibility is to express an opinion on the Company’s internal control<br />
over financial reporting based on our audit.<br />
We conducted our audit in accordance with the standards of the Public Company Accounting Oversight<br />
Board (United States). Those standards require that we plan and perform the audit to obtain reasonable assurance<br />
about whether effective internal control over financial reporting was maintained in all material respects. Our<br />
audit included obtaining an understanding of internal control over financial reporting, assessing the risk that a<br />
material weakness exists, and testing and evaluating the design and operating effectiveness of internal control<br />
based on the assessed risk. Our audit also included performing such other procedures as we considered necessary<br />
in the circumstances. We believe that our audit provides a reasonable basis for our opinion.<br />
A company’s internal control over financial reporting is a process designed to provide reasonable assurance<br />
regarding the reliability of financial reporting and the preparation of financial statements for external purposes in<br />
accordance with generally accepted accounting principles. A company’s internal control over financial reporting<br />
includes those policies and procedures that (1) pertain to the maintenance of records that, in reasonable detail,<br />
accurately and fairly reflect the transactions and dispositions of the assets of the company; (2) provide reasonable<br />
assurance that transactions are recorded as necessary to permit preparation of financial statements in accordance<br />
with generally accepted accounting principles, and that receipts and expenditures of the company are being made<br />
only in accordance with authorizations of management and directors of the company; and (3) provide reasonable<br />
assurance regarding prevention or timely detection of unauthorized acquisition, use, or disposition of the<br />
company’s assets that could have a material effect on the financial statements.<br />
Because of its inherent limitations, internal control over financial reporting may not prevent or detect<br />
misstatements. Also, projections of any evaluation of effectiveness to future periods are subject to the risk that<br />
controls may become inadequate because of changes in conditions, or that the degree of compliance with the<br />
policies or procedures may deteriorate.<br />
A material weakness is a deficiency, or a combination of deficiencies, in internal control over financial<br />
reporting, such that there is a reasonable possibility that a material misstatement of the company’s annual or<br />
interim financial statements will not be prevented or detected on a timely basis. A material weakness related to<br />
limited accounting personnel with expertise in generally accepted accounting principles and financial reporting<br />
requirements has been identified and included in management’s assessment.<br />
We also have audited, in accordance with the standards of the Public Company Accounting Oversight Board<br />
(United States), the consolidated balance sheets of <strong>Jones</strong> <strong>Soda</strong> Co. and subsidiaries as of December 31, <strong>2007</strong> and<br />
2006, and the related consolidated statements of operations, shareholders’ equity and comprehensive income, and<br />
cash flows for each of the years in the three-year period ended December 31, <strong>2007</strong>. This material weakness was<br />
considered in determining the nature, timing, and extent of audit tests applied in our audit of the consolidated<br />
financial statements, and this report does not affect our report dated March 13, 2008, which expressed an<br />
unqualified opinion on those consolidated financial statements.<br />
47
In our opinion, because of the effect of the aforementioned material weakness on the achievement of the<br />
objectives of the control criteria, <strong>Jones</strong> <strong>Soda</strong> Co. has not maintained effective internal control over financial<br />
reporting as of December 31, <strong>2007</strong>, based on criteria established in Internal Control—Integrated Framework<br />
issued by the Committee of Sponsoring Organizations of the Treadway Commission.<br />
/s/ KPMG LLP<br />
Chartered Accountants<br />
Vancouver, Canada<br />
March 13, 2008<br />
48
ITEM 9B. OTHER INFORMATION.<br />
None.<br />
PART III<br />
ITEM 10. DIRECTORS, EXECUTIVE OFFICERS AND CORPORATE GOVERNANCE.<br />
Information regarding our Code of Ethics, as well as a listing of and certain information about our executive<br />
officers as of March 17, 2008, is included in Item 1 of Part I, and that information is incorporated by reference herein.<br />
The other information called for by Part III, Item 10, is included in our proxy statement relating to our 2008<br />
annual meeting of shareholders, and is incorporated herein by reference to the sections captioned “Directors and<br />
Executive Officers,” “Section 16 Beneficial Ownership <strong>Report</strong>ing Compliance,” “Board Meetings and<br />
Committees,” and “Audit Committee”. The proxy statement will be filed within 120 days of December 31, <strong>2007</strong>,<br />
our fiscal year end.<br />
ITEM 11. EXECUTIVE COMPENSATION.<br />
Information called for by Part III, Item 11, is included in our proxy statement relating to our 2008 annual<br />
meeting of shareholders, and is incorporated herein by reference to the sections captioned “Executive<br />
Compensation,” “Compensation Committee <strong>Report</strong>,” “Compensation Discussion and Analysis,” “Director<br />
Compensation” and “Compensation Committee Interlocks and Insider Participation.” The proxy statement will<br />
be filed within 120 days of December 31, <strong>2007</strong>, our fiscal year end.<br />
ITEM 12. SECURITY OWNERSHIP OF CERTAIN BENEFICIAL OWNERS AND MANAGEMENT<br />
AND RELATED SHAREHOLDER MATTERS.<br />
Certain information called for by Part III, Item 12, is included in our proxy statement relating to our 2008<br />
annual meeting of shareholders, and is incorporated herein by reference to the section captioned “Principal<br />
Shareholders.” The proxy statement will be filed within 120 days of December 31, <strong>2007</strong>, our fiscal year end.<br />
Equity Compensation Plan Information<br />
The following table gives information as of December 31, <strong>2007</strong>, the end of the most recently completed<br />
fiscal year, about shares of common stock that may be issued under our 1996 Stock Option Plan, 2002 Stock<br />
Option and Restricted Stock Plan and <strong>2007</strong> Employee Stock Purchase Plan, all of which have been approved by<br />
shareholders.<br />
Plan Category<br />
(a) (b) (c)<br />
Weighted<br />
Average<br />
Exercise<br />
Price of<br />
Outstanding<br />
Stock<br />
Options,<br />
Warrants and<br />
Rights<br />
No. of<br />
Shares to be<br />
Issued Upon<br />
Exercise of<br />
Outstanding<br />
Stock<br />
Options,<br />
Warrants and<br />
Rights<br />
Number of Securities<br />
Remaining available<br />
for Issuance Under<br />
Equity<br />
Compensation Plans<br />
(excluding Securities<br />
<strong>Report</strong>ed in Column<br />
(a))<br />
Equity Compensation Plans Approved by Shareholders .... 1,072,736 $8.91 1,668,572(1)<br />
Equity Compensation Plans Not Approved by<br />
Shareholders .................................... N/A N/A N/A<br />
TOTAL ...................................... 1,072,736 $8.91 1,668,572(1)<br />
(1) Includes 1,668,572 shares available for issuance under the 2002 Stock Option and Restricted Stock Plan,<br />
under which we may grant restricted stock awards in addition to stock options. Each non-employee director<br />
49
eceives an annual stock option grant of up to 20,000 shares of common stock pursuant to a program<br />
administered under our 2002 Stock Option and Restricted Stock Plan. Also includes 300,000 shares<br />
available for issuance under the <strong>2007</strong> Employee Stock Purchase Plan. The 1996 Stock Option Plan has been<br />
terminated and no additional options may be granted under the plan, although currently outstanding options<br />
will continue in accordance with their terms<br />
ITEM 13. CERTAIN RELATIONSHIPS AND RELATED TRANSACTIONS, AND DIRECTOR<br />
INDEPENDENCE.<br />
Information called for by Part III, Item 13, is included in our proxy statement relating to our 2008 annual<br />
meeting of shareholders, and is incorporated herein by reference to the sections captioned “Related-Party<br />
Transactions,” “Board Meetings and Committees” “and “Directors and Executive Officers.” The proxy statement<br />
will be filed within 120 days of December 31, <strong>2007</strong>, our fiscal year end.<br />
ITEM 14. PRINCIPAL ACCOUNTANT FEES AND SERVICES.<br />
Information called for by Part III, Item 14, is included in our proxy statement relating to our 2008 annual<br />
meeting of shareholders and is incorporated herein by reference to the sections captioned “Policy for Approval of<br />
Audit and Permitted Non-Audit Services” and “Audit and Related Fees.” The proxy statement will be filed<br />
within 120 days of December 31, <strong>2007</strong>, our fiscal year end.<br />
PART IV<br />
ITEM 15. EXHIBITS AND FINANCIAL STATEMENT SCHEDULES.<br />
Documents filed as part of this <strong>Report</strong> are as follows:<br />
1. Financial Statements: The following consolidated financial statements, related notes and report of<br />
independent registered public accounting firm are incorporated by reference into Item 8 of Part II of this<br />
<strong>2007</strong> <strong>Annual</strong> <strong>Report</strong> on Form 10-K:<br />
<strong>Report</strong> of Independent Registered Public Accounting Firm ...................................... F-2<br />
Consolidated Financial Statements:<br />
Consolidated balance sheets as of December 31, <strong>2007</strong> and 2006 .............................. F-3<br />
Consolidated statements of operations for the years ended December 31, <strong>2007</strong>, 2006 and 2005 ...... F-4<br />
Consolidated statements of shareholders’ equity and comprehensive income for the years ended<br />
December 31, <strong>2007</strong>, 2006 and 2005 ................................................... F-5<br />
Consolidated statements of cash flows for the years ended December 31, <strong>2007</strong> and 2006 ........... F-6<br />
Notes to consolidated financial statements .................................................... F-7<br />
2. Financial Statement Schedules: All schedules have been omitted because they are not applicable or not<br />
required, or the required information is included in the financial statements or notes thereto.<br />
Page<br />
50
3. Exhibits:<br />
3.1 Articles of Incorporation of <strong>Jones</strong> <strong>Soda</strong> Co. (Previously filed with, and incorporated herein by<br />
reference to, Exhibit 3.1 to our annual report on Form 10-KSB for the fiscal year ended<br />
December 31, 2000, filed on March 30, 2001; File No. 333-75913.)<br />
3.2 Bylaws of <strong>Jones</strong> <strong>Soda</strong> Co. (Previously filed with, and incorporated herein by reference to, Exhibit 3.2<br />
to our annual report on Form 10-KSB for the fiscal year ended December 31, 2000, filed on<br />
March 30, 2001; File No. 333-75913.)<br />
4.1 Escrow Agreement dated November 15, 2002, between <strong>Jones</strong> <strong>Soda</strong> Co., Pacific Corporate Trust<br />
Company, and the Shareholders named therein. (Previously filed with, and incorporated herein by<br />
reference to, our definitive proxy statement on Schedule 14A, filed on May 24, 2002; File No.<br />
000-28820.)<br />
10.1++ Bottling Agreement dated January 1, 2002, between <strong>Jones</strong> <strong>Soda</strong> Co. and Polaris Water Company Inc.<br />
(Previously filed with, and incorporated herein by reference to, Exhibit 10.1 to our annual report<br />
on Form 10-KSB for the year ended December 31, 2001, filed on April 1, 2002; File No.<br />
333-75913.)<br />
10.2++ Bottling Agreement dated December 13, 2001, between <strong>Jones</strong> <strong>Soda</strong> Co. and J. Lieb Foods Inc.<br />
(Previously filed with, and incorporated herein by reference to, Exhibit 10.2 to our annual report<br />
on Form 10-KSB for the year ended December 31, 2001, filed on April 1, 2002; File No.<br />
333-75913.)<br />
10.3++ Supply Agreement dated January 1, 2004, between <strong>Jones</strong> <strong>Soda</strong> Co. and Zuckerman-Honickman, Inc.<br />
(Previously filed with, and incorporated herein by reference to, the Company’s quarterly report on<br />
Form 10-QSB for the quarter ended Jun 30, 2004, filed on August 6, 2004; File No. 000-28820.)<br />
10.4++ Amendment No. 1 to Supply Agreement, dated June 27, 2004, between <strong>Jones</strong> <strong>Soda</strong> Co. and<br />
Zuckerman-Honickman, Inc. (Previously filed with, and incorporated herein by reference to, the<br />
Company’s quarterly report on Form 10-QSB for the quarter ended June 30, 2004, filed on<br />
August 6, 2004; File No. 000-28820.)<br />
10.5++ Distributor Agreement dated September 12, 2001, between <strong>Jones</strong> <strong>Soda</strong> Co. and <strong>Jones</strong> <strong>Soda</strong> of<br />
Michigan LLC. (Previously filed with, and incorporated herein by reference to, Exhibit 10.4 to our<br />
annual report on Form 10-KSB for the year ended December 31, 2001, filed on April 1, 2002; File<br />
No. 333-75913.)<br />
10.6 Lease Agreement dated September 15, 2006, between R2H2 LLC and <strong>Jones</strong> <strong>Soda</strong> Co. (Previously<br />
filed with, and incorporated herein by reference to, Exhibit 10.1 to our current report on Form 8-K,<br />
filed on September 22, 2006; File No. 000-28820.)<br />
10.7 Guaranty, dated June 25, 2006, by <strong>Jones</strong> <strong>Soda</strong> Co. in favor of CAPCO Financial Company.<br />
(Previously filed with, and incorporated herein by reference to, Exhibit 10.2 to our current report<br />
on Form 8-K, filed on June 30, 2006; File No. 000-28820.)<br />
10.8 Contract of Sale Security Agreement, dated June 25, 2006, between <strong>Jones</strong> <strong>Soda</strong> (USA), Inc. and<br />
CAPCO Financial Company, as amended by Amendment No. 1, dated June 25, 2006. (Previously<br />
filed with, and incorporated herein by reference to, Exhibit 10.1 to our current report on Form 8-K,<br />
filed on June 30, 2006; File No. 000-28820.)<br />
10.9* Employment Agreement with Peter M. van Stolk, dated effective December 1, 2004. (Previously<br />
filed with, and incorporated herein by reference to, Exhibit 10.1 to our current report on Form 8-K<br />
dated February 14, 2005, filed on February 16, 2005; File No. 000-28820.)<br />
51
10.10* Memorandum of Understanding, dated December 5, <strong>2007</strong>, between <strong>Jones</strong> <strong>Soda</strong> Co. and Peter van<br />
Stolk. (Previously filed with, and incorporated herein by reference to, Exhibit 10.1 to our current<br />
report on Form 8-K, filed on December 5, <strong>2007</strong>; File No. 000-28820.)<br />
10.11* Separation Agreement and Release, dated February 13, 2008, by and between the Company and<br />
Peter M. van Stolk. (Previously filed with, and incorporated herein by reference to, Exhibit 10.1<br />
to our current report on Form 8-K, filed on February 20, 2008; File No. 000-28820)<br />
10.12* Urban Juice & <strong>Soda</strong> Co. Ltd. 1996 Stock Option Plan. (Previously filed with, and incorporated<br />
herein by reference to, Exhibit 10.10 to our annual report on Form 10-KSB for the year ended<br />
December 31, 2001, filed on April 1, 2002; File No. 333-75913.)<br />
10.13* <strong>Jones</strong> <strong>Soda</strong> Co. 2002 Stock Option and Restricted Stock Plan. (Previously filed with, and<br />
incorporated herein by reference to, Appendix B to our definitive proxy statement for our <strong>2007</strong><br />
annual meeting of shareholders, filed on April 18, <strong>2007</strong>, File No. 000-28820.)<br />
10.14++ Supply Agreement with Panera, LLC, dated May 28, 2003. (Previously filed with, and incorporated<br />
herein by reference to, Exhibit 10.1 A to our quarterly report on Form 10-QSB for the quarter<br />
ended March 31, 2005, filed on May 16, 2005; File No. 000-28820.)<br />
10.15++ First Amendment to Supply Agreement with Panera, LLC, dated May 27, 2004. (Previously filed<br />
with, and incorporated herein by reference to, Exhibit 10.1B to our quarterly report on Form<br />
10-QSB for the quarter ended March 31, 2005, filed on May 16, 2005; File No. 000-28820.)<br />
10.16++ Second Amendment to Supply Agreement with Panera, LLC, dated April 1, 2005. (Previously filed<br />
with, and incorporated herein by reference to, Exhibit 10.1C to our quarterly report on Form 10-<br />
QSB for the quarter ended March 31, 2005, filed on May 16, 2005; File No. 000-28820.)<br />
10.17++ Co-Packers ® and Distribution Agreement, dated September 18, 2006, among <strong>Jones</strong> <strong>Soda</strong> Co.,<br />
National Retail Brands Inc. and Shasta Beverages Inc. (Previously filed with, and incorporated<br />
herein by reference to, Exhibit 10.1 to our quarterly report on Form 10-Q for the quarter ended<br />
September 30, 2006, filed on November 14, 2006; File No. 000-28820.)<br />
10.18* Employment Agreement with Hassan Natha, dated effective January 1, <strong>2007</strong>. (Previously filed with,<br />
and incorporated herein by reference to, Exhibit 10.1 to our current report on Form 8-K, filed<br />
March 6, <strong>2007</strong>; File No. 000-28820.)<br />
10.19++ Sponsorship Agreement among <strong>Jones</strong> <strong>Soda</strong> Co., Football Northwest, LLC (d/b/a Seattle Seahawks)<br />
and First & Goal, Inc., entered into May 22, <strong>2007</strong>. (Previously filed with, and incorporated herein<br />
by reference to, Exhibit 10.1 to our quarterly report on Form 10-Q, filed August 9, <strong>2007</strong>; File No.<br />
000-28820.)<br />
10.20* Employment offer letter with Peter Burns, dated April 3, <strong>2007</strong>. (Previously filed with, and<br />
incorporated herein by reference to, Exhibit 10.2 to our quarterly report on Form 10-Q, filed<br />
August 9, <strong>2007</strong>; File No. 000-28820.)<br />
10.21++ Sponsorship and Beverage Availability Agreement among Brooklyn Arena, LLC, New Jersey<br />
Basketball, LLC and <strong>Jones</strong> <strong>Soda</strong> Co., dated effective October 29, <strong>2007</strong>. (Previously filed with,<br />
and incorporated herein by reference to, Exhibit 10.2 to our quarterly report on Form 10-Q, filed<br />
November 9, <strong>2007</strong>; File No. 000-28820.)<br />
10.22 Loan Agreement, dated August 21, <strong>2007</strong>, between <strong>Jones</strong> <strong>Soda</strong> Co. and KeyBank National<br />
Association. (Previously filed with, and incorporated herein by reference to, Exhibit 10.1 to our<br />
current report on Form 8-K, filed August 27, <strong>2007</strong>; File No. 000-28820.)<br />
10.23 Commercial Security Agreement, dated August 21, <strong>2007</strong>, by <strong>Jones</strong> <strong>Soda</strong> Co. for the benefit of<br />
KeyBank National Association. (Previously filed with, and incorporated herein by reference to,<br />
Exhibit 10.2 to our current report on Form 8-K, filed August 27, <strong>2007</strong>; File No. 000-28820.)<br />
52
10.24* Form of Stock Option Agreement under 2002 Stock Option and Restricted Stock Plan (Filed<br />
herewith.)<br />
10.25* Form of Restricted Stock Purchase Agreement under 2002 Stock Option and Restricted Stock Plan.<br />
(Previously filed with, and incorporated herein by reference to, Exhibit 10.1 to our quarterly report<br />
on Form 10-Q, filed November 9, <strong>2007</strong>; File No. 000-28820.)<br />
10.26* <strong>Jones</strong> <strong>Soda</strong> Co. <strong>2007</strong> Employee Stock Purchase Plan. (Previously filed with, and incorporated herein<br />
by reference to, the Company’s definitive proxy statement on Schedule 14A, filed on April 18,<br />
<strong>2007</strong>; File No. 000-28820.)<br />
10.27* Compensation for Directors of <strong>Jones</strong> <strong>Soda</strong> Co. (Filed herewith.)<br />
10.28* Employment Letter, dated January 3, 2008, between the Company and Joth Ricci. (Previously filed<br />
with, and incorporated herein by reference to, Exhibit 99.2 to our current report on Form 8-K, filed<br />
January 9, 2008; File No. 000-28820)<br />
21.1 Subsidiaries of <strong>Jones</strong> <strong>Soda</strong> Co. (Previously filed with, and incorporated herein by reference to,<br />
Exhibit 21.1 to our annual report on Form 10-KSB for the year ended December 31, 2002, filed on<br />
March 28, 2003; File No. 000-28820.)<br />
23.1 Consent of KPMG LLP (Filed herewith.)<br />
31.1 Certification by Stephen C. <strong>Jones</strong>, Interim Chief Executive Officer, pursuant to Rule 13a-14(a),<br />
pursuant to Section 302 of the Sarbanes-Oxley Act of 2002 (Filed herewith.)<br />
31.2 Certification by Hassan N. Natha, Chief Financial Officer, pursuant to Rule 13a-14(a), pursuant to<br />
Section 302 of the Sarbanes-Oxley Act of 2002 (Filed herewith.)<br />
32.1 Certification by Stephen C. <strong>Jones</strong>, Interim Chief Executive Officer, pursuant to 18 U.S.C. Section<br />
1350, as adopted pursuant to Section 906 of the Sarbanes-Oxley Act of 2002 (Filed herewith.)<br />
32.2 Certification by Hassan N. Natha, Chief Financial Officer, pursuant to 18 U.S.C. Section 1350, as<br />
adopted pursuant to Section 906 of the Sarbanes-Oxley Act of 2002 (Filed herewith.)<br />
* Management contract or compensatory plan or arrangement.<br />
++ Portions of the marked exhibits have been omitted pursuant to requests for confidential treatment filed with<br />
the SEC.<br />
53
SIGNATURES<br />
In accordance with Section 13 or 15(d) of the Securities Exchange Act of 1934, the registrant has duly<br />
caused this report to be signed on its behalf by the undersigned, thereunto duly authorized.<br />
JONES SODA CO.<br />
By: /s/ STEPHEN C. JONES<br />
Stephen C. <strong>Jones</strong><br />
Interim Chief Executive Officer<br />
Dated: March 17, 2008<br />
In accordance with the Securities Exchange Act of 1934, this report has been signed below by the following<br />
persons on behalf of the registrant and in the capacities and on the dates indicated.<br />
Signature Capacities Date<br />
/s/<br />
STEPHEN C. JONES<br />
Stephen C. <strong>Jones</strong><br />
Interim Chief Executive Officer and<br />
Director (Principal Executive<br />
Officer)<br />
March 17, 2008<br />
/s/<br />
HASSAN N. NATHA<br />
Hassan N. Natha<br />
Chief Financial Officer (Principal<br />
Financial and Accounting Officer)<br />
March 17, 2008<br />
/s/<br />
SCOTT BEDBURY<br />
Scott Bedbury<br />
Chairman March 14, 2008<br />
/s/<br />
/s/<br />
/s/<br />
/s/<br />
/s/<br />
PETER M. VAN STOLK<br />
Peter M. van Stolk<br />
RICHARD S. EISWIRTH, JR.<br />
Rick Eiswirth, Jr.<br />
MICHAEL M. FLEMING<br />
Michael M. Fleming<br />
JOHN J. GALLAGHER, JR.<br />
John J. Gallagher, Jr.<br />
ALFRED W. ROSSOW, JR.<br />
Alfred W. Rossow, Jr.<br />
Director March 17, 2008<br />
Director March 17, 2008<br />
Director March 17, 2008<br />
Director March 17, 2008<br />
Director March 17, 2008<br />
54
JONES SODA CO.<br />
<strong>2007</strong> FORM 10-K ANNUAL REPORT<br />
INDEX TO CONSOLIDATED FINANCIAL STATEMENTS<br />
Page<br />
<strong>Report</strong> of Independent Registered Public Accounting Firm ...................................... F-2<br />
Consolidated Financial Statements:<br />
Consolidated balance sheets as of December 31, <strong>2007</strong> and 2006 .............................. F-3<br />
Consolidated statements of operations for the years ended December 31, <strong>2007</strong>, 2006 and 2005 ...... F-4<br />
Consolidated statements of shareholders’ equity and comprehensive income for the years ended<br />
December 31, <strong>2007</strong>, 2006 and 2005 ................................................... F-5<br />
Consolidated statements of cash flows for the years ended December 31, <strong>2007</strong> and 2006 ........... F-6<br />
Notes to consolidated financial statements .................................................... F-7<br />
F-1
REPORT OF INDEPENDENT REGISTERED PUBLIC ACCOUNTING FIRM<br />
The Board of Directors and Stockholders of <strong>Jones</strong> <strong>Soda</strong> Co.:<br />
We have audited the accompanying consolidated balance sheets of <strong>Jones</strong> <strong>Soda</strong> Co. and subsidiaries as of<br />
December 31, <strong>2007</strong> and 2006, and the related consolidated statements of operations, shareholders’ equity and<br />
comprehensive income, and cash flows for each of the years in the three-year period ended December 31, <strong>2007</strong>.<br />
These consolidated financial statements are the responsibility of the Company’s management. Our responsibility<br />
is to express an opinion on these consolidated financial statements based on our audits.<br />
We conducted our audits in accordance with the standards of the Public Company Accounting Oversight<br />
Board (United States). Those standards require that we plan and perform the audit to obtain reasonable assurance<br />
about whether the financial statements are free of material misstatement. An audit includes examining, on a test<br />
basis, evidence supporting the amounts and disclosures in the financial statements. An audit also includes<br />
assessing the accounting principles used and significant estimates made by management, as well as evaluating<br />
the overall financial statement presentation. We believe that our audits provide a reasonable basis for our<br />
opinion.<br />
In our opinion, the consolidated financial statements referred to above present fairly, in all material respects,<br />
the financial position of <strong>Jones</strong> <strong>Soda</strong> Co. and subsidiaries as of December 31, <strong>2007</strong> and 2006, and the results of its<br />
operations and its cash flows for each of the years in the three-year period ended December 31, <strong>2007</strong>, in<br />
conformity with United States generally accepted accounting principles.<br />
We also have audited, in accordance with the standards of the Public Company Accounting Oversight Board<br />
(United States), <strong>Jones</strong> <strong>Soda</strong> Co.’s internal control over financial reporting as of December 31, <strong>2007</strong>, based on<br />
criteria established in Internal Control—Integrated Framework issued by the Committee of Sponsoring<br />
Organizations of the Treadway Commission (COSO)”), and our report dated March 13, 2008 expressed an<br />
adverse opinion on the effectiveness of the Company’s internal control over financial reporting.<br />
/s/ KPMG LLP<br />
Chartered Accountants<br />
Vancouver, Canada<br />
March 13, 2008<br />
F-2
JONES SODA CO. AND SUBSIDIARIES<br />
CONSOLIDATED BALANCE SHEETS<br />
December 31, <strong>2007</strong> and 2006<br />
<strong>2007</strong> 2006<br />
ASSETS<br />
Current assets:<br />
Cash and cash equivalents (note 3) .................................. $17,857,805 $13,905,870<br />
Short-term investments (note 3) .................................... 9,935,400 16,318,510<br />
Accounts receivable (note 4) ....................................... 4,474,559 6,914,422<br />
Inventory (note 5) ............................................... 5,745,888 5,783,067<br />
Deferred income tax asset (note 13) ................................. — 1,507,145<br />
Prepaid expenses and deposits ...................................... 822,620 712,690<br />
38,836,272 45,141,704<br />
Deferred income tax asset (note 13) ..................................... 117,850 427,993<br />
Capital assets (note 6) ................................................ 1,078,916 756,618<br />
Other assets (note 7) .................................................. 1,418,516 1,414,138<br />
Intangible assets (note 8) .............................................. 173,040 211,931<br />
$ 41,624,594 $47,952,384<br />
LIABILITIES AND SHAREHOLDERS’ EQUITY<br />
Current liabilities:<br />
Accounts payable and accrued liabilities .............................. $ 6,993,226 $ 5,446,953<br />
Taxes payable ................................................... 203,379 150,141<br />
Current portion of capital lease obligations ............................ 156,847 70,471<br />
7,353,452 5,667,565<br />
Capital lease obligations, less current portion (note 10) ...................... 474,226 15,329<br />
Commitments and Contingencies (note 12) ................................ — —<br />
Shareholders’ equity (note 11):<br />
Common stock:<br />
Authorized: 100,000,000 common stock, no par value Issued and<br />
outstanding: 26,251,183 (2006—25,637,491) common stock ........ 43,855,928 41,890,777<br />
Additional paid-in capital ......................................... 3,990,711 2,832,865<br />
Accumulated other comprehensive income ............................ 129,471 96,016<br />
Deficit ........................................................ (14,179,194) (2,550,168)<br />
33,796,916 42,269,490<br />
$ 41,624,594 $47,952,384<br />
See accompanying notes to consolidated financial statements.<br />
F-3
JONES SODA CO. AND SUBSIDIARIES<br />
CONSOLIDATED STATEMENTS OF OPERATIONS<br />
Years ended December 31, <strong>2007</strong>, 2006 and 2005<br />
<strong>2007</strong> 2006 2005<br />
Revenue ............................................... $39,830,933 $39,035,125 $33,511,053<br />
Cost of goods sold ....................................... 30,387,170 23,730,059 21,915,930<br />
Gross profit ............................................ 9,443,763 15,305,066 11,595,123<br />
Licensing revenue ....................................... 334,252 684,256 724,183<br />
9,778,015 15,989,322 12,319,306<br />
Operating expenses (1):<br />
Promotion and selling ................................ 11,856,959 8,480,088 7,666,733<br />
General and administrative ............................ 8,893,307 4,750,102 3,347,615<br />
20,750,266 13,230,190 11,014,348<br />
Earnings (loss) before interest income and incomes taxes ........ (10,972,251) 2,759,132 1,304,958<br />
Interest/other income, net ................................. 1,498,452 912,557 28,600<br />
Earnings (loss) before income taxes ......................... (9,473,799) 3,671,689 1,333,558<br />
Income tax benefit (expense) (note 13)<br />
Current ............................................ (293,116) (241,741) (50,532)<br />
Deferred ........................................... (1,862,111) 1,144,491 —<br />
(2,155,227) 902,750 (50,532)<br />
Earnings (loss) for the year ................................ $(11,629,026) $ 4,574,439 $ 1,283,026<br />
Earnings (loss) per share:<br />
Basic .............................................. $ (0.45) $ 0.19 $ 0.06<br />
Diluted ............................................ $ (0.45) $ 0.19 $ 0.06<br />
Weighted average number of common stock:<br />
Basic .............................................. 25,977,832 23,890,313 21,412,214<br />
Diluted ............................................ 25,977,832 24,629,318 22,593,127<br />
(1) Includes non-cash stock-based compensation as follows:<br />
Promotion and selling ................................ $ 524,950 $ 323,085 $ —<br />
General and administrative ............................ 993,855 734,042 5,745<br />
$ 1,518,805 $ 1,057,127 $ 5,745<br />
See accompanying notes to consolidated financial statements.<br />
F-4
JONES SODA CO. AND SUBSIDIARIES<br />
CONSOLIDATED STATEMENTS OF SHAREHOLDERS’ EQUITY AND COMPREHENSIVE INCOME<br />
Years ended December 31, <strong>2007</strong>, 2006 and 2005<br />
Common stock<br />
Number Amount<br />
Additional<br />
paid-in<br />
capital<br />
Accumulated<br />
other<br />
comprehensive<br />
income Deficit<br />
Total<br />
shareholders’<br />
equity<br />
Balance, December 31, 2004 .............................. 20,956,346 $11,780,996 $ 758,877 $107,752 $ (8,299,898) $ 4,347,727<br />
Cash received for options exercised ........................ 660,250 710,137 — — — 710,137<br />
Stock-based compensation ............................... — — 5,745 — — 5,745<br />
Earnings and comprehensive income for the year ............. — — — — 1,283,026 1,283,026<br />
Balance, December 31, 2005 .............................. 21,616,596 12,491,133 764,622 107,752 (7,016,872) 6,346,635<br />
Cumulative effects of adjustments resulting from the adoption of<br />
SAB No. 108 (note 14) ................................ — — — — (107,735) (107,735)<br />
Shares issued for PIPE .................................. 3,157,895 28,077,350 — — — 28,077,350<br />
Cash received for options exercised ........................ 863,000 1,223,950 — — — 1,223,950<br />
Stock options exercised, including income tax benefits ......... — 98,344 1,011,116 — — 1,109,460<br />
Stock-based compensation ............................... — — 1,057,127 — — 1,057,127<br />
Earnings for the year .................................... — — — — 4,574,439<br />
Other comprehensive income, unrealized loss on<br />
available-for-sale short-term investments .................. — — — (11,736) —<br />
Comprehensive income for the year ........................ 4,562,703<br />
Balance, December 31, 2006 .............................. 25,637,491 41,890,777 2,832,865 96,016 (2,550,168) 42,269,490<br />
Cash received for options exercised ........................ 613,692 1,604,192 — — — 1,604,192<br />
Exercise of stock options ................................. 360,959 (360,959) — — —<br />
Stock-based compensation ............................... — — 1,518,805 — — 1,518,805<br />
Loss for the year ....................................... — — — — (11,629,026)<br />
Other comprehensive income, realized loss on available-for-sale<br />
short-term investments ................................ — — — 11,736 —<br />
Other comprehensive income, unrealized gain on<br />
available-for-sale short-term investments .................. — — — 21,719 —<br />
Comprehensive loss for the year ........................... — (11,595,571)<br />
Balance, December 31, <strong>2007</strong> .............................. 26,251,183 $43,855,928 $3,990,711 $129,471 $(14,179,194) $ 33,796,916<br />
See accompanying notes to consolidated financial statements.<br />
F-5
JONES SODA CO. AND SUBSIDIARIES<br />
CONSOLIDATED STATEMENTS OF CASH FLOWS<br />
Years ended December 31, <strong>2007</strong>, 2006 and 2005<br />
<strong>2007</strong> 2006 2005<br />
Cash flows from (used in) operating activities:<br />
(Loss) earnings for the year ............................ $(11,629,026) $ 4,574,439 $ 1,283,026<br />
Items not involving cash:<br />
Depreciation and amortization ..................... 1,015,445 256,046 220,283<br />
Deferred income taxes ............................ 1,862,111 (1,144,491) —<br />
Stock-based compensation (note 11) ................ 1,518,805 1,057,127 5,745<br />
Excess tax benefit from exercise of stock options ...... — (1,109,458) —<br />
Changes in assets and liabilities:<br />
Accounts receivable ............................. 2,439,863 (3,214,428) (865,112)<br />
Inventory ...................................... 37,179 (1,088,854) (1,143,618)<br />
Prepaid expenses ................................ (154,753) (566,076) 253,165<br />
Taxes payable .................................. 53,238 150,141 —<br />
Accounts payable and accrued liabilities ............. 1,546,273 1,543,300 1,058,051<br />
Changes related to shareholders’ equity accounts ...... — 198,591 —<br />
Net cash (used in) from operating activities ....... (3,310,865) 656,337 811,540<br />
Cash flows from (used in) investing activities:<br />
Short-term investments—net .......................... 6,416,565 (16,318,510) —<br />
Purchase of capital assets ............................. (317,230) (313,556) (50,871)<br />
Purchase of other assets .............................. (313,264) (1,414,138) —<br />
Purchase of intangible assets ........................... — (174,594) (42,072)<br />
Net cash from (used) in investing activities ....... 5,786,071 (18,220,798) (92,943)<br />
Cash flows from (used in) financing activities:<br />
Proceeds from exercise of options ...................... 1,604,192 1,223,951 710,137<br />
Repayment of capital lease obligations ................... (127,463) (116,529) (105,881)<br />
Repayment under line of credit ......................... — — (480,285)<br />
Net proceeds from PIPE (note 11) ...................... — 28,077,350 —<br />
Excess tax benefit from exercise of stock options .......... — 1,109,458 —<br />
Cash flows from financing activities ............. 1,476,729 30,294,230 123,971<br />
Net increase in cash and cash equivalents ..................... 3,951,935 12,729,769 842,568<br />
Cash and cash equivalents, beginning of year ................. 13,905,870 1,176,101 333,533<br />
Cash and cash equivalents, end of year ....................... $17,857,805 $ 13,905,870 $ 1,176,101<br />
Supplemental disclosure of non-cash financing and investing<br />
activities:<br />
Bad debt recovery ................................... $ — $ 7,633 $ 6,951<br />
Assets acquired under capital leases ..................... 672,736 — 131,152<br />
Cash paid (received) during year for:<br />
Interest ............................................ $ (1,684,791) $ 9,965 $ 20,000<br />
Income taxes ....................................... 591,977 135,134 55,373<br />
See accompanying notes to consolidated financial statements.<br />
F-6
JONES SODA CO. AND SUBSIDIARIES<br />
NOTES TO CONSOLIDATED FINANCIAL STATEMENTS<br />
Years Ended December 31, <strong>2007</strong> and 2006<br />
1. Nature and continuance of operations:<br />
<strong>Jones</strong> <strong>Soda</strong> Co. develops, produces, markets, licenses and distributes premium beverages and related<br />
products. Our primary product lines include the brands <strong>Jones</strong> <strong>Soda</strong> Co. ® , <strong>Jones</strong> Pure Cane <strong>Soda</strong>, <strong>Jones</strong> 24C,<br />
an enhanced water beverage, <strong>Jones</strong> Organics, a ready to drink organic tea, <strong>Jones</strong> Energy, a high energy drink,<br />
Whoop Ass Energy Drink ® , a high energy drink, and <strong>Jones</strong> Naturals ® , a non-carbonated juice and tea drink. We<br />
have two operating subsidiaries, <strong>Jones</strong> <strong>Soda</strong> Co. (USA) Inc. and <strong>Jones</strong> <strong>Soda</strong> (Canada) Inc., as well as two<br />
non-operating subsidiaries, Whoopass USA Inc and my<strong>Jones</strong>.com.<br />
2. Significant accounting policies:<br />
(a) Basis of presentation:<br />
The consolidated financial statements include the accounts of the Company and its wholly owned<br />
subsidiaries. All material inter-company transactions between the Company and its subsidiaries have been<br />
eliminated in consolidation.<br />
The Company, in accordance with Staff Accounting Bulletin No. 108, “Considering the Effects of Prior<br />
Year Misstatements when Quantifying Misstatement in Current Year Financial Statements” (SAB 108), adjusted<br />
its beginning retained earnings for the fiscal year 2006 in the accompanying financial statements. See Note 14 for<br />
additional information on the adoption of SAB 108.<br />
(b) Use of estimates:<br />
The preparation of the consolidated financial statements requires management to make a number of<br />
estimates and assumptions relating to the reported amounts of assets and liabilities and the disclosure of<br />
contingent assets and liabilities at the date of the consolidated financial statements and the reported amounts of<br />
revenue and expenses during the reporting period. Significant items subject to such estimates and assumptions<br />
include, but are not limited to, the inventory valuation, depreciable lives of capital assets, prepaid assets,<br />
intangible assets, valuation allowances for receivables, stock-based compensation expense, income taxes,<br />
valuation allowance for deferred income tax assets, and contingencies. Actual results could differ from those<br />
estimates.<br />
(c) Foreign currency translation:<br />
Except where otherwise stated, these consolidated financial statements are presented in U.S. dollars. All<br />
foreign exchange gains or losses, including those arising from translating the net monetary assets of the<br />
Company’s Canadian operations to the Company’s functional currency of US dollars, have been included in<br />
income. For the twelve month period ended December 31, <strong>2007</strong>, the Company incurred a foreign exchange gain<br />
(loss) of $68,542 (2006—$58,122, 2005—$3,835).<br />
(d) Cash and cash equivalents:<br />
The Company considers all short-term investments with a maturity date at purchase of three months or less<br />
to be cash equivalents.<br />
(e) Short – term investments:<br />
Short-term investments carried at fair value have a maturity of greater than three months to twelve months<br />
at the date of purchase. The estimate of fair value is based on publicly available market information or other<br />
estimates determined by management and classified as available-for-sale securities.<br />
F-7
(f)<br />
JONES SODA CO. AND SUBSIDIARIES<br />
NOTES TO CONSOLIDATED FINANCIAL STATEMENTS—(Continued)<br />
Years Ended December 31, <strong>2007</strong> and 2006<br />
Concentration of Risk:<br />
The Company maintains cash and cash equivalents with various major financial institutions, which at times<br />
are in excess of the amount insured. In addition, the Company’s marketable securities and money market<br />
accounts are principally held at one brokerage company.<br />
(g)<br />
Inventories:<br />
Inventories consist of raw materials and finished goods and are stated at the lower of cost and estimated net<br />
realizable value and include adjustments for estimated obsolescence. Cost is determined principally using actual<br />
cost on a first-in first-out basis. The provisions for excess inventory are based on estimated forecasted usage of<br />
inventories. A significant change in demand for certain products as compared to forecasted amounts may result<br />
in recording additional provisions for obsolete inventory. Provisions for obsolete are recorded as cost of goods<br />
sold.<br />
(h)<br />
Capital assets:<br />
Property and equipment is recorded at cost and depreciated on the declining balance basis over the estimated<br />
useful lives of the assets as follows:<br />
Asset<br />
Rate<br />
Equipment ................................................ 20%to30%<br />
Vehicles and Office and computer equipment .................... 30%<br />
Equipment under capital lease ................................ Lease term which<br />
approximates its<br />
useful life<br />
Depreciation expense is generally classified within general and administrative expense on our consolidated<br />
statements of operations. Other asset amortization is classified as “Cost of goods sold”.<br />
(i)<br />
Intangible assets:<br />
The Company’s intangible assets include costs associated with securing trademarks, acquired distribution<br />
rights and patents for the Company’s products and are amortized on a straight-line basis over 3 to 10 years.<br />
(j)<br />
Other assets:<br />
Other assets include leased equipment installed at co-packing and sponsorship partner facilities. This<br />
equipment is recorded at cost and amortized over 3 to 5 years.<br />
(k)<br />
Impairment of long-lived assets and long-lived assets to be disposed of:<br />
Long-lived assets, which include capital assets, intangible assets and other assets, are reviewed for<br />
impairment whenever events or changes in circumstances indicate that the carrying amount of an asset may not<br />
be recoverable. Recoverability of assets to be held and used is measured by a comparison of the carrying amount<br />
of the assets to future undiscounted net cash flows expected to be generated by the assets. If such assets are<br />
considered to be impaired, the impairment to be recognized is measured by the amount by which the carrying<br />
amount of the assets exceeds the fair value of the assets. Assets to be disposed of are reported at the lower of the<br />
carrying amount or fair value less costs to sell. The Company has not recorded any long-lived asset impairments.<br />
F-8
JONES SODA CO. AND SUBSIDIARIES<br />
NOTES TO CONSOLIDATED FINANCIAL STATEMENTS—(Continued)<br />
Years Ended December 31, <strong>2007</strong> and 2006<br />
(l)<br />
Revenue recognition:<br />
We recognize revenue when persuasive evidence of an arrangement exists, delivery has occurred, the sales<br />
price is fixed or determinable and collectability is reasonably assured.<br />
With respect to our independent distributor direct store delivery (“DSD”) and national retail account direct<br />
to retail (“DTR”) channels, our products are sold on various terms for cash or on credit terms. Our credit terms,<br />
which are established in accordance with local and industry practices, typically require payment within 30 days<br />
of delivery. We recognize revenue upon receipt of our products by our distributors and retail customers in<br />
accordance with written sales terms, net of provisions for discounts and allowances. All sales to distributors and<br />
customers are final sales and we have a “no return” policy. However, in limited instances, due to credit or<br />
product quality issues or distributor terminations, we may take back product.<br />
With respect to our 12-ounce can sales in the carbonated soft drink (“CSD”) channel, we recognize revenue<br />
from the sale of concentrate to National Beverage Corp, on a gross basis, using the criteria outlined in Emerging<br />
Issues Task Force Issue (“EITF”) No. 99-19, <strong>Report</strong>ing Revenue Gross as a Principal Versus Net as an Agent ,<br />
upon receipt of concentrate by National Beverage, net of provisions for discounts and promotion allowances. The<br />
selling price and terms of sale of concentrate to National Beverage are determined in accordance with our<br />
manufacturing and distribution agreement with them. Our credit terms from the sale of concentrate typically<br />
require payment within 30 days of delivery. All sales of concentrate to National Beverage are final sales and we<br />
have a “no return” policy with them. However, in limited instances, due to product quality or other custom<br />
package commitments, we may take back product.<br />
Licensing revenue is recorded when we receive a sale confirmation from the third party.<br />
We account for slotting fees or similar arrangements in accordance with EITF No. 01-9, Accounting for<br />
Consideration Given by a Vendor to a Customer (Including a Reseller of the Vendor’s Products). This incentive<br />
is recognized as a reduction in revenue when payment is made to the customer (or at the time we have incurred<br />
the obligation, if earlier) unless we receive a benefit over a period of time and we meet certain other criteria, such<br />
as retailer performance, recoverability and enforceability, in which case the incentive is recorded as an asset and<br />
is amortized as a reduction of revenue over the term of the arrangement. Typically, we amortize slotting fees over<br />
a period of 12 months. We evaluate slotting fees recoverability on a quarterly basis.<br />
Slotting fees, cash consideration and promotion allowances that we pay to customers or distributors are<br />
accounted for as a reduction of revenue when expensed or amortized in our statements of operations. For the year<br />
ended December 31, <strong>2007</strong>, our revenue was reduced by $5,499,802 (2006—$479,744, 2005—$293,295) on<br />
account of slotting fees, promotion allowances and cash considerations.<br />
We entered into Sponsorship Agreements with Football Northwest LLC (d/b/a Seattle Seahawks) and<br />
First & Goal, Inc. on May 22, <strong>2007</strong> and Brooklyn Arena LLC and New Jersey Nets Basketball, LLC on<br />
November 8, <strong>2007</strong> that provide us with the exclusive beverage rights for certain soft drinks as well as signage,<br />
advertising and other promotional benefits to enhance our brand awareness. We have allocated amounts under<br />
the agreements to the identifiable benefits including signage, advertising and other promotional benefits based on<br />
their fair value and are recognizing such costs in promotion and selling expenses based on our existing policy for<br />
such expenses. The remaining amounts due under the agreement in excess of the fair value of the identifiable<br />
benefits, if any, are recorded as an expense.<br />
F-9
JONES SODA CO. AND SUBSIDIARIES<br />
NOTES TO CONSOLIDATED FINANCIAL STATEMENTS—(Continued)<br />
Years Ended December 31, <strong>2007</strong> and 2006<br />
(m) Research and development:<br />
Research and development costs, which consist primarily of product development costs, are expensed in the<br />
period incurred and are included in general and administrative expenses. During the year ended December 31,<br />
<strong>2007</strong>, the Company incurred research and development costs of $216,268 (2006—$128,743, 2005—$41,406).<br />
(n) Selling and promotion costs:<br />
Selling and promotion costs include advertising costs, sales and marketing expenses, salary and benefit<br />
expenses for the sales and sales support workforce, promotional activity expenses, sponsorship costs and point of<br />
sale items. The Company expenses advertising and promotion costs as incurred. During the year ended<br />
December 31, <strong>2007</strong>, the Company incurred advertising costs of $6,596,665 (2006—$5,032,520, 2005—<br />
$5,120,326).<br />
(o) Stock-based compensation:<br />
Prior to January 1, 2006, we accounted for our employee stock compensation arrangements using the<br />
intrinsic method, under Accounting Principles Board Opinion No. 25, “Accounting for Stock Issued to<br />
Employees” and related Interpretations and provided the disclosure-only provisions of the fair value method<br />
under SFAS 123. Under the intrinsic value method, no stock-based compensation related to employee options<br />
had been recognized in our consolidated statement of operations, because the exercise price of our stock options<br />
granted to employees and directors equaled the fair market value of the underlying stock at the date of grant. For<br />
stock options issued to non-employees for services received, the fair value of the stock options issued at the date<br />
of the performance completion was recognized as a compensating expense.<br />
Effective January 1, 2006, we adopted Statement of Financial Accounting Standards No. 123R, “Share-<br />
Based Payment” (SFAS 123R), using the modified prospective transition method. Under this method, stockbased<br />
compensation expense is recognized using the fair-value based method for all awards granted on or after<br />
the date of adoption. In addition, compensation expense for unvested stock options that were outstanding on<br />
January 1, 2006 is recognized over the requisite service period based on the grant-date fair value of those options<br />
and awards as previously calculated for the pro forma disclosures under SFAS 123, as adjusted for estimated<br />
forfeitures.<br />
SFAS 123R requires forfeitures to be estimated at the time of grant and revised, if necessary, in subsequent<br />
periods if actual forfeitures differ from those estimates. In our pro forma information required under SFAS 123<br />
for the periods prior to January 1, 2006, we accounted for forfeitures as they occurred.<br />
The adoption of this standard resulted in a $1,057,127 decrease in earnings and income before taxes, or<br />
$0.04 basic and $0.04 diluted earnings per share for the twelve-month period ended December 31, 2006.<br />
Non-cash stock based compensation expense of $1,057,127 was added back to cash flows from operating<br />
activities during the twelve-month period ended December 31, 2006. There was no cumulative effect on<br />
adoption.<br />
F-10
JONES SODA CO. AND SUBSIDIARIES<br />
NOTES TO CONSOLIDATED FINANCIAL STATEMENTS—(Continued)<br />
Years Ended December 31, <strong>2007</strong> and 2006<br />
The following table illustrates the effect on net loss and loss per share if we had applied the fair value<br />
recognition principles of SFAS 123 to stock-based employee compensation during the corresponding periods in<br />
fiscal 2005.<br />
Twelve months<br />
ended<br />
December 31, 2005<br />
Net Income :<br />
As reported ............................................. $1,283,026<br />
Add: Stock-based employee compensation expense included in<br />
reported income ....................................... 5,745<br />
Deduct: Total stock-based employee compensation expense<br />
determined under fair value method for all awards ............ (908,834)<br />
Pro forma income ........................................ $ 379,937<br />
Basic earnings per share:<br />
As reported ............................................. $ 0.06<br />
Pro forma .............................................. $ 0.02<br />
Diluted earnings per share:<br />
As reported ............................................. $ 0.06<br />
Pro forma income ........................................ $ 0.02<br />
For our pro forma disclosure we recognized the fair value calculated at the grant date of the stock options on<br />
a straight-line basis consistent with the vesting terms.<br />
(p) Income taxes:<br />
The Company accounts for income taxes in accordance with SFAS No. 109, “Accounting for Income<br />
Taxes.” The objectives of accounting for incomes taxes are to recognize the amount of taxes payable for the<br />
current year and deferred tax assets and liabilities for future tax consequences of events at enacted tax rates that<br />
have been recognized in the Company’s financial statements or tax returns. The Company performs periodic<br />
evaluations of recorded tax assets and liabilities and maintains a valuation allowance, if considered necessary.<br />
The determination of taxes payable for the current year includes estimates. In the event that actual results differ<br />
materially from management’s expectations, the estimated taxes payable could materially change, directly<br />
impacting the Company’s financial position or results of operations.<br />
In September 2006, the FASB issued Financial Interpretation No. 48, “Accounting for Uncertainty in<br />
Income Taxes” (FIN 48), which clarifies the accounting for uncertainty in income taxes recognized in a<br />
company’s financial statements in accordance with FASB Statement 109, “Accounting for Income Taxes.”<br />
FIN 48 contains a two-step approach to recognizing and measuring uncertain tax positions accounted for in<br />
accordance with SFAS 109. The first step is to evaluate the tax position for recognition by determining if the<br />
weight of available evidence indicates it is more likely than not that the position will be sustained on audit,<br />
including resolution of related appeals or litigation processes, if any. The second step is to measure the tax<br />
benefit as the largest amount which is more than 50% likely of being realized upon ultimate settlement. We<br />
consider many factors when evaluating and estimating our tax positions and tax benefits, which may require<br />
periodic adjustments and which may not accurately forecast outcomes. The interpretation also provides guidance<br />
on de-recognition, classification, interest and penalties, accounting in interim periods, disclosure and transition.<br />
We and our subsidiaries file income tax returns in the U.S. federal jurisdiction, and various states and<br />
foreign jurisdictions. With few exceptions, we are no longer subject to U.S. federal, state and local, or non-U.S.<br />
F-11
JONES SODA CO. AND SUBSIDIARIES<br />
NOTES TO CONSOLIDATED FINANCIAL STATEMENTS—(Continued)<br />
Years Ended December 31, <strong>2007</strong> and 2006<br />
income tax examinations by tax authorities for years prior to 2003. However, net operating losses not yet utilized<br />
can be subject to adjustment by the Internal Revenue Service (IRS). We may from time to time be assessed<br />
interest or penalties by major tax jurisdictions, although any such assessments historically have been minimal and<br />
immaterial to our financial results. In the event we have received an assessment for interest and/or penalties, it<br />
has been classified in the financial statements as interest expense. There is no material interest expense or<br />
penalties accrued at December 31, <strong>2007</strong>. We believe that we have appropriate support for the income tax<br />
positions taken, and to be taken, on our tax returns and that our accruals for tax liabilities are adequate for all<br />
open years based on an assessment of many factors including past experience and interpretations of tax law<br />
applied to the facts of each matter. Therefore, no reserves for uncertain income tax positions have been recorded<br />
pursuant to FIN 48.<br />
We adopted the provisions of FIN 48 on January 1, <strong>2007</strong>. The adoption of FIN 48 did not impact the<br />
consolidated financial condition, results of operations or cash flows.<br />
As of December 31, <strong>2007</strong>, we are evaluating the deductibility of stock option expenses not included in<br />
previously filed tax returns. To the extent these unrecognized potential tax benefits may be ultimately<br />
recognized, they will impact the effective tax rate in a future period. The amount of this unrecognized benefit has<br />
not been determined. This evaluation does not meet the more-likely-than-not recognition threshold test and, as<br />
such, this potential benefit has not been recognized.<br />
(q) Earnings per share:<br />
Basic earnings per share is computed using the weighted average number of common shares outstanding<br />
during the periods, excluding reacquired stock and common stock held in escrow that is subject to cancellation if<br />
certain criteria are not achieved. Diluted earnings per share are computed by adjusting the weighted average<br />
number of common shares by the effective net exercise or conversion of all dilutive securities. In <strong>2007</strong>, due to<br />
the net loss, all outstanding equity options are anti-dilutive.<br />
(r) Comprehensive income:<br />
SFAS No. 130, “<strong>Report</strong>ing Comprehensive Income”, establishes standards for reporting and disclosure of<br />
comprehensive income and its components in a full set of general-purpose financial statements. The Company<br />
discloses the comprehensive income in the Consolidated Statements of Shareholders’ Equity and Comprehensive<br />
Income.<br />
The amount of comprehensive income related to available for sale investments is not significant in the prior<br />
year. The amount of accumulated other comprehensive income relates to the translation of the Company’s U.S.<br />
operation prior to the Company’s migration from Canada to the U.S.<br />
(s) Volume rebates from vendors:<br />
Consideration received by the Company from a vendor is accounted for as a reduction of cost of goods sold<br />
or inventory, as appropriate, as required under EITF 02-16 “Accounting by a Customer for Certain Consideration<br />
Received from a Vendor”. For the year ended December 31, <strong>2007</strong>, the reduction of cost of goods sold is $52,863<br />
(2006—$254,371, 2005—$191,112) and inventory is $0 (2006—$108,584, 2005—$10,534).<br />
(t) Seasonality:<br />
Our sales are seasonal and we experience significant fluctuations in quarterly results as a result of many<br />
factors. We generate a substantial percentage of our revenues during the warm weather months of April through<br />
F-12
JONES SODA CO. AND SUBSIDIARIES<br />
NOTES TO CONSOLIDATED FINANCIAL STATEMENTS—(Continued)<br />
Years Ended December 31, <strong>2007</strong> and 2006<br />
September. Timing of customer purchases will vary each year and sales can be expected to shift from one quarter<br />
to another. As a result, management believes that period-to-period comparisons of results of operations are not<br />
necessarily meaningful and should not be relied upon as any indication of future performance or results expected<br />
for the fiscal year.<br />
(u) Recent accounting pronouncements:<br />
In February <strong>2007</strong>, the FASB issued SFAS No. 159, “The Fair Value Option for Financial Assets and<br />
Financial Liabilities—Including an amendment of FASB Statement No. 115,” (“SFAS No. 159”). SFAS No. 159<br />
permits entities to choose to measure eligible items at fair value at specified election dates and report unrealized<br />
gains and losses on items for which the fair value option has been elected in earnings at each subsequent<br />
reporting date. SFAS No. 159 is effective for fiscal years beginning after November 15, <strong>2007</strong> and interim periods<br />
within those fiscal years. Early adoption, as of the beginning of an entity’s fiscal year, is also permitted, provided<br />
interim financial statements have not yet been issued. The Company is currently evaluating the impact this<br />
statement will have on its financial position and results of operations.<br />
In September 2006, the Financial Accounting Standards Board (FASB) issued SFAS No. 157, “Fair Value<br />
Measurements”. This Statement defines fair value, establishes a framework for measuring fair value in generally<br />
accepted accounting principles (GAAP), and expands disclosures about fair value measurements. SFAS No. 157<br />
is effective for financial statements issued for fiscal years beginning after November 15, <strong>2007</strong>. We are currently<br />
assessing the impact, if any, this provision may have on our financial position or results of operations.<br />
(v) Reclassifications:<br />
Certain prior year amounts have been reclassified to conform to the <strong>2007</strong> presentation.<br />
3. Cash equivalents and short-term investments:<br />
We generally invest cash in highly liquid debt securities that are classified as available for sale and are<br />
reflected in the balance sheet based on maturity dates. Investments in debt securities with original maturities of<br />
three months or less are considered to be cash equivalents.<br />
Cash and<br />
cash equivalents<br />
<strong>2007</strong> 2006<br />
Short-term<br />
Investments<br />
Cash and<br />
cash equivalents<br />
Short-term<br />
Investments<br />
Cash ..................................... $ 3,358,060 $ — $ 1,857,154 $ —<br />
Money market funds ......................... 14,499,745 — 10,535,007 —<br />
Certificates of deposit ........................ — — 1,513,709 —<br />
17,857,805 — 13,905,870 —<br />
Available-for sale securities:<br />
Corporate notes ......................... — 9,935,400 — 16,318,510<br />
Total ..................................... $17,857,805 $9,935,400 $13,905,870 $16,318,510<br />
F-13
4. Accounts receivable:<br />
JONES SODA CO. AND SUBSIDIARIES<br />
NOTES TO CONSOLIDATED FINANCIAL STATEMENTS—(Continued)<br />
Years Ended December 31, <strong>2007</strong> and 2006<br />
<strong>2007</strong> 2006<br />
Trade .............................................. $4,346,294 $6,579,195<br />
Other .............................................. 445,093 519,959<br />
Allowance for doubtful accounts ........................ (316,828) (184,732)<br />
$4,474,559 $6,914,422<br />
Supplementary information on the allowance for doubtful accounts:<br />
<strong>2007</strong> 2006<br />
Allowance for doubtful accounts:<br />
Beginning of year ................................... $184,732 $107,406<br />
Bad debt expense .................................... 146,538 69,693<br />
Net (recoveries) and write offs ......................... (14,442) 7,633<br />
End of year ............................................ $316,828 $184,732<br />
5. Inventory:<br />
<strong>2007</strong> 2006<br />
Finished goods ....................................... $3,797,884 $2,919,396<br />
Raw materials ....................................... 1,948,004 2,863,671<br />
$5,745,888 $5,783,067<br />
6. Capital Assets:<br />
<strong>2007</strong> 2006<br />
Vehicles .......................................... $ 418,987 $ 294,278<br />
Equipment ......................................... 1,304,086 1,303,943<br />
Office and computer equipment ........................ 1,264,293 804,427<br />
2,987,366 2,402,648<br />
Accumulated depreciation ............................ (1,908,450) (1,646,030)<br />
$ 1,078,916 $ 756,618<br />
Included in capital assets are assets under capital leases with a cost of $576,356 (2006—$586,492) and<br />
accumulated depreciation of $378,402 (2006—$274,654).<br />
F-14
7. Other Assets:<br />
JONES SODA CO. AND SUBSIDIARIES<br />
NOTES TO CONSOLIDATED FINANCIAL STATEMENTS—(Continued)<br />
Years Ended December 31, <strong>2007</strong> and 2006<br />
<strong>2007</strong> 2006<br />
Leased equipment at co-packing facilities ................. $1,731,001 $1,414,138<br />
Leased equipment at sponsorship partner facilities .......... 405,249 —<br />
2,136,250 1,414,138<br />
Accumulated depreciation .............................. (717,734) —<br />
$1,418,516 $1,414,138<br />
Included in other assets are assets under capital leases with a cost of $405,249 (2006—$0) and accumulated<br />
depreciation of $47,279 (2006—$0).<br />
8. Intangible assets:<br />
<strong>2007</strong> 2006<br />
Trademarks and patents ................................. $541,191 $ 544,791<br />
Accumulated amortization ............................... (368,151) (332,860)<br />
$ 173,040 $ 211,931<br />
During the year ended December 31, <strong>2007</strong> amortization of $35,291 (2006—$35,416, 2005—<br />
$18,762) related to intangible assets was recognized.<br />
9. Bank indebtedness:<br />
On August 21, <strong>2007</strong>, we entered into a Loan Agreement with Key Bank National Association, providing for<br />
a revolving line of credit in principal amount of up to $15 million. The new credit facility replaces the $5 million<br />
revolving line of credit with Greater Bay Business Funding, which expired by its terms on August 25, <strong>2007</strong>, with<br />
no borrowings outstanding upon the expiration of the term. The new credit facility matures on August 21, 2009.<br />
The credit facility is not subject to any borrowing base computations or limitations, but does contain certain<br />
financial covenants that the Company must meet. We must maintain a minimum Current Ratio (Current Assets to<br />
Current Liabilities, each as defined in the Loan Agreement) of 2.00 to 1.00. Also, our ratio of Total Debt to<br />
Tangible Net Worth (each as defined in the Loan Agreement) cannot exceed 1.00 to 1.00. At our election, the<br />
interest rate on the credit facility will be based on either (a) Key Bank’s prime rate minus 1.50% per annum, or<br />
(b) LIBOR plus 1.00% per annum. The credit facility is secured by a grant of a first priority security interest in<br />
all of our assets. Concurrently with the Loan Agreement, on August 21, <strong>2007</strong>, we entered into a Security<br />
Agreement in favor of Key Bank. The Loan Agreement and Security Agreement contain customary<br />
representation and warranties, affirmative and negative covenants and events of default. Upon an event of<br />
default, outstanding amounts under the credit facility accrue interest at the prime rate plus 5.00%. As of date of<br />
this <strong>Annual</strong> <strong>Report</strong>, we were in compliance with the above financial covenants and we had not borrowed any<br />
amounts under the credit facility.<br />
F-15
JONES SODA CO. AND SUBSIDIARIES<br />
NOTES TO CONSOLIDATED FINANCIAL STATEMENTS—(Continued)<br />
Years Ended December 31, <strong>2007</strong> and 2006<br />
10. Capital lease obligations:<br />
The Company’s scheduled payments, including interest ranging from 5% to 8% at December 31, <strong>2007</strong> are<br />
as follows:<br />
<strong>2007</strong> 2006<br />
<strong>2007</strong> ................................................... $ — $73,214<br />
2008 ................................................... 201,554 15,637<br />
2009 ................................................... 185,927 —<br />
2010 ................................................... 160,258 —<br />
2011 ................................................... 125,334 —<br />
2012 ................................................... 67,653 —<br />
Total minimum capital lease payments ........................ 740,726 88,851<br />
Less amount representing interest ............................ 109,653 3,051<br />
Present value of total minimum capital lease payments ........... 631,073 85,800<br />
Less current portion of capital lease obligations ................. 156,847 70,471<br />
Capital lease obligations excluding current portion .............. $474,226 $15,329<br />
11. Shareholders equity:<br />
(a) Common stock:<br />
On June 8, 2006, we completed a private placement in public equity (“PIPE”) of 3,157,895 shares of our<br />
common stock at a price of $9.50 per share, and received $28,077,350 in net proceeds after underwriting costs<br />
and expenses.<br />
(b) Stock options:<br />
In 1996, we adopted a stock option plan (the 1996 Plan) that provides for the issuance of incentive and<br />
non-qualified stock options to officers, directors, employees and consultants. In addition, in 2002 we adopted a<br />
second stock option plan for the issuance of incentive and non-qualified stock options to officers, directors,<br />
employees and consultants (the 2002 Plan). (The 1996 Plan and 2002 Plan are collectively referred to as the<br />
“Plans”). On May 18, 2006, at the annual shareholders meeting, the shareholders ratified the amendment to the<br />
2002 Plan to increase the total number of shares of common stock authorized for issuance during the life of the<br />
plan from an aggregate 3,750,000 shares to 4,500,000 shares. The 1996 Plan terminated by its terms on June 18,<br />
2006 and no additional options may be granted there under, but all outstanding options continue for their<br />
respective remaining terms. On May 31, <strong>2007</strong>, at the annual shareholders meeting, the shareholders approved the<br />
amendment to the 2002 Plan to permit awards of restricted stock grants.<br />
Under the terms of our 2002 Stock Option and Restricted Stock Plan, our Board of Directors may grant<br />
options or RSU’s to employees, officers, directors and consultants. The plan provides for granting of options or<br />
RSU’s at the fair market value of our stock at the grant date. Historically, options generally vested over a period<br />
of eighteen months, with the first 25% vesting at the date of grant and the balance vesting in equal amounts every<br />
six months thereafter. Effective during the quarter ended September 30, 2006, we changed the vesting schedule<br />
for our prospective stock option grants, to vest over a period of forty-two months, with the first 1/7th vesting six<br />
months from the grant date and the balance vesting in equal amounts every six months thereafter. We determine<br />
the term of each option at the time it is granted, historically, options granted generally have a five-year term.<br />
F-16
JONES SODA CO. AND SUBSIDIARIES<br />
NOTES TO CONSOLIDATED FINANCIAL STATEMENTS—(Continued)<br />
Years Ended December 31, <strong>2007</strong> and 2006<br />
A summary of our stock option activity is as follows:<br />
Outstanding options<br />
Number of<br />
shares<br />
Average<br />
exercise<br />
price<br />
Balance at December 31, 2004 .............................. 2,032,250 $ 1.06<br />
Option granted .......................................... 613,500 4.00<br />
Options exercised ........................................ (660,250) (1.08)<br />
Options cancelled ........................................ (203,500) (3.32)<br />
Balance at December 31, 2005 .............................. 1,782,000 1.83<br />
Option granted .......................................... 585,400 7.08<br />
Options exercised ........................................ (863,000) (1.42)<br />
Options cancelled ........................................ (80,375) (5.02)<br />
Balance at December 31, 2006 .............................. 1,424,025 4.05<br />
Option granted .......................................... 339,500 19.19<br />
Options exercised ........................................ (613,692) (2.61)<br />
Options cancelled ........................................ (77,097) (14.60)<br />
Balance at December 31, <strong>2007</strong> .............................. 1,072,736 $ 8.91<br />
Exercisable, December 31, <strong>2007</strong> ............................ 765,039 $ 5.57<br />
The following table summarizes information about stock options outstanding and exercisable under our<br />
stock incentive plans at December 31, <strong>2007</strong>:<br />
Number<br />
outstanding<br />
Weighted<br />
average<br />
remaining<br />
contractual<br />
life (years)<br />
Weighted<br />
average<br />
exercise<br />
price<br />
Number<br />
exercisable<br />
Weighted<br />
average<br />
remaining<br />
contractual<br />
life (years)<br />
Weighted<br />
average<br />
exercise<br />
price<br />
$0.25 to $0.50 ......... 80,000 0.28 $ 0.30 80,000 0.28 $ 0.30<br />
$1.10 to $2.99 ......... 97,000 1.01 2.15 97,000 1.01 2.15<br />
$3.00 to $4.00 ......... 202,500 1.95 3.98 202,500 1.95 3.98<br />
$4.01 to $5.01 ......... 4,500 2.61 5.01 4,500 2.61 5.01<br />
$5.02 to $9.33 ......... 394,983 3.44 7.27 336,929 3.25 6.98<br />
$9.34 to $22.95 ........ 293,753 4.35 19.15 44,110 4.35 19.24<br />
1,072,736 2.95 $ 8.91 765,039 2.37 $ 5.57<br />
(c)<br />
Restricted Stock awards:<br />
During the year ended December 31, <strong>2007</strong>, the Board of Directors granted 140,000 restricted shares<br />
(“RSUs”) to certain employees under our revised 2002 Stock Option and Restricted Stock Plan, which was<br />
approved by our shareholders in May <strong>2007</strong>. No monetary payment is required from the employees upon receipt<br />
of the RSUs. The RSUs vest over a period of forty-two months in equal amounts every six months.<br />
F-17
JONES SODA CO. AND SUBSIDIARIES<br />
NOTES TO CONSOLIDATED FINANCIAL STATEMENTS—(Continued)<br />
Years Ended December 31, <strong>2007</strong> and 2006<br />
A summary of our RSU activity is as follows:<br />
Restricted<br />
Shares<br />
Weighted-<br />
Grant Date<br />
Fair Value<br />
Non-vested RSUs at December 31, 2006 ............................. — —<br />
Granted ....................................................... 140,000 $ 10.12<br />
Vested ........................................................ — —<br />
Cancelled ...................................................... (10,500) (10.18)<br />
Weighted-<br />
Average<br />
Contractual<br />
Life<br />
Non-vested RSUs at December 31, <strong>2007</strong> ............................. 129,500 $ 10.12 3.28 yrs<br />
(d) Stock-based compensation expense:<br />
We account for stock-based compensation in accordance with FASB Statement No. 123(R), “Share-Based<br />
Payment” (“FAS 123R”), using the fair-value based method. Stock-based compensation expense is recognized<br />
using the straight-line attribution method over the employees’ requisite service period.<br />
The following table summarizes the stock-based compensation expense by type of awards:<br />
December 31,<br />
<strong>2007</strong><br />
December 31,<br />
2006<br />
Stock options ....................................... $1,369,223 $1,057,127<br />
RSUs ............................................. 149,582 —<br />
$1,518,805 $1,057,127<br />
We employ the following key weighted average assumptions in determining the fair value of stock options,<br />
using the Black-Scholes option pricing model:<br />
Twelve months ended December 31,<br />
<strong>2007</strong> 2006 2005<br />
Expected dividend yield ............................. — — —<br />
Expected stock price volatility ........................ 55.9% 55.5% 80.0%<br />
Risk-free interest rate ............................... 4.38% 4.82% 3.26%<br />
Expected term (in years) ............................ 4.4years 2.75 years 1.5 years<br />
Weighted-average grant date fair-value ................. $ 8.58 $ 2.82 $ 1.86<br />
During the year ended December 31, <strong>2007</strong>, no modifications were made to outstanding stock options, and<br />
there were no stock-based compensation costs capitalized as part of the cost of any asset.<br />
The aggregate intrinsic value of stock options outstanding at December 31, <strong>2007</strong> was $2,061,000 (2006—<br />
$11,747,000) and for options exercisable was $2,061,000 (2006—$10,188,000). The intrinsic value of<br />
outstanding and exercisable stock options is calculated as the quoted market price of the stock at the balance<br />
sheet date less the exercise price of the option. The total intrinsic value of options exercised during the year<br />
ended December 31, <strong>2007</strong> was $8,713,290 (2006—$4,967,000).<br />
RSUs are valued at the grant date market price of the underlying securities, and the compensation expense is<br />
recognized on a straight-line basis over the forty-two months vesting period based on the estimated number of<br />
awards expected to vest. At December 31, <strong>2007</strong> the RSUs had an intrinsic value of nil.<br />
F-18
JONES SODA CO. AND SUBSIDIARIES<br />
NOTES TO CONSOLIDATED FINANCIAL STATEMENTS—(Continued)<br />
Years Ended December 31, <strong>2007</strong> and 2006<br />
SFAS 123R also requires that we recognize compensation expense for only the portion of stock options or<br />
RSUs that are expected to vest. Therefore, we apply estimated forfeiture rates that are derived from historical<br />
employee termination behavior. If the actual number of forfeitures differs from those estimated by management,<br />
additional adjustments to stock-based compensation expense may be required in future periods.<br />
At December 31, <strong>2007</strong>, the unrecognized compensation expense related to stock options and non-vested<br />
restricted stocks were $2,458,000 and $1,112,000, respectively, which are to be recognized over weightedaverage<br />
periods of 2.61 years and 3.28 years, respectively.<br />
12. Commitments and contingencies:<br />
Commitments<br />
During the year ended December 31, <strong>2007</strong> we had commitments to various suppliers of raw materials and<br />
finished goods, to co-packers for production equipment and commitments under our Sponsorship Agreements<br />
with the Seattle Seahawks and the New Jersey Nets in exchange for exclusive beverage rights for certain soft<br />
drinks at Qwest Field and the proposed new arena in Brooklyn, New York, as well as signage, advertising and<br />
other promotional benefits to enhance our brand awareness. These obligations vary in terms. Purchase<br />
obligations in future periods under these commitments are expected to occur as follows:<br />
2013 and<br />
Total 2008 2009-2010 2011-2012 thereafter<br />
Purchase Obligations ................. $22,921,000 $4,671,000 $11,959,000 $4,227,000 $2,064,000<br />
The Company has lease commitments for its executive and administrative offices and warehouse premises<br />
expiring on August 31, 2011. Future minimum rent payments under this lease are:<br />
2008 ............................................................ $190,988<br />
2009 ............................................................ 166,755<br />
2010 ............................................................ 172,856<br />
2011 ............................................................ 117,949<br />
Total ............................................................ $648,548<br />
During the year ended December 31, <strong>2007</strong>, the Company incurred rental expenses of $185,173 (2006—<br />
$113,421, 2005—$95,670).<br />
Legal proceedings<br />
Federal Securities Class Action<br />
On September 4, <strong>2007</strong>, a putative class action complaint was filed against us, our former CEO, Peter van<br />
Stolk, and our CFO in the U.S. District Court for the Western District of Washington, alleging claims under<br />
Section 10(b) and 20(a) of the Securities Exchange Act of 1934, as amended, and Rule 10b-5 promulgated there<br />
under. The case is entitled Saltzman v. <strong>Jones</strong> <strong>Soda</strong> Company, et al., Case No. 07-cv-1366-RSL, and purports to<br />
be brought on behalf of a class of purchasers of our common stock during the period from March 9, <strong>2007</strong> to<br />
August 2, <strong>2007</strong>. Six substantially similar complaints subsequently were filed in the same court, some of which<br />
allege claims on behalf of a class of purchasers of our common stock during the period November 1, 2006 to<br />
F-19
JONES SODA CO. AND SUBSIDIARIES<br />
NOTES TO CONSOLIDATED FINANCIAL STATEMENTS—(Continued)<br />
Years Ended December 31, <strong>2007</strong> and 2006<br />
August 2, <strong>2007</strong>. Some of the subsequently filed complaints added as defendants certain directors and another<br />
officer. The complaints generally allege violations of federal securities laws based on, among other things, false<br />
and misleading statements and omissions about our financial results and business prospects. The complaints seek<br />
unspecified damages, interest, attorneys’ fees, costs, and expenses. All seven lawsuits have been consolidated<br />
into one action, captioned In re <strong>Jones</strong> <strong>Soda</strong> Company Securities Litigation, Case No. 07-cv-1366-RSL. On<br />
March 5, 2008, the Court appointed a lead plaintiff and approved his selection of lead counsel. No consolidated<br />
complaint has yet been filed.<br />
Shareholder Derivative Litigation<br />
On September 5, <strong>2007</strong>, a shareholder derivative action was filed in the Superior Court for King County,<br />
Washington, allegedly on behalf of and for the benefit of the Company, against certain of our current and former<br />
officers and current directors. The case is entitled Cramer v. van Stolk, et al., Case No. 07-2-29187-3 SEA. The<br />
Company also was named as a nominal defendant. Four other shareholders filed substantially similar derivative<br />
cases. Two of these actions were filed in Superior Court for King County, Washington. One of these two actions<br />
has been consolidated with the Cramer Action. The shareholder who brought the unconsolidated state-court<br />
action voluntarily moved to have her suit dismissed on January 30, 2008, and on February 12, 2008 the Court<br />
dismissed that action. The two remaining shareholder derivative actions were filed in the U.S. District Court for<br />
the District of Washington. One of the shareholders in the two federal actions has moved to consolidate the<br />
federal derivative actions. The Court has not ruled on the motion to consolidate. All of the derivative complaints<br />
are based on the same allegations of fact as in the securities class actions filed in the U.S. District Court for the<br />
Western District of Washington and allege, among other things, that certain of our directors and officers<br />
breached their fiduciary duties and were unjustly enriched in connection with the public disclosures that are the<br />
subject of the federal securities class actions. The complaints seek unspecified damages, restitution,<br />
disgorgement of profits, equitable and injunctive relief, attorneys’ fees, costs, and expenses. The complaints are<br />
derivative in nature and do not seek monetary damages from us. However, we may be required, throughout the<br />
pendency of the action, to advance payment of legal fees and costs incurred by the defendants.<br />
We are unable to predict the outcome of these actions. These actions could result in significant liability and<br />
could have a material adverse effect on our business, results of operations, or financial condition, subject to the<br />
limits of our insurance policies.<br />
We are involved in various claims and legal actions arising in the ordinary course of business, including<br />
proceedings involving product liability claims and other employee claims, and tort and other general liability<br />
claims, for which we carry insurance, as well as trademark, copyright, and related claims and legal actions. In the<br />
opinion of our management, the ultimate disposition of these matters will not have a material adverse effect on<br />
our consolidated financial position, results of operations or liquidity.<br />
Other Contingencies<br />
We have an employment agreement with one of our executive officers. The agreement continues until<br />
terminated by the executive or by us, and provides for severance payments under certain circumstances. As of<br />
December 31, <strong>2007</strong>, if the executive was to be terminated by us without cause (as defined) or upon a change of<br />
control (as defined), our severance liability, including salary continuation, continuation of health care and<br />
insurance benefits, would have been approximately $229,000.<br />
We are party to many agreements executed in the ordinary course of business that provide for<br />
indemnification of third parties, under specified circumstances, such as lessors of real property leased by the<br />
F-20
JONES SODA CO. AND SUBSIDIARIES<br />
NOTES TO CONSOLIDATED FINANCIAL STATEMENTS—(Continued)<br />
Years Ended December 31, <strong>2007</strong> and 2006<br />
Company, distributors, suppliers, co-packers, customers, service providers for various types of services<br />
(including commercial banking, investments and other services), software licensors, marketing and advertising<br />
firms, and others. Generally, these agreements obligate the Company to indemnify the third parties only if certain<br />
events occur or claims are made, as these contingent events or claims are defined in each of these agreements.<br />
The Company believes that the resolution of any claims that might arise in the future, either individually or in the<br />
aggregate, would not materially affect the earnings or financial condition of the Company.<br />
13. Income taxes:<br />
The (recovery) provision for income taxes consisted of the following:<br />
<strong>2007</strong> 2006 2005<br />
Current<br />
Federal ............................... $ (3,164) $ — $10,532<br />
State ................................. (1,170) 5,591 40,000<br />
Foreign .............................. 297,450 236,150 —<br />
Total ............................ 293,116 241,741 50,532<br />
Deferred ......................... 1,862,111 (1,144,491) —<br />
Provision for income taxes ................... $2,155,227 $ (902,750) $50,532<br />
Income (loss) before provision for income taxes was as follows:<br />
United States .......................... $(10,688,147) $2,704,673 $ 766,811<br />
Foreign ............................... 1,043,103 827,722 535,241<br />
Total ............................. $ (9,645,044) $3,532,395 $1,302,052<br />
The items accounting for the difference between income taxes computed at the federal statutory rate and the<br />
provision for income taxes are as follows:<br />
<strong>2007</strong> 2006 2005<br />
Federal statutory rate .......................................... 34% 34% 34%<br />
Effect of:<br />
Permanent differences ..................................... (0.71)% 6.28% 2.4%<br />
State income taxes, net of federal benefit ...................... 1.22% 0.29% 3.1%<br />
Alternative minimum tax ................................... 0.00% 0.00% 0.8%<br />
Change in valuation allowance .............................. (56.85)% (69.97)% (44.1)%<br />
Other, net ............................................... (0.01)% 3.85% 7.7%<br />
Provision (recovery) for income taxes ............................. (22.35)% (25.56)% 3.9%<br />
F-21
JONES SODA CO. AND SUBSIDIARIES<br />
NOTES TO CONSOLIDATED FINANCIAL STATEMENTS—(Continued)<br />
Years Ended December 31, <strong>2007</strong> and 2006<br />
Deferred income taxes reflect the tax effects of temporary differences between the carrying amounts of<br />
assets and liabilities for financial reporting purposes and the amounts used for income tax purposes. Significant<br />
components of the Company’s deferred income taxes were as follows:<br />
<strong>2007</strong> 2006 2005<br />
Deferred tax assets<br />
Net operating loss carry forwards ............... $4,172,094 $1,401,117 $ 1,731,023<br />
Capital assets .............................. 188,403 — 82,258<br />
Intangible assets ............................ 333,167 384,657 420,753<br />
Other ..................................... 906,971 198,185 120,971<br />
Total deferred tax asset ......................... 5,600,635 1,983,959 2,355,005<br />
Valuation allowance ......................... (5,482,785) — (2,355,005)<br />
Net deferred tax asset ........................ $ 117,850 $1,983,959 $ —<br />
Deferred tax liabilities<br />
Capital assets .............................. — (48,821) —<br />
Total deferred tax asset balance .................... $ 117,850 $1,935,138 $ —<br />
Classified as current ............................. — 1,507,145 —<br />
Long-term asset ................................ $ 117,850 $ 427,993 $ —<br />
We account for income taxes in accordance with SFAS 109, “Accounting for Income Taxes,” which<br />
requires the recognition of deferred tax assets and liabilities for the expected future tax consequences of events<br />
that have been included in the financial statements which differ from our tax returns.<br />
The determination of our provision of income taxes and valuation allowances requires significant judgment,<br />
the use of estimates, and the interpretation and application of complex tax laws. To the extent management<br />
believes it is more likely than not that we will not be able to utilize some or all of our deferred tax assets prior to<br />
their expiration, we are required to establish valuation allowances against that portion of deferred tax assets.<br />
Prior to the second quarter of 2006, we maintained a valuation allowance for all of the U.S. and foreign<br />
deferred taxes in accordance with Statement of Financial Accounting Standards 109 (“SFAS 109,” “Accounting<br />
for Income Taxes”) due to the uncertainty regarding the full utilization of our deferred tax asset. During the<br />
second quarter of 2006, we re-evaluated our valuation allowance after recording taxable income for two<br />
successive years and we determined that was more likely than not we would realize the deferred tax assets.<br />
Accordingly, during the year ended December 31, 2006, we recorded a tax benefit in the amount of $2,471,790<br />
by reversing the valuation allowance and recording the tax benefit against the 2006 tax provision resulting in a<br />
net deferred income tax benefit of $1,144,491.<br />
During the fourth quarter of fiscal <strong>2007</strong>, we recognized a full valuation allowance against our net U.S.<br />
deferred tax assets in the amount of approximately $5,482,785. During the fourth quarter of fiscal <strong>2007</strong>, the<br />
Company experienced significant losses in its U.S. operations due to lower margins, the recording of charges<br />
such as severance costs, marketing and promotions costs, slotting fee costs, inventory provisions for discontinued<br />
product and legal and professional fees which negatively impacted U.S. pretax income and caused the Company<br />
to be in a loss position as of December 31, <strong>2007</strong> and of having cumulative losses in recent years with respect to<br />
its U.S. operations. These are one time costs that the Company does not expect to incur in future years. However,<br />
the Company does not know if these investments are an aberration yet and the success of our incremental<br />
F-22
JONES SODA CO. AND SUBSIDIARIES<br />
NOTES TO CONSOLIDATED FINANCIAL STATEMENTS—(Continued)<br />
Years Ended December 31, <strong>2007</strong> and 2006<br />
investments in the business remains unknown. In accordance with the relevant accounting guidance, the<br />
Company did consider future projections of U.S. pretax income as a material factor in its analysis of the<br />
realizability of its net U.S. deferred tax assets, however, it was difficult to overcome the cumulative loss. The<br />
negative events mentioned above, while not recurring in nature and/or beneficial to the Company’s long-term<br />
future prospects, were material to the Company’s decision to establish a full valuation allowance against its net<br />
U.S. deferred tax assets. This is due to the fact that the relevant accounting guidance puts more weight on the<br />
negative objective evidence of cumulative losses in recent years than the positive subjective evidence of future<br />
projections of pretax income. The Company continually analyzes the realizability of its deferred tax assets, but<br />
reasonably expects to continue to record a full valuation allowance on future U.S. tax benefits until the Company<br />
sustains an appropriate level of taxable income through improved U.S. operations and tax planning strategies.<br />
No valuation allowance was recorded for deferred tax assets recorded in the Canadian subsidiary, as this<br />
subsidiary remains profitable.<br />
At December 31, <strong>2007</strong>, the Company has net operating loss carry-forwards in the United States for income<br />
tax purposes of $11,935,000, which expire at various times commencing in 2020. Net operating loss carryforwards<br />
may be subject to certain limitations under Section 382 of the Internal Revenue Code.<br />
14. Staff Accounting Bulletin No. 108<br />
In September 2006, the SEC issued Staff Accounting Bulletin No. 108, “Considering the Effects of Prior<br />
Year Misstatements when Quantifying Misstatements in Current Year Financial Statements” (SAB 108), to<br />
address diversity in practice in quantifying financial statement misstatements. SAB 108 requires the<br />
quantification of misstatements based on their impact to both the balance sheet and the income statement to<br />
determine materiality. SAB 108 is effective the fiscal year ending December 31, 2006.<br />
The transition provisions of SAB 108 provide for a one-time cumulative effect adjustment on deficit to<br />
correct for misstatements of errors relating to prior periods that were not deemed material under the Company’s<br />
prior approach, but are material under the SAB 108 approach. Effective the beginning of the fiscal year ended<br />
December 31, 2006, the Company adopted SAB 108. In accordance with SAB 108 during 2006, the Company<br />
has adjusted opening deficit for fiscal 2006 in the accompanying consolidated financial statements for the items<br />
described below. The Company considers these adjustments to be immaterial to prior periods.<br />
Intercompany balances<br />
During 2006, the Company adjusted its beginning retained earnings for fiscal 2006 for a historical<br />
misstatement in intercompany balances of intangible transfers and accounts receivable balances. These<br />
differences had accumulated over a period of several years and were not material in any one year.<br />
Impact of adjustments<br />
The impact of each of the items noted above on the fiscal 2006 beginning balances are presented below:<br />
Reduction of intangibles ............................................. $ 70,979<br />
Reduction of receivable balances ...................................... 36,756<br />
Increase in deficit .................................................. $107,735<br />
F-23
JONES SODA CO. AND SUBSIDIARIES<br />
NOTES TO CONSOLIDATED FINANCIAL STATEMENTS—(Continued)<br />
Years Ended December 31, <strong>2007</strong> and 2006<br />
15. Segmented information and export sales:<br />
The Company operates in one industry segment, with operations during <strong>2007</strong> primarily in the United States<br />
and Canada. During the year ended December 31, <strong>2007</strong>, sales in the United States were approximately<br />
$33,949,000 (2006—$34,209,000, 2005—$29,620,000), sales in Canada were approximately $5,393,000<br />
(2006—$4,662,000, 2005—$3,788,000), and sales to other countries totaled $489,000 (2006—$165,000, 2005—<br />
$103,000). Sales have been assigned to geographic locations based on the location of customers.<br />
As at December 31, <strong>2007</strong>, the net book value of long-lived assets held in the United States was<br />
approximately $2,471,000 (2006—$2,111,000, 2005—$604,000). The net book value of long-lived assets held in<br />
Canada was approximately $26,000 (2006—$59,000, 2005—$59,000).<br />
16. Financial instruments:<br />
(a) Fair values:<br />
As of December 31, <strong>2007</strong>, the carrying amounts reported in the consolidated balance sheets for cash and<br />
cash equivalents, accounts receivable, line of credit, accounts payable and accrued liabilities and capital lease<br />
obligations, approximate their fair values due to the short-term to maturity of these instruments.<br />
(b) Concentration of credit risk:<br />
The Company mainly sells its products to customers in the United States and Canada. Customers in the<br />
United States represent 83% (2006—95%, 2005—92%) while customers in Canada represent 17% (2006—5%,<br />
2005—8%) of year end accounts receivable balances. Three of the Company’s customers represent<br />
approximately 29% of revenues for the year ended December 31, <strong>2007</strong>, one of which represented revenue of<br />
approximately 13% during the period. Three customers represented approximately 28% of revenues for the year<br />
ended December 31, 2006. Three customers represented approximately 21% of revenues for the year ended<br />
December 31, 2005.<br />
17. Selected Quarterly Financial Information (unaudited)<br />
Summarized quarterly financial information for fiscal years <strong>2007</strong> and 2006 is as follows (dollars in<br />
thousands, except per share data):<br />
Q1 Q2 Q3 Q4<br />
<strong>2007</strong> quarter:<br />
Net Revenue ........................................... $9,189 $13,012 $11,732 $ 5,898<br />
Gross profit ........................................... 3,517 4,449 3,196 (1,718)<br />
Net earnings (loss) ...................................... 58 41 (1,524) (10,204)<br />
Basic earnings (loss) per share ............................. 0.00 0.00 (0.06) (0.39)<br />
Diluted earnings (loss) per share ........................... 0.00 0.00 (0.06) (0.39)<br />
Q1 Q2 Q3 Q4<br />
2006 quarter:<br />
Net Revenue ........................................... $8,760 $10,026 $10,202 $ 10,047<br />
Gross profit ........................................... 3,120 3,806 3,617 4,762<br />
Net earnings ........................................... 3 2,314 194 2,063<br />
Basic earnings per share .................................. 0.00 0.10 0.01 0.08<br />
Diluted earnings per share ................................ 0.00 0.10 0.01 0.08<br />
F-24
This annual report contains information about future expectations, plans and prospects of the company<br />
which constitute forward-looking statements for purposes of the safe harbor provisions under the Private<br />
Securities Litigation Reform Act of 1995. Forward-looking statements include, for example, such words as<br />
“aims,” “anticipates,” “estimates,” “expects,” “believes,” “intends,” “plans,” “predicts,” “projects” or<br />
“targets,” the negatives of these words, or similar words or expressions. Forward-looking statements are<br />
subject to certain risks and uncertainties that could cause actual results to differ materially from those<br />
indicated by the forward-looking statements. Some of these risks and uncertainties are described in this<br />
report and in the other documents we file publicly with the Securities and Exchange Commission. Readers<br />
are cautioned not to place undue reliance upon these forward-looking statements that speak only as to the<br />
date of this annual report. Except as required by law, we do not assume any obligation to update the<br />
forward-looking statements we make herein.
Investor Facts<br />
<strong>Jones</strong> <strong>Soda</strong> Co.<br />
234 Ninth Ave N<br />
Seattle, Washington<br />
USA, 98109<br />
tel 800 656 6050<br />
206 624 3357<br />
fax 206 624 6857<br />
www.jonessoda.com<br />
Corporate Information:<br />
<strong>Jones</strong> <strong>Soda</strong> Co.<br />
Legal Counsel:<br />
US – Perkins Coie LLP<br />
Canada – Boughton Law<br />
Corporation<br />
Auditors:<br />
KPMG LLP<br />
Transfer Agent:<br />
Computershare Trust Company, N.A.<br />
800 962 4284<br />
Stock Exchange Listing:<br />
NASDAQ: JSDA TSX-V: JSD