ADVANCE MONTHLY SALES FOR RETAIL AND FOOD SERVICES ...
ADVANCE MONTHLY SALES FOR RETAIL AND FOOD SERVICES ...
ADVANCE MONTHLY SALES FOR RETAIL AND FOOD SERVICES ...
Create successful ePaper yourself
Turn your PDF publications into a flip-book with our unique Google optimized e-Paper software.
<strong>FOR</strong> IMMEDIATE RELEASE<br />
THURSDAY, JULY 14, 2011, AT 8:30 A.M. EDT<br />
Timothy Winters / Ian Thomas<br />
Service Sector Statistics Division<br />
(301) 763-2713<br />
CB11-121<br />
<strong>ADVANCE</strong> <strong>MONTHLY</strong> <strong>SALES</strong> <strong>FOR</strong> <strong>RETAIL</strong> <strong>AND</strong> <strong>FOOD</strong> <strong>SERVICES</strong><br />
JUNE 2011<br />
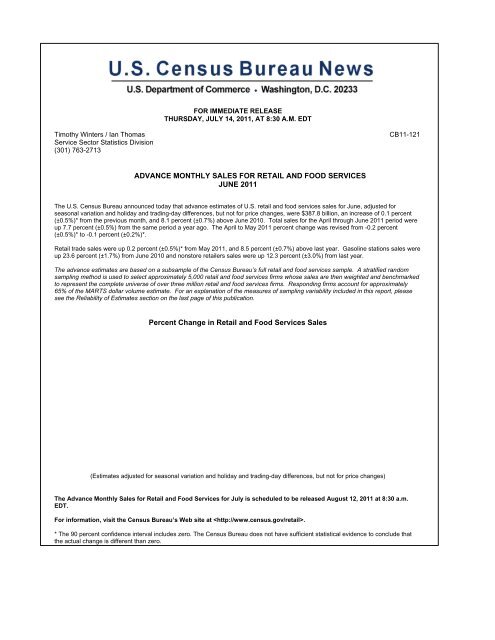
The U.S. Census Bureau announced today that advance estimates of U.S. retail and food services sales for June, adjusted for<br />
seasonal variation and holiday and trading-day differences, but not for price changes, were $387.8 billion, an increase of 0.1 percent<br />
(±0.5%)* from the previous month, and 8.1 percent (±0.7%) above June 2010. Total sales for the April through June 2011 period were<br />
up 7.7 percent (±0.5%) from the same period a year ago. The April to May 2011 percent change was revised from -0.2 percent<br />
(±0.5%)* to -0.1 percent (±0.2%)*.<br />
Retail trade sales were up 0.2 percent (±0.5%)* from May 2011, and 8.5 percent (±0.7%) above last year. Gasoline stations sales were<br />
up 23.6 percent (±1.7%) from June 2010 and nonstore retailers sales were up 12.3 percent (±3.0%) from last year.<br />
The advance estimates are based on a subsample of the Census Bureau’s full retail and food services sample. A stratified random<br />
sampling method is used to select approximately 5,000 retail and food services firms whose sales are then weighted and benchmarked<br />
to represent the complete universe of over three million retail and food services firms. Responding firms account for approximately<br />
65% of the MARTS dollar volume estimate. For an explanation of the measures of sampling variability included in this report, please<br />
see the Reliability of Estimates section on the last page of this publication.<br />
Percent Change in Retail and Food Services Sales<br />
(Estimates adjusted for seasonal variation and holiday and trading-day differences, but not for price changes)<br />
The Advance Monthly Sales for Retail and Food Services for July is scheduled to be released August 12, 2011 at 8:30 a.m.<br />
EDT.<br />
For information, visit the Census Bureau’s Web site at .<br />
* The 90 percent confidence interval includes zero. The Census Bureau does not have sufficient statistical evidence to conclude that<br />
the actual change is different than zero.
Table 1. Estimated Monthly Sales for Retail and Food Services, by Kind of Business<br />
(Total sales estimates are shown in millions of dollars and are based on data from the Advance Monthly Retail Trade Survey, Monthly Retail<br />
Trade Survey, and administrative records.)<br />
Not Adjusted Adjusted 2<br />
NAICS 1<br />
6 Month Total 2011 2010<br />
2011 2010<br />
Kind of Business<br />
code % Chg. Jun. 3 May Apr. Jun. May Jun. 3 May Apr. Jun. May<br />
2011 2010 (a) (p) (r) (a) (p) (r) (r) (r)<br />
Retail & food services,<br />
total ………………………………. 2,266,457 8.1 395,410 400,940 389,209 364,774 371,518 387,789 387,255 387,705 358,864 359,262<br />
Total (excl. motor vehicle & parts) … 1,858,088 7.2 324,695 331,035 318,845 299,938 306,142 321,266 321,238 320,500 297,760 297,419<br />
Retail …..…………………………… 2,025,207 8.5 354,229 358,221 347,689 325,401 330,726 347,217 346,531 347,316 320,111 320,633<br />
GAFO 4 (*) (*) (*) 95,168 93,134 89,565 92,760 (*) 97,067 97,313 93,927 93,702<br />
441 Motor vehicle & parts dealers ……. 408,369 12.1 70,715 69,905 70,364 64,836 65,376 66,523 66,017 67,205 61,104 61,843<br />
4411, 4412 Auto & other motor veh. dealers . 369,184 12.9 63,479 63,136 63,762 57,973 58,971 59,829 59,394 60,610 54,743 55,476<br />
44111 New car dealers ………………. (*) (*) (*) 51,422 51,946 46,572 48,052 (NA) (NA) (NA) (NA) (NA)<br />
4413 Auto parts, acc. & tire stores…… (*) (*) (*) 6,769 6,602 6,863 6,405 (NA) (NA) (NA) (NA) (NA)<br />
442 Furniture & home furn. stores …… 42,252 0.4 7,179 7,274 7,054 7,168 7,194 7,348 7,407 7,441 7,314 7,348<br />
4421 Furniture stores ………………….. (*) (*) (*) 3,928 3,952 3,835 4,057 (NA) (NA) (NA) (NA) (NA)<br />
4422 Home furnishings stores ……….. (*) (*) (*) 3,346 3,102 3,333 3,137 (NA) (NA) (NA) (NA) (NA)<br />
443 Electronics & appliance stores …… 46,479 -0.2 7,822 7,555 7,337 8,007 7,704 8,277 8,290 8,439 8,478 8,420<br />
44311, 13 Appl., T.V. & camera……………… (*) (*) (*) 5,889 5,683 6,274 6,090 (*) 6,429 6,555 6,632 6,598<br />
44312 Computer & software stores……. (*) (*) (*) 1,666 1,654 1,733 1,614 (*) 1,861 1,884 1,846 1,822<br />
444 Building material & garden eq. &<br />
supplies dealers……………………. 149,204 5.3 30,296 31,522 27,600 27,911 28,815 25,140 24,806 24,676 23,330 23,498<br />
4441 Building mat. & sup. dealers …… (*) (*) (*) 23,546 20,968 22,411 22,552 (*) 19,954 19,856 19,353 19,679<br />
445 Food & beverage stores……………. 299,605 5.1 51,447 52,082 51,084 47,999 49,833 51,263 51,118 51,178 48,156 48,293<br />
4451 Grocery stores ………………….. 270,188 5.4 46,168 46,776 45,874 42,924 44,638 45,984 45,859 45,920 43,053 43,212<br />
4453 Beer, wine & liquor stores ……… (*) (*) (*) 3,602 3,503 3,484 3,511 (*) 3,627 3,615 3,494 3,473<br />
446 Health & personal care stores ……. 135,734 5.4 22,554 22,967 22,456 21,711 21,551 22,805 22,853 22,592 21,908 21,573<br />
44611 Pharmacies & drug stores ……… (*) (*) (*) 19,280 18,756 18,400 18,333 (*) 19,165 18,850 18,605 18,333<br />
447 Gasoline stations …………………… 261,102 18.6 47,633 48,163 45,896 38,561 39,453 44,517 45,096 44,864 36,005 36,803<br />
448 Clothing & clothing accessories<br />
stores …………………………….….. 102,012 5.5 17,418 18,586 18,454 16,194 17,787 18,841 18,705 18,707 17,696 17,709<br />
44811 Men's clothing stores …………… (*) (*) (*) 730 744 636 666 (*) (S) (S) (S) (S)<br />
44812 Women's clothing stores ……….. (*) (*) (*) 3,304 3,368 2,967 3,252 (*) 3,135 3,113 3,037 3,048<br />
44814 Family clothing stores …………… (*) (*) (*) 7,037 7,140 6,430 6,978 (NA) (NA) (NA) (NA) (NA)<br />
4482 Shoe stores ……………………… (*) (*) (*) 2,180 2,288 1,973 2,159 (*) 2,247 2,217 2,187 2,181<br />
451 Sporting goods, hobby, book &<br />
music stores………………………… 39,735 5.1 6,807 6,655 6,731 6,710 6,334 7,296 7,345 7,372 7,063 6,968<br />
452 General merchandise stores………. 295,494 3.1 51,260 52,164 50,883 48,796 50,997 52,492 52,290 52,361 50,458 50,336<br />
4521 Department stores (ex. L.D.)…….. 82,992 -1.0 14,884 14,568 14,529 14,410 15,062 15,614 15,404 15,509 15,486 15,477<br />
4521 Department stores (incl. L.D.) 5 …… (*) (*) (*) 14,833 14,805 14,596 15,271 (*) (NA) (NA) (NA) (NA)<br />
4529 Other general merch. stores…. .. (*) (*) (*) 37,596 36,354 34,386 35,935 (*) 36,886 36,852 34,972 34,859<br />
45291 Warehouse clubs &<br />
supercenters…………………. (*) (*) (*) 32,997 31,802 30,050 31,487 (*) 32,350 32,286 30,570 30,481<br />
45299 All oth. gen. merch. stores…… (*) (*) (*) 4,599 4,552 4,336 4,448 (*) 4,536 4,566 4,402 4,378<br />
453 Miscellaneous store retailers …….. 57,083 7.9 10,497 10,503 9,544 9,986 9,685 9,919 9,912 9,923 9,383 9,300<br />
454 Nonstore retailers ………………….. 188,138 14.2 30,601 30,845 30,286 27,522 25,997 32,796 32,692 32,558 29,216 28,542<br />
4541 Elect. shopping & m/o houses …. (*) (*) (*) 24,013 23,017 21,529 20,294 (*) 24,962 24,723 22,449 21,892<br />
722 Food services & drinking places … 241,250 4.8 41,181 42,719 41,520 39,373 40,792 40,572 40,724 40,389 38,753 38,629<br />
(*) Advance estimates are not available for this kind of business.<br />
(NA) Not available (S) Suppressed (a) Advance estimate (p) Preliminary estimate (r) Revised estimate<br />
(1) For a full description of the NAICS codes used in this table, see http://www.census.gov/eos/www/naics<br />
(2) Estimates are concurrently adjusted for seasonal variation and for holiday and trading day differences, but not for price changes. Concurrent seasonal adjustment<br />
uses all available unadjusted estimates as input to the X-12 ARIMA program. The factors derived from the program are used in calculating all seasonally<br />
adjusted estimates shown in this table. Year-to-date seasonally adjusted sales estimates are not tabulated. Adjustment factors and explanatory material can be found<br />
on the Internet at http://www.census.gov/retail<br />
(3) Advance estimates are based on early reports obtained from a small sample of firms selected from the larger Monthly Retail Trade Survey (MRTS) sample.<br />
All other estimates are from the MRTS sample.<br />
(4) GAFO represents firms which specialize in department store types of merchandise and is comprised of furniture & home furnishings (442), electronics & appliances (443),<br />
clothing & accessories (448), sporting goods, hobby, book, and music (451), general merchandise (452), office supply, stationery, and gift stores (4532).<br />
(5) Estimates include data for leased departments operated within department stores. Data for this line are not included in broader kind-of-business totals.<br />
Note: Table 3 provides estimated measures of sampling variability. Additional information on confidentiality protection, sampling error, nonsampling error,<br />
sample design, and definitions may be found at http://www.census.gov/retail
Table 2. Estimated Change in Monthly Sales for Retail and Food Services, by Kind of Business<br />
(Estimates are shown as percents and are based on data from the Advance Monthly Retail Trade Survey,<br />
Monthly Retail Trade Survey, and administrative records.)<br />
Percent Change 1<br />
Apr. 2011<br />
Jun. 2011 Advance May 2011 Preliminary through<br />
NAICS Kind of Business<br />
from -- from -- Jun. 2011 from --<br />
code Jan. 2011 Apr. 2010<br />
May 2011 Jun. 2010 Apr. 2011 May 2011 through through<br />
(p) (r) (r) (r) Mar. 2011 Jun. 2010<br />
Retail & food services,<br />
total ……………………………….. 0.1 8.1 -0.1 7.8 1.1 7.7<br />
Total (excl. motor vehicle & parts) …. 0.0 7.9 0.2 8.0 1.7 7.5<br />
Retail ………………………..………. 0.2 8.5 -0.2 8.1 1.1 8.0<br />
441 Motor vehicle & parts dealers ……… 0.8 8.9 -1.8 6.7 -1.9 8.4<br />
4411, 4412 Auto & other motor veh. dealers … 0.7 9.3 -2.0 7.1 -2.2 8.9<br />
442 Furniture & home furn. stores ……… -0.8 0.5 -0.5 0.8 0.1 0.7<br />
443 Electronics & appliance stores ……. -0.2 -2.4 -1.8 -1.5 -1.0 -0.7<br />
444 Building material & garden eq. &<br />
supplies dealers……………………… 1.3 7.8 0.5 5.6 2.8 3.1<br />
445 Food & beverage stores……………… 0.3 6.5 -0.1 5.8 1.7 6.1<br />
4451 Grocery stores ……………………. 0.3 6.8 -0.1 6.1 1.9 6.5<br />
446 Health & personal care stores ……… -0.2 4.1 1.2 5.9 0.0 4.5<br />
447 Gasoline stations …………………….. -1.3 23.6 0.5 22.5 4.4 21.8<br />
448 Clothing & clothing accessories<br />
stores ……………………….………… 0.7 6.5 0.0 5.6 1.7 5.8<br />
451 Sporting goods, hobby, book &<br />
music stores…………………………. -0.7 3.3 -0.4 5.4 0.7 5.0<br />
452 General merchandise stores………… 0.4 4.0 -0.1 3.9 1.2 3.7<br />
4521 Department stores (ex. L.D.)………. 1.4 0.8 -0.7 -0.5 0.7 0.0<br />
453 Miscellaneous store retailers ……… 0.1 5.7 -0.1 6.6 1.7 7.0<br />
454 Nonstore retailers ……………………. 0.3 12.3 0.4 14.5 1.9 13.9<br />
722 Food services & drinking places ….. -0.4 4.7 0.8 5.4 0.8 4.8<br />
(p) Preliminary estimate (r) Revised estimate<br />
(1) Estimates shown in this table are derived from adjusted estimates provided in Table 1 of this report.<br />
Note: Table 3 provides estimated measures of sampling variability. Additional information on confidentiality protection, sampling error, nonsampling error,<br />
sample design, and definitions may be found at http://www.census.gov/retail.<br />
Source: U.S. Census Bureau
Table 3. Estimated Measures of Sampling Variability and Revision to Advance Estimates Jun 2011<br />
(Estimates are shown as percents and are based on data from the Advance Monthly Retail Trade Survey and Monthly Retail Trade Survey)<br />
Median standard error (1) for<br />
Revision for month-<br />
Percent change to-month change (2)<br />
Median<br />
NAICS Code Kind of Business<br />
(1)<br />
CV for Previous Mo. Previous Qtr. Current Mo. Median<br />
Current Mo. to to to same Average absolute<br />
(%) Current Mo. Current Qtr. Mo. Last Yr. revision revision<br />
Retail & food services,<br />
total ………………..…………………. 0.7 0.3 0.2 0.4 0.1 0.1<br />
Total (excl. motor vehicle & parts) .. 0.7 0.3 0.2 0.4 0.1 0.2<br />
Retail …..………………………….. 0.7 0.3 0.2 0.4 0.1 0.1<br />
441 Motor vehicle & parts dealers …….. 2.3 0.9 0.5 1.3 0.3 0.8<br />
4411, 4412 Auto & other motor veh. dealers . 2.4 1.0 0.6 1.5 0.3 0.8<br />
442 Furniture & home furn. stores……. 3.2 1.7 0.9 1.8 0.0 0.7<br />
443 Electronics & appliance stores ….. 1.6 0.6 0.3 1.0 0.0 0.3<br />
444 Building material & garden eq. &….<br />
supplies dealers…………………… 3.4 1.7 0.9 2.1 0.1 0.6<br />
445 Food & beverage stores……………. 1.2 0.2 0.2 0.6 0.1 0.2<br />
4451 Grocery stores ………………….. 1.4 0.2 0.2 0.6 0.0 0.2<br />
446 Health & personal care stores …… 1.8 0.4 0.3 0.7 0.0 0.3<br />
447 Gasoline stations ………………….. 2.5 0.4 0.3 1.0 0.2 0.4<br />
448 Clothing & clothing accessories<br />
stores ……………………………….. 2.6 0.6 0.6 0.9 -0.1 0.6<br />
451 Sporting goods, hobby, book &<br />
music stores……………………….. 3.8 1.8 1.2 2.1 0.3 0.6<br />
452 General merchandise stores………. 0.3 0.1 0.1 0.1 0.1 0.1<br />
4521 Department stores (ex. L.D.)…… 0.0 0.0 0.0 0.0 0.0 0.0<br />
453 Miscellaneous store retailers …….. 3.9 2.3 1.3 2.8 0.5 1.0<br />
454 Nonstore retailers ………………….. 2.3 1.1 0.7 1.8 0.2 0.5<br />
722 Food services & drinking places .. 2.0 0.8 0.7 1.2 0.1 0.3


