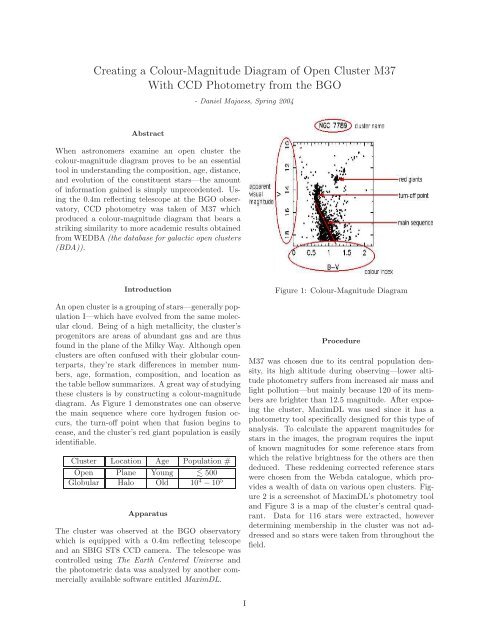
Creating a Colour-Magnitude Diagram of Open Cluster M37 With ...
Creating a Colour-Magnitude Diagram of Open Cluster M37 With ...
Creating a Colour-Magnitude Diagram of Open Cluster M37 With ...

You also want an ePaper? Increase the reach of your titles
YUMPU automatically turns print PDFs into web optimized ePapers that Google loves.
<strong>Creating</strong> a <strong>Colour</strong>-<strong>Magnitude</strong> <strong>Diagram</strong> <strong>of</strong> <strong>Open</strong> <strong>Cluster</strong> <strong>M37</strong><br />
<strong>With</strong> CCD Photometry from the BGO<br />
- Daniel Majaess, Spring 2004<br />
Abstract<br />
When astronomers examine an open cluster the<br />
colour-magnitude diagram proves to be an essential<br />
tool in understanding the composition, age, distance,<br />
and evolution <strong>of</strong> the constituent stars—the amount<br />
<strong>of</strong> information gained is simply unprecedented. Using<br />
the 0.4m reflecting telescope at the BGO observatory,<br />
CCD photometry was taken <strong>of</strong> <strong>M37</strong> which<br />
produced a colour-magnitude diagram that bears a<br />
striking similarity to more academic results obtained<br />
from WEDBA (the database for galactic open clusters<br />
(BDA)).<br />
Introduction<br />
An open cluster is a grouping <strong>of</strong> stars—generally population<br />
I—which have evolved from the same molecular<br />
cloud. Being <strong>of</strong> a high metallicity, the cluster’s<br />
progenitors are areas <strong>of</strong> abundant gas and are thus<br />
found in the plane <strong>of</strong> the Milky Way. Although open<br />
clusters are <strong>of</strong>ten confused with their globular counterparts,<br />
they’re stark differences in member numbers,<br />
age, formation, composition, and location as<br />
the table bellow summarizes. A great way <strong>of</strong> studying<br />
these clusters is by constructing a colour-magnitude<br />
diagram. As Figure 1 demonstrates one can observe<br />
the main sequence where core hydrogen fusion occurs,<br />
the turn-<strong>of</strong>f point when that fusion begins to<br />
cease, and the cluster’s red giant population is easily<br />
identifiable.<br />
<strong>Cluster</strong> Location Age Population #<br />
<strong>Open</strong> Plane Young 500<br />
Globular Halo Old 10 4 − 10 5<br />
Apparatus<br />
The cluster was observed at the BGO observatory<br />
which is equipped with a 0.4m reflecting telescope<br />
and an SBIG ST8 CCD camera. The telescope was<br />
controlled using The Earth Centered Universe and<br />
the photometric data was analyzed by another commercially<br />
available s<strong>of</strong>tware entitled MaximDL.<br />
Figure 1: <strong>Colour</strong>-<strong>Magnitude</strong> <strong>Diagram</strong><br />
Procedure<br />
<strong>M37</strong> was chosen due to its central population density,<br />
its high altitude during observing—lower altitude<br />
photometry suffers from increased air mass and<br />
light pollution—but mainly because 120 <strong>of</strong> its members<br />
are brighter than 12.5 magnitude. After exposing<br />
the cluster, MaximDL was used since it has a<br />
photometry tool specifically designed for this type <strong>of</strong><br />
analysis. To calculate the apparent magnitudes for<br />
stars in the images, the program requires the input<br />
<strong>of</strong> known magnitudes for some reference stars from<br />
which the relative brightness for the others are then<br />
deduced. These reddening corrected reference stars<br />
were chosen from the Webda catalogue, which provides<br />
a wealth <strong>of</strong> data on various open clusters. Figure<br />
2 is a screenshot <strong>of</strong> MaximDL’s photometry tool<br />
and Figure 3 is a map <strong>of</strong> the cluster’s central quadrant.<br />
Data for 116 stars were extracted, however<br />
determining membership in the cluster was not addressed<br />
and so stars were taken from throughout the<br />
field.<br />
I
Figure 2: Photometry Tool, MaximDL<br />
Figure 4: CMD <strong>M37</strong>, BGO Observatory<br />
Figure 3: <strong>Cluster</strong> Map <strong>of</strong> <strong>M37</strong><br />
Results & Discussion<br />
Figure 4 is our colour magnitude diagram (CMD) for<br />
116 possible members <strong>of</strong> <strong>M37</strong>, a diagram from the<br />
WEDBA database is also provided (Figure 5). One<br />
immediately notices the stark similarities between the<br />
two diagrams: from the main sequence, to the turn<strong>of</strong>f,<br />
to the group <strong>of</strong> red giants, there is an obvious consistency.<br />
However, transformation coefficients were not<br />
calculated which would have normalized the uniqueness<br />
<strong>of</strong> our camera, filter set, and telescope to the<br />
standards. Furthermore the CCD chip is known to be<br />
rather sensitive through the blue band so accounting<br />
for these effects may explain the ±0.2mag translational<br />
discrepancy in the (B-V) axis.<br />
Figure 5: CMD <strong>M37</strong>, Webda<br />
II