Port Stephens Design Flood Levels - Great Lakes Council - NSW ...
Port Stephens Design Flood Levels - Great Lakes Council - NSW ...
Port Stephens Design Flood Levels - Great Lakes Council - NSW ...

Create successful ePaper yourself
Turn your PDF publications into a flip-book with our unique Google optimized e-Paper software.
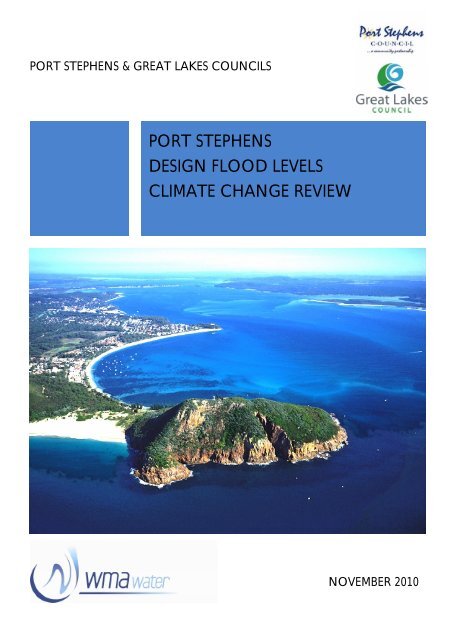
PORT STEPHENS & GREAT LAKES COUNCILS<br />
PORT STEPHENS<br />
DESIGN FLOOD LEVELS<br />
CLIMATE CHANGE REVIEW<br />
NOVEMBER 2010
Level 2, 160 Clarence Street<br />
Sydney, <strong>NSW</strong>, 2000<br />
Tel: 9299 2855<br />
Fax: 9262 6208<br />
Email: wma@wmawater.com.au<br />
Web: www.wmawater.com.au<br />
PORT STEPHENS DESIGN FLOOD LEVELS – CLIMATE CHANGE REVIEW<br />
NOVEMBER, 2010<br />
Project<br />
<strong>Port</strong> <strong>Stephens</strong> <strong>Design</strong> <strong>Flood</strong> <strong>Levels</strong> – Climate Change Review<br />
Client<br />
<strong>Port</strong> <strong>Stephens</strong> and <strong>Great</strong> <strong>Lakes</strong> <strong>Council</strong>s<br />
Authors<br />
R Dewar<br />
Date<br />
1 November 2010<br />
Project Number<br />
110020<br />
Client’s Representative<br />
Geoff Love – <strong>Great</strong> <strong>Lakes</strong> <strong>Council</strong><br />
Wal Mills – <strong>Port</strong> <strong>Stephens</strong> <strong>Council</strong><br />
Prepared by<br />
Verified by<br />
Revision Description Date<br />
2 Final 1 November 2010<br />
1 Public Exhibition Draft 9 June 2010
PORT STEPHENS DESIGN FLOOD LEVELS – CLIMATE CHANGE<br />
REVIEW<br />
TABLE OF CONTENTS<br />
PAGE<br />
FOREWORD................................................................................................................................ i<br />
EXECUTIVE SUMMARY ............................................................................................................ ii<br />
1. INTRODUCTION ........................................................................................................ 1<br />
1.1. General ....................................................................................................... 1<br />
1.2. Study Objectives ......................................................................................... 2<br />
1.3. The <strong>Flood</strong>plain Management Process Completed to Date .......................... 2<br />
2. THE FLOOD PROBLEM ............................................................................................ 3<br />
2.1. Observed <strong>Flood</strong> Problem ............................................................................ 3<br />
2.2. <strong>Flood</strong>ing Mechanisms ................................................................................. 3<br />
2.3. Nature of the Hazards ................................................................................. 4<br />
2.4. Review of <strong>Flood</strong> Study ................................................................................ 5<br />
2.4.1. Stage 1 - Analysis and Review of Existing Information (MHL623, July 1992)<br />
- Reference 2 ........................................................................................... 5<br />
2.4.2. Stage 2 - <strong>Design</strong> Water <strong>Levels</strong> and Wave Climate (MHL759, February<br />
1997) - Reference 3 ................................................................................. 5<br />
2.4.3. Stage 3 - Foreshore <strong>Flood</strong>ing (MHL880, June 1998) - Reference 4 ............ 8<br />
2.5. Review of Foreshore (<strong>Flood</strong>plain) Management Study- Reference 5 .......... 8<br />
2.6. Review of Foreshore (<strong>Flood</strong>plain) Management Plan- Reference 6 ............ 9<br />
2.7. Applicability of this Assessment ................................................................ 10<br />
3. CLIMATE CHANGE AND OTHER ISSUES.............................................................. 11<br />
3.1. Background .............................................................................................. 11<br />
3.1.1. Key References ........................................................................................ 11<br />
3.1.2. Change in Mean Sea Level ....................................................................... 12<br />
3.2. Effect of Ocean Level Rise on <strong>Design</strong> <strong>Flood</strong> <strong>Levels</strong> .................................. 14<br />
3.2.1. Effect on Stillwater <strong>Flood</strong> <strong>Levels</strong> ............................................................... 14<br />
3.2.2. Effect on Wave Runup <strong>Levels</strong> ................................................................... 15<br />
3.3. Effect of Rainfall Increase on <strong>Design</strong> <strong>Flood</strong> <strong>Levels</strong> ................................... 15<br />
3.4. Proposed Climate Change <strong>Design</strong> <strong>Flood</strong> <strong>Levels</strong> ....................................... 15<br />
3.5. Other Relevant Issues .............................................................................. 18<br />
3.5.1. Freeboard ................................................................................................. 18
3.5.2. Change in Karuah River <strong>Design</strong> Inflows .................................................... 18<br />
3.5.3. Is the Existing Minimum <strong>Flood</strong> Planning Level of 2.5 mAHD too<br />
Conservative ........................................................................................ 19<br />
3.5.4. Is the Adopted <strong>Design</strong> Ocean <strong>Levels</strong> Approach Appropriate ................... 19<br />
4. APPROACH FOR UPDATING MYALL RIVER DESIGN FLOOD LEVELS .............. 20<br />
4.1. Myall River Catchment .............................................................................. 20<br />
4.2. Lower Myall River <strong>Flood</strong> Analysis ............................................................. 20<br />
4.3. Proposed Approach to Update the Myall River <strong>Flood</strong> Study ...................... 20<br />
5. ACKNOWLEDGEMENTS......................................................................................... 22<br />
6. REFERENCES ......................................................................................................... 23<br />
LIST OF APPENDICES<br />
APPENDIX A: Glossary of Terms<br />
APPENDIX B: Copies of Tables from <strong>Port</strong> <strong>Stephens</strong> <strong>Flood</strong> Study – Reference 3<br />
LIST OF TABLES<br />
Table 1: <strong>Port</strong> <strong>Stephens</strong> Estuary Main Features ........................................................ 1<br />
Table 2: <strong>Design</strong> Peak Water <strong>Levels</strong> (m AHD) ........................................................... 6<br />
Table 3: <strong>Design</strong> <strong>Flood</strong> <strong>Levels</strong> (m AHD) with 0.4m Ocean Level Rise ...................... 16<br />
Table 4: <strong>Design</strong> <strong>Flood</strong> <strong>Levels</strong> (m AHD) with 0.9m Ocean Level Rise ...................... 17<br />
Table 5: Comparison of Peak Flows at Karuah ....................................................... 19<br />
LIST OF FIGURES<br />
Figure 1:<br />
Figure 2:<br />
Figure 3:<br />
Figure 4:<br />
Figure 5:<br />
Figure 6:<br />
Figure 7:<br />
Figure 8:<br />
Catchment Map<br />
Site Locations for Estimating <strong>Design</strong> <strong>Flood</strong> <strong>Levels</strong><br />
<strong>Design</strong> <strong>Flood</strong> <strong>Levels</strong><br />
<strong>Flood</strong> Gradients Stillwater Inundation<br />
Buildings Inundated Existing Conditions<br />
<strong>Design</strong> <strong>Flood</strong> <strong>Levels</strong> Including Climate Change<br />
<strong>Port</strong> <strong>Stephens</strong> Tidal Analysis<br />
<strong>Port</strong> <strong>Stephens</strong> Tidal Anomalies
<strong>Port</strong> <strong>Stephens</strong> <strong>Design</strong> <strong>Flood</strong> <strong>Levels</strong> – Climate Change Review<br />
FOREWORD<br />
The <strong>NSW</strong> State Government’s <strong>Flood</strong> Policy provides a framework to ensure the sustainable use<br />
of floodplain environments. The Policy is specifically structured to provide solutions to existing<br />
flooding problems in rural and urban areas. In addition, the Policy provides a means of<br />
ensuring that any new development is compatible with the flood hazard and does not create<br />
additional flooding problems in other areas.<br />
Under the Policy, the management of flood liable land remains the responsibility of local<br />
government. The State Government subsidises flood mitigation works to alleviate existing<br />
problems and provides specialist technical advice to assist <strong>Council</strong>s in the discharge of their<br />
floodplain management responsibilities.<br />
The Policy provides for technical and financial support by the Government through four<br />
sequential stages:<br />
1. <strong>Flood</strong> Study<br />
Determine the nature and extent of the flood problem.<br />
2. <strong>Flood</strong>plain Risk Management<br />
Evaluates management options for the floodplain in respect of both existing and<br />
proposed development.<br />
3. <strong>Flood</strong>plain Risk Management Plan<br />
Involves formal adoption by <strong>Council</strong> of a plan of management for the floodplain.<br />
4. Implementation of the Plan<br />
Construction of flood mitigation works to protect existing development, use of<br />
Local Environmental Plans to ensure new development is compatible with the<br />
flood hazard.<br />
The <strong>Port</strong> <strong>Stephens</strong> <strong>Flood</strong> Study constitutes the first stage of the management process and was<br />
completed in 1997 with publication of a three stage <strong>Flood</strong> Study Report. Subsequently the <strong>Port</strong><br />
<strong>Stephens</strong> Foreshore (<strong>Flood</strong>plain) Management Study and Plan were completed in 2002. This<br />
<strong>Design</strong> <strong>Flood</strong> Level – Climate Change Review has been undertaken to provide advice regarding<br />
the implications of climate change on the design flood levels in the <strong>Port</strong> <strong>Stephens</strong> estuary.<br />
WMAwater<br />
110020 :Pt<strong>Stephens</strong>CC.docx:1/11/2010<br />
i
<strong>Port</strong> <strong>Stephens</strong> <strong>Design</strong> <strong>Flood</strong> <strong>Levels</strong> – Climate Change Review<br />
EXECUTIVE SUMMARY<br />
<strong>Port</strong> <strong>Stephens</strong> is a large tidal estuary with a waterway area of approximately 140 square<br />
kilometres and a total catchment area of 2900 square kilometres. It is located 150 kilometres<br />
north of Sydney and 50 kilometres north of Newcastle. It is administered by both <strong>Port</strong> <strong>Stephens</strong><br />
and <strong>Great</strong> <strong>Lakes</strong> <strong>Council</strong>s.<br />
The majority of the foreshore area is undeveloped rural lands. The developed areas largely<br />
consist of residential buildings and tourist related facilities. It is an area of high aesthetic quality<br />
and the foremost feature of the region.<br />
Elevated water levels occur in <strong>Port</strong> <strong>Stephens</strong> mainly as a result of:<br />
ocean influences - tides and storm surges,<br />
wind and wave activity within the estuary,<br />
rainfall from the local catchment – Karuah River and Myall <strong>Lakes</strong> (this factor provides the<br />
least influence on levels).<br />
There are no accurate historical records on the inundation of land or buildings though it is known<br />
that several building floors have been inundated in the recent past. Wind wave activity has been<br />
recorded as a hazard on many occasions (particularly May 1974), the main impacts being<br />
erosion of the foreshore, waves breaking above the high water mark and inundation of low lying<br />
land. There are no records of damages to buildings or structures (apart from seawalls or other<br />
structures on the immediate foreshore).<br />
Based on the findings of the <strong>Port</strong> <strong>Stephens</strong> <strong>Flood</strong> Study and Foreshore (<strong>Flood</strong>plain)<br />
Management Study, up to 180 buildings would be inundated in a 1% AEP flood event (over 300<br />
in an Extreme event) producing over $2.4 million of tangible flood damages. Approximately 40%<br />
of these damages are from the villages of Lemon Tree Passage, Lower Pindimar and Tea<br />
Gardens.<br />
The <strong>NSW</strong> Government’s <strong>Flood</strong> Policy provides for:<br />
a framework to ensure the sustainable use of floodplain environments,<br />
solutions to flooding problems,<br />
a means of ensuring new development is compatible with the flood hazard.<br />
Implementation of this Policy requires a four stage approach, the first of which is preparation of a<br />
<strong>Flood</strong> Study to determine the nature and extent of the flood problem and this is followed by<br />
preparation of a <strong>Flood</strong>plain Management Study and Plan. These stages were completed in<br />
2002.<br />
Subsequent to completion of these studies it is generally accepted by the scientific community<br />
(Intergovernmental Panel on Climate Change) that climate change is likely to raise ocean levels<br />
and may have other adverse impacts such as an increase in rainfall intensities.<br />
WMAwater<br />
110020 :Pt<strong>Stephens</strong>CC.docx:1/11/2010<br />
ii
<strong>Port</strong> <strong>Stephens</strong> <strong>Design</strong> <strong>Flood</strong> <strong>Levels</strong> – Climate Change Review<br />
This climate change review study was initiated by <strong>Port</strong> <strong>Stephens</strong> and <strong>Great</strong> <strong>Lakes</strong> <strong>Council</strong>s to<br />
help determine the possible implications of climate change on the adopted design flood levels in<br />
the <strong>Port</strong> <strong>Stephens</strong> estuary. The study builds on the <strong>Port</strong> <strong>Stephens</strong> <strong>Flood</strong> Study (Stages 1 to 3)<br />
completed in 1997 which defines design flood levels for the foreshore area and the <strong>Port</strong><br />
<strong>Stephens</strong> Foreshore (<strong>Flood</strong>plain) Management Study and Plan completed in 2002.<br />
The key outcomes of this review are:<br />
a climate change induced ocean level increase will raise the design flood levels and<br />
wave runup levels by the same amount as the assumed ocean level rise,<br />
a climate change induced rainfall increase of up to 30% will raise flood levels in the <strong>Port</strong><br />
<strong>Stephens</strong> estuary by less than 0.1m,<br />
the assumed climate change induced ocean level increase and consequent flood level<br />
rise should be applied with the current freeboard allowance of 0.5m (i.e no reduction in<br />
the assumed ocean level rise should occur just because there is some allowance for<br />
climate change in the freeboard allowance),<br />
the current minimum <strong>Flood</strong> Planning Level of 2.5 mAHD (with climate change induced<br />
ocean level rise of 0.9m it will be 3.4 mAHD) has been adopted throughout the estuary<br />
foreshore (these level DO NOT include wave runup which should be determined on a<br />
site by site basis). However this means that at some locations there is a much greater<br />
freeboard than 0.5m. There is therefore an opportunity to lower the proposed climate<br />
change <strong>Flood</strong> Planning Level of 3.4 mAHD by assuming a non uniform level in the<br />
estuary.<br />
WMAwater<br />
110020 :Pt<strong>Stephens</strong>CC.docx:1/11/2010<br />
iii
<strong>Port</strong> <strong>Stephens</strong> <strong>Design</strong> <strong>Flood</strong> <strong>Levels</strong> – Climate Change Review<br />
1. INTRODUCTION<br />
1.1. General<br />
<strong>Port</strong> <strong>Stephens</strong> (Figure 1) is a large tidal estuary on the central coast of New South Wales,<br />
approximately 150 kilometres north of Sydney and 50 kilometres north of Newcastle. The<br />
northern area is administered by <strong>Great</strong> <strong>Lakes</strong> <strong>Council</strong> and the southern area by <strong>Port</strong> <strong>Stephens</strong><br />
<strong>Council</strong>. It has a waterway area of about 140 square kilometres with a total catchment area of<br />
2900 square kilometres, the Karuah River (1500 km 2 ) and Myall River (780 km 2 ) catchments<br />
comprise nearly 80% of the total. The main features of the estuary are identified in Table 1.<br />
Table 1:<br />
<strong>Port</strong> <strong>Stephens</strong> Estuary Main Features<br />
Total Catchment Area 2900 km 2<br />
Area of Estuary<br />
Length of Estuary<br />
Width of Estuary<br />
Perimeter Length<br />
Water Depth<br />
140 km 2 (5% of the total catchment area)<br />
24 km in an east-west direction<br />
varying from 1.5 to 6 km in a north-south direction<br />
over 80 kilometres<br />
varies from 2 m to over 30 m at Soldiers Point<br />
Contributing Catchments Karuah River 1500 km 2<br />
Myall River 780 km 2<br />
<strong>Port</strong> <strong>Stephens</strong> Waterway 140 km 2<br />
Twelve Mile Creek 80 km 2<br />
Reedy Creek 15 km 2<br />
The remainder (385 km 2 ) comprises small local catchments.<br />
<strong>Port</strong> <strong>Stephens</strong> is a relatively large waterway with moderate depths (less than 10 m).<br />
Consequently significant local wind waves can be generated which cause inundation of the<br />
foreshore area. It is divided into two embayments east and west of Soldiers Point (Figure 2).<br />
Ocean waves penetrate through the 1300 m wide ocean entrance between Yacaaba and<br />
Tomaree Heads but their impacts are limited to the eastern embayment.<br />
The majority of the foreshore is undeveloped and consists of rural lands (refer Figure 2). The<br />
main centres of development on the southern shore are the residential and tourist centres of<br />
Shoal Bay, Nelson Bay, Salamander Bay, Soldiers Point, Lemon Tree Passage, Mallabula and<br />
Tanilba Bay. The other centres are at Karuah at the mouth of the Karuah River, North Arm<br />
Cove, Bundabah, Pindimar and Tea Gardens, and Hawks Nest at the mouth of the Myall River.<br />
The study area comprises the foreshores of <strong>Port</strong> <strong>Stephens</strong> estuary and adjoining areas which<br />
are affected by flooding/inundation from the estuary. It does not include inundation as a result of<br />
local catchment runoff, inadequate local drainage or flooding up the tributary creeks including<br />
the Karuah and Myall Rivers. These issues have (or will be) investigated in separate studies.<br />
WMAwater 1<br />
110020 :Pt<strong>Stephens</strong>CC.docx:1/11/2010
<strong>Port</strong> <strong>Stephens</strong> <strong>Design</strong> <strong>Flood</strong> <strong>Levels</strong> – Climate Change Review<br />
1.2. Study Objectives<br />
The study objectives are summarised as follows:<br />
Review the approach taken in the <strong>Port</strong> <strong>Stephens</strong> <strong>Flood</strong> Study to determine design flood<br />
levels.<br />
Provide comment on the validity of the design flood approach in light of current<br />
guidelines.<br />
Outline the <strong>NSW</strong> Government’s approach for the assessment of climate change on flood<br />
levels.<br />
Provide comment on whether an approach for the assessment of climate change on<br />
flood levels can be adopted for the <strong>Port</strong> <strong>Stephens</strong> estuary without the need for further<br />
hydraulic modelling.<br />
Provide comment on the adopted 0.5m Freeboard.<br />
Provide comment on the most appropriate approach for updating design flood levels<br />
along the Myall River (<strong>Great</strong> <strong>Lakes</strong> <strong>Council</strong>).<br />
1.3. The <strong>Flood</strong>plain Management Process Completed to Date<br />
This study is concerned with the immediate foreshore area of the <strong>Port</strong> <strong>Stephens</strong> estuary. It is<br />
referred to as a “foreshore” rather than a “floodplain” to reflect the fact that the study area<br />
surrounds an estuary rather than a river and incorporates some aspects of the coastal/estuarine<br />
interface not usually considered in a typical flood or floodplain management study. However,<br />
the study has been administered under the framework of the floodplain management process.<br />
The floodplain management process was developed in the 1986 <strong>Flood</strong>plain Development<br />
Manual. The process has been updated and revised in the 2001 <strong>Flood</strong>plain Management<br />
Manual and subsequently in the 2005 <strong>Flood</strong>plain Development Manual (Reference 1).<br />
The <strong>Port</strong> <strong>Stephens</strong> <strong>Flood</strong> Study (References 2, 3 and 4) established design flood levels for the<br />
Extreme and the 1%, 2% and 5% AEP (Annual Exceedance Probability) events. These design<br />
flood levels are a combination of elevated ocean “stillwater” levels plus a wave runup<br />
component. The elevated ocean levels occur as a result of estuarine tides plus local and ocean<br />
wind effects. The results of the study showed that wave runup on the foreshore may increase<br />
the stillwater design levels by up to 1.5 m. The <strong>Flood</strong> Study completed the first stage of the<br />
management process.<br />
The subsequent Foreshore (<strong>Flood</strong>plain) Management Study (Reference 5) was undertaken to<br />
fully identify the flood problem and canvass various measures to mitigate the effects of flooding<br />
and wave action, and to prevent future flood damages. The penultimate product of the process<br />
was completion of the Foreshore (<strong>Flood</strong>plain) Management Plan (Reference 6) in 2002 which<br />
describes how the affected lands are to be managed in the future. Both the Study and the Plan<br />
involved community interaction to ensure that the measures were fully supported.<br />
A glossary of flood related terms is provided in Appendix A.<br />
WMAwater 2<br />
110020 :Pt<strong>Stephens</strong>CC.docx:1/11/2010
<strong>Port</strong> <strong>Stephens</strong> <strong>Design</strong> <strong>Flood</strong> <strong>Levels</strong> – Climate Change Review<br />
2. THE FLOOD PROBLEM<br />
2.1. Observed <strong>Flood</strong> Problem<br />
<strong>Port</strong> <strong>Stephens</strong> is different to many other areas affected by flooding in that there is very little<br />
qualitative or quantitative flood history. The following summarises the problems identified by the<br />
community or observed during previous studies.<br />
Inundation of Building Floors:<br />
Up to 10 houses have experienced above floor<br />
inundation. Of these only 3 (most likely) have resulted from inundation from the estuary<br />
with the remainder inundated from local catchment runoff. It is likely that other buildings<br />
have been inundated in the past but the residents are either unaware of the problem or<br />
did not respond to past surveys.<br />
Inundation of Yards: Over 60 residents indicated in previous studies that parts of their<br />
land have been inundated in the past. Some will have been from tidal inundation and<br />
wave action, but many will be from local catchment runoff which has ponded in low<br />
points within the properties, or from overland flow from upstream. It is also likely that a<br />
number of residents did not disclose that their properties have been inundated, either<br />
because they thought it unimportant, or they considered it would adversely affect the<br />
value or development potential of their properties.<br />
SES Intervention: According to SES records, the SES has not carried out damage<br />
reduction measures (sand bagging), evacuations or similar as a result of foreshore<br />
flooding, or has been called out to assist following any form of inundation or erosion<br />
event.<br />
Erosion:<br />
Several areas have a history of foreshore erosion, in particular Shoal Bay,<br />
Jimmy’s Beach, Salamander Bay/Corlette Point and Tanilba Bay. The problem is<br />
continuing today and was the most significant issue raised by residents in past studies.<br />
A large number of residents have had part of their land eroded and fear that further<br />
erosion may threaten their houses. In the May 1974 storm several houses were at risk at<br />
Corlette Point and <strong>Port</strong> <strong>Stephens</strong> <strong>Council</strong> placed rock to protect them.<br />
In summary it would appear that inundation of buildings has not been a major immediate reoccurring<br />
problem for residents. Erosion concerns far outweigh inundation concerns.<br />
Section 2.5 provides details of building floors inundated in the design flood events.<br />
2.2. <strong>Flood</strong>ing Mechanisms<br />
<strong>Flood</strong>ing of the foreshore area surrounding <strong>Port</strong> <strong>Stephens</strong> can result from a combination of the<br />
following four factors:<br />
1. elevated ocean levels resulting from astronomical tides, barometric pressure effects, and<br />
wind and wave setup which force water into the estuary,<br />
2. wave runup around the foreshores of the estuary causing local inundation of property as<br />
well as foreshore erosion,<br />
3. significant rainfall over the Karuah and Myall River catchments. The level in the estuary<br />
WMAwater 3<br />
110020 :Pt<strong>Stephens</strong>CC.docx:1/11/2010
<strong>Port</strong> <strong>Stephens</strong> <strong>Design</strong> <strong>Flood</strong> <strong>Levels</strong> – Climate Change Review<br />
rises as inflows from the upstream catchments and direct rainfall over the estuary<br />
exceeds the outflow to the ocean. The impact of catchment rainfall is only significant<br />
when it occurs in conjunction with elevated ocean levels. In the absence of an elevated<br />
ocean level catchment runoff will not produce a significant flooding problem in the<br />
estuary,<br />
4. rainfall over the local catchment which is unable to drain away quickly and so ponds in<br />
low areas. This is usually termed local flooding and causes inconvenience but generally<br />
not above floor flooding. It is exacerbated by elevated estuary levels.<br />
This study is primarily concerned with the potential effects of climate change on the first three<br />
causes of inundation and not local catchment runoff.<br />
2.3. Nature of the Hazards<br />
Foreshore flooding results from a combination of stillwater and wave runup inundation.<br />
Stillwater refers to the general estuary water level without the effects of waves. The term is<br />
somewhat misleading because during storms there is always some wave action as a result of<br />
ocean and local wind activity, and water levels even with wave effects excluded are not “still”,<br />
but tend to rise and fall in response to wind gusts, wave sets, currents, etc. Stillwater does<br />
include inflows from the tributaries (Karuah & Myall Rivers and others).<br />
Wave runup refers to the increase in water level that occurs along a foreshore when waves<br />
break and expend their remaining energy by running up the foreshore. The height the waves<br />
reach depends upon a number of factors such as the beach profile, foreshore exposure to the<br />
prevailing winds, and/or the presence of structures on the foreshore (vegetation, rock walls,<br />
buildings).<br />
There is also Local runoff which refers to runoff from the local upstream catchment, sometimes<br />
called overland flow, crossing roads and inundating private property and possibly buildings. This<br />
form of inundation has not been addressed in this study.<br />
The hazards associated with stillwater inundation and wave runup impacts differ as a result of<br />
their different characteristics. Peak stillwater levels will last for up to one to two hours and so will<br />
persist long enough to inundate building floors below the peak level regardless of how far they<br />
are from the foreshore, even if doors and windows are closed. However the water will rise<br />
relatively slowly and without a significant velocity component. The relatively shallow depth of<br />
inundation, low velocities and ease of access to high ground means that the risk to life is low.<br />
Wave runup will also occur over an extended period of time but within this time the peak level<br />
will be reached only a few times as large waves and surges impact on the foreshore. This will<br />
probably be near the peak of the storm and around the maximum still water level period. Wave<br />
runup (in isolation) will probably not cause inundation of floor levels if doors and windows are<br />
closed but, dissipation of the wave energy will erode banks and damage foreshore structures.<br />
The impacts of wave runup will mainly be restricted to the immediate foreshore area, with<br />
WMAwater 4<br />
110020 :Pt<strong>Stephens</strong>CC.docx:1/11/2010
<strong>Port</strong> <strong>Stephens</strong> <strong>Design</strong> <strong>Flood</strong> <strong>Levels</strong> – Climate Change Review<br />
properties further back less affected as the wave energy dissipates. Wave runup does increase<br />
the risk to life, but residents can generally still easily and safely move to high ground.<br />
2.4. Review of <strong>Flood</strong> Study<br />
2.4.1. Stage 1 - Analysis and Review of Existing Information (MHL623, July<br />
1992) - Reference 2<br />
Historical data and previous studies were examined with the aim of determining the various<br />
components that might influence flood levels in the estuary. Bathymetric, tidal, wave, wind,<br />
rainfall and runoff data were collected and analysed. Local residents were canvassed but did<br />
not reveal any specific details on historical flood levels. The study determined that flood levels<br />
were influenced by:<br />
• astronomical tide levels. Along the <strong>NSW</strong> coast tides vary from 0.4 m up to 1.1 m<br />
depending on the lunar cycle.<br />
• ocean storm surge effects. These are mainly the result of low barometric pressures<br />
during storms which cause ocean water levels to rise, plus the effect of strong onshore<br />
winds which push ocean waters onto the coast.<br />
• local wind set up. This is a localised rise in the water level caused by strong onshore<br />
winds in an estuary.<br />
• wave set up. This occurs as a result of waves (ocean or local) shoaling, breaking and<br />
pushing water towards the foreshore.<br />
• runoff from the Karuah River and Myall River catchments. In a confined river<br />
channel runoff effects will tend to dominate. However, where the estuary is wide and<br />
deep runoff impacts dissipate.<br />
• wave runup. This is the vertical height (above the “stillwater” level) to which water from<br />
a wave will run up the face of the shoreline. Wave runup occurs when waves reach the<br />
shoreline, break and expend their remaining energy as wave runup. The level of runup<br />
depends upon the local foreshore profile and the presence of foreshore structures.<br />
The study acknowledged that each of the above factors does not necessarily occur together,<br />
and that an allowance has to be made for their joint probability. The possible impact of future<br />
climatic change ocean level rise due to Greenhouse gas emissions (climate change) was also<br />
considered to be relevant. This study was followed by References 3 (Stage 2) and 4 (Stage 3)<br />
which quantified the design flood levels for what is known as “stillwater” flooding and “wave<br />
runup” flooding respectively.<br />
2.4.2. Stage 2 - <strong>Design</strong> Water <strong>Levels</strong> and Wave Climate (MHL759, February<br />
1997) - Reference 3<br />
For the Stage 2 investigations, computer models were established to examine flood conditions<br />
(5%, 2%, 1% AEP and extreme events) around the foreshore of <strong>Port</strong> <strong>Stephens</strong> and Tilligerry<br />
Creek. The design ocean levels for <strong>Port</strong> <strong>Stephens</strong> entrance were based on the Sydney tidal<br />
database (Fort Denison) and determined as:<br />
WMAwater 5<br />
110020 :Pt<strong>Stephens</strong>CC.docx:1/11/2010
5% AEP 1.43 mAHD,<br />
2% AEP 1.47 mAHD,<br />
1% AEP 1.50 mAHD.<br />
<strong>Port</strong> <strong>Stephens</strong> <strong>Design</strong> <strong>Flood</strong> <strong>Levels</strong> – Climate Change Review<br />
The study found that within the estuary the design water level varied depending upon a number<br />
of factors including:<br />
• the design ocean levels,<br />
• runoff from the major catchments of the Karuah and Myall Rivers and Tilligerry Creek<br />
(which produces a gradient from the western to the eastern embayment),<br />
• local wind effects.<br />
A two dimensional (2D) hydraulic model was used to analyse the effects of the above three<br />
factors and this level was designated as the design “stillwater” level for <strong>Port</strong> <strong>Stephens</strong> without<br />
wave runup. The results combine the effects of each of the above three components and are<br />
provided for 42 sites around the foreshore (Figure 2) on Figures 3 and 4 and Table 2. In<br />
summary the ocean levels affect the entire estuary by a similar amount, the runoff from the<br />
major catchments largely only affects the riverine areas of the Karuah and Myall River and it is<br />
the local wind effects that produce the greatest difference in peak levels over the estuary (as the<br />
wind causes a local elevation in the water level). The results in Table 2 indicate that the<br />
maximum variation in level (generally from west to east) was approximately 0.4 m.<br />
Table 2:<br />
<strong>Design</strong> Peak Water <strong>Levels</strong> (m AHD)<br />
Wave Runup (refer Section 2.4.3 for<br />
details) (2)<br />
Stillwater - No Wave Runup but<br />
includes elevated ocean levels +<br />
catchment runoff + local wind effects<br />
Site Location 5% AEP 1% AEP Extreme 5% AEP 1% AEP Extreme<br />
1 Tomaree overtops seawall 1.5 1.5 1.6<br />
2 Shoal Bay East 2.3 2.5 2.6 1.5 1.5 1.6<br />
3 Shoal Bay West 2.7 2.8 3.0 1.5 1.6 1.6<br />
4 Nelson Head East 2.9 3.1 3.4 1.5 1.6 1.6<br />
5 Little Nelson Bay 1.9 2.4 2.5 1.5 1.6 1.6<br />
6 Fly Point 2.1 2.3 2.4 1.5 1.6 1.6<br />
7 Nelson Bay<br />
3.1 3.3<br />
overtops<br />
seawall<br />
1.5 1.6 1.6<br />
8 Dutchmans Bay 2.2 2.6 2.7 1.6 1.6 1.7<br />
9 Redpatch Point 2.5 2.8 2.9 1.6 1.7 1.7<br />
9a Sandy Point 2.4 2.3 2.9 1.6 1.7 1.7<br />
10 Corlette Point 2.2 2.3 2.7 1.6 1.7 1.7<br />
11 Salamander Bay 1.9 2.0 2.3 1.6 1.7 1.7<br />
12 Wanda Wanda Head 2.0 2.0 2.1 1.6 1.7 1.8<br />
13 Kangaroo Point 2.3 2.4 2.7 1.6 1.7 1.8<br />
14 Soldiers Point East 2.5 2.6 3.1 1.6 1.7 1.8<br />
15 Soldiers Point West 1.8 1.9 2.1 1.7 1.7 1.8<br />
16 Greenplay Point 1.7 1.8 2.3 1.7 1.8 1.8<br />
17 Mud Point 1.7 1.8 2.3 1.7 1.8 1.8<br />
18 Diemar Point overtops seawall 1.7 1.8 1.8<br />
19 Taylor Beach 1.7 1.8 2.3 1.7 1.8 1.8<br />
20 Lemon Tree 1.7 1.8 2 1.7 1.8 1.8<br />
21 Mallabula Point 2.1 2.2 2.3 1.7 1.8 1.8<br />
22 Tanilba Bay 1.8 1.8 2.0 1.7 1.8 1.9<br />
WMAwater 6<br />
110020 :Pt<strong>Stephens</strong>CC.docx:1/11/2010
<strong>Port</strong> <strong>Stephens</strong> <strong>Design</strong> <strong>Flood</strong> <strong>Levels</strong> – Climate Change Review<br />
23 Bato Bato Point 2.4 2.5 3.1 1.8 1.9 1.9<br />
24 Oyster Cove 2.2 2.2 2.2 1.8 1.9 2<br />
25 Swan Bay 2.1 2.2 2.3 1.8 1.9 1.9<br />
26 Davis Point 1.8 1.9 2.0 1.8 1.9 2.0<br />
27 Lillies Point 2.1 2.2 2.4 1.8 1.9 2.0<br />
28 Karuah Bridge 1.8 1.9 2.0 1.8 1.9 2.0<br />
29 Correebah 2.3 2.4 2.7 1.7 1.8 1.9<br />
30 Carrington 2.0 2.2 2.3 1.7 1.8 1.9<br />
31 Baromee Point 2.2 2.3 2.4 1.7 1.8 1.8<br />
32 Baromee Hill 2.2 2.3 2.4 1.7 1.8 1.8<br />
33 Bundabah 1.7 1.8 2.0 1.7 1.8 1.8<br />
34 Fame Point 3.2 3.4 3.9 1.7 1.8 1.8<br />
35 Lower Pindimar 2.3 2.4 2.7 1.6 1.7 1.8<br />
36 Orungall Point 2.0 2.2 2.4 1.6 1.7 1.7<br />
37 Pindimar 2.0 2.0 2.2 1.6 1.7 1.7<br />
38 Limestone 1.6 1.7 1.7 1.6 1.7 1.7<br />
39 Tea Gardens 1.6 1.8 2.3 1.6 1.8 2.3 (1)<br />
40 Hawks Nest 1.5 1.7 2.0 1.5 1.7 2.0 (1)<br />
41 Jimmy’s Beach West 2.9 3.1 3.4 1.5 1.6 1.6<br />
42 Jimmy’s Beach East 2.5 2.6 2.9 1.5 1.6 1.6<br />
Notes:<br />
(1) Affected by Myall River flow, particularly in the Extreme event.<br />
(2) Highlighted numbers indicate where the wave runup level exceeds 2.5 mAHD.<br />
A review of the sensitivity results (refer Appendix B for copies of the tables from Reference 3) for<br />
the 1% AEP indicates the following.<br />
• Table J6 indicates that with no runoff inflows or wind effects the peak levels in the<br />
estuary range from 1.5 mAHD at the entrance (Site 1) to a maximum of 1.67 mAHD at<br />
the western foreshore (Sites 23 to 29).<br />
• Table J6 also indicates that with the inclusion of inflows but no wind effects the peak<br />
levels in the estuary increase by a maximum of 0.05m except in the confined floodplain<br />
areas of the Karuah River (Site 28) and the Myall River (Sites 39 and 40). This<br />
indicates that the inclusion of runoff makes little difference to the peak water levels and<br />
this is further confirmed by Table J3. Table J3 indicates that increasing the peak<br />
inflows by 10% makes less than 0.05m change in the peak water level even at the<br />
confined floodplain areas of the Karuah River (Site 28) and the Myall River (Sites 39<br />
and 40). Comparison of the peak levels in the estuary for the 1% AEP and Extreme<br />
flood (Table 2 in this report) indicates a difference in level of a maximum of 0.1m except<br />
in the confined floodplain areas of the Myall River (Sites 39 and 40). The Extreme flow<br />
was estimated as twice the 1% AEP flow in the Karuah River. These results indicate<br />
that a climate change induced increase in rainfall intensities of up to 30% can<br />
effectively be ignored except in the confined floodplain areas of the Myall and Karuah<br />
Rivers.<br />
• The most significant factor affecting the peak water levels within the estuary is the<br />
direction of the local wind setup. This factor can increase water levels by up to 0.3m.<br />
Table J6 provided results for the east, south east, south and south west wind<br />
directions. Winds from the south west lowered water levels compared to the No wind<br />
scenario by up to 0.3m at sites in the west (Sites 22 and 23) (this wind direction was not<br />
adopted as the design scenario). However winds from the east increased water levels<br />
WMAwater 7<br />
110020 :Pt<strong>Stephens</strong>CC.docx:1/11/2010
<strong>Port</strong> <strong>Stephens</strong> <strong>Design</strong> <strong>Flood</strong> <strong>Levels</strong> – Climate Change Review<br />
compared to the No wind scenario by up to 0.2m at sites in the west (Sites 24 to 27).<br />
• Table J5 indicates the results of lowering the assumed 1% AEP peak ocean level from<br />
1.5 mAHD to 1.1 mAHD and assuming No wind effects. The results indicate that the<br />
peak water levels are reduced by approximately 0.4m. This suggests that a climate<br />
change induced increase in the peak ocean level will raise flood levels within the<br />
estuary by a comparable amount to the ocean level increase.<br />
2.4.3. Stage 3 - Foreshore <strong>Flood</strong>ing (MHL880, June 1998) - Reference 4<br />
At any location around the foreshore of <strong>Port</strong> <strong>Stephens</strong>, the flood level depends upon a<br />
combination of the design water levels adjacent to the site (determined in Section 2.4.2 - Stage<br />
2 of the study) and the effect of wave runup.<br />
The wave climate in <strong>Port</strong> <strong>Stephens</strong> is a combination of local wind waves and ocean waves, the<br />
latter generally only occurring in the eastern embayment. Significant ocean wave heights of<br />
over 3.0 m were determined for the immediate entrance area but were generally less than 0.5 m.<br />
Wind waves occur throughout the estuary with the size of the wave generated dependant upon,<br />
the fetch length, the depth of water, and the wind speed duration and direction. Significant wind<br />
wave heights of over 2.0 m were determined for some exposed locations but values around<br />
1.0 m were more common.<br />
For the purposes of the <strong>Flood</strong> Study a typical beach profile was used at each of 42 sites around<br />
the foreshore and the 1% and 5% AEP levels determined as the maximum level for two<br />
coincidences of wind and water levels (design ocean level plus 1 year ARI wind waves or 1 year<br />
ARI water level (1.26 mAHD) plus design local wind waves). An extreme level was also<br />
estimated. The wave runup design flood level results are shown on Figure 3 and Table 2.<br />
The report identifies a number of guidelines regarding the analysis and use of the wave runup<br />
results:<br />
The cross sections (describing the foreshore) may change in time.<br />
One cross section was taken as being representative of the site. This is an<br />
approximation and in reality there may be significant changes in the cross_section away<br />
from the site.<br />
The design levels are only accurate at each of the 42 sites. Outside these sites the<br />
actual levels may vary.<br />
If significant development is to be undertaken, site specific analysis should be<br />
undertaken.<br />
Where buildings are located close to the foreshore the impact of wave runup needs to be<br />
addressed more closely (openings to the building, structural integrity).<br />
The actual design flood levels behind foreshore seawalls depend upon the distance from<br />
the seawall and the presence of any buildings.<br />
2.5. Review of Foreshore (<strong>Flood</strong>plain) Management Study- Reference 5<br />
The <strong>Port</strong> <strong>Stephens</strong> Foreshore (<strong>Flood</strong>plain) Management Study (Reference 5) constituted the<br />
WMAwater 8<br />
110020 :Pt<strong>Stephens</strong>CC.docx:1/11/2010
<strong>Port</strong> <strong>Stephens</strong> <strong>Design</strong> <strong>Flood</strong> <strong>Levels</strong> – Climate Change Review<br />
second stage of the floodplain management process and had the following objectives:<br />
to identify the nature and extent of the problem giving consideration to the depth of<br />
inundation, wave impact forces and flood access requirements. The number of building<br />
floors inundated at each site (Figure 2) is provided on Figure 5 with the average annual<br />
damages for private developments (year 2002) estimated as $840,000 (assuming wave<br />
runup damages),<br />
to facilitate discussion with local authorities and the public,<br />
to determine the social and economic effects of inundation, including the level of<br />
preparedness,<br />
to determine management measures to mitigate the effects of inundation on existing and<br />
future developments,<br />
to review <strong>Council</strong>s’ current flood policy provisions and examine the implications to<br />
planning of adhering to or amending the policy,<br />
to examine the environmental and social impact of any proposed works,<br />
to review submissions following public exhibition of the reports.<br />
This study did not undertake any hydrologic or hydraulic modelling of the potential impacts of<br />
climate change (Greenhouse Effect) but concluded:<br />
“There is a high likelihood that the Greenhouse Effect will have a significant adverse impact<br />
upon design flood levels in <strong>Port</strong> <strong>Stephens</strong> and consequently increase the annual average<br />
damages. There are no means of lessening the Greenhouse Effect other than a world wide<br />
reduction in the production of greenhouse gases. Both <strong>Council</strong>s should continue to monitor the<br />
available literature and reassess their <strong>Flood</strong> Policy as appropriate. At a minimum both <strong>Council</strong>s<br />
should obtain the most current information available from the Department of Land and Water<br />
Conservation every two years.”<br />
2.6. Review of Foreshore (<strong>Flood</strong>plain) Management Plan- Reference 6<br />
The <strong>Port</strong> <strong>Stephens</strong> Foreshore (<strong>Flood</strong>plain) Management Plan (Reference 6) constituted the third<br />
stage of the floodplain management process and documented the Standard Conditions<br />
regarding flooding for Development Applications along the <strong>Port</strong> <strong>Stephens</strong> foreshore (in Appendix<br />
A). The four key requirements were:<br />
1. Determination of the <strong>Flood</strong> Planning Level (FPL). A minimum FPL level of 2.5 mAHD<br />
was adopted but this may be higher if the <strong>Design</strong> Wave Runup Level (DWRL) at the<br />
location exceeds this level and the land is within 50m of Mean High Water (MHW –<br />
assumed to be 0.5 mAHD) which is the assumed limit of any wave runup. These criteria<br />
means that land beyond 50m from MHW and above 2.5 mAHD are not subject to the<br />
conditions.<br />
2. Assessment of potential Erosion and Coastal/Estuarine Issues.<br />
3. Implementation of suitable Building Controls and Evacuation.<br />
4. Assessment of Local Overland <strong>Flood</strong>ing.<br />
WMAwater 9<br />
110020 :Pt<strong>Stephens</strong>CC.docx:1/11/2010
2.7. Applicability of this Assessment<br />
<strong>Port</strong> <strong>Stephens</strong> <strong>Design</strong> <strong>Flood</strong> <strong>Levels</strong> – Climate Change Review<br />
Wave runup produces two broad effects, inundation which is the subject of this study and<br />
foreshore erosion which is not the subject of this study. Erosion has only been mentioned in this<br />
study as it is a foreshore hazard and needs to be addressed as part of <strong>Council</strong>’s climate change<br />
development control procedures, along with inundation. However this study is not concerned<br />
with quantifying the potential effects of a change in erosion and/or sedimentation due to climate<br />
change.<br />
Inundation of foreshore properties can occur either from the estuary or as a result of local<br />
catchment runoff trying to enter the estuary. This study is solely concerned with the effect of<br />
climate change on inundation and wave runup from the estuary, not from catchment runoff. It<br />
may well be that higher flood levels at some foreshore properties will result from local catchment<br />
runoff. The effect on road drainage has also not been considered within this study.<br />
WMAwater 10<br />
110020 :Pt<strong>Stephens</strong>CC.docx:1/11/2010
3. CLIMATE CHANGE AND OTHER ISSUES<br />
3.1. Background<br />
<strong>Port</strong> <strong>Stephens</strong> <strong>Design</strong> <strong>Flood</strong> <strong>Levels</strong> – Climate Change Review<br />
The 2005 <strong>Flood</strong>plain Development Manual (Reference 1) requires that <strong>Flood</strong> Studies and<br />
<strong>Flood</strong>plain Risk Management Studies consider the impacts of climate change on flood<br />
behaviour. Since completion of the <strong>Port</strong> <strong>Stephens</strong> Foreshore (floodplain) Management Study<br />
and Plan in 2002 (References 5 & 6), current best practice for considering the impacts of climate<br />
change (ocean level rise and rainfall increase) have been evolving rapidly.<br />
3.1.1. Key References<br />
Key references on climate change in <strong>NSW</strong> have included:<br />
• release of the Fourth Assessment Report by the Inter-governmental Panel on Climate<br />
Change (IPCC) in February 2007 (Reference 7), which updated the Third IPCC<br />
Assessment Report of 2001 (Reference 8);<br />
• preparation of the Climate Change Adaptation Actions for Local Government by<br />
SMEC Australia for the Australian Greenhouse Office in mid 2007 (Reference 9);<br />
• preparation of the Climate Change in Australia by CSIRO in late 2007 (Reference 10),<br />
which provides an Australian focus on Reference 7;<br />
• release of the <strong>Flood</strong>plain Risk Management Guideline Practical Consideration of<br />
Climate Change by the <strong>NSW</strong> Department of Environment and Climate Change in<br />
October 2007 (Reference 11 - referred to as the DECC Guideline 2007);<br />
• preparation of the Hunter, Central and Lower North Coast Regional Climate Change<br />
Project Report 3: Climate Change Impact for the Hunter, Lower North Coast and<br />
Central Coast Region of <strong>NSW</strong> (Hunter and Central Coast Regional Environmental<br />
Strategy, 2009 -Reference 12);<br />
• release of the <strong>NSW</strong> Policy Statement on Sea Level Rise (October 2009) (Reference<br />
13) which states: “Over the 20th century, global sea levels have risen by 17 cm and<br />
are continuing to rise. The current global average rate is approximately three times<br />
higher than the historical average. Sea level rise is a gradual process and will have<br />
medium- to long-term impacts. The best national and international projections of sea<br />
level rise along the <strong>NSW</strong> coast are for a rise relative to 1990 mean sea levels of up to<br />
40 cm by 2050 and 90 cm by 2100. There is no scientific evidence to suggest that sea<br />
levels will stop rising beyond 2100 or that the current trends will be reversed”;<br />
• In August 2010 the <strong>NSW</strong> State Government Department of Environment, Climate<br />
Change and Water produced the following:<br />
o <strong>Flood</strong> Risk Management Guide (Reference 14) incorporating sea level rise<br />
benchmarks in flood risk assessments,<br />
o Coastal Risk Management Guide (Reference 15) incorporating sea level rise<br />
benchmarks in coastal risk assessments,<br />
In August 2010 The Department of Planning also exhibited:<br />
o <strong>NSW</strong> Coastal Planning Guideline -Adapting to Sea Level Rise (Reference 16).<br />
WMAwater 11<br />
110020 :Pt<strong>Stephens</strong>CC.docx:1/11/2010
<strong>Port</strong> <strong>Stephens</strong> <strong>Design</strong> <strong>Flood</strong> <strong>Levels</strong> – Climate Change Review<br />
As a result of the information provided in the above and other documents, and to keep up-todate<br />
with current best practice, this review of the effect of climate change on design flood levels<br />
has been undertaken. It should be noted that the estimated rise in ocean/sea level along the<br />
<strong>NSW</strong> coast varies between the above reports and at this time there is no absolute value that has<br />
been adopted by all experts.<br />
The DECC Guideline 2007 (Reference 11) advice on climate change indicates that the following<br />
scenarios should be considered.<br />
ocean level rise (subsequently superseded by Reference 13):<br />
• low level ocean rise = 0.18 m,<br />
• medium level ocean rise = 0.55 m,<br />
• high level ocean rise = 0.91 m.<br />
and sensitivity analysis into the increase in peak rainfall and storm volume:<br />
• low level rainfall increase = 10%,<br />
• medium level rainfall increase = 20%,<br />
• high level rainfall increase = 30%.<br />
A high level rainfall increase of up to 30% is recommended for consideration due to the<br />
uncertainties associated with this aspect of climate change and to apply the “precautionary<br />
principle”. It is generally acknowledged that a 30% rainfall increase is probably overly<br />
conservative and that a timeframe for the provision of definitive predictions of the actual increase<br />
is unknown.<br />
The <strong>NSW</strong> Policy Statement on Sea Level Rise (October 2009 – Reference 13) indicates that the<br />
“best national and international projections of sea level rise along the <strong>NSW</strong> coast are for a rise<br />
relative to 1990 mean sea levels of 40 cm by 2050 and 90 cm by 2100. However, the IPCC in<br />
2007 also acknowledged that higher rates of sea level rise are possible”. Thus this document<br />
supersedes the DECC Guideline 2007 (Reference 11) advice on climate change. It is also<br />
acknowledged that the existing freeboard allowance cannot be used to allow for climate change<br />
and sensitivity analysis on the impacts.<br />
3.1.2. Change in Mean Sea Level<br />
Manly Hydraulics Laboratory recently undertook an assessment of the change in mean sea level<br />
at the ocean level recorders along the <strong>NSW</strong> coast since data has been available (1987 to date).<br />
The results (see below) indicate that there is an average annual increase of 2.7 mm in that<br />
period. However it should be noted that at other locations there has been a corresponding<br />
decrease (Coffs Harbour).<br />
WMAwater 12<br />
110020 :Pt<strong>Stephens</strong>CC.docx:1/11/2010
<strong>Port</strong> <strong>Stephens</strong> <strong>Design</strong> <strong>Flood</strong> <strong>Levels</strong> – Climate Change Review<br />
A recent technical paper by Church et al (Reference 17) states:<br />
“The few long-term coastal sea-level records (the earliest dating from about 1700; Woodworth<br />
1999) and sea-level records estimated from coastal sediment cores (e.g. Gehrels et al. 2005,<br />
2006) indicate an increase in the rate of rise from the 19th to the 20th century. Estimates of<br />
global-averaged sea level indicate an acceleration in the rate of rise during the 20th century<br />
(Church and White 2006; Jevrejeva et al. 2006; Woodworth et al. 2009; refer Figure 1 below).<br />
Since 1993, the rate of rise has been over 3 mm yr-1 (Church and White 2006; Leuliette et al.<br />
2004; Beckley et al. 2007) compared with the 20th century average of about 1.7 mm yr-1;<br />
whether this represents a further sustained increase in the rate of rise is not yet clear (Church et<br />
al. 2008a).”<br />
WMAwater 13<br />
110020 :Pt<strong>Stephens</strong>CC.docx:1/11/2010
<strong>Port</strong> <strong>Stephens</strong> <strong>Design</strong> <strong>Flood</strong> <strong>Levels</strong> – Climate Change Review<br />
“Figure 1. Global mean sea level from 1870 to 2008 with one standard deviation error<br />
estimates, updated from Church and White (2006, red), and the Topex/Poseidon/Jason-1 and -2<br />
satellite altimeter global mean sea level (based on standard processing as in Church and White<br />
2006) from 1993 to 2008 is in black. Both series have been set to a common value at the start of<br />
the altimeter record in 1993.”<br />
3.2. Effect of Ocean Level Rise on <strong>Design</strong> <strong>Flood</strong> <strong>Levels</strong><br />
A climate change induced increase in the ocean level can affect the design flood levels in the<br />
<strong>Port</strong> <strong>Stephens</strong> estuary in two ways, by affecting the Stillwater (includes design ocean levels +<br />
catchment inflows + wind setup within the estuary) flood levels and the Wave Runup flood<br />
levels.<br />
3.2.1. Effect on Stillwater <strong>Flood</strong> <strong>Levels</strong><br />
It is assumed with a climate change induced ocean level rise that the entire tidal cycle will<br />
gradually be raised over time and according to advice in Reference 13 in 2050 it will be raised<br />
by 40cm in 2050 and by 90cm by 2100 (from 1990 levels). Thus the design ocean levels will be<br />
raised by a similar amount assuming that there is no change in the storm surge or ocean wave<br />
setup components. Thus by 2050 the 1% AEP design ocean level will rise from 1.5 mAHD to<br />
1.9 mAHD and to 2.4 mAHD by the year 2100. Based on the results from Reference 3 (Section<br />
2.4.2) the Stillwater flood levels in the <strong>Port</strong> <strong>Stephens</strong> estuary will therefore rise by a similar<br />
amount (refer Tables 3 and 4).<br />
The possible increase in wind setup (significant component affecting the stillwater flood levels)<br />
due to climate change is unknown at this time and has therefore not been considered.<br />
WMAwater 14<br />
110020 :Pt<strong>Stephens</strong>CC.docx:1/11/2010
<strong>Port</strong> <strong>Stephens</strong> <strong>Design</strong> <strong>Flood</strong> <strong>Levels</strong> – Climate Change Review<br />
The increase in the lateral extent of inundation will depend on the slope of the land. In places<br />
the land rises steeply and thus the increase in extent will be less than a few metres. In other<br />
places the increase may be say 20m if the slope is a 1m rise over 50 metres.<br />
The climate change adjusted levels are shown on Figure 6.<br />
3.2.2. Effect on Wave Runup <strong>Levels</strong><br />
Reference 4 (results shown in Table 2 herein) indicate that for the majority of sites (exceptions<br />
are Sites 5, 8 and 9) the 1% AEP runup level is greater than the 5% AEP runup level by a similar<br />
difference to the water level in the estuary. Based on this it is reasonable to assume that the<br />
wind runup peak levels will rise by a similar amount to the climate change induced ocean level<br />
rise (refer Tables 3 and 4). The implications of an ocean level rise on wave runup levels are:<br />
the peak water level will generally rise by the same amount as the increase in the climate<br />
change ocean level. However, at some sites the local topography will limit the increase<br />
in level (overtopping the sea wall). Only a detailed site inspection can ascertain the<br />
exact magnitude of the increase at each location,<br />
the lateral extent of inundation (as the peak level is greater) would be greater depending<br />
upon the slope of the land,<br />
the starting point (MHW or 0.5 mAHD) for the assumed 50m lateral extent of the wave<br />
runup extent would move further landward as the starting point would rise,<br />
at this time there is no indication that the assumed 50m wave runup extent would<br />
increase.<br />
The climate change adjusted levels are shown on Figure 6.<br />
3.3. Effect of Rainfall Increase on <strong>Design</strong> <strong>Flood</strong> <strong>Levels</strong><br />
A climate change induced increase in rainfall intensities over the <strong>Port</strong> <strong>Stephens</strong> catchment will<br />
have NO significant effect on the Wave Runup flood levels. Based on the results from<br />
Reference 3 (Section 2.4.2) a 30% increase in rainfall intensity will raise the Stillwater flood<br />
levels by less than 0.1m.<br />
3.4. Proposed Climate Change <strong>Design</strong> <strong>Flood</strong> <strong>Levels</strong><br />
Study Outcome No 1: a climate change induced ocean level increase will raise the design flood<br />
levels and wave runup levels by the same amount as the assumed ocean level rise<br />
The assessment indicates that the wave runup and Stillwater design flood levels shown in Table<br />
WMAwater 15<br />
110020 :Pt<strong>Stephens</strong>CC.docx:1/11/2010
<strong>Port</strong> <strong>Stephens</strong> <strong>Design</strong> <strong>Flood</strong> <strong>Levels</strong> – Climate Change Review<br />
2 can be adjusted upwards by 0.4m and 0.9m to take into account a climate change induced<br />
ocean level rise.<br />
Study Outcome No 2: a climate change induced rainfall increase of up to 30% will raise flood<br />
levels in the <strong>Port</strong> <strong>Stephens</strong> estuary by less than 0.1m. Tables 3 and 4 show the wave runup<br />
and stillwater flood levels indicated in Table 2 increased by 0.4m (year 2050) and 0.9m (year<br />
2100) due to ocean level rise with no increase due to increased rainfall intensities or changes to<br />
the wind setup component. It should be noted that the wave runup levels are conservative and<br />
are likely to be lower than this maximum value as the topography (e.g above sea wall or change<br />
in foreshore structure) changes with increased height. Only a detailed site inspection can<br />
ascertain the exact magnitude of the wave runup increase at each location.<br />
Table 3:<br />
<strong>Design</strong> <strong>Flood</strong> <strong>Levels</strong> (m AHD) with 0.4m Ocean Level Rise<br />
Wave Runup<br />
(as per Table 2)<br />
Stillwater - No Wave Runup<br />
(as per Table 2)<br />
Site Location 5% AEP 1% AEP Extreme 5% AEP 1% AEP Extreme<br />
1 Tomaree overtops seawall 1.9 1.9 2.0<br />
2 Shoal Bay East 2.7 2.9 3.0 1.9 1.9 2.0<br />
3 Shoal Bay West 3.1 3.2 3.4 1.9 2.0 2.0<br />
4 Nelson Head East 3.3 3.5 3.8 1.9 2.0 2.0<br />
5 Little Nelson Bay 2.3 2.8 2.9 1.9 2.0 2.0<br />
6 Fly Point 2.5 2.7 2.8 1.9 2.0 2.0<br />
overtops<br />
7 Nelson Bay 3.5 3.7 seawall 1.9 2.0 2.0<br />
8 Dutchmans Bay 2.6 3.0 3.1 2.0 2.0 2.1<br />
9 Redpatch Point 2.9 3.2 3.3 2.0 2.1 2.1<br />
9a Sandy Point 2.8 2.7 3.3 2.0 2.1 2.1<br />
10 Corlette Point 2.6 2.7 3.1 2.0 2.1 2.1<br />
11 Salamander Bay 2.3 2.4 2.7 2.0 2.1 2.1<br />
12 Wanda Wanda Head 2.4 2.4 2.5 2.0 2.1 2.2<br />
13 Kangaroo Point 2.7 2.8 3.1 2.0 2.1 2.2<br />
14 Soldiers Point East 2.9 3.0 3.5 2.0 2.1 2.2<br />
15 Soldiers Point West 2.2 2.3 2.5 2.1 2.1 2.2<br />
16 Greenplay Point 2.1 2.2 2.7 2.1 2.2 2.2<br />
17 Mud Point 2.1 2.2 2.7 2.1 2.2 2.2<br />
18 Diemar Point overtops seawall 2.1 2.2 2.2<br />
19 Taylor Beach 2.1 2.2 2.7 2.1 2.2 2.2<br />
20 Lemon Tree 2.1 2.2 2.4 2.1 2.2 2.2<br />
21 Mallabula Point 2.5 2.6 2.7 2.1 2.2 2.2<br />
22 Tanilba Bay 2.2 2.2 2.4 2.1 2.2 2.3<br />
23 Bato Bato Point 2.8 2.9 3.5 2.2 2.3 2.3<br />
24 Oyster Cove 2.6 2.6 2.6 2.2 2.3 2.4<br />
25 Swan Bay 2.5 2.6 2.7 2.2 2.3 2.3<br />
26 Davis Point 2.2 2.3 2.4 2.2 2.3 2.4<br />
27 Lillies Point 2.5 2.6 2.8 2.2 2.3 2.4<br />
28 Karuah Bridge 2.2 2.3 2.4 2.2 2.3 2.4<br />
29 Correebah 2.7 2.8 3.1 2.1 2.2 2.3<br />
30 Carrington 2.4 2.6 2.7 2.1 2.2 2.3<br />
31 Baromee Point 2.6 2.7 2.8 2.1 2.2 2.2<br />
32 Baromee Hill 2.6 2.7 2.8 2.1 2.2 2.2<br />
33 Bundabah 2.1 2.2 2.4 2.1 2.2 2.2<br />
34 Fame Point 3.6 3.8 4.3 2.1 2.2 2.2<br />
35 Lower Pindimar 2.7 2.8 3.1 2.0 2.1 2.2<br />
36 Orungall Point 2.4 2.6 2.8 2.0 2.1 2.1<br />
WMAwater 16<br />
110020 :Pt<strong>Stephens</strong>CC.docx:1/11/2010
<strong>Port</strong> <strong>Stephens</strong> <strong>Design</strong> <strong>Flood</strong> <strong>Levels</strong> – Climate Change Review<br />
37 Pindimar 2.4 2.4 2.6 2.0 2.1 2.1<br />
38 Limestone 2.0 2.1 2.1 2.0 2.1 2.1<br />
39 Tea Gardens 2.0 2.2 2.7 2.0 2.2 2.7<br />
40 Hawks Nest 1.9 2.1 2.4 1.9 2.1 2.4<br />
41 Jimmy’s Beach West 3.3 3.5 3.8 1.9 2.0 2.0<br />
42 Jimmy’s Beach East 2.9 3.0 3.3 1.9 2.0 2.0<br />
Table 4:<br />
<strong>Design</strong> <strong>Flood</strong> <strong>Levels</strong> (m AHD) with 0.9m Ocean Level Rise<br />
With Wave Runup<br />
(as per Table 2)<br />
Stillwater - No Wave Runup<br />
(as per Table 2)<br />
Site Location 5% AEP 1% AEP Extreme 5% AEP 1% AEP Extreme<br />
1 Tomaree overtops seawall 2.4 2.4 2.5<br />
2 Shoal Bay East 3.2 3.4 3.5 2.4 2.4 2.5<br />
3 Shoal Bay West 3.6 3.7 3.9 2.4 2.5 2.5<br />
4 Nelson Head East 3.8 4.0 4.3 2.4 2.5 2.5<br />
5 Little Nelson Bay 2.8 3.3 3.4 2.4 2.5 2.5<br />
6 Fly Point 3.0 3.2 3.3 2.4 2.5 2.5<br />
overtops<br />
7 Nelson Bay 4.0 4.2 seawall 2.4 2.5 2.5<br />
8 Dutchmans Bay 3.1 3.5 3.6 2.5 2.5 2.6<br />
9 Redpatch Point 3.4 3.7 3.8 2.5 2.6 2.6<br />
9a Sandy Point 3.3 3.2 3.8 2.5 2.6 2.6<br />
10 Corlette Point 3.1 3.2 3.6 2.5 2.6 2.6<br />
11 Salamander Bay 2.8 2.9 3.2 2.5 2.6 2.6<br />
12 Wanda Wanda Head 2.9 2.9 3.0 2.5 2.6 2.7<br />
13 Kangaroo Point 3.2 3.3 3.6 2.5 2.6 2.7<br />
14 Soldiers Point East 3.4 3.5 4.0 2.5 2.6 2.7<br />
15 Soldiers Point West 2.7 2.8 3.0 2.6 2.6 2.7<br />
16 Greenplay Point 2.6 2.7 3.2 2.6 2.7 2.7<br />
17 Mud Point 2.6 2.7 3.2 2.6 2.7 2.7<br />
18 Diemar Point overtops seawall 2.6 2.7 2.7<br />
19 Taylor Beach 2.6 2.7 3.2 2.6 2.7 2.7<br />
20 Lemon Tree 2.6 2.7 2.9 2.6 2.7 2.7<br />
21 Mallabula Point 3.0 3.1 3.2 2.6 2.7 2.7<br />
22 Tanilba Bay 2.7 2.7 2.9 2.6 2.7 2.8<br />
23 Bato Bato Point 3.3 3.4 4.0 2.7 2.8 2.8<br />
24 Oyster Cove 3.1 3.1 3.1 2.7 2.8 2.9<br />
25 Swan Bay 3.0 3.1 3.2 2.7 2.8 2.8<br />
26 Davis Point 2.7 2.8 2.9 2.7 2.8 2.9<br />
27 Lillies Point 3.0 3.1 3.3 2.7 2.8 2.9<br />
28 Karuah Bridge 2.7 2.8 2.9 2.7 2.8 2.9<br />
29 Correebah 3.2 3.3 3.6 2.6 2.7 2.8<br />
30 Carrington 2.9 3.1 3.2 2.6 2.7 2.8<br />
31 Baromee Point 3.1 3.2 3.3 2.6 2.7 2.7<br />
32 Baromee Hill 3.1 3.2 3.3 2.6 2.7 2.7<br />
33 Bundabah 2.6 2.7 2.9 2.6 2.7 2.7<br />
34 Fame Point 4.1 4.3 4.8 2.6 2.7 2.7<br />
35 Lower Pindimar 3.2 3.3 3.6 2.5 2.6 2.7<br />
36 Orungall Point 2.9 3.1 3.3 2.5 2.6 2.6<br />
37 Pindimar 2.9 2.9 3.1 2.5 2.6 2.6<br />
38 Limestone 2.5 2.6 2.6 2.5 2.6 2.6<br />
39 Tea Gardens 2.5 2.7 3.2 2.5 2.7 3.2<br />
40 Hawks Nest 2.4 2.6 2.9 2.4 2.6 2.9<br />
41 Jimmy’s Beach West 3.8 4.0 4.3 2.4 2.5 2.5<br />
42 Jimmy’s Beach East 3.4 3.5 3.8 2.4 2.5 2.5<br />
WMAwater 17<br />
110020 :Pt<strong>Stephens</strong>CC.docx:1/11/2010
<strong>Port</strong> <strong>Stephens</strong> <strong>Design</strong> <strong>Flood</strong> <strong>Levels</strong> – Climate Change Review<br />
3.5. Other Relevant Issues<br />
The following are issues that are relevant to the outcomes of this study.<br />
3.5.1. Freeboard<br />
Freeboard is defined in the <strong>Flood</strong>plain Development Manual (Reference 1) as:<br />
“Freeboard provides reasonable certainty that the risk exposure selected in deciding on a<br />
particular flood chosen as the basis for the FPL is actually provided. It is a factor of safety<br />
typically used in relation to the setting of floor levels, levee crest levels, etc. Freeboard is<br />
included in the flood planning level.”<br />
The manual indicates that the following factors are included within the freeboard:<br />
Uncertainties in estimates of flood levels,<br />
“Local factors” not defined in the broad scale approach,<br />
Increases in water level due to wave action (not applied in addition to the wave runup<br />
levels),<br />
Increases in water level due to uncertainty in climate change predictions,<br />
The cumulative effect of subsequent infill development (not relevant for stillwater flood<br />
levels due to the size of the estuary).<br />
It could be argued that as the freeboard already includes some allowance for climate change<br />
then say the assumed 0.9m ocean level rise by the year 2010 can be reduced to say 0.7m. This<br />
approach is not valid as the freeboard is a factor of safety around the “best estimate” (this is<br />
discussed in Reference 14 which states “Freeboard should not therefore be used to allow for<br />
sea level rise impacts, which should be quantified and applied separately …”). Thus if the best<br />
estimate of ocean level rise is 0.9m, the freeboard allowance in the <strong>Flood</strong> Planning Level will still<br />
have an allowance (not defined) for a climate change factor of safety.<br />
Study Outcome No 3: the assumed climate change induced ocean level increase and<br />
consequent flood level rise should be applied with the current freeboard allowance of 0.5m (i.e<br />
no reduction in the assumed ocean level rise should occur just because there is some allowance<br />
for climate change in the freeboard allowance).<br />
3.5.2. Change in Karuah River <strong>Design</strong> Inflows<br />
The Karuah River <strong>Flood</strong> Study (Reference 18) indicates that the current estimates of peak flows<br />
on the Karuah River at Karuah have increased significantly from those quoted in Reference 3<br />
(this change has occurred due to a re-estimate of the hydrology).<br />
WMAwater 18<br />
110020 :Pt<strong>Stephens</strong>CC.docx:1/11/2010
<strong>Port</strong> <strong>Stephens</strong> <strong>Design</strong> <strong>Flood</strong> <strong>Levels</strong> – Climate Change Review<br />
Table 5:<br />
Comparison of Peak Flows at Karuah<br />
Event Reference 3 Reference 18<br />
5% AEP 1687 m 3 /s 2508 m 3 /s<br />
2% AEP 2295 m 3 /s 3354 m 3 /s<br />
1% AEP 2857 m 3 /s 4060 m 3 /s<br />
Extreme (Reference 3) or PMF (Reference 18) 6136 m 3 /s 12713 m 3 /s<br />
There is a 42% increase in the 1% AEP flows from Reference 3 to Reference 18. Thus the<br />
inclusion of the flows estimated in Reference 18 would raise the flood levels in the <strong>Port</strong><br />
<strong>Stephens</strong> estuary compared to those adopted Reference 3. However, as indicated by the<br />
results from Reference 3 this increase will have less than a 0.1m increase in water level in the<br />
estuary.<br />
3.5.3. Is the Existing Minimum <strong>Flood</strong> Planning Level of 2.5 mAHD too<br />
Conservative<br />
The existing uniform minimum <strong>Flood</strong> Planning Level (FPL) of 2.5 mAHD was adopted as part of<br />
the <strong>Port</strong> <strong>Stephens</strong> Foreshore (<strong>Flood</strong>plain) Management Plan (Reference 6) as it was simple to<br />
apply and required no decisions about boundaries between different levels. Figure 3 indicates<br />
the levels of the Stillwater and wave runup design levels. Figure 3 also indicates that the<br />
minimum FPL of 2.5 m AHD is up to 0.4m above the existing 1% AEP flood level +0.5m<br />
freeboard, thus in places the current minimum FPL is unduly conservative.<br />
Study Outcome No 4: the current minimum <strong>Flood</strong> Planning Level of 2.5 mAHD (with climate<br />
change induced ocean level rise of 0.9m it will be 3.4 mAHD by the year 2100) has been<br />
adopted throughout the estuary foreshore. However this means that at some locations there is a<br />
much greater freeboard than 0.5m. There is therefore an opportunity to lower the proposed<br />
climate change <strong>Flood</strong> Planning Level of 3.4 mAHD by assuming a non uniform level in the<br />
estuary.<br />
3.5.4. Is the Adopted <strong>Design</strong> Ocean <strong>Levels</strong> Approach Appropriate<br />
The main determinant of the stillwater design flood levels in the <strong>Port</strong> <strong>Stephens</strong> estuary is the<br />
design ocean levels. These were taken from analysis of the Fort Denison record in Sydney<br />
Harbour (Reference 3) and described in Section 2.4.2.<br />
As part of studies at Lake Macquarie an analysis of the <strong>Port</strong> <strong>Stephens</strong> water level record was<br />
undertaken and the results are shown on Figures 7 and 8. These indicate that ocean anomalies<br />
of up to 0.5m have been recorded and in the major rainfall events of February 1990 and June<br />
2007 (both produced significant flooding on Lake Macquarie and Tuggerah <strong>Lakes</strong>) the rainfall<br />
was associated with ocean anomalies.<br />
Whilst the above record cannot be described as a rigorous analysis it does indicate that<br />
elevated ocean levels, above the highest astronomical tide have occurred, and the adopted<br />
approach is therefore not unreasonable.<br />
WMAwater 19<br />
110020 :Pt<strong>Stephens</strong>CC.docx:1/11/2010
<strong>Port</strong> <strong>Stephens</strong> <strong>Design</strong> <strong>Flood</strong> <strong>Levels</strong> – Climate Change Review<br />
4. APPROACH FOR UPDATING MYALL RIVER DESIGN FLOOD LEVELS<br />
4.1. Myall River Catchment<br />
The Myall River catchment (780 km 2 ) comprises:<br />
Myall River to Boombah Broadwater (360 km 2 ),<br />
Boombah Broadwater, Boolambyte Lake and Myall Lake (100 km 2 ),<br />
Boolambyte Creek (50 km 2 ),<br />
Surrounding hills, marshes and plains (270km 2 ).<br />
From Boombah Broadwater (Tamboy) to Tea Gardens the Myall River follows a 15 km<br />
meandering path surrounded by heavily vegetated floodplain. The Myall River enters the <strong>Port</strong><br />
<strong>Stephens</strong> estuary by two channels to the north and east of Corrie Island Nature Reserve. The<br />
majority of the floodplain is within the Myall <strong>Lakes</strong> National Park and is largely uninhabited.<br />
4.2. Lower Myall River <strong>Flood</strong> Analysis<br />
The Lower Myall River <strong>Flood</strong> Analysis (Reference 19) is the only State Government funded<br />
study of flooding on the Myall River. There has been other privately funded studies (Reference<br />
20) but no subsequent <strong>Flood</strong> Study funded as part of the State Government program as outlined<br />
in Reference 1.<br />
Reference 19 was undertaken using the best available approach at the time (based on the 1977<br />
edition of Australian Rainfall & Runoff rather than the current 1987 edition) but there have been<br />
significant advancements in the hydrologic and hydraulic models available for use and in<br />
particular the availability of ALS survey which provides more accurate definition of the floodplain.<br />
The hydraulic model used was a steady state backwater program with outflow from the lakes<br />
represented as an outflow function. A Public Works hydrosurvey provided definition of the Myall<br />
River downstream of Tamboy but the sections are only crudely defined by today’s standards<br />
(they are shown in the report but at a scale which is unsuitable to accurately digitise).<br />
<strong>Design</strong> flood gradients are provided from Tea Gardens to Tamboy based on different tailwater<br />
levels in the <strong>Port</strong> <strong>Stephens</strong> estuary.<br />
Reference 20 was undertaken for a private developer to assess the effects of climate change for<br />
a proposed residential development located east of the intersection of Toonang Drive and Myall<br />
Street. This study established a XPSWMM model of the Myall River using the same cross<br />
sections as Reference 19 with the inclusion of some additional river cross sections. The focus<br />
of the study was on local drainage within the proposed development rather than the potential<br />
effects of climate change on Myall River flood levels.<br />
4.3. Proposed Approach to Update the Myall River <strong>Flood</strong> Study<br />
Both References 19 and 20 are limited by the relatively unsophisticated hydrologic modelling<br />
and storage routing approach through Myall <strong>Lakes</strong>. However as the flood levels at Tea Gardens<br />
WMAwater 20<br />
110020 :Pt<strong>Stephens</strong>CC.docx:1/11/2010
<strong>Port</strong> <strong>Stephens</strong> <strong>Design</strong> <strong>Flood</strong> <strong>Levels</strong> – Climate Change Review<br />
(only major settlement) are largely determined by the water level in the <strong>Port</strong> <strong>Stephens</strong> estuary<br />
(as they are at Karuah on the Karuah River) the design flood levels at Tea Gardens could be<br />
estimated with a fairly high degree of accuracy using a relatively simple modelling approach.<br />
Initially a thorough investigation should be undertaken to obtain all historic records of flooding on<br />
the Myall River. The use of a suitable hydrologic model and 2D hydraulic model, incorporating<br />
current ALS survey, would ensure a <strong>Flood</strong> Study compatible with present standards is obtained<br />
for the entire lakes and Lower Myall River. However as the majority of the floodplain is National<br />
Park with no existing or proposed future development the value of obtaining more up to date<br />
flood levels throughout the entire floodplain, including the lakes, is questionable.<br />
<strong>Flood</strong> levels in Tea Gardens and Hawks Nest are required for development control purposes<br />
and it is suggested that an up to date hydrologic model is obtained and calibrated but only a<br />
relatively crude 2D model is adopted for routing the flows through the lakes system to Tea<br />
Gardens, with a more detailed 2D model at Tea Gardens. ALS should be used to determine the<br />
stage storage characteristics of the lakes (i.e above 0 m AHD) and no bathymetry of the lakes is<br />
required. Along the Myall River downstream of Tamboy it may be possible to locate the original<br />
hydrographic survey (Reference 20 obviously did) as this would save time and costs. However<br />
it is likely that further detailed hydrographic survey may be required near Tea Gardens if the<br />
original survey or any subsequent survey that is located is inadequate. The use of ALS can<br />
significantly reduce the extent hydrographic survey that may be required.<br />
WMAwater 21<br />
110020 :Pt<strong>Stephens</strong>CC.docx:1/11/2010
<strong>Port</strong> <strong>Stephens</strong> <strong>Design</strong> <strong>Flood</strong> <strong>Levels</strong> – Climate Change Review<br />
5. ACKNOWLEDGEMENTS<br />
This study undertaken by WMAwater was funded by <strong>Port</strong> <strong>Stephens</strong> and <strong>Great</strong> <strong>Lakes</strong> <strong>Council</strong>s<br />
and the <strong>NSW</strong> State Government. The assistance of the following in providing data and<br />
guidance to the study is gratefully acknowledged.<br />
Department of Environment, Climate Change and Water,<br />
<strong>Port</strong> <strong>Stephens</strong> <strong>Council</strong>,<br />
<strong>Great</strong> <strong>Lakes</strong> <strong>Council</strong>,<br />
<strong>NSW</strong> State Government.<br />
WMAwater 22<br />
110020 :Pt<strong>Stephens</strong>CC.docx:1/11/2010
<strong>Port</strong> <strong>Stephens</strong> <strong>Design</strong> <strong>Flood</strong> <strong>Levels</strong> – Climate Change Review<br />
6. REFERENCES<br />
1. <strong>Flood</strong>plain Development Manual<br />
<strong>NSW</strong> Government, April 2005<br />
2. <strong>Port</strong> <strong>Stephens</strong> <strong>Council</strong><br />
<strong>Port</strong> <strong>Stephens</strong> <strong>Flood</strong> Study - Stage 1, Analysis and Review of Existing<br />
Information<br />
MHL623, July 1992.<br />
3. <strong>Port</strong> <strong>Stephens</strong> <strong>Council</strong><br />
<strong>Port</strong> <strong>Stephens</strong> <strong>Flood</strong> Study - Stage 2, <strong>Design</strong> Water <strong>Levels</strong> and Wave Climate<br />
MHL759, February 1997.<br />
4. <strong>Port</strong> <strong>Stephens</strong> <strong>Council</strong><br />
<strong>Port</strong> <strong>Stephens</strong> <strong>Flood</strong> Study - Stage 3, Foreshore <strong>Flood</strong>ing<br />
MHL880, June 1998.<br />
5. <strong>Port</strong> <strong>Stephens</strong> and <strong>Great</strong> <strong>Lakes</strong> <strong>Council</strong><br />
<strong>Port</strong> <strong>Stephens</strong> Foreshore (<strong>Flood</strong>plain) Management Study<br />
Webb McKeown & Associates, April 2002.<br />
6. <strong>Port</strong> <strong>Stephens</strong> and <strong>Great</strong> <strong>Lakes</strong> <strong>Council</strong><br />
<strong>Port</strong> <strong>Stephens</strong> Foreshore (<strong>Flood</strong>plain) Management Plan<br />
Webb McKeown & Associates, April 2002.<br />
7. Fourth Assessment Report “Climate Change 2007” - Synthesis Report<br />
Intergovernmental Panel on Climate Change (IPCC), 2007.<br />
8. Third Assessment Report “Climate Change 2001” - Synthesis Report<br />
Intergovernmental Panel on Climate Change (IPCC), 2001.<br />
9. Australian Greenhouse Office – Department of the Environment and Water Resources<br />
Climate Change Adaptation Actions for Local Government<br />
SMEC, 2007.<br />
10. Climate Change in Australia – Technical Report 2007<br />
CSIRO, 2007.<br />
11. <strong>Flood</strong>plain Risk Management Guideline - Practical Consideration of Climate<br />
Change<br />
<strong>NSW</strong> Department of Environment and Climate Change (DECC), October 2007.<br />
12. Hunter, Central and Lower North Coast Regional Climate Change Project 2009 –<br />
Report 3, Climatic Change Impact for the Hunter, Lower North Coast and Central<br />
WMAwater 23<br />
110020 :Pt<strong>Stephens</strong>CC.docx:1/11/2010
<strong>Port</strong> <strong>Stephens</strong> <strong>Design</strong> <strong>Flood</strong> <strong>Levels</strong> – Climate Change Review<br />
Coast Region of <strong>NSW</strong><br />
Hunter & Central Coast Regional Environmental Management Strategy, 2009.<br />
13. <strong>NSW</strong> Sea Level Rise Policy Statement<br />
New South Wales Government, October 2009.<br />
14. <strong>Flood</strong> Risk Management Guide<br />
Department of Environment Climate Change and Water <strong>NSW</strong>, August 2010.<br />
15. Coastal Risk Management Guide<br />
Department of Environment Climate Change and Water <strong>NSW</strong>, August 2010.<br />
16. <strong>NSW</strong> Coastal Planning Guideline: Adapting to Sea Level Rise<br />
<strong>NSW</strong> Department of Planning, August 2010.<br />
17. Church J.A., White, N.J., Hunter, J.R., McInnes, K.L., Mitchell, W.M., O’Farrell, S.P.<br />
and Griffin, D.A. (2009)<br />
In A Marine Climate Change Impacts and Adaptation Report Card for Australia<br />
2009 (Eds. E.S. Poloczanska, A.J. Hobday and A.J. Richardson), NCCARF<br />
Publication 05/09, ISBN 978-1-921609-03-9.<br />
18. <strong>Great</strong> <strong>Lakes</strong> <strong>Council</strong><br />
Karuah River <strong>Flood</strong> Study<br />
Paterson Consulting, Exhibition Copy February 2010.<br />
19. Department of Public Works <strong>NSW</strong><br />
Lower Myall River <strong>Flood</strong> Analysis<br />
February 1980.<br />
20. Crighton Properties<br />
Riverside at Tea Gardens – Probable Maximum <strong>Flood</strong><br />
Cardno Willing, November 2008.<br />
WMAwater 24<br />
110020 :Pt<strong>Stephens</strong>CC.docx:1/11/2010
FIGURE 1<br />
CATCHMENT MAP<br />
Canberra<br />
<strong>Port</strong> <strong>Stephens</strong><br />
Newcastle<br />
Sydney<br />
Catchment<br />
Boundary<br />
FILE > J:\JOBS\20038\DRAWINGS\FIGURE 1.CDR DATE > 23-02-2001 14:15<br />
5 0 5 10 15 20 25km<br />
N<br />
SCALE
FIGURE 2<br />
SITE LOCATIONS FOR ESTIMATING<br />
DESIGN FLOOD LEVELS<br />
FILE > J:\JOBS\20038\DRAWINGS\FIGURE 2.CDR DATE > 23-02-2001 14:30<br />
1 Tomaree<br />
2 Shoal Bay East<br />
3 Shoal Bay West<br />
4 Nelson Head East<br />
5 Little Nelson Bay<br />
6 Fly Point<br />
7 Nelson Bay<br />
8 Dutchmans Bay<br />
9 Redpatch Point<br />
9a Sandy Point<br />
10 Corlette Point<br />
11 Salamander Bay<br />
12 Wanda Wanda Head<br />
13 Kangaroo Point<br />
14 Soldiers Point East<br />
15 Soldiers Point West<br />
16 Greenplay Point<br />
17 Mud Point<br />
18 Diemar Point<br />
19 Taylors Beach<br />
20 Lemon Tree<br />
21 Mallabula Point<br />
22 Tanilba<br />
23 Bato Bato Point<br />
24 Oyster Cove<br />
25 Swan Bay<br />
26 Davis Point<br />
27 Lillies Point<br />
28 Karuah Bridge<br />
29 Correebah<br />
30 Carrington<br />
31 Baromee Point<br />
32 Baromee Hill<br />
33 Bundabah<br />
34 Fame Point<br />
35 Lower Pindimar<br />
36 Orungall Point<br />
37 Pindimar<br />
38 Limestone<br />
39 Tea Gardens<br />
40 Hawks Nest<br />
41 Jimmys Beach West<br />
42 Jimmys Beach East<br />
1.0 0.0 1.0 2.0 3.0 4.0 5.0km<br />
SCALE<br />
N
FIGURE 3<br />
PORT STEPHENS DESIGN FLOOD LEVELS<br />
4.0<br />
3.5<br />
Extreme With Wave Runup<br />
1% AEP With Wave Runup<br />
Extreme No Wave Runup<br />
1% AEP No Wave Runup<br />
Adopted Minimum <strong>Flood</strong> Planning Level<br />
Note: Excludes<br />
Ocean<br />
Level Rise<br />
Max of 1% AEP Stillwater +0.5 m Freeboard and Wave Runup<br />
1% AEP Stillwater & 0.5m Freeboard<br />
3.0<br />
2.5<br />
2.0<br />
1.5<br />
1.0<br />
1 Tomaree<br />
2 Shoal Bay East<br />
3 Shoal Bay West<br />
4 Nelson Head East<br />
5 Little Nelson Bay<br />
6 Fly Point<br />
7 Nelson Bay<br />
8 Dutchmans Bay<br />
9 Redpatch Point<br />
9a Sandy Point<br />
10 Corlette Point<br />
11 Salamander Bay<br />
12 Wanda Wanda Head<br />
13 Kangaroo Point<br />
14 Soldiers Point East<br />
15 Soldiers Point West<br />
16 Greenplay Point<br />
17 Mud Point<br />
18 Diemar Point<br />
19 Taylor Beach<br />
20 Lemon Tree<br />
21 Mallabula Point<br />
22 Tanilba Bay<br />
23 Bato Bato Point<br />
24 Oyster Cove<br />
25 Swan Bay<br />
26 Davis Point<br />
27 Lillies Point<br />
28 Karuah Bridge<br />
29 Correebah<br />
30 Carrington<br />
31 Baromee Point<br />
32 Baromee Hill<br />
33 Bundabah<br />
34 Fame Point<br />
35 Lower Pindimar<br />
36 Orungall Point<br />
37 Pindimar<br />
38 Limestone<br />
39 Tea Gardens<br />
40 Hawks Nest<br />
41 Jimmys Beach West<br />
Level (m AHD)<br />
42 Jimmys Beach East<br />
Wave runup overtops sea wall<br />
Wave runup overtops sea wall
FIGURE 4<br />
FLOOD GRADIENTS<br />
STILLWATER INUNDATION<br />
FILE > J:\JOBS\20038\DRAWINGS\FIGURE 5.CDR DATE > 28-02-2001 10:00<br />
29 Correebah<br />
30 Carrington<br />
31 Baromee Point<br />
32 Baromee Hill<br />
33 Bundabah<br />
34 Fame Point<br />
35 Lower Pindimar<br />
36 Orungall Point<br />
37 Pindimar<br />
38 Limestone<br />
39 Tea Gardens<br />
40 Hawks Nest<br />
41 Jimmys Beach West<br />
42 Jimmys Beach East<br />
15 Soldiers Point West<br />
16 Greenplay Point<br />
17 Mud Point<br />
18 Diemar Point<br />
19 Taylors Beach<br />
20 Lemon Tree<br />
21 Mallabula Point<br />
22 Tanilba<br />
23 Bato Bato Point<br />
24 Oyster Cove<br />
25 Swan Bay<br />
26 Davis Point<br />
27 Lillies Point<br />
28 Karuah Bridge<br />
1 Tomaree<br />
2 Shoal Bay East<br />
3 Shoal Bay West<br />
4 Nelson Head East<br />
5 Little Nelson Bay<br />
6 Fly Point<br />
7 Nelson Bay<br />
8 Dutchmans Bay<br />
9 Redpatch Point<br />
9a Sandy Point<br />
10 Corlette Point<br />
11 Salamander Bay<br />
12 Wanda Wanda Head<br />
13 Kangaroo Point<br />
14 Soldiers Point East<br />
LEGEND<br />
5% AEP <strong>Flood</strong> Contour<br />
and Height (mAHD)<br />
1.6<br />
1% AEP <strong>Flood</strong> Contour<br />
and Height (mAHD)<br />
1.7<br />
Extreme <strong>Flood</strong><br />
Contour and Height (mAHD)<br />
1.8<br />
28<br />
32 33<br />
2.2<br />
38<br />
29<br />
1.8<br />
37<br />
30<br />
1.6<br />
1.5<br />
6<br />
5<br />
39<br />
40<br />
41<br />
2.0<br />
1.9<br />
42<br />
31<br />
36<br />
35<br />
1.7<br />
34<br />
1.9 1.8<br />
1.7<br />
15<br />
1.7<br />
14<br />
1.6<br />
1.6<br />
13<br />
10<br />
9a<br />
9<br />
7<br />
8<br />
12<br />
11<br />
1.8 16<br />
17<br />
21<br />
20 18<br />
19<br />
23<br />
22<br />
27<br />
1.8 1.9 26<br />
25<br />
1.9<br />
4<br />
3<br />
1<br />
2<br />
1.8<br />
24<br />
N<br />
1.0 0.0 1.0 2.0 3.0 4.0 5.0km<br />
SCALE
FILE > J:\JOBS\11020\DRAWINGS\corelfiguresFIGURE 5<br />
40<br />
35<br />
30<br />
25<br />
20<br />
15<br />
10<br />
5<br />
0<br />
5% AEP<br />
1% AEP<br />
Extreme<br />
Including Wave Runup<br />
Location<br />
40<br />
35<br />
30<br />
25<br />
20<br />
15<br />
10<br />
5<br />
0<br />
5% AEP<br />
1% AEP<br />
Extreme<br />
Still Water (Excluding Wave Runup)<br />
Location
1 Tomaree<br />
2 Shoal Bay East<br />
3 Shoal Bay West<br />
4 Nelson Head East<br />
5 Little Nelson Bay<br />
6 Fly Point<br />
7 Nelson Bay<br />
8 Dutchmans Bay<br />
9 Redpatch Point<br />
9a Sandy Point<br />
10 Corlette Point<br />
4<br />
3.5<br />
3<br />
2.5<br />
2<br />
1.5<br />
1<br />
Wave runup overtops sea wall<br />
Level (m AHD)<br />
11 Salamander Bay<br />
12 Wanda Wanda Head<br />
13 Kangaroo Point<br />
14 Soldiers Point East<br />
15 Soldiers Point West<br />
16 Greenplay Point<br />
17 Mud Point<br />
18 Diemar Point<br />
Wave runup overtops sea wall<br />
19 Taylor Beach<br />
20 Lemon Tree<br />
21 Mallabula Point<br />
22 Tanilba Bay<br />
23 Bato Bato Point<br />
24 Oyster Cove<br />
25 Swan Bay<br />
26 Davis Point<br />
1% AEP With Wave Runup + 0.9m<br />
1% AEP With Wave Runup + 0.4m<br />
1% AEP + 0.9m rise No Wave Runup<br />
1% AEP + 0.4m rise No Wave Runup<br />
Adopted Minimum <strong>Flood</strong> Planning Level<br />
27 Lillies Point<br />
28 Karuah Bridge<br />
29 Correebah<br />
30 Carrington<br />
31 Baromee Point<br />
32 Baromee Hill<br />
33 Bundabah<br />
34 Fame Point<br />
35 Lower Pindimar<br />
36 Orungall Point<br />
37 Pindimar<br />
38 Limestone<br />
39 Tea Gardens<br />
40 Hawks Nest<br />
41 Jimmys Beach West<br />
42 Jimmys Beach East<br />
FIGURE 6<br />
PORT STEPHENS DESIGN FLOOD LEVELS<br />
INCLUDING CLIMATE CHANGE
FIGURE 7<br />
PORT STEPHENS TIDAL ANALYSIS<br />
Height (m AHD)<br />
1.25<br />
1.00<br />
0.75<br />
0.50<br />
0.25<br />
0.00<br />
-0.25<br />
-0.50<br />
-0.75<br />
-1.00<br />
-1.25<br />
Predicted<br />
09/1985 06/1988 03/1991 12/1993 09/1996 06/1999 02/2002 11/2004 08/2007<br />
Date<br />
1<br />
Recorded<br />
J:\Jobs\29076\Dataconversion\<strong>Port</strong>_Stephans_Tide_Analysis.xls<br />
Height (m AHD)<br />
Height (m AHD)<br />
1.50<br />
1.25<br />
1.00<br />
0.75<br />
0.50<br />
0.25<br />
0.00<br />
-0.25<br />
-0.50<br />
-0.75<br />
-1.00<br />
-1.25<br />
09/1985 06/1988 03/1991 12/1993 09/1996 06/1999 02/2002 11/2004 08/2007<br />
0.7000<br />
0.6000<br />
0.5000<br />
0.4000<br />
0.3000<br />
0.2000<br />
0.1000<br />
0.0000<br />
-0.1000<br />
-0.2000<br />
-0.3000<br />
-0.4000<br />
09/1985 06/1988 03/1991 12/1993 09/1996 06/1999 02/2002 11/2004 08/2007<br />
Date<br />
Residual<br />
Date<br />
1
Water Level (m AHD)<br />
1.4<br />
1.2<br />
1.0<br />
0.8<br />
0.6<br />
0.4<br />
0.2<br />
0.0<br />
‐0.2<br />
‐0.4<br />
‐0.6<br />
‐0.8<br />
February 1990 Event<br />
FIGURE 8<br />
PORT STEPHENS TIDAL ANOMALIES<br />
Predicted<br />
Recorded<br />
Water Level (m AHD)<br />
1.4<br />
1.2<br />
1.0<br />
0.8<br />
0.6<br />
0.4<br />
0.2<br />
0.0<br />
‐0.2<br />
‐0.4<br />
‐0.6<br />
‐0.8<br />
‐1.0<br />
May 1997 Event<br />
Predicted<br />
Recorded<br />
J:\Jobs\29076\Dataconversion\<strong>Port</strong>_Stephans_Tide_Anomalies.xlsx es.xlsx<br />
Water Level (m AHD)<br />
Water Level (m AHD)<br />
1.4<br />
1.2<br />
1.0<br />
0.8<br />
0.6<br />
0.4<br />
0.2<br />
0.0<br />
‐0.2<br />
‐0.4<br />
‐0.6<br />
‐0.8<br />
‐1.0<br />
1.4<br />
1.2<br />
1.0<br />
0.8<br />
0.6<br />
0.4<br />
0.2<br />
0.0<br />
‐0.2<br />
‐0.4<br />
‐0.6<br />
‐0.8<br />
‐1.0<br />
July 2001 Event<br />
June 2007 Event<br />
Predicted<br />
Recorded<br />
Predicted<br />
Recorded
<strong>Port</strong> <strong>Stephens</strong> <strong>Design</strong> <strong>Flood</strong> <strong>Levels</strong> – Climate Change Review<br />
APPENDIX A: GLOSSARY OF TERMS<br />
Taken from the <strong>Flood</strong>plain Development Manual (April 2005 edition)<br />
acid sulfate soils<br />
Annual Exceedance<br />
Probability (AEP)<br />
Australian Height Datum<br />
(AHD)<br />
Average Annual Damage<br />
(AAD)<br />
Average Recurrence<br />
Interval (ARI)<br />
caravan and moveable<br />
home parks<br />
catchment<br />
consent authority<br />
development<br />
Are sediments which contain sulfidic mineral pyrite which may become extremely<br />
acid following disturbance or drainage as sulfur compounds react when exposed<br />
to oxygen to form sulfuric acid. More detailed explanation and definition can be<br />
found in the <strong>NSW</strong> Government Acid Sulfate Soil Manual published by Acid Sulfate<br />
Soil Management Advisory Committee.<br />
The chance of a flood of a given or larger size occurring in any one year, usually<br />
expressed as a percentage. For example, if a peak flood discharge of 500 m 3 /s<br />
has an AEP of 5%, it means that there is a 5% chance (that is one-in-20 chance)<br />
of a 500 m 3 /s or larger event occurring in any one year (see ARI).<br />
A common national surface level datum approximately corresponding to mean<br />
sea level.<br />
Depending on its size (or severity), each flood will cause a different amount of<br />
flood damage to a flood prone area. AAD is the average damage per year that<br />
would occur in a nominated development situation from flooding over a very long<br />
period of time.<br />
The long term average number of years between the occurrence of a flood as big<br />
as, or larger than, the selected event. For example, floods with a discharge as<br />
great as, or greater than, the 20 year ARI flood event will occur on average once<br />
every 20 years. ARI is another way of expressing the likelihood of occurrence of<br />
a flood event.<br />
Caravans and moveable dwellings are being increasingly used for long-term and<br />
permanent accommodation purposes. Standards relating to their siting, design,<br />
construction and management can be found in the Regulations under the LG Act.<br />
The land area draining through the main stream, as well as tributary streams, to a<br />
particular site. It always relates to an area above a specific location.<br />
The <strong>Council</strong>, government agency or person having the function to determine a<br />
development application for land use under the EP&A Act. The consent authority<br />
is most often the <strong>Council</strong>, however legislation or an EPI may specify a Minister or<br />
public authority (other than a <strong>Council</strong>), or the Director General of DIPNR, as<br />
having the function to determine an application.<br />
Is defined in Part 4 of the Environmental Planning and Assessment Act (EP&A<br />
Act).<br />
infill development: refers to the development of vacant blocks of land that are<br />
generally surrounded by developed properties and is permissible under the<br />
current zoning of the land. Conditions such as minimum floor levels may be<br />
imposed on infill development.<br />
new development: refers to development of a completely different nature to that<br />
associated with the former land use. For example, the urban subdivision of an<br />
area previously used for rural purposes. New developments involve rezoning and<br />
typically require major extensions of existing urban services, such as roads, water<br />
supply, sewerage and electric power.<br />
WMAwater<br />
110020 :Pt<strong>Stephens</strong>CC.docx:1 November 2010 A1
<strong>Port</strong> <strong>Stephens</strong> <strong>Design</strong> <strong>Flood</strong> <strong>Levels</strong> – Climate Change Review<br />
redevelopment: refers to rebuilding in an area. For example, as urban areas<br />
age, it may become necessary to demolish and reconstruct buildings on a<br />
relatively large scale. Redevelopment generally does not require either rezoning<br />
or major extensions to urban services.<br />
disaster plan (DISPLAN)<br />
discharge<br />
ecologically sustainable<br />
development (ESD)<br />
effective warning time<br />
emergency management<br />
flash flooding<br />
flood<br />
flood awareness<br />
flood education<br />
flood fringe areas<br />
flood liable land<br />
flood mitigation standard<br />
A step by step sequence of previously agreed roles, responsibilities, functions,<br />
actions and management arrangements for the conduct of a single or series of<br />
connected emergency operations, with the object of ensuring the coordinated<br />
response by all agencies having responsibilities and functions in emergencies.<br />
The rate of flow of water measured in terms of volume per unit time, for example,<br />
cubic metres per second (m 3 /s). Discharge is different from the speed or velocity<br />
of flow, which is a measure of how fast the water is moving for example, metres<br />
per second (m/s).<br />
Using, conserving and enhancing natural resources so that ecological processes,<br />
on which life depends, are maintained, and the total quality of life, now and in the<br />
future, can be maintained or increased. A more detailed definition is included in<br />
the Local Government Act 1993. The use of sustainability and sustainable in this<br />
manual relate to ESD.<br />
The time available after receiving advice of an impending flood and before the<br />
floodwaters prevent appropriate flood response actions being undertaken. The<br />
effective warning time is typically used to move farm equipment, move stock,<br />
raise furniture, evacuate people and transport their possessions.<br />
A range of measures to manage risks to communities and the environment. In<br />
the flood context it may include measures to prevent, prepare for, respond to and<br />
recover from flooding.<br />
<strong>Flood</strong>ing which is sudden and unexpected. It is often caused by sudden local or<br />
nearby heavy rainfall. Often defined as flooding which peaks within six hours of<br />
the causative rain.<br />
Relatively high stream flow which overtops the natural or artificial banks in any<br />
part of a stream, river, estuary, lake or dam, and/or local overland flooding<br />
associated with major drainage before entering a watercourse, and/or coastal<br />
inundation resulting from super-elevated sea levels and/or waves overtopping<br />
coastline defences excluding tsunami.<br />
<strong>Flood</strong> awareness is an appreciation of the likely effects of flooding and a<br />
knowledge of the relevant flood warning, response and evacuation procedures.<br />
<strong>Flood</strong> education seeks to provide information to raise awareness of the flood<br />
problem so as to enable individuals to understand how to manage themselves an<br />
their property in response to flood warnings and in a flood event. It invokes a<br />
state of flood readiness.<br />
The remaining area of flood prone land after floodway and flood storage areas<br />
have been defined.<br />
Is synonymous with flood prone land (i.e. land susceptible to flooding by the<br />
probable maximum flood (PMF) event). Note that the term flood liable land<br />
covers the whole of the floodplain, not just that part below the flood planning level<br />
(see flood planning area).<br />
The average recurrence interval of the flood, selected as part of the floodplain risk<br />
management process that forms the basis for physical works to modify the<br />
WMAwater<br />
110020 :Pt<strong>Stephens</strong>CC.docx:1 November 2010 A2
<strong>Port</strong> <strong>Stephens</strong> <strong>Design</strong> <strong>Flood</strong> <strong>Levels</strong> – Climate Change Review<br />
impacts of flooding.<br />
floodplain<br />
floodplain risk<br />
management options<br />
floodplain risk<br />
management plan<br />
flood plan (local)<br />
flood planning area<br />
<strong>Flood</strong> Planning <strong>Levels</strong><br />
(FPLs)<br />
flood proofing<br />
flood prone land<br />
flood readiness<br />
flood risk<br />
flood storage areas<br />
Area of land which is subject to inundation by floods up to and including the<br />
probable maximum flood event, that is, flood prone land.<br />
The measures that might be feasible for the management of a particular area of<br />
the floodplain. Preparation of a floodplain risk management plan requires a<br />
detailed evaluation of floodplain risk management options.<br />
A management plan developed in accordance with the principles and guidelines<br />
in this manual. Usually includes both written and diagrammetic information<br />
describing how particular areas of flood prone land are to be used and managed<br />
to achieve defined objectives.<br />
A sub-plan of a disaster plan that deals specifically with flooding. They can exist<br />
at State, Division and local levels. Local flood plans are prepared under the<br />
leadership of the State Emergency Service.<br />
The area of land below the flood planning level and thus subject to flood related<br />
development controls. The concept of flood planning area generally supersedes<br />
the Aflood liable land@ concept in the 1986 Manual.<br />
FPL=s are the combinations of flood levels (derived from significant historical flood<br />
events or floods of specific AEPs) and freeboards selected for floodplain risk<br />
management purposes, as determined in management studies and incorporated<br />
in management plans. FPLs supersede the Astandard flood event@ in the 1986<br />
manual.<br />
A combination of measures incorporated in the design, construction and alteration<br />
of individual buildings or structures subject to flooding, to reduce or eliminate flood<br />
damages.<br />
Is land susceptible to flooding by the Probable Maximum <strong>Flood</strong> (PMF) event.<br />
<strong>Flood</strong> prone land is synonymous with flood liable land.<br />
<strong>Flood</strong> readiness is an ability to react within the effective warning time.<br />
Potential danger to personal safety and potential damage to property resulting<br />
from flooding. The degree of risk varies with circumstances across the full range<br />
of floods. <strong>Flood</strong> risk in this manual is divided into 3 types, existing, future and<br />
continuing risks. They are described below.<br />
existing flood risk: the risk a community is exposed to as a result of its location<br />
on the floodplain.<br />
future flood risk: the risk a community may be exposed to as a result of new<br />
development on the floodplain.<br />
continuing flood risk: the risk a community is exposed to after floodplain risk<br />
management measures have been implemented. For a town protected by levees,<br />
the continuing flood risk is the consequences of the levees being overtopped. For<br />
an area without any floodplain risk management measures, the continuing flood<br />
risk is simply the existence of its flood exposure.<br />
Those parts of the floodplain that are important for the temporary storage of<br />
floodwaters during the passage of a flood. The extent and behaviour of flood<br />
storage areas may change with flood severity, and loss of flood storage can<br />
increase the severity of flood impacts by reducing natural flood attenuation.<br />
Hence, it is necessary to investigate a range of flood sizes before defining flood<br />
storage areas.<br />
WMAwater<br />
110020 :Pt<strong>Stephens</strong>CC.docx:1 November 2010 A3
<strong>Port</strong> <strong>Stephens</strong> <strong>Design</strong> <strong>Flood</strong> <strong>Levels</strong> – Climate Change Review<br />
floodway areas<br />
freeboard<br />
habitable room<br />
Those areas of the floodplain where a significant discharge of water occurs during<br />
floods. They are often aligned with naturally defined channels. <strong>Flood</strong>ways are<br />
areas that, even if only partially blocked, would cause a significant redistribution of<br />
flood flows, or a significant increase in flood levels.<br />
Freeboard provides reasonable certainty that the risk exposure selected in<br />
deciding on a particular flood chosen as the basis for the FPL is actually provided.<br />
It is a factor of safety typically used in relation to the setting of floor levels, levee<br />
crest levels, etc. Freeboard is included in the flood planning level.<br />
in a residential situation: a living or working area, such as a lounge room, dining<br />
room, rumpus room, kitchen, bedroom or workroom.<br />
in an industrial or commercial situation: an area used for offices or to store<br />
valuable possessions susceptible to flood damage in the event of a flood.<br />
hazard<br />
hydraulics<br />
hydrograph<br />
hydrology<br />
local overland flooding<br />
local drainage<br />
mainstream flooding<br />
major drainage<br />
mathematical/computer<br />
models<br />
A source of potential harm or a situation with a potential to cause loss. In relation<br />
to this manual the hazard is flooding which has the potential to cause damage to<br />
the community. Definitions of high and low hazard categories are provided in the<br />
Manual.<br />
Term given to the study of water flow in waterways; in particular, the evaluation of<br />
flow parameters such as water level and velocity.<br />
A graph which shows how the discharge or stage/flood level at any particular<br />
location varies with time during a flood.<br />
Term given to the study of the rainfall and runoff process; in particular, the<br />
evaluation of peak flows, flow volumes and the derivation of hydrographs for a<br />
range of floods.<br />
Inundation by local runoff rather than overbank discharge from a stream, river,<br />
estuary, lake or dam.<br />
Are smaller scale problems in urban areas. They are outside the definition of<br />
major drainage in this glossary.<br />
Inundation of normally dry land occurring when water overflows the natural or<br />
artificial banks of a stream, river, estuary, lake or dam.<br />
<strong>Council</strong>s have discretion in determining whether urban drainage problems are<br />
associated with major or local drainage. For the purpose of this manual major<br />
drainage involves:<br />
$ the floodplains of original watercourses (which may now be piped,<br />
channelised or diverted), or sloping areas where overland flows develop along<br />
alternative paths once system capacity is exceeded; and/or<br />
$ water depths generally in excess of 0.3 m (in the major system design storm<br />
as defined in the current version of Australian Rainfall and Runoff). These<br />
conditions may result in danger to personal safety and property damage to<br />
both premises and vehicles; and/or<br />
$ major overland flow paths through developed areas outside of defined<br />
drainage reserves; and/or<br />
$ the potential to affect a number of buildings along the major flow path.<br />
The mathematical representation of the physical processes involved in runoff<br />
generation and stream flow. These models are often run on computers due to the<br />
complexity of the mathematical relationships between runoff, stream flow and the<br />
distribution of flows across the floodplain.<br />
WMAwater<br />
110020 :Pt<strong>Stephens</strong>CC.docx:1 November 2010 A4
<strong>Port</strong> <strong>Stephens</strong> <strong>Design</strong> <strong>Flood</strong> <strong>Levels</strong> – Climate Change Review<br />
merit approach<br />
The merit approach weighs social, economic, ecological and cultural impacts of<br />
land use options for different flood prone areas together with flood damage,<br />
hazard and behaviour implications, and environmental protection and well being<br />
of the State=s rivers and floodplains.<br />
The merit approach operates at two levels. At the strategic level it allows for the<br />
consideration of social, economic, ecological, cultural and flooding issues to<br />
determine strategies for the management of future flood risk which are formulated<br />
into <strong>Council</strong> plans, policy and EPIs. At a site specific level, it involves<br />
consideration of the best way of conditioning development allowable under the<br />
floodplain risk management plan, local floodplain risk management policy and<br />
EPIs.<br />
minor, moderate and major<br />
flooding<br />
Both the State Emergency Service and the Bureau of Meteorology use the<br />
following definitions in flood warnings to give a general indication of the types of<br />
problems expected with a flood:<br />
minor flooding: causes inconvenience such as closing of minor roads and the<br />
submergence of low level bridges. The lower limit of this class of flooding on the<br />
reference gauge is the initial flood level at which landholders and townspeople<br />
begin to be flooded.<br />
moderate flooding: low-lying areas are inundated requiring removal of stock<br />
and/or evacuation of some houses. Main traffic routes may be covered.<br />
major flooding: appreciable urban areas are flooded and/or extensive rural areas<br />
are flooded. Properties, villages and towns can be isolated.<br />
modification measures<br />
peak discharge<br />
Probable Maximum <strong>Flood</strong><br />
(PMF)<br />
Probable Maximum<br />
Precipitation (PMP)<br />
probability<br />
risk<br />
runoff<br />
Measures that modify either the flood, the property or the response to flooding.<br />
Examples are indicated in Table 2.1 with further discussion in the Manual.<br />
The maximum discharge occurring during a flood event.<br />
The PMF is the largest flood that could conceivably occur at a particular location,<br />
usually estimated from probable maximum precipitation, and where applicable,<br />
snow melt, coupled with the worst flood producing catchment conditions.<br />
Generally, it is not physically or economically possible to provide complete<br />
protection against this event. The PMF defines the extent of flood prone land,<br />
that is, the floodplain. The extent, nature and potential consequences of flooding<br />
associated with a range of events rarer than the flood used for designing<br />
mitigation works and controlling development, up to and including the PMF event<br />
should be addressed in a floodplain risk management study.<br />
The PMP is the greatest depth of precipitation for a given duration<br />
meteorologically possible over a given size storm area at a particular location at a<br />
particular time of the year, with no allowance made for long-term climatic trends<br />
(World Meteorological Organisation, 1986). It is the primary input to PMF<br />
estimation.<br />
A statistical measure of the expected chance of flooding (see AEP).<br />
Chance of something happening that will have an impact. It is measured in terms<br />
of consequences and likelihood. In the context of the manual it is the likelihood of<br />
consequences arising from the interaction of floods, communities and the<br />
environment.<br />
The amount of rainfall which actually ends up as streamflow, also known as<br />
WMAwater<br />
110020 :Pt<strong>Stephens</strong>CC.docx:1 November 2010 A5
<strong>Port</strong> <strong>Stephens</strong> <strong>Design</strong> <strong>Flood</strong> <strong>Levels</strong> – Climate Change Review<br />
rainfall excess.<br />
stage<br />
stage hydrograph<br />
survey plan<br />
water surface profile<br />
wind fetch<br />
Equivalent to Awater level@. Both are measured with reference to a specified<br />
datum.<br />
A graph that shows how the water level at a particular location changes with time<br />
during a flood. It must be referenced to a particular datum.<br />
A plan prepared by a registered surveyor.<br />
A graph showing the flood stage at any given location along a watercourse at a<br />
particular time.<br />
The horizontal distance in the direction of wind over which wind waves are<br />
generated.<br />
WMAwater<br />
110020 :Pt<strong>Stephens</strong>CC.docx:1 November 2010 A6