Express Scripts 2007 Drug Trend Report
Express Scripts 2007 Drug Trend Report
Express Scripts 2007 Drug Trend Report

You also want an ePaper? Increase the reach of your titles
YUMPU automatically turns print PDFs into web optimized ePapers that Google loves.
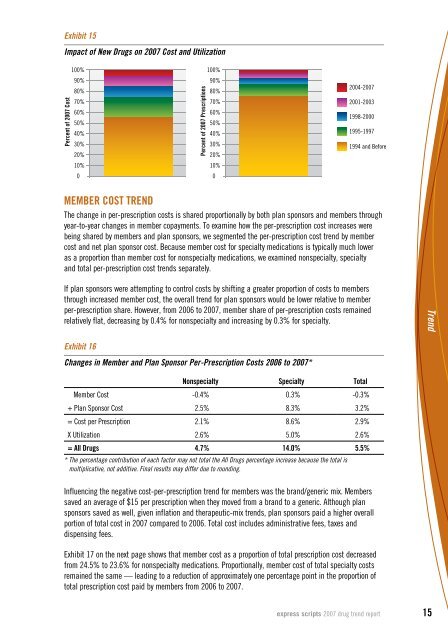
Exhibit 15<br />
Impact of New <strong>Drug</strong>s on <strong>2007</strong> Cost and Utilization<br />
Percent of <strong>2007</strong> Cost<br />
100%<br />
90%<br />
80%<br />
70%<br />
60%<br />
50%<br />
40%<br />
30%<br />
20%<br />
10%<br />
0<br />
Percent of <strong>2007</strong> Prescriptions<br />
100%<br />
90%<br />
80%<br />
70%<br />
60%<br />
50%<br />
40%<br />
30%<br />
20%<br />
10%<br />
0<br />
2004-<strong>2007</strong><br />
2001-2003<br />
1998-2000<br />
1995-1997<br />
1994 and Before<br />
Member Cost <strong>Trend</strong><br />
The change in per-prescription costs is shared proportionally by both plan sponsors and members through<br />
year-to-year changes in member copayments. To examine how the per-prescription cost increases were<br />
being shared by members and plan sponsors, we segmented the per-prescription cost trend by member<br />
cost and net plan sponsor cost. Because member cost for specialty medications is typically much lower<br />
as a proportion than member cost for nonspecialty medications, we examined nonspecialty, specialty<br />
and total per-prescription cost trends separately.<br />
If plan sponsors were attempting to control costs by shifting a greater proportion of costs to members<br />
through increased member cost, the overall trend for plan sponsors would be lower relative to member<br />
per-prescription share. However, from 2006 to <strong>2007</strong>, member share of per-prescription costs remained<br />
relatively flat, decreasing by 0.4% for nonspecialty and increasing by 0.3% for specialty.<br />
<strong>Trend</strong><br />
Exhibit 16<br />
Changes in Member and Plan Sponsor Per-Prescription Costs 2006 to <strong>2007</strong>*<br />
Nonspecialty Specialty Total<br />
Member Cost -0.4% 0.3% -0.3%<br />
+ Plan Sponsor Cost 2.5% 8.3% 3.2%<br />
= Cost per Prescription 2.1% 8.6% 2.9%<br />
X Utilization 2.6% 5.0% 2.6%<br />
= All <strong>Drug</strong>s 4.7% 14.0% 5.5%<br />
* The percentage contribution of each factor may not total the All <strong>Drug</strong>s percentage increase because the total is<br />
multiplicative, not additive. Final results may differ due to rounding.<br />
Influencing the negative cost-per-prescription trend for members was the brand/generic mix. Members<br />
saved an average of $15 per prescription when they moved from a brand to a generic. Although plan<br />
sponsors saved as well, given inflation and therapeutic-mix trends, plan sponsors paid a higher overall<br />
portion of total cost in <strong>2007</strong> compared to 2006. Total cost includes administrative fees, taxes and<br />
dispensing fees.<br />
Exhibit 17 on the next page shows that member cost as a proportion of total prescription cost decreased<br />
from 24.5% to 23.6% for nonspecialty medications. Proportionally, member cost of total specialty costs<br />
remained the same — leading to a reduction of approximately one percentage point in the proportion of<br />
total prescription cost paid by members from 2006 to <strong>2007</strong>.<br />
express scripts <strong>2007</strong> drug trend report 15