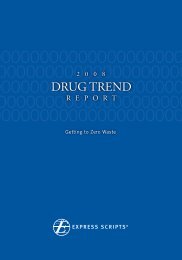
Express Scripts 2007 Drug Trend Report
Express Scripts 2007 Drug Trend Report
Express Scripts 2007 Drug Trend Report

Create successful ePaper yourself
Turn your PDF publications into a flip-book with our unique Google optimized e-Paper software.
<strong>Trend</strong><br />
<strong>Express</strong> <strong>Scripts</strong> <strong>2007</strong> <strong>Drug</strong> <strong>Trend</strong> <strong>Report</strong>
<strong>Trend</strong><br />
Tracking <strong>Trend</strong><br />
Throughout the year, <strong>Express</strong> <strong>Scripts</strong> works proactively with plan sponsors to help make the use of<br />
prescription drugs safer and more affordable. We use a variety of programs and plan designs that<br />
encourage the use of the most cost-effective agents, as well as safety programs that reduce untoward<br />
effects of medication.<br />
Once a year we look back and evaluate the previous year. But tracking trend is not just looking back; it is<br />
also looking forward and understanding how the past drives the future. By recognizing what is happening<br />
in the rapidly changing world of prescription-drug benefits, <strong>Express</strong> <strong>Scripts</strong> uses trend information<br />
strategically to plan the best programs for our plan sponsors and their members. <strong>Trend</strong> is our compass<br />
for the future.<br />
In <strong>2007</strong>, <strong>Express</strong> <strong>Scripts</strong> managed prescription-drug benefits for more than 55 million Americans,<br />
representing thousands of plan sponsors in all 50 states. To profile prescription-drug trends, we evaluated<br />
nonspecialty drugs and specialty drugs separately using a common data set, which includes a sample of<br />
plan sponsors that were with <strong>Express</strong> <strong>Scripts</strong> in 2006 and <strong>2007</strong>. From this sample, we randomly selected<br />
approximately 3 million members among those enrolled at any time in 2006 or <strong>2007</strong> for analysis.<br />
Included in the sample were plan sponsors that offered funded, fully integrated prescription-drug benefits<br />
within the commercially insured market and that had enrollment changes of no more than 50% between<br />
2006 and <strong>2007</strong>. Selecting plan sponsors with fully integrated benefits ensures that we capture all Home<br />
Delivery claims, as well as claims adjudicated through participating pharmacies. We focused on the<br />
commercially insured market, excluding members receiving prescriptions through Medicaid and Medicare<br />
Part D because of the unique eligibility requirements, utilization patterns and copayment structures<br />
among noncommercial groups.<br />
In <strong>2007</strong>, the calculation of prevalence was changed to more accurately estimate the proportion of<br />
members who fill at least one prescription from one year to the next. The previous methodology slightly<br />
overestimated prevalence of use.<br />
<strong>Trend</strong><br />
Prescription-cost trends were evaluated on a per member per year (PMPY) basis and analyzed across three<br />
main components:<br />
1. Per-prescription costs for common drugs (those dispensed in both 2006 and <strong>2007</strong>), which were<br />
further divided into the influences of:<br />
• Price Inflation<br />
• Units per Prescription<br />
• Brand/Generic Mix<br />
• Therapeutic Mix<br />
2. Utilization for common drugs, also broken into two major components:<br />
• Prevalence — the percentage of patients filling prescriptions from year to year<br />
• Intensity — the year-to-year number of prescriptions filled<br />
3. Impact of new drugs<br />
express scripts <strong>2007</strong> drug trend report 5
Overall <strong>Drug</strong> <strong>Trend</strong><br />
For <strong>2007</strong>, overall trend was 5.5%, the lowest seen since <strong>Express</strong> <strong>Scripts</strong> began tracking trend. For<br />
nonspecialty drugs, trend was only 4.7%, down 1.2 percentage points from 2006. Notable is that<br />
brand/generic mix decreased 4.4%, reflecting the impact of newly introduced generics for brand-name<br />
drugs. The specialty-drug trend of 14% compared favorably to the 20.9% specialty trend in 2006.<br />
Nonspecialty-<strong>Drug</strong> <strong>Trend</strong><br />
Exhibit 4<br />
Components of PMPY Nonspecialty Cost <strong>Trend</strong> 2004 to <strong>2007</strong>*<br />
<strong>Trend</strong><br />
AWP Less Discount AWP Less Discount Ingredient Cost Ingredient Cost<br />
2003 vs. 2004 2004 vs. 2005 2005 vs. 2006 2006 vs. <strong>2007</strong><br />
Price Inflation 6.0% 5.3% 4.3% 5.0%<br />
X Units per Prescription 0.2% 0.1% 0.4% 0.5%<br />
X Brand/Generic Mix -2.6% -2.7% -2.9% -4.4%<br />
X Therapeutic Mix 3.7% 0.8% 1.7% 1.1%<br />
= Cost per Prescription 7.2% 3.3% 3.5% 2.0%<br />
X Utilization 2.9% 4.0% 2.2% 2.5%<br />
= Common <strong>Drug</strong>s 10.4% 7.5% 5.8% 4.6%<br />
+ New <strong>Drug</strong>s 0.3% 0.4% 0.2% 0.1%<br />
= All <strong>Drug</strong>s 10.6% 7.9% 5.9% 4.7%<br />
* The percentage contribution of each factor does not total to the All <strong>Drug</strong>s percentage increase. The calculation takes the base<br />
cost for a given year and multiplies it by one plus the percentage contributed by the first factor (price). The resulting total is<br />
then multiplied by the percentage contributed by the second factor (number of units dispensed), and so on for each Common<br />
<strong>Drug</strong>s factor. The percentage contribution of the New <strong>Drug</strong>s is then added to the total Common <strong>Drug</strong>s percentage, to yield an<br />
All <strong>Drug</strong>s percentage increase. Final results may differ due to rounding.<br />
Of the 4.7% nonspecialty increase from 2006 to <strong>2007</strong>:<br />
• 53.4% was due to increased utilization<br />
• 43.6% was due to increased cost<br />
• 3% was due to the introduction of new medications<br />
Exhibit 5 presents the top 20 nonspecialty therapy classes ranked by PMPY cost. These therapy classes,<br />
representing 75% of nonspecialty-drug spend in <strong>2007</strong>, had a 4.1% increase in total spending, as<br />
compared to a 6.7% trend for all other nonspecialty therapy classes.<br />
Eight of the top 20 nonspecialty therapy classes had double-digit trend increases in PMPY cost, driven<br />
in large part by per-prescription cost growth. Also contributing to higher trend for the antidiabetics<br />
and anticonvulsants classes were increases in prevalence of use (4.2% and 7%, respectively).<br />
As expected, however, significant decreases in PMPY cost were seen in therapy classes that had<br />
major new generics introduced in 2006 or <strong>2007</strong>. In fact, four therapy classes — antihyperlipidemics,<br />
antidepressants, calcium blockers and NSAIDs — had negative PMPY cost trend, ranging from<br />
-3.3% to more than -12%.<br />
6 express scripts <strong>2007</strong> drug trend report
Exhibit 5<br />
Top 20 Nonspecialty Therapy Classes 2006 to <strong>2007</strong><br />
Ranked by <strong>2007</strong> PMPY Cost<br />
PMPY Cost<br />
Cost per Rx (Common <strong>Drug</strong>s)<br />
Therapy Class 2006 <strong>2007</strong> <strong>Trend</strong> 2006 <strong>2007</strong> <strong>Trend</strong><br />
1 Antihyperlipidemics $ 91.53 $ 83.32 -9.0% $ 79.48 $ 67.32 -15.3%<br />
2 Gastrointestinals $ 62.50 $ 63.09 1.0% $100.38 $ 99.19 -1.2%<br />
3 Antidepressants $ 58.88 $ 56.91 -3.3% $ 62.08 $ 58.17 -6.3%<br />
4 Antidiabetics $ 42.67 $ 49.50 16.0% $ 65.23 $ 73.55 12.8%<br />
5 Antiasthmatics $ 40.65 $ 45.82 12.7% $ 83.65 $ 92.17 10.2%<br />
6 Antihypertensives $ 41.20 $ 45.19 9.7% $ 33.70 $ 35.73 6.0%<br />
7 Anticonvulsants $ 27.36 $ 31.88 16.6% $ 96.98 $105.82 9.1%<br />
8 Narcotic Analgesics $ 23.54 $ 27.00 14.7% $ 39.20 $ 43.03 9.8%<br />
9 Dermatologicals $ 20.83 $ 22.89 9.9% $ 65.04 $ 70.68 8.7%<br />
10 Antivirals $ 18.56 $ 21.27 14.6% $214.50 $234.76 9.4%<br />
11 Stimulants/Antiobesity $ 17.23 $ 19.24 11.7% $112.96 $120.81 6.9%<br />
12 Misc. Endocrines $ 17.72 $ 18.33 3.5% $ 73.59 $ 78.83 7.1%<br />
13 Antipsychotics $ 14.50 $ 16.67 15.0% $172.49 $190.07 10.2%<br />
14 Contraceptives $ 14.53 $ 16.12 11.0% $ 29.68 $ 31.97 7.7%<br />
15 Antihistamines $ 15.38 $ 15.49 0.7% $ 49.92 $ 50.13 0.4%<br />
16 Beta Blockers $ 15.12 $ 15.38 1.7% $ 23.73 $ 23.49 -1.0%<br />
17 Calcium Blockers $ 15.16 $ 13.28 -12.4% $ 43.32 $ 38.12 -12.0%<br />
18 NSAIDs $ 14.97 $ 13.16 -12.1% $ 44.45 $ 39.26 -11.7%<br />
19 Misc. Hematologicals $ 11.45 $ 12.56 9.7% $101.06 $106.04 4.9%<br />
20 Decongestants $ 12.14 $ 12.26 1.0% $ 59.89 $ 59.71 -0.3%<br />
Top 20 $575.92 $599.38 4.1% $ 62.00 $ 62.54 0.9%<br />
Others $186.84 $199.38 6.7% $ 37.12 $ 38.99 5.1%<br />
Total $762.76 $798.76 4.7% $ 53.25 $ 54.34 2.0%<br />
<strong>Trend</strong><br />
Price Inflation<br />
Price inflation reflects the impact of changes in pharmaceutical manufacturers’ unit prices. Actual<br />
ingredient costs including discounts but excluding rebates are represented. After three years of decreases,<br />
overall price inflation began to climb from a rate of 4.3% in 2006 to 5% in <strong>2007</strong>. Among the top 20<br />
nonspecialty classes, 12 had price increases above the overall price inflation.<br />
As in previous years, price inflation for branded products (7.4%) was dramatically higher than the<br />
generic inflation rate (-3.1%). Therapy classes with double-digit brand-price inflation included<br />
dermatologicals (13.5%), contraceptives (10.7%) and narcotic analgesics (10.6%).<br />
express scripts <strong>2007</strong> drug trend report 7
As shown in Exhibit 6, narcotic analgesics was the only class that had double-digit price inflation for<br />
both brand and generics from 2006 to <strong>2007</strong>. The main contributor was one drug, OxyContin ® , which is<br />
regaining brand-only status after court decisions forced its generics off the market.<br />
Pushing the generic inflation rate lower were a number of therapy classes, including<br />
antihyperlipidemics (-38.4%) and antidepressants (-14.9%), which experienced patent<br />
expirations in 2006. However, the full price decreases of the generics were felt in <strong>2007</strong><br />
when the first generic products lost market exclusivity, and competition increased. Generic<br />
price also dropped by double digits for gastrointestinals (-14%), which felt the effect of<br />
greater price reductions for omeprazole (generic Prilosec ® ).<br />
<strong>Trend</strong><br />
Exhibit 6<br />
Brand and Generic Price Changes for Top 20 Nonspecialty Therapy Classes 2006 to <strong>2007</strong><br />
Ranked by Total Percent Change<br />
Price % Change<br />
Therapy Class Brand Generic Total<br />
1 Narcotic Analgesics 10.6% 22.6% 20.2%<br />
2 Antihypertensives 7.7% 10.7% 8.4%<br />
3 Antiasthmatics 7.4% 17.9% 8.0%<br />
4 Stimulants/Antiobesity 9.5% -10.0% 7.9%<br />
5 Antipsychotics 8.1% -2.7% 7.7%<br />
6 Antidiabetics 7.6% 6.8% 7.5%<br />
7 Beta Blockers 5.0% 14.9% 7.3%<br />
8 Dermatologicals 13.5% -7.3% 7.3%<br />
9 Contraceptives 10.7% 3.5% 7.2%<br />
10 Antivirals 7.1% -0.9% 6.8%<br />
11 Anticonvulsants 9.5% -5.6% 6.6%<br />
12 Misc. Endocrines 6.3% -9.3% 5.3%<br />
13 Decongestants 8.5% -4.0% 5.0%<br />
14 Calcium Blockers 8.9% -2.5% 4.5%<br />
15 Antihistamines 9.3% -4.0% 3.8%<br />
16 Gastrointestinals 5.0% -14.0% 2.2%<br />
17 Antidepressants 8.7% -14.9% 1.9%<br />
18 NSAIDs 7.1% -7.6% 1.7%<br />
19 Misc. Hematologicals 0.6% -5.2% -1.2%<br />
20 Antihyperlipidemics 4.4% -38.4% -2.0%<br />
Total 7.4% -3.1% 5.0%<br />
Brand/Generic Mix<br />
Brand/Generic mix measures the percentage of change in per-prescription costs due to changes in<br />
the relative percentages of brand-name drugs and generics within classes. Movement from brands to<br />
generics drives down trend for brand/generic mix; and, less frequently, changes from generics to brands<br />
increase it.<br />
8 express scripts <strong>2007</strong> drug trend report
Major generic introductions slowed, with only two blockbuster drugs — Ambien ® (a hypnotic) and<br />
Norvasc ® (a calcium blocker) — losing patent protection in <strong>2007</strong>. The impact of 2006 patent expirations<br />
continued to drive greater use of generic medications, however, resulting in an overall -4.4% trend in <strong>2007</strong>.<br />
The impact of generics for Norvasc, the fifth-best-selling prescription drug in the U.S. in 2006, drove down<br />
the brand/generic mix for calcium blockers by 15.8%. Beta blockers, NSAIDs and antidepressants also<br />
had double-digit negative percent changes in brand/generic mix.<br />
The phaseout of generics for Plavix ® resulted in an unusual increase in brand/generic mix of 5% for the<br />
miscellaneous hematologicals class. In 2008, a similar withdrawal of generics for OxyContin will cause<br />
a positive brand/generic mix for narcotic analgesics.<br />
Exhibit 7<br />
Changes in Brand/Generic Mix for Top 20 Nonspecialty Therapy Classes 2006 to <strong>2007</strong><br />
Ranked by Percent Change<br />
Therapy Class Key Generic Introductions % Change<br />
1 Calcium Blockers Norvasc ® (3/<strong>2007</strong>), Verelan ® PM (8/<strong>2007</strong>) -15.8%<br />
2 Beta Blockers Inderal ® LA (1/<strong>2007</strong>), Toprol-XL ® (7/<strong>2007</strong>), Coreg ® (9/<strong>2007</strong>) -11.2%<br />
3 NSAIDs Arava ® (9/2005), Mobic ® (7/2006) -10.8%<br />
4 Antidepressants Zoloft ® (8/2006), Effexor ® (8/2006), Wellbutrin XL ® 300mg<br />
(12/2006)<br />
-10.7%<br />
5 Antihyperlipidemics Pravachol ® (4/2006), Zocor ® (6/2006), Colestid ® (10/2006) -9.1%<br />
6 Narcotic Analgesics Duragesic ® (1/2005), Ultracet ® (4/2005), OxyContin ® * (6/2005),<br />
Actiq ® (9/2006), Combunox ® (11/<strong>2007</strong>)<br />
-7.0%<br />
7 Decongestants Flonase ® (3/2006) -4.1%<br />
8 Contraceptives Ovcon ® 35 (10/2006), Estrostep ® Fe (10/<strong>2007</strong>) -1.9%<br />
9 Antihypertensives Univasc ® (12/2006), Mavik ® (2/<strong>2007</strong>), Uniretic ® (3/<strong>2007</strong>),<br />
Lotrel ® (5/<strong>2007</strong>), Altace ® (12/<strong>2007</strong>)<br />
-1.8%<br />
10 Dermatologicals Elocon ® (3/2005) -1.5%<br />
11 Anticonvulsants Lamictal ® 5mg and 25mg chewable (4/2005), Zonegran ®<br />
(12/2005), Cerebyx ® (8/<strong>2007</strong>), Trileptal ® (10/<strong>2007</strong>)<br />
-0.7%<br />
12 Antihistamines Allegra ® (9/2005), Zyrtec ® (12/<strong>2007</strong>) -0.7%<br />
13 Misc. Endocrines DDAVP ® Tablets (7/2005) -0.6%<br />
14 Stimulants/Antiobesity Focalin ® (6/<strong>2007</strong>), Adipex-P ® (8/<strong>2007</strong>) -0.3%<br />
15 Gastrointestinals Protonix ® (12/<strong>2007</strong>) -0.2%<br />
16 Antivirals Retrovir ® (9/2005), Copegus ® (12/2005), Famvir ® (9/<strong>2007</strong>) -0.2%<br />
17 Antipsychotics N/A -0.2%<br />
18 Antidiabetics Metaglip ® (10/2005), Amaryl ® (10/2005) -0.2%<br />
19 Antiasthmatics DuoNeb ® (7/<strong>2007</strong>), AccuNeb ® (9/<strong>2007</strong>) -0.1%<br />
20 Misc. Hematologicals Plavix ® * (8/2006) 5.0%<br />
Top 20 -4.2%<br />
Others -4.8%<br />
Total -4.4%<br />
* Generics later removed from the market<br />
<strong>Trend</strong><br />
express scripts <strong>2007</strong> drug trend report 9
Utilization<br />
For nonspecialty drugs, the 2.5% overall utilization increase was consistent with the 2.2% change from<br />
2005 to 2006. Prevalence (the proportion of users within the population) increased only 0.7%; virtually<br />
unchanged from the 1% increase for 2006. Intensity (treatment duration) increased 1.8% compared to<br />
1.2% in 2006.<br />
The highest utilization growth rates among the top 20 nonspecialty classes were antihyperlipidemics<br />
(7.5%) and anticonvulsants (6.8%). Increased use of lower-cost generics caused the growth in<br />
antihyperlipidemics; greater prevalence was the main growth factor for anticonvulsants. Miscellaneous<br />
hematologicals, antivirals and narcotic analgesics each had utilization increases of 4.5%. Driving greater<br />
use in the miscellaneous hematologicals class was Plavix, which increased market share from 57% to<br />
74%. Generic Plavix was launched at risk in 2006, but it was removed from the market after litigation.<br />
Utilization decreased in four of the top 20 nonspecialty classes, with miscellaneous endocrines seeing the<br />
largest decline (-3.4%). This therapy class includes bisphosphonates, which continued their year-overyear<br />
decline — largely due to concerns over possible side effects and difficulty in taking the drugs.<br />
<strong>Trend</strong><br />
Exhibit 8<br />
Utilization of Common <strong>Drug</strong>s for Top 20 Nonspecialty Therapy Classes 2006 to <strong>2007</strong><br />
Ranked by Total Percent Change<br />
Prescriptions PMPY<br />
% Change<br />
Therapy Class 2006 <strong>2007</strong> Prevalence Intensity Total<br />
1 Antihyperlipidemics 1.15 1.24 4.8% 2.5% 7.5%<br />
2 Anticonvulsants 0.28 0.30 7.0% -0.1% 6.8%<br />
3 Misc. Hematologicals 0.11 0.12 0.3% 4.2% 4.5%<br />
4 Antivirals 0.09 0.09 2.1% 2.4% 4.5%<br />
5 Narcotic Analgesics 0.60 0.63 2.4% 2.0% 4.5%<br />
6 Antipsychotics 0.08 0.09 0.9% 2.7% 3.6%<br />
7 Stimulants/Antiobesity 0.15 0.16 3.3% 0.2% 3.5%<br />
8 Antidepressants 0.95 0.98 1.0% 2.1% 3.1%<br />
9 Contraceptives 0.49 0.50 1.4% 1.5% 3.0%<br />
10 Antihypertensives 1.22 1.26 3.3% -0.4% 2.9%<br />
11 Beta Blockers 0.64 0.65 1.6% 1.1% 2.7%<br />
12 Antidiabetics 0.65 0.67 4.2% -1.9% 2.2%<br />
13 Antiasthmatics 0.49 0.50 0.8% 1.5% 2.2%<br />
14 Gastrointestinals 0.62 0.64 1.1% 1.0% 2.2%<br />
15 Decongestants 0.20 0.21 0.5% 0.8% 1.3%<br />
16 Dermatologicals 0.32 0.32 0.8% 0 0.9%<br />
17 Antihistamines 0.31 0.31 -1.1% 1.0% -0.1%<br />
18 Calcium Blockers 0.35 0.35 -0.4% -0.1% -0.5%<br />
19 NSAIDs 0.34 0.34 0.9% -1.4% -0.6%<br />
20 Misc. Endocrines 0.24 0.23 -4.7% 1.4% -3.4%<br />
Top 20 9.29 9.58 2.1% 0.9% 3.1%<br />
Others 5.03 5.10 -2.0% 3.5% 1.4%<br />
Total 14.32 14.68 0.7% 1.8% 2.5%<br />
10 express scripts <strong>2007</strong> drug trend report
Age<br />
One of the most important factors in utilization is age. As an individual ages, the risk of chronic disease<br />
increases, and the need for prescription medications usually goes up as well. Consequently, spend is<br />
highest among older members. However, although PMPY spending increased across all age groups from<br />
2006 to <strong>2007</strong>, total trend for members aged 65 and older (4%) was actually lower than trend for children<br />
up to the age of 17 (6%) and adults aged 18 years to 44 years (5.5%), as shown in Exhibit 9.<br />
Exhibit 9<br />
PMPY Spending by Age Group 2006 to <strong>2007</strong><br />
Total<br />
<strong>Trend</strong> = 4.7%<br />
65+<br />
<strong>Trend</strong> = 4%<br />
Age Group<br />
45 to 64<br />
<strong>Trend</strong> = 3.3%<br />
<strong>2007</strong><br />
18 to 44<br />
<strong>Trend</strong> = 5.5%<br />
2006<br />
0 to 17<br />
<strong>Trend</strong> = 6%<br />
$0 $500 $1,000 $1,500 $2,000 $2,500<br />
PMPY Spending<br />
The mix of therapy classes also varies with age. Looking across the generations presents a very different<br />
picture of the primary drivers of trend and reflects the conditions most affecting each age group. Although<br />
younger individuals tend to use more acute-care drugs, such as antibiotics, chronic conditions are<br />
becoming more prevalent at earlier ages. Exhibits 10 and 11 show the top 10 therapy classes shaping<br />
trend across the various age groups.<br />
<strong>Trend</strong><br />
For children aged 0 to 17 years, the top therapy classes driving <strong>2007</strong> trend were for asthma, attention<br />
deficit and attention deficit hyperactivity disorders, and skin conditions. Negative trend was seen only<br />
in penicillins and macrolides. As the use of chronic medications grows among children and adolescents,<br />
therapies affecting trend in this age group will change.<br />
PMPY <strong>2007</strong> trend among adults aged 18 years to 44 years increased by double digits for six of the<br />
top 10 classes for the age group. PMPY trend was down for antidepressants, gastrointestinals<br />
and antihyperlipidemics.<br />
express scripts <strong>2007</strong> drug trend report 11
Exhibit 10<br />
Top 10 Nonspecialty Therapy Classes for Ages 0 to 17 and Ages 18 to 44<br />
Ranked by <strong>2007</strong> PMPY Cost<br />
Therapy Class<br />
Ages 0 to 17 Ages 18 to 44<br />
PMPY<br />
Cost<br />
<strong>2007</strong> <strong>2007</strong><br />
<strong>Trend</strong><br />
Therapy Class<br />
PMPY<br />
Cost<br />
<strong>Trend</strong><br />
1 Antiasthmatics $40.94 11.2% 1 Antidepressants $50.10 -5.6%<br />
2 Stimulants/Antiobesity $34.70 8.9% 2 Contraceptives $37.71 11.1%<br />
3 Dermatologicals $19.17 7.5% 3 Anticonvulsants $30.68 18.6%<br />
4 Antipsychotics $13.29 13.2% 4 Gastrointestinals $28.92 -1.6%<br />
5 Cephalosporins $11.81 3.1% 5 Antivirals $24.86 11.3%<br />
6 Anticonvulsants $11.78 5.8% 6 Antiasthmatics $23.45 12.8%<br />
7 Antihistamines $10.63 3.4% 7 Dermatologicals $21.83 9.9%<br />
8 Penicillins $ 8.42 -8.1% 8 Narcotic Analgesics $21.03 13.3%<br />
9 Macrolides $ 6.67 -7.2% 9 Antidiabetics $17.29 13.7%<br />
10 Gastrointestinals $ 6.07 8.9% 10 Antihyperlipidemics $16.65 -9.2%<br />
For adults aged 45 years to 64 years, PMPY cost trend decreased for the top three therapy classes:<br />
antihyperlipidemics, gastrointestinals and antidepressants. Costs grew at double digits for antidiabetics,<br />
antiasthmatics, narcotic analgesics, anticonvulsants and antivirals.<br />
<strong>Trend</strong><br />
A similar pattern was seen among adults aged 65 years and older, with costs increasing for every class<br />
except antihyperlipidemics, antidepressants and calcium blockers. PMPY cost trend grew by double digits<br />
for antihypertensives, antidiabetics and antiasthmatics.<br />
Exhibit 11<br />
Top 10 Nonspecialty Therapy Classes for Ages 45 to 64 and Ages 65 and Older<br />
Ranked by <strong>2007</strong> PMPY Cost<br />
Therapy Class<br />
Ages 45 to 64<br />
PMPY<br />
Cost<br />
Ages 65 and Older<br />
<strong>2007</strong> <strong>2007</strong><br />
<strong>Trend</strong><br />
Therapy Class<br />
PMPY<br />
Cost<br />
<strong>Trend</strong><br />
1 Antihyperlipidemics $162.73 -9.4% 1 Antihyperlipidemics $303.02 -10.7%<br />
2 Gastrointestinals $110.95 -0.1% 2 Gastrointestinals $188.02 1.4%<br />
3 Antidepressants $ 98.59 -2.5% 3 Antihypertensives $168.31 10.4%<br />
4 Antidiabetics $ 93.92 14.6% 4 Antidiabetics $148.00 17.1%<br />
5 Antihypertensives $ 84.49 8.1% 5 Antiasthmatics $114.99 13.8%<br />
6 Antiasthmatics $ 56.85 12.0% 6 Misc. Endocrines $ 92.88 3.7%<br />
7 Narcotic Analgesics $ 49.68 13.6% 7 Misc. Hematologicals $ 73.25 6.4%<br />
8 Anticonvulsants $ 45.67 15.6% 8 Antidepressants $ 71.70 -1.5%<br />
9 Antivirals $ 34.13 16.4% 9 Beta Blockers $ 69.44 2.8%<br />
10 Misc. Endocrines $ 29.02 0.9% 10 Calcium Blockers $ 64.09 -11.2%<br />
12 express scripts <strong>2007</strong> drug trend report
Gender<br />
The use of prescription drugs also varies by gender. Females are more likely than males to use<br />
prescription drugs. Additionally, females use more prescription drugs — with females in our <strong>2007</strong><br />
sample averaging 16.7 prescriptions PMPY, compared to 12.6 for males.<br />
Although not as dramatic as the differences among age groups, both PMPY spending and trend differed<br />
for males and females. On average, female spend was about 20% higher than male spend, and females<br />
had a trend of 5.1%, compared to 4.4% for males.<br />
Exhibit 12<br />
PMPY Spending and <strong>Trend</strong> for Females and Males 2006 to <strong>2007</strong><br />
Females<br />
<strong>Trend</strong> = 5.1%<br />
Males<br />
<strong>Trend</strong> = 4.4%<br />
<strong>2007</strong> PMPY<br />
2006 PMPY<br />
$0 $200<br />
$400 $600 $800 $1,000<br />
Eight of the top 10 nonspecialty therapy classes for females also were among the top 10 for males. In the<br />
top 10 for females — but not for males — were miscellaneous endocrines and contraceptives. In the top<br />
10 for males only were antivirals and stimulants/antiobesity agents. The mix and contribution to trend<br />
differed, as shown in Exhibit 13.<br />
<strong>Trend</strong><br />
Exhibit 13<br />
Top 10 Nonspecialty Therapy Classes for Females and Males<br />
Ranked by <strong>2007</strong> PMPY Cost<br />
Therapy Class<br />
Females<br />
PMPY<br />
Cost<br />
Males<br />
<strong>2007</strong> <strong>2007</strong><br />
<strong>Trend</strong><br />
Therapy Class<br />
PMPY<br />
Cost<br />
<strong>Trend</strong><br />
1 Antidepressants $78.30 -2.6% 1 Antihyperlipidemics $101.46 -7.9%<br />
2 Gastrointestinals $68.81 1.1% 2 Antidiabetics $ 57.41 16.0%<br />
3 Antihyperlipidemics $66.26 -10.6% 3 Gastrointestinals $ 56.98 0.8%<br />
4 Antiasthmatics $49.13 11.9% 4 Antihypertensives $ 49.20 9.6%<br />
5 Antidiabetics $42.05 15.8% 5 Antiasthmatics $ 42.28 13.8%<br />
6 Antihypertensives $41.41 9.6% 6 Antidepressants $ 34.12 -4.8%<br />
7 Anticonvulsants $39.87 19.0% 7 Antivirals $ 26.80 13.8%<br />
8 Misc. Endocrines $31.45 2.4% 8 Narcotic Analgesics $ 24.70 11.7%<br />
9 Contraceptives $31.19 -2.6% 9 Anticonvulsants $ 23.37 -7.9%<br />
10 Narcotic Analgesics $29.16 1.1% 10 Stimulants/Antiobesity $ 22.30 16.0%<br />
express scripts <strong>2007</strong> drug trend report 13
New <strong>Drug</strong>s<br />
In <strong>2007</strong>, the contribution of new drugs to overall nonspecialty trend was only 0.1%, the lowest since 1993,<br />
when <strong>Express</strong> <strong>Scripts</strong> started tracking trend.<br />
The low number of U.S. Food and <strong>Drug</strong> Administration (FDA) approvals seen since 2005 continued, with<br />
only 17 new molecular entities and two new biological agents approved during the year.<br />
Janumet ® accounted for more than one-quarter of market share among new drugs and 2.4% of market<br />
share for antidiabetics. The second-place nonspecialty drug, Vyvanse , contributed only 0.9% of market<br />
share to the stimulants/antiobesity class.<br />
<strong>Trend</strong><br />
Exhibit 14<br />
Top 10 New Nonspecialty Prescription <strong>Drug</strong>s of <strong>2007</strong><br />
Ranked by PMPY Cost<br />
Brand Name Generic Name Therapy Class PMPY % New <strong>Drug</strong><br />
1 Janumet ® sitagliptin and Antidiabetics $0.29 27.1%<br />
metformin<br />
2 Vyvanse lisdexamfetamine Stimulants/Antiobesity $0.16 14.9%<br />
3 Invega ® paliperidone Antipsychotics $0.13 11.6%<br />
4 Tekturna ® aliskiren Antihypertensives $0.12 10.9%<br />
5 Exforge ® amlodipine and Antihypertensives $0.10 9.6%<br />
valsartan<br />
6 Xyzal ® levocetirizine Antiallergics $0.05 5.1%<br />
7 Altabax retapamulin Dermatologicals $0.04 4.1%<br />
8 Neupro ® rotigotine Antiparkinson Agents $0.04 3.5%<br />
9 Isentress ® raltegravir Antivirals $0.02 2.1%<br />
10 Brovana ® arformoterol Antiasthmatics $0.02 2.1%<br />
Top 10 $0.99 91.0%<br />
Others $0.10 9.0%<br />
Total $1.08 100.0%<br />
Cost<br />
Although new drugs typically do not contribute a significant amount to total PMPY cost or utilization,<br />
Exhibit 15 shows the cumulative effect of new drugs over time. Blockbuster drugs introduced in 1995<br />
(Fosamax ® , Prevacid ® , Valtrex ® and Zyrtec ® ) and 1996 (Allegra ® , Diovan ® , Lipitor ® and Topamax ® )<br />
accounted for 14% of <strong>2007</strong> costs. More than 75% of prescriptions in <strong>2007</strong> were filled with drugs<br />
introduced in 1994 or earlier. In contrast, drugs introduced between 2002 and 2006 represented<br />
only 10.3% of costs and 5% of prescriptions in <strong>2007</strong>.<br />
14 express scripts <strong>2007</strong> drug trend report
Exhibit 15<br />
Impact of New <strong>Drug</strong>s on <strong>2007</strong> Cost and Utilization<br />
Percent of <strong>2007</strong> Cost<br />
100%<br />
90%<br />
80%<br />
70%<br />
60%<br />
50%<br />
40%<br />
30%<br />
20%<br />
10%<br />
0<br />
Percent of <strong>2007</strong> Prescriptions<br />
100%<br />
90%<br />
80%<br />
70%<br />
60%<br />
50%<br />
40%<br />
30%<br />
20%<br />
10%<br />
0<br />
2004-<strong>2007</strong><br />
2001-2003<br />
1998-2000<br />
1995-1997<br />
1994 and Before<br />
Member Cost <strong>Trend</strong><br />
The change in per-prescription costs is shared proportionally by both plan sponsors and members through<br />
year-to-year changes in member copayments. To examine how the per-prescription cost increases were<br />
being shared by members and plan sponsors, we segmented the per-prescription cost trend by member<br />
cost and net plan sponsor cost. Because member cost for specialty medications is typically much lower<br />
as a proportion than member cost for nonspecialty medications, we examined nonspecialty, specialty<br />
and total per-prescription cost trends separately.<br />
If plan sponsors were attempting to control costs by shifting a greater proportion of costs to members<br />
through increased member cost, the overall trend for plan sponsors would be lower relative to member<br />
per-prescription share. However, from 2006 to <strong>2007</strong>, member share of per-prescription costs remained<br />
relatively flat, decreasing by 0.4% for nonspecialty and increasing by 0.3% for specialty.<br />
<strong>Trend</strong><br />
Exhibit 16<br />
Changes in Member and Plan Sponsor Per-Prescription Costs 2006 to <strong>2007</strong>*<br />
Nonspecialty Specialty Total<br />
Member Cost -0.4% 0.3% -0.3%<br />
+ Plan Sponsor Cost 2.5% 8.3% 3.2%<br />
= Cost per Prescription 2.1% 8.6% 2.9%<br />
X Utilization 2.6% 5.0% 2.6%<br />
= All <strong>Drug</strong>s 4.7% 14.0% 5.5%<br />
* The percentage contribution of each factor may not total the All <strong>Drug</strong>s percentage increase because the total is<br />
multiplicative, not additive. Final results may differ due to rounding.<br />
Influencing the negative cost-per-prescription trend for members was the brand/generic mix. Members<br />
saved an average of $15 per prescription when they moved from a brand to a generic. Although plan<br />
sponsors saved as well, given inflation and therapeutic-mix trends, plan sponsors paid a higher overall<br />
portion of total cost in <strong>2007</strong> compared to 2006. Total cost includes administrative fees, taxes and<br />
dispensing fees.<br />
Exhibit 17 on the next page shows that member cost as a proportion of total prescription cost decreased<br />
from 24.5% to 23.6% for nonspecialty medications. Proportionally, member cost of total specialty costs<br />
remained the same — leading to a reduction of approximately one percentage point in the proportion of<br />
total prescription cost paid by members from 2006 to <strong>2007</strong>.<br />
express scripts <strong>2007</strong> drug trend report 15
Exhibit 17<br />
Changes in Member and Plan Sponsor Total Cost Percentages 2006 to <strong>2007</strong><br />
% Total Cost<br />
Nonspecialty Specialty Total<br />
2006 <strong>2007</strong> 2006 <strong>2007</strong> 2006 <strong>2007</strong><br />
Member Share 24.5% 23.6% 2.6% 2.6% 22.5% 21.6%<br />
Plan Sponsor Share 75.5% 76.4% 97.4% 97.4% 77.5% 78.4%<br />
Total 100.0% 100.0% 100.0% 100.0% 100.0% 100.0%<br />
Managing <strong>Trend</strong><br />
Even though member cost decreased slightly in <strong>2007</strong>, prescription costs can be a significant financial<br />
burden for some members. By promoting the use of lower-cost agents, such as generics, plan sponsors<br />
can maintain a fair share of the total costs, while ensuring clinically appropriate drug therapies and<br />
helping members lower their out-of-pocket expenses. <strong>Express</strong> <strong>Scripts</strong> believes that plan sponsors have<br />
unprecedented opportunities to benefit from generic savings by increasing generic fill rates (GFRs),<br />
implementing Step Therapy and targeting member communications.<br />
<strong>Trend</strong><br />
Generic Savings Opportunities Remain Strong<br />
Although generic utilization is at an all-time high, there is still “room to run” with regard to nonspecialty<br />
generic opportunities. Even in the generics-rich therapy classes, GFRs can be increased — by more than<br />
50 percentage points in some classes. Maximizing the GFR in a few strategic therapy classes could result<br />
in as much as $20 billion in savings for plan sponsors and members, as calculated by <strong>Express</strong> <strong>Scripts</strong><br />
researchers and shown in Exhibit 18.<br />
Exhibit 18<br />
Potential Savings From Maximized Generic Fill Rates<br />
Therapy Class<br />
<strong>2007</strong> Generic Fill Rate<br />
Actual<br />
Potential<br />
Potential Savings<br />
(in $ Thousands)<br />
Gastrointestinals 38.6% 95% $ 5,659,682<br />
Antihyperlipidemics 37.9% 80% $ 4,584,257<br />
Antidepressants 66.8% 88% $ 2,680,877<br />
Antihypertensives 58.9% 83% $ 2,340,994<br />
Anticonvulsants 51.6% 73% $ 1,421,269<br />
Antidiabetics 55.1% 60% $ 593,507<br />
Hypnotics 47.9% 70% $ 559,912<br />
Beta Blockers 76.8% 89% $ 495,529<br />
Antihistamines 55.3% 95% $ 491,421<br />
Systemic and Topical<br />
Nasal Products<br />
46.4% 90% $ 474,027<br />
Contraceptives 63.3% 90% $ 405,622<br />
Narcotic Analgesics 95.5% 97% $ 259,044<br />
Antipsychotics 26.7% 30% $ 123,636<br />
Total $20,089,778<br />
16 express scripts <strong>2007</strong> drug trend report
Impact of Step Therapy<br />
Plan sponsors can save in a number of ways from increased use of generics. For therapy classes<br />
that include comparable drugs, our Step Therapy programs encourage the use of effective, low-cost<br />
prescription drugs, still allowing for movement to higher-cost therapies, if needed.<br />
Beginning in 2006, plan sponsors had exceptional opportunities to curb costs by using Step Therapy<br />
in two nonspecialty classes — hypnotics and antihyperlipidemics. Plan sponsors implementing a<br />
Step Therapy program in the hypnotics therapy class took advantage of generics for Ambien to realize a<br />
fourfold reduction in therapy-class trend, compared to plan sponsors that did not implement hypnotics<br />
Step Therapy. Plan sponsors initiating Step Therapy for antihyperlipidemics tripled their decrease in trend,<br />
compared to plan sponsors without Step Therapy for the class, as shown in Exhibit 19.<br />
Exhibit 19<br />
Impact of Implementing Step Therapy on PMPY Cost 2006 to <strong>2007</strong><br />
Hypnotics<br />
antihyperlipidemics<br />
0<br />
0<br />
<strong>Trend</strong><br />
-2%<br />
-4%<br />
-6%<br />
-8%<br />
-10%<br />
-12%<br />
-14%<br />
-16%<br />
-18%<br />
Step Therapy (96 Plans)<br />
<strong>Trend</strong><br />
-2%<br />
-4%<br />
-6%<br />
-8%<br />
-10%<br />
-12%<br />
-14%<br />
Step Therapy (188 Plans)<br />
<strong>Trend</strong><br />
No Step Therapy (947 Plans)<br />
No Step Therapy (855 Plans)<br />
All Plans<br />
All Plans<br />
Taking Advantage of Generic Opportunities One Consumer at a Time<br />
Another way to take advantage of the generic opportunity is by engaging members and informing them<br />
about their savings opportunities. A prime example occurred within the antihyperlipidemics class.<br />
Anticipating that generics would be introduced for Zocor ® in mid-2006, <strong>Express</strong> <strong>Scripts</strong> removed Lipitor<br />
from its formulary at the end of 2005.<br />
On Oct. 1, 2005, a targeted communications strategy was launched to inform appropriate members of<br />
lower-cost options for Lipitor. Selected members were continuously eligible for all of 2005 and 2006 under<br />
a commercial plan sponsor with a flat three-tiered prescription-drug benefit. They all had filled at least<br />
one Lipitor prescription between June 1 and Nov. 15, 2005, and their plan sponsors had removed Lipitor<br />
from their formularies. The case group — members in plans that used targeted communications —<br />
included 165,758 individuals. A control group consisted of 201,233 members that did not receive<br />
targeted communications.<br />
Formulary notification letters were sent to all members in the case group. Reinforcement was provided<br />
through consistently framed messages on the <strong>Express</strong> <strong>Scripts</strong> member website and through a tollfree<br />
phone line. Members using Home Delivery received additional information with their last Lipitor<br />
prescriptions of 2005 and in automated refill reminder calls.<br />
express scripts <strong>2007</strong> drug trend report 17
The adjusted rate of switching to a preferred formulary alternative for members in the control group was<br />
approximately 15%. As shown in Exhibit 20, the adjusted switch rates for members enrolled in the case<br />
group were nearly two times greater (28%) through participating pharmacies and almost three times<br />
greater (43%) through Home Delivery.<br />
Exhibit 20<br />
Effect of Consistently Framed Communications<br />
Formulary<br />
Change Only<br />
Plus Targeted<br />
Messaging<br />
Participating Pharmacies<br />
and Home Delivery<br />
Participating Pharmacies<br />
Home Delivery<br />
Plus Targeted<br />
Messaging<br />
0 10%<br />
20% 30% 40% 50%<br />
Percent Switching to a Preferred Formulary Alternative<br />
<strong>Trend</strong><br />
Specialty-<strong>Drug</strong> <strong>Trend</strong><br />
In <strong>2007</strong>, the 14% increase in specialty-drug spend was attributed to three factors:<br />
1. Increased utilization was responsible for 60.4%.<br />
2. Increased costs contributed 34.7%.<br />
3. New medications added 4.9%.<br />
In some specialty therapy classes, such as inflammatory conditions, trend was driven primarily by more<br />
patients who used prescription drugs in the class. Increased utilization resulted not only from a greater<br />
number of indications that biologic medications can treat, but also from the increasing number of<br />
specialty medications that are shifting from medical benefits. In the cancer category, for instance,<br />
new oral therapies that are covered by the prescription-drug benefit have replaced some injectable<br />
drugs that normally are paid through the medical benefit.<br />
Increases in cost were the second-largest factor in specialty trend. In almost all the specialty therapy<br />
classes detailed in the Therapy Class Review section, price increases by the manufacturer or distributor<br />
contributed heavily to trend. For instance, the average cost for a prescription to treat multiple sclerosis<br />
jumped from $1,470 in 2006 to $1,647 in <strong>2007</strong>.<br />
As shown in Exhibit 21, only a few specialty drugs were approved in <strong>2007</strong>. Typically, new specialty<br />
products have more impact on trend than new nonspecialty drugs. For example, only two new specialty<br />
products — Letairis , to treat pulmonary arterial hypertension, and the anticancer agent Tykerb ® —<br />
gave rise to almost 5% of specialty trend in <strong>2007</strong>.<br />
18 express scripts <strong>2007</strong> drug trend report
Exhibit 21<br />
Specialty <strong>Drug</strong>s Approved in <strong>2007</strong><br />
<strong>Drug</strong> Indication Month of Approval<br />
Hycamtin ® capsules Small-cell lung cancer October<br />
Ixempra Breast cancer December<br />
Kuvan Phenylketonuria October<br />
Letairis Pulmonary arterial hypertension June<br />
Reclast ® Osteoporosis, Paget’s disease of bone August<br />
Soliris ® Paroxysmal nocturnal hemoglobinuria March<br />
Somatuline ® Depot Acromegaly August<br />
Supprelin ® LA Central precocious puberty May<br />
Tasigna ®<br />
Philadelphia chromosome-positive chronic<br />
October<br />
myelogenous leukemia<br />
Torisel ® Renal cell carcinoma May<br />
Tykerb ®<br />
Breast cancer (HER2 positive) in combination<br />
with Xeloda ®<br />
March<br />
Brand/Generic mix continues to be one cost driver that cannot help specialty classes in the same ways<br />
that it affects nonspecialty. The lack of pathways for manufacturing generic biologics remains a barrier<br />
for the number of generic opportunities available to specialty-drug patients. <strong>Express</strong> <strong>Scripts</strong> continues to<br />
work with Congress, the FDA and a coalition of payers and employers to develop an approval pathway for<br />
generic biotech drugs.<br />
<strong>Trend</strong><br />
express scripts <strong>2007</strong> drug trend report 19
Notes<br />
<strong>Trend</strong><br />
20 express scripts <strong>2007</strong> drug trend report