


Create successful ePaper yourself
Turn your PDF publications into a flip-book with our unique Google optimized e-Paper software.
Section 3.3 Equations of Lines 283<br />
3.3 <strong>Exercises</strong><br />
In <strong>Exercises</strong> 1-6, perform each of the<br />
following tasks for the given linear function.<br />
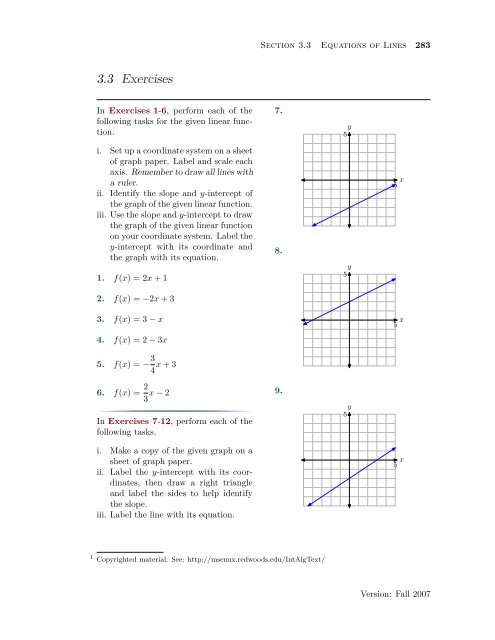
7.<br />
y<br />
5<br />
i. Set up a coordinate system on a sheet<br />
of graph paper. Label and scale each<br />
axis. Remember to draw all lines <strong>with</strong><br />
a ruler.<br />
ii. Identify the slope and y-intercept of<br />
the graph of the given linear function.<br />
iii. Use the slope and y-intercept to draw<br />
the graph of the given linear function<br />
on your coordinate system. Label the<br />
y-intercept <strong>with</strong> its coordinate and<br />
the graph <strong>with</strong> its equation.<br />
1. f(x) = 2x + 1<br />
8.<br />
y<br />
5<br />
x<br />
5<br />
2. f(x) = −2x + 3<br />
3. f(x) = 3 − x<br />
x<br />
5<br />
4. f(x) = 2 − 3x<br />
5. f(x) = − 3 4 x + 3<br />
6. f(x) = 2 3 x − 2<br />
9.<br />
In <strong>Exercises</strong> 7-12, perform each of the<br />
following tasks.<br />
y<br />
5<br />
i. Make a copy of the given graph on a<br />
sheet of graph paper.<br />
ii. Label the y-intercept <strong>with</strong> its coordinates,<br />
then draw a right triangle<br />
and label the sides to help identify<br />
the slope.<br />
iii. Label the line <strong>with</strong> its equation.<br />
x<br />
5<br />
1<br />
Copyrighted material. See: http://msenux.redwoods.edu/IntAlgText/<br />
Version: Fall 2007
284 Chapter 3 Linear Functions<br />
10.<br />
y<br />
5<br />
x<br />
5<br />
of dollars, be the dependent variable and<br />
place it along the vertical axis.<br />
We will assume that the rate of increase<br />
of $1000 per year is constant, so we can<br />
model this situation <strong>with</strong> a linear function.<br />
a) On a sheet of graph paper, make a<br />
graph to model this situation, going<br />
as far as t = 10 years.<br />
b) What is the S-intercept<br />
11.<br />
c) What is the slope<br />
y<br />
5<br />
x<br />
5<br />
d) Suppose we want to predict Kate’s<br />
salary in 20 years or 30 years. We<br />
cannot use the graphical model because<br />
it only shows up to t = 10 years.<br />
We could draw a larger graph, but<br />
what if we then wanted to predict<br />
50 years into the future The point<br />
is that a graphical model is limited<br />
to what it shows. A model algebraic<br />
function, however, can be used to predict<br />
for any year!<br />
12.<br />
y<br />
5<br />
Find the slope-intercept form of the<br />
linear function that models Kate’s salary.<br />
e) Write the function using function notation,<br />
which emphasizes that S is a<br />
function of t.<br />
x<br />
5<br />
f) Now use the algebraic model from (e)<br />
to predict Kate’s salary 10 years, 20<br />
years, 30 years, and 50 years into the<br />
future.<br />
g) Compute S(40).<br />
13. Kate makes $39, 000 per year and<br />
gets a raise of $1000 each year. Since<br />
her salary depends on the year, let time<br />
t represent the year, <strong>with</strong> t = 0 being the<br />
present year, and place it along the horizontal<br />
axis. Let salary S, in thousands<br />
h) In a complete sentence, explain what<br />
the value of S(40) from part (g) means<br />
in the context of the problem.<br />
14. For each DVD that Blue Charles<br />
Co. sells, they make 5c profit. Profit<br />
depends on the number of DVD’s sold,<br />
Version: Fall 2007
Section 3.3 Equations of Lines 285<br />
so let number sold n be the independent<br />
variable and profit P , in $, be the dependent<br />
variable.<br />
a) On a sheet of graph paper, make a<br />
graph to model this situation, going<br />
as far as n = 15.<br />
b) Use the graph to predict the profit if<br />
n = 10 DVD’s are sold.<br />
c) The graphical model is limited to predicting<br />
for values of n on your graph.<br />
Any larger value of n necessitates a<br />
larger graph, or a different kind of<br />
model. To begin finding an algebraic<br />
model, identify the P -intercept of the<br />
graph.<br />
d) What is the slope of the line in you<br />
graphical model<br />
e) Find a slope-intercept form of a linear<br />
function that models Blue Charles<br />
Co.’s sales.<br />
f) Write the function using function notation.<br />
g) Explain why this model does not have<br />
the same limitation as the graphical<br />
model.<br />
h) Find P (100), P (1000), and P (10000).<br />
i) In complete sentences, explain what<br />
the values of P (100), P (1000), and<br />
P (10000) mean in the context of the<br />
problem.<br />
15. Enrique had $1, 000 saved when he<br />
began to put away an additional $25 each<br />
month.<br />
a) Let t represent time, in months, and<br />
S represent Enrique’s savings, in $.<br />
Identify which should be the independent<br />
and dependent variables.<br />
b) To begin finding a linear function to<br />
model this situation, identify the S-<br />
intercept and slope.<br />
c) Find a slope-intercept form of a linear<br />
function to model Enrique’s savings<br />
over time.<br />
d) Write the linear function in function<br />
notation.<br />
e) Use the function model to predict<br />
how much will be in his savings in<br />
one year.<br />
f) Use the function model to predict when<br />
will he have $2000 saved.<br />
g) Graph the function on a coordinate<br />
system.<br />
h) At the same time, Anne-Marie also<br />
begins to save $25 per month, but she<br />
begins <strong>with</strong> $1200 already in her savings.<br />
Make a graphical model of her<br />
situation and place it on the same coordinate<br />
system as the graphical model<br />
for Enrique’s savings. Label it appropriately.<br />
i) How do the lines compare to each<br />
other Say something about their slopes.<br />
j) Find a slope-intercept form of a linear<br />
function that models Anne-Marie’s<br />
savings. Use the same variables as<br />
you did for Enrique’s model.<br />
k) Write the function using function notation.<br />
l) Prove that the graphs of the two functions<br />
are parallel lines.<br />
m) For Anne-Marie, looking at the graphs,<br />
do you think it will take her more<br />
time or less time than Enrique to save<br />
up $2000.<br />
Version: Fall 2007
286 Chapter 3 Linear Functions<br />
n) Use the linear function model for Anne-<br />
Marie to predict how long it will take<br />
her to save $2000. Does this agree<br />
<strong>with</strong> your expectation from (m)<br />
16. Jose is initially 400 meters away<br />
from the bus stop. He starts running toward<br />
the stop at a rate of 5 meters per<br />
second.<br />
a) Express Jose’s distance d from the<br />
bus stop as a function of time t.<br />
b) Use your model to determine Jose’s<br />
distance from the bus stop after one<br />
minute.<br />
c) Use your model to determine the time<br />
it will take Jose to reach the bus stop.<br />
17. A ball is dropped from rest above<br />
the surface of the earth. As it falls, its<br />
speed increases at a constant rate of 32<br />
feet per second per second.<br />
a) Express the speed v of the ball as a<br />
function of time t.<br />
b) Use your model to determine the speed<br />
of the ball after 5 seconds.<br />
c) Use your model to determine the time<br />
it will take for the ball to achieve a<br />
speed of 256 feet per second.<br />
18. A ball is thrown into the air <strong>with</strong><br />
an initial speed of 200 meters per second.<br />
It immediately begins to lose speed at a<br />
rate of 9.5 meters per second per second.<br />
a) Express the speed v of the ball as a<br />
function of time t.<br />
b) Use your model to determine the speed<br />
of the ball after 5 seconds.<br />
c) Use your model to determine the time<br />
it will take for the ball to achieve its<br />
maximum height.<br />
In <strong>Exercises</strong> 19-24, a linear function is<br />
given in standard form Ax + By = C.<br />
In each case, solve the given equation for<br />
y, placing the equation in slope-intercept<br />
form. Use the slope and intercept to<br />
draw the graph of the equation on a sheet<br />
of graph paper.<br />
19. 3x − 2y = 6<br />
20. 3x + 5y = 15<br />
21. 3x + 2y = 6<br />
22. 4x − y = 4<br />
23. x − 3y = −3<br />
24. x + 4y = −4<br />
In <strong>Exercises</strong> 25-30, you are given a linear<br />
function in slope-intercept form. Place<br />
the linear function in standard form Ax+<br />
By = C, where A, B, and C are integers<br />
and A > 0.<br />
25. y = 2 3 x − 5<br />
26. y = 5 6 x + 1<br />
27. y = − 4 5 x + 3<br />
28. y = − 3 7 x + 2<br />
29. y = − 2 5 x − 3<br />
30. y = − 1 4 x + 2<br />
Version: Fall 2007
Section 3.3 Equations of Lines 287<br />
31. What is the x-intercept of the line<br />
y<br />
5<br />
34. What is the x-intercept of the line<br />
y<br />
5<br />
x<br />
5<br />
x<br />
5<br />
32. What is the y-intercept of the line<br />
y<br />
5<br />
x<br />
5<br />
In <strong>Exercises</strong> 35-40, find the x- and y-<br />
intercepts of the linear function that is<br />
given in standard form. Use the intercepts<br />
to plot the graph of the line on a<br />
sheet of graph paper.<br />
35. 3x − 2y = 6<br />
36. 4x + 5y = 20<br />
37. x − 2y = −2<br />
33. What is the y-intercept of the line<br />
y<br />
5<br />
38. 6x + 5y = 30<br />
39. 2x − y = 4<br />
40. 8x − 3y = 24<br />
x<br />
5<br />
41. Sketch the graph of the horizontal<br />
line that passes through the point<br />
(3, −3). Label the line <strong>with</strong> its equation.<br />
42. Sketch the graph of the horizontal<br />
line that passes through the point<br />
(−9, 9). Label the line <strong>with</strong> its equation.<br />
43. Sketch the graph of the vertical line<br />
that passes through the point (2, −1).<br />
Label the line <strong>with</strong> its equation.<br />
Version: Fall 2007
288 Chapter 3 Linear Functions<br />
44. Sketch the graph of the vertical line<br />
that passes through the point (15, −16).<br />
Label the line <strong>with</strong> its equation.<br />
In <strong>Exercises</strong> 45-48, find the domain and<br />
range of the given linear function.<br />
45. f(x) = −37x − 86<br />
46. f(x) = 98<br />
47. f(x) = −12<br />
48. f(x) = −2x + 8<br />
Version: Fall 2007
Section 3.3<br />
Equations of Lines<br />
3.3 <strong>Solutions</strong><br />
1. Compare f(x) = 2x + 1 <strong>with</strong> f(x) = mx + b. Note that the slope is m = 2 and the<br />
y-coordinate of the y-intercept is b = 1. Therefore, the y-intercept will be the point<br />
(0, 1). Plot the point P (0, 1). To obtain a line of slope m = 2/1, start at the point<br />
P (0, 1), then move 1 unit to the right and 2 units upward, arriving at the point Q(1, 3),<br />
as shown in the figure below. The line through the points P and Q is the required line.<br />
y<br />
5<br />
Q(1,2)<br />
P (0,1)<br />
∆x=1<br />
∆y=2<br />
x<br />
5<br />
f(x)=2x+1<br />
3. Compare f(x) = 3 − x, or equivalently f(x) = −x + 3, <strong>with</strong> f(x) = mx + b. Note<br />
that the slope is m = −1 and the y-coordinate of the y-intercept is b = 3. Therefore,<br />
the y-intercept will be the point (0, 3). Plot the point P (0, 3). To obtain a line of slope<br />
m = −1, start at the point P (0, 3), then move 1 unit to the right and 1 units downward,<br />
arriving at the point Q(1, 2), as shown in the figure below. The line through the points<br />
P and Q is the required line.<br />
y<br />
5<br />
∆x=1<br />
P (0,3)<br />
∆y=−1<br />
Q(1,2)<br />
x<br />
5<br />
f(x)=3−x<br />
Version: Fall 2007
Chapter 3<br />
Linear Functions<br />
5. Compare f(x) = (−3/4)x+3 <strong>with</strong> f(x) = mx+b. Note that the slope is m = −3/4<br />
and the y-coordinate of the y-intercept is b = 3. Therefore, the y-intercept will be the<br />
point (0, 3). Plot the point P (0, 3). To obtain a line of slope m = −3/4, start at the<br />
point P (0, 3), then move 4 units to the right and 3 units downward, arriving at the<br />
point Q(4, 0), as shown in the figure below. The line through the points P and Q is<br />
the required line.<br />
y<br />
5<br />
P (0,3)<br />
∆x=4<br />
Q(4,0)<br />
∆y=−3<br />
x<br />
5<br />
f(x)=(−3/4)x+3<br />
7. The slope is found by dividing the rise by the run (see figure). Hence, the slope is<br />
1/2. The y-intercept is found by noting where the graph of the line crosses the y-axis<br />
(see figure), in this case, at (0, −3). Hence, m = 1/2 and b = −3, so the equation of<br />
the line in slope intercept form is<br />
y = mx + b or y = 1 2 x − 3.<br />
y<br />
5<br />
y=(1/2)x−3<br />
(0,−3) ∆y=1<br />
∆x=2<br />
x<br />
5<br />
Version: Fall 2007
Section 3.3<br />
Equations of Lines<br />
9. The slope is found by dividing the rise by the run (see figure). Hence, the slope is<br />
2/3. The y-intercept is found by noting where the graph of the line crosses the y-axis<br />
(see figure), in this case, at (0, −2). Hence, m = 2/3 and b = −2, so the equation of<br />
the line in slope intercept form is<br />
y = mx + b or y = 2 3 x − 2.<br />
y<br />
5<br />
∆y=2<br />
∆x=3<br />
(0,−2)<br />
x<br />
5<br />
y=(2/3)x−2<br />
11. The slope is found by dividing the rise by the run (see figure). Hence, the slope is<br />
3/2. The y-intercept is found by noting where the graph of the line crosses the y-axis<br />
(see figure), in this case, at (0, 1). Hence, m = 3/2 and b = 1, so the equation of the<br />
line in slope intercept form is<br />
y = mx + b or y = 3 2 x + 1.<br />
∆y=3<br />
y<br />
5<br />
∆x=2<br />
(0,1)<br />
x<br />
5<br />
y=(3/2)x+1<br />
Version: Fall 2007
Chapter 3<br />
Linear Functions<br />
13.<br />
a)<br />
50<br />
salary S (thousands of dollars)<br />
40<br />
30<br />
(0,39)<br />
20<br />
10<br />
0 2 4 6 8 10<br />
time t (years)<br />
b) At t = 0 (present year), her salary is $39, 000. Since S is in thousands of dollars,<br />
S = 39 when t = 0. So the S-intercept is (0, 39).<br />
c) The increase in Kate’s salary is $1, 000 per year, but S is in thousands of dollars,<br />
so the rate of increase in S is 1. That is, the slope is 1.<br />
d) Using the slope-intercept form, we get S = t + 39.<br />
e) S(t) = t + 39.<br />
f)<br />
• To find Kate’s salary in 10 years, compute S(10) = 10 + 39 = 49, which means<br />
that she will be earning $49, 000 per year.<br />
• To find Kate’s salary in 20 years, compute S(20) = 20 + 39 = 59, which means<br />
that she will be earning $59, 000 per year.<br />
• To find Kate’s salary in 30 years, compute S(30) = 30 + 39 = 69, which means<br />
that she will be earning $69, 000 per year.<br />
• To find Kate’s salary in 50 years, compute S(50) = 50 + 39 = 89, which means<br />
that she will be earning $89, 000 per year.<br />
g) S(40) = 40 + 39 = 79.<br />
h) If the current rate of increase continues, in 40 years Kate’s salary will be $79, 000.<br />
15.<br />
a) t should be the independent variable and S should be the dependent variable.<br />
b) S-intercept = (0, 1000); slope = 25<br />
Version: Fall 2007
Section 3.3<br />
Equations of Lines<br />
c) S = 25t + 1000<br />
d) S(t) = 25t + 1000<br />
e) S(12) = 25(12) + 1000 = 1300<br />
f) Set S=2000 and solve for t. 2000 = 25t + 1000 1000 = 25t 40 = t So it will take 40<br />
months for him to reach $2000.<br />
h)<br />
1600<br />
savings S (dollars)<br />
1500<br />
1400<br />
Anne−Marie<br />
1300<br />
1200<br />
Enrique<br />
1100<br />
1000<br />
0 2 4 6 8 10 12 14<br />
time t (months)<br />
i) The lines have the same slope; they are parallel.<br />
j) S = 25t + 1200<br />
k) S(t) = 25t + 1200<br />
l) They are lines because they are in the y = mx + b form. They are parallel because<br />
their slopes are equal (both are 25).<br />
m) It should take her less time because her graph is above Enrique’s graph. This<br />
makes sense intuitively since she began <strong>with</strong> more money than he did.<br />
n) Set S=2000 and solve for t. 2000 = 25t + 1200 800 = 25t 32 = t So it will take 32<br />
months for her to reach $2000. This agrees <strong>with</strong> our expectation from (m): It takes<br />
her less time than Enrique.<br />
17.<br />
a) We will do a “rough” plot of speed v versus time t. Speed depends upon time,<br />
so we place the speed on the vertical axis and the time on the horizontal axis in<br />
the figure that follows. The intial speed is 0 ft/s, which give us the v-intercept at<br />
P (0, 0). The rate at which the speed is increasing (acceleration) is constant and<br />
will be the slope of the line; i.e., the slope of the line is m = 32 ft/s 2 (32 feet per<br />
second per second).<br />
Version: Fall 2007
Chapter 3<br />
Linear Functions<br />
v(ft/s)<br />
m=32 ft/s 2<br />
P (0,0)<br />
t(s)<br />
Because we know the slope and intercept of the line, we can use the slope intercept<br />
form y = mx + b and substitute m = 32 and b = 0 to obtain<br />
y = mx + b<br />
y = 32x + 0<br />
y = 32x.<br />
However, we are using v and t in place of y and x, so we replace these in the last<br />
formula to obtain<br />
or using function notation,<br />
v = 32t,<br />
v(t) = 32t.<br />
b) To find the speed of the ball after 5 seconds, substitute t = 5 into the equation<br />
developed in the previous part.<br />
v(t) = 32t<br />
v(5) = 32(5)<br />
v(5) = 160.<br />
Hence, the speed of the ball after 5 seconds is 160 feet per second.<br />
c) To find the time it takes the ball to reach 256 feet per second, we must find t so<br />
that v(t) = 256.<br />
v(t) = 256<br />
32t = 256<br />
t = 8.<br />
Thus, it takes 8 seconds for the ball to attain a speed of 256 feet per second.<br />
19. Place 3x − 2y = 6 in slope-intercept form. First subtract 3x from both sides of<br />
the equation, then divide both sides of the resulting equation by −2.<br />
Version: Fall 2007
Section 3.3<br />
Equations of Lines<br />
3x − 2y = 6<br />
−2y = −3x + 6<br />
y = 3 2 x − 3<br />
Compare y = (3/2)x − 3 <strong>with</strong> y = mx + b to see that the slope is m = 3/2 and the<br />
y-coordinate of the y-intercept is b = −3. Therefore, the y-intercept will be the point<br />
(0, −3). Plot the point P (0, −3). To obtain a line of slope m = 3/2, start at the point<br />
P (0, −3), then move 3 units up and 2 units to the right, arriving at the point Q(2, 0),<br />
as shown in the figure below. The line through the points P and Q is the required line.<br />
y<br />
5<br />
∆x=2<br />
x<br />
Q(2,0) 5<br />
∆y=3<br />
P (0,−3)<br />
21. Place 3x + 2y = 6 in slope-intercept form. First subtract 3x from both sides of<br />
the equation, then divide both sides of the resulting equation by 2.<br />
3x + 2y = 6<br />
2y = −3x + 6<br />
y = − 3 2 x + 3<br />
Compare y = (−3/2)x + 3 <strong>with</strong> y = mx + b to see that the slope is m = −3/2 and the<br />
y-coordinate of the y-intercept is b = 3. Therefore, the y-intercept will be the point<br />
(0, 3). Plot the point P (0, 3). To obtain a line of slope m = −3/2, start at the point<br />
P (0, 3), then move 3 units downward and 2 units to the right, arriving at the point<br />
Q(2, 0), as shown in the figure below. The line through the points P and Q is the<br />
required line.<br />
∆y=−3<br />
y<br />
5<br />
P (0,3)<br />
Q(2,0)<br />
x<br />
∆x=2 5<br />
Version: Fall 2007
Chapter 3<br />
Linear Functions<br />
23. Place x − 3y = −3 in slope-intercept form. First subtract x from both sides of<br />
the equation, then divide both sides of the resulting equation by −3.<br />
x − 3y = −3<br />
−3y = −x − 3<br />
y = 1 3 x + 1<br />
Compare y = (1/3)x + 1 <strong>with</strong> y = mx + b to see that the slope is m = 1/3 and the<br />
y-coordinate of the y-intercept is b = 1. Therefore, the y-intercept will be the point<br />
(0, 1). Plot the point P (0, 1). To obtain a line of slope m = 1/3, start at the point<br />
P (0, 1), then move 1 unit upward and 3 units to the right, arriving at the point Q(3, 2),<br />
as shown in the figure below. The line through the points P and Q is the required line.<br />
y<br />
5<br />
∆y=1<br />
∆x=3<br />
P (0,1)<br />
Q(3,2)<br />
x<br />
5<br />
25. Start <strong>with</strong><br />
y = 2 3 x − 5<br />
and multiply both sides by 3 to clear the fractions.<br />
3y = 2x − 15<br />
Finally, subtract 3y from both sides of the equation, then add 15 to both sides of the<br />
equation to obtain<br />
or equivalently,<br />
15 = 2x − 3y,<br />
2x − 3y = 15.<br />
27. Start <strong>with</strong><br />
y = − 4 5 x + 3<br />
and multiply both sides by 5 to clear the fractions.<br />
5y = −4x + 15<br />
Version: Fall 2007
Section 3.3<br />
Equations of Lines<br />
Finally, add 4x to both sides of the equation.<br />
4x + 5y = 15<br />
29. Start <strong>with</strong><br />
y = − 2 5 x − 3<br />
and multiply both sides by 5 to clear the fractions.<br />
5y = −2x − 15<br />
Finally, add 2x to both sides of the equation.<br />
2x + 5y = −15<br />
31. The x-intercept is the location where the line crosses the x-axis.<br />
y<br />
5<br />
P (−4,0)<br />
x<br />
5<br />
Therefore, the x-intercept is (−4, 0).<br />
33. The y-intercept is the location where the line crosses the y-axis.<br />
y<br />
5<br />
P (0,4)<br />
x<br />
5<br />
Therefore, the y-intercept is (0, 4).<br />
35. Set x = 0 in 3x − 2y = 6 to get −2y = 6 or y = −3. The y-intercept is (0, −3).<br />
Set y = 0 in 3x − 2y = 6 to get 3x = 6 or x = 2. The x-intercept is (2, 0). Plot the<br />
intercepts. The line through the intercepts is the required line.<br />
Version: Fall 2007
Chapter 3<br />
Linear Functions<br />
y<br />
5<br />
(2,0)<br />
x<br />
5<br />
(0,−3)<br />
37. Set x = 0 in x − 2y = −2 to get −2y = −2 or y = 1. The y-intercept is (0, 1). Set<br />
y = 0 in x − 2y = −2 to get x = −2. The x-intercept is (−2, 0). Plot the intercepts.<br />
The line through the intercepts is the required line.<br />
y<br />
5<br />
(0,1)<br />
(−2,0)<br />
x<br />
5<br />
39. Set x = 0 in 2x − y = 4 to get −y = 4 or y = −4. The y-intercept is (0, −4). Set<br />
y = 0 in 2x − y = 4 to get 2x = 4. The x-intercept is (2, 0). Plot the intercepts. The<br />
line through the intercepts is the required line.<br />
y<br />
5<br />
(2,0)<br />
x<br />
5<br />
(0,−4)<br />
Version: Fall 2007
Section 3.3<br />
Equations of Lines<br />
41. Every horizontal line has an equation of the form y = d. Since this line must pass<br />
through the point (3, −3), it follows that the equation is y = −3.<br />
y<br />
5<br />
(3,−3)<br />
x<br />
5<br />
y=−3<br />
43. Every vertical line has an equation of the form x = c. Since this line must pass<br />
through the point (2, −1), it follows that the equation is x = 2.<br />
y<br />
5 x=2<br />
x<br />
5<br />
(2,−1)<br />
45. The domain of every linear function is (−∞, ∞). Since the slope of the graph of<br />
f is −37 ≠ 0, the range is also (−∞, ∞).<br />
47. The domain of every linear function is (−∞, ∞). Since f(x) = −12 for every x,<br />
the range is {−12}.<br />
Version: Fall 2007


