Cash Flow Lecture - UNO CBA
Cash Flow Lecture - UNO CBA
Cash Flow Lecture - UNO CBA

Create successful ePaper yourself
Turn your PDF publications into a flip-book with our unique Google optimized e-Paper software.
1<br />
2<br />
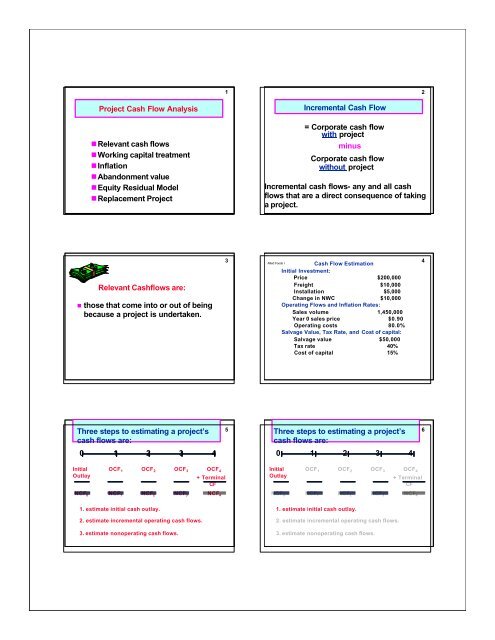
Project <strong>Cash</strong> <strong>Flow</strong> Analysis<br />
•Relevant cash flows<br />
•Working capital treatment<br />
•Inflation<br />
•Abandonment value<br />
•Equity Residual Model<br />
•Replacement Project<br />
Incremental <strong>Cash</strong> <strong>Flow</strong><br />
= Corporate cash flow<br />
with project<br />
minus<br />
Corporate cash flow<br />
without project<br />
Incremental cash flows- any and all cash<br />
flows that are a direct consequence of taking<br />
a project.<br />
Relevant <strong>Cash</strong>flows are:<br />
• those that come into or out of being<br />
because a project is undertaken.<br />
3<br />
Allied Foods I <strong>Cash</strong> <strong>Flow</strong> Estimation<br />
Initial Investment:<br />
Price $200,000<br />
Freight $10,000<br />
Installation $5,000<br />
Change in NWC $10,000<br />
Operating <strong>Flow</strong>s and Inflation Rates:<br />
Sales volume 1,450,000<br />
Year 0 sales price $0.90<br />
Operating costs 80.0%<br />
Salvage Value, Tax Rate, and Cost of capital:<br />
Salvage value $50,000<br />
Tax rate 40%<br />
Cost of capital 15%<br />
4<br />
Three steps to estimating a project’s<br />
cash flows are:<br />
5<br />
Three steps to estimating a project’s<br />
cash flows are:<br />
6<br />
0 1 2 3 4<br />
0 1 2 3 4<br />
Initial<br />
Outlay<br />
OCF 1 OCF 2 OCF 3 OCF 4<br />
+ Terminal<br />
CF<br />
Initial<br />
Outlay<br />
OCF 1 OCF 2 OCF 3 OCF 4<br />
+ Terminal<br />
CF<br />
NCF 0 NCF 1 NCF 2 NCF 3 NCF 4<br />
NCF 0 NCF 1 NCF 2 NCF 3 NCF 4<br />
1. estimate initial cash outlay.<br />
2. estimate incremental operating cash flows.<br />
3. estimate nonoperating cash flows.<br />
1. estimate initial cash outlay.<br />
2. estimate incremental operating cash flows.<br />
3. estimate nonoperating cash flows.
Allied Foods I<br />
7<br />
8<br />
Net Investment Outlay:<br />
Price $200,000<br />
Freight 10,000<br />
Installation 5,000<br />
Change in NWC 10,000<br />
-------------<br />
$225,000<br />
========<br />
Three steps to estimating a project’s<br />
cash flows are:<br />
0 1 2 3 4<br />
Initial<br />
Outlay<br />
OCF 1 OCF 2 OCF 3 OCF 4<br />
+ Terminal<br />
CF<br />
NCF 0 NCF 1 NCF 2 NCF 3 NCF 4<br />
1. estimate initial cash outlay.<br />
2. estimate incremental operating cash flows.<br />
3. estimate nonoperating cash flows.<br />
9<br />
Allied Foods I<br />
Year Year<br />
10<br />
OCF t = (Revenue t - Cost t - Depr t )(1-T) + Depr t Operating costs<br />
1,044,000 1,044,000<br />
1 2<br />
Unit price<br />
$0.90 $0.90<br />
Operating cashflow (OCF t )<br />
Unit sales<br />
1,450,000 1,450,000<br />
-------- --------<br />
Revenues<br />
$1,305,000 $1,305,000<br />
Depreciation<br />
Before tax income<br />
Taxes<br />
Net income<br />
Plus depreciation<br />
Net op cash flow<br />
Allied Foods I Allied Foods I<br />
11<br />
Year Year<br />
12<br />
1 2<br />
Unit price<br />
Unit sales<br />
Depreciable basis = $215,000<br />
EOY<br />
MACRS Dep. Book<br />
Year Factor Expense Value<br />
------ ------ -------- --------<br />
1 33%<br />
2 45%<br />
3 15%<br />
4 7%<br />
------<br />
100%<br />
$70,950 $144,050<br />
96,750 47,300<br />
32,250 15,050<br />
15,050 (0)<br />
--------<br />
$215,000<br />
Revenues<br />
Operating costs<br />
Depreciation<br />
Before tax income<br />
Taxes<br />
Net income<br />
Plus depreciation<br />
Net op cash flow<br />
$0.90 $0.90<br />
1,450,000 1,450,000<br />
-------- --------<br />
$1,305,000 $1,305,000<br />
1,044,000 1,044,000<br />
70,950 96,750<br />
-------- --------<br />
$190,050 $164,250<br />
76,020 65,700<br />
-------- --------<br />
$114,030 $98,550<br />
70,950 96,750<br />
-------- --------<br />
$184,980 $195,300
Allied Foods I<br />
Year Year<br />
13<br />
Allied Foods I<br />
14<br />
3 4<br />
Unit price<br />
Unit sales<br />
Revenues<br />
Operating costs<br />
Depreciation<br />
Before tax income<br />
Taxes<br />
Net income<br />
Plus depreciation<br />
Net op cash flow<br />
$0.90 $0.90<br />
1,450,000 1,450,000<br />
-------- --------<br />
$1,305,000 $1,305,000<br />
1,044,000 1,044,000<br />
32,250 15,050<br />
-------- -------<br />
$228,750 $245,950<br />
91,500 98,380<br />
-------- --------<br />
$137,250 $147,570<br />
32,250 15,050<br />
-------- --------<br />
$169,500 $162,620<br />
Year Year Year Year Year<br />
0 1 2 3 4<br />
Net op cash flow $184,980 $195,300 $169,500 $162,620<br />
Three steps to estimating a project’s<br />
cash flows are:<br />
15<br />
Allied Foods I<br />
16<br />
0 1 2 3 4<br />
Initial<br />
Outlay<br />
OCF 1 OCF 2 OCF 3 OCF 4<br />
+ Terminal<br />
CF<br />
NCF 0 NCF 1 NCF 2 NCF 3 NCF 4<br />
1. estimate initial cash outlay.<br />
2. estimate incremental operating cash flows.<br />
Year Year Year Year Year<br />
0 1 2 3 4<br />
Net op cash flow $184,980 $195,300 $169,500 $162,620<br />
Salvage value $50,000<br />
SV tax=-(SV-BV)T (20,000)<br />
Recovery of NWC 10,000<br />
--------<br />
Termination CF $40,000<br />
-------- -------- -------- -------- --------<br />
Project NCF ($225,000) $184,980 $195,300 $169,500 $202,620<br />
3. estimate nonoperating cash flows.<br />
Allied Foods I<br />
17<br />
18<br />
NPV<br />
IRR<br />
TV<br />
MIRR<br />
Payback<br />
$310,825<br />
74.0%<br />
$937,161<br />
42.9%<br />
1.2<br />
Suppose $100,000 had been spent last<br />
year to improve the production line<br />
site. Should this cost be included in<br />
the analysis<br />
•NO. This is a sunk cost. Focus on<br />
incremental investment and<br />
operating cash flows.
If the price of a can of fresh lemon<br />
juice is expected to increase by 1.5%<br />
per year while operating costs are<br />
expected to increase by 8.0% per year,<br />
would this affect the analysis<br />
•Yes, because the discount rate is<br />
quoted on a nominal basis the cash<br />
flows and profitability analysis will<br />
be biased if quoted on a real basis.<br />
19<br />
If the plant space could be leased out<br />
for $25,000 a year, would this affect<br />
the analysis<br />
•Yes. Accepting the project means we<br />
will not receive the $25,000. This is<br />
an opportunity cost and it should be<br />
charged to the project.<br />
20<br />
If the new product line would decrease<br />
sales of the firm’s other products by<br />
$15,000 per year, and decrease<br />
operating costs of other porducts by<br />
$20,000 would this affect the analysis<br />
•Yes. The effects on the other projects’<br />
CFs is an “externality”.<br />
•Net CF loss per year on other lines<br />
would be a cost to this project.<br />
•Externalities will be positive if new<br />
projects are complements to existing<br />
assets, negative if substitutes.<br />
21<br />
Allied Foods<br />
2<br />
Allied Foods<br />
(with inflation and externalities)<br />
• Operating <strong>Flow</strong>s and Inflation Rates:<br />
Sales volume 1,450,000<br />
Year 0 sales price $0.90<br />
Operating costs 80.0%<br />
Price inflation 1.5%<br />
Cost inflation 8.0%<br />
• Salvage Value, Tax Rate, and Cost of Capital:<br />
Salvage value $50,000<br />
Tax rate 40%<br />
Cost of capital 15%<br />
• Effects on Other Projects:<br />
Revenue reduction $40,000<br />
Cost reduction $20,000<br />
22<br />
Allied Foods2<br />
Unit price<br />
Unit sales<br />
Revenues<br />
Operating costs<br />
Depreciation<br />
Other project effects<br />
Before tax income<br />
Taxes<br />
Net income<br />
Plus depreciation<br />
Net op cash flow<br />
Year Year Year<br />
0 1 2<br />
-------- -------- --------<br />
$0.90 $0.91 $0.93<br />
1,450,000 1,450,000<br />
-------- --------<br />
$1,324,575 $1,344,444<br />
1,127,520 1,217,722<br />
*Note that because 70,950 of differing 96,750 economic<br />
pressures operating 20,000 costs will 20,000 not remain<br />
at 80% of sales.<br />
Yr1 operating costs $106,105 = (0.90 X 0.80)x(1.08) $9,972<br />
42,442 x 1,450,000 = $1,127,520 3,989<br />
-------- --------<br />
$63,663 $5,983<br />
Yr2 operating costs = $1,127,520 X 1.08 =<br />
$1,217,721.60 70,950<br />
--------<br />
$134,613<br />
96,750<br />
--------<br />
$102,733<br />
23<br />
Allied Foods2<br />
Unit price<br />
Unit sales<br />
Revenues<br />
Operating costs<br />
Depreciation<br />
Other project effects<br />
Before tax income<br />
Taxes<br />
Net income<br />
Plus depreciation<br />
Net op cash flow<br />
Year Year<br />
3 4<br />
-------- --------<br />
$0.94 $0.96<br />
1,450,000 1,450,000<br />
-------- --------<br />
$1,364,610 $1,385,079<br />
1,315,139 1,420,350<br />
32,250 15,050<br />
20,000 20,000<br />
-------- --------<br />
($2,779) ($70,321)<br />
(1,112) (28,128)<br />
-------- --------<br />
($1,667) ($42,193)<br />
32,250 15,050<br />
-------- --------<br />
$30,583 ($27,143)<br />
24
Allied Foods2 Allied Foods2<br />
25<br />
26<br />
Year Year Year Year Year<br />
0 1 2 3 4<br />
Net op cash flow $134,613 $102,733 $30,583 ($27,143)<br />
Salvage value $50,000<br />
SV tax=-(SV-BV)T ( 20,000)<br />
Recovery of NWC 10,000<br />
--------<br />
Termination CF $40,000<br />
-------- -------- -------- -------- --------<br />
Project NCF ($225,000) $134,613 $102,733 $30,583 $12,857<br />
NPV<br />
IRR<br />
TV<br />
MIRR<br />
Payback<br />
($2,804)<br />
14.1%<br />
$388,622<br />
14.6%<br />
1.9<br />
27<br />
Allied Foods3<br />
28<br />
If you terminate a project before the<br />
asset is fully depreciated, will this<br />
affect the profitability of the project<br />
•Yes, the early termination of a project<br />
may either decrease or increase the<br />
profitability of a project.<br />
Year Year Year Year<br />
0 1 2 3<br />
Net op cash flow $134,613 $102,733 $30,583<br />
Salvage value $50,000<br />
SV tax (13,980)<br />
Recovery of NWC 10,000<br />
--------<br />
Termination CF $46,020<br />
-------- -------- -------- --------<br />
Project NCF ($225,000) $134,613 $102,733 $76,603<br />
Allied Foods3<br />
29<br />
30<br />
Conclusions<br />
NPV<br />
IRR<br />
TV<br />
MIRR<br />
Payback<br />
$20,103<br />
20.9%<br />
$372,771<br />
18.3%<br />
1.9<br />
•The project is acceptable only if<br />
operated for 3 years.<br />
•A project’s engineering life does not<br />
always equal its economic life.<br />
•The ability to abandon a project may<br />
make an otherwise unattractive<br />
project acceptable.<br />
•Abandonment possibilities will be<br />
very important when we get to risk.
Types of Abandonment<br />
•Sale to another party who can obtain<br />
greater cash flows, e.g., IBM sold<br />
typewriter division.<br />
•Abandon because the project is<br />
losing money, e.g., smokeless<br />
cigarette.<br />
31<br />
Fairways Driving Range<br />
• Initial Investment:<br />
Dispensing Machine $2,000<br />
Pick-up vehicle $7,000<br />
Tractor and Accessories $9,000<br />
Change in NWC $3,000<br />
• Operating <strong>Flow</strong>s and Inflation Rates:<br />
Sales of buckets of balls 20,000<br />
price per bucket $3.00<br />
Fixed costs $53,000<br />
Op costs 5.0%<br />
Price inflation 4.0%<br />
Cost inflation 5.0%<br />
Growth in Unit Sales 10.0%<br />
• Salvage Value, Tax Rate, and Cost of Capital:<br />
Salvage value $1,800<br />
Tax rate 30%<br />
Market value of business $10,000<br />
Cost of capital 14.3%<br />
32<br />
Fairways 1 Fairways 1<br />
33<br />
34<br />
Net Investment Outlay:<br />
Dispensing Machine $2,000<br />
Pick-up vehicle $7,000<br />
Tractor and Accessories $9,000<br />
Change in NWC $3,000<br />
--------<br />
$21,000<br />
Depreciable basis = $18,000<br />
EOY<br />
MACRS Dep. Book<br />
Year Factor Expense Value<br />
------ ------ -------- --------<br />
1 33% $5,940 $12,060<br />
2 45% 8,100 3,960<br />
3 15% 2,700 1,260<br />
4 7% 1,260 0<br />
------ --------- -------<br />
100% $18,000<br />
35<br />
Year Year Year Year<br />
0 1 2 3<br />
-------- -------- -------- --------<br />
Unit price $3.00 $3.12 $3.24 $3.37<br />
Unit sales 20,000 22,000 24,200 26,620<br />
Revenues $68,640 $78,524 $89,832<br />
Fixed Costs ($53,000) ($53,000) ($53,000)<br />
Operating costs per unit 0.1575 0.1654 0.1736<br />
Total Operating costs (3,465) (4,002) (4,622)<br />
Depreciation (5,940) (8,100) (2,700)<br />
-------- -------- --------<br />
Before tax income $6,235 $13,422 $29,509<br />
Taxes 1,871 4,027 8,853<br />
-------- -------- --------<br />
Net income $4,365 $9,396 $20,657<br />
Plus depreciation 5,940 8,100 2,700<br />
-------- -------- --------<br />
Net op cash flow $10,305 $17,496 $23,357<br />
Net op cash flow $10,305 $17,496 $23,357<br />
Salvage value<br />
SV tax<br />
Market Value of Business*<br />
Tax on sale of business<br />
Termination CF<br />
$1,800<br />
(162)<br />
10,000<br />
(3,000)<br />
$8,638<br />
-------- -------- -------- --------<br />
Project NCF ($21,000) $10,305 $17,496 $31,995<br />
*NWC is captured in the price when the business is sold.<br />
36
37<br />
38<br />
Decision Measures:<br />
NPV<br />
IRR<br />
TV<br />
MIRR<br />
Payback<br />
Should CFs include interest expense<br />
Dividends<br />
Fairways Driving Range<br />
Equity Residual Model<br />
39<br />
Fairways 1<br />
40<br />
• Salvage Value, Tax Rate, and Cost of Capital:<br />
Salvage value $1,800<br />
Tax rate 30%<br />
Market value of business $10,000<br />
Percent of Debt Financing 50%<br />
Cost of Debt 12%<br />
Cost of Equity 25%<br />
Net Investment Outlay:<br />
Dispensing Machine $2,000<br />
Pick-up vehicle $7,000<br />
Tractor and Accessories $9,000<br />
Change in NWC $3,000<br />
--------<br />
$21,000<br />
========<br />
Equity Investment $10,500<br />
Debt Financing $10,500<br />
Year Year Year Year<br />
0 1 2 3<br />
-------- -------- -------- --------<br />
Unit price $3.00 $3.12 $3.24 $3.37<br />
Unit sales 20,000 22,000 24,200 26,620<br />
Revenues $68,640 $78,524 $89,832<br />
Fixed Costs ($53,000) ($53,000) ($53,000)<br />
Operating costs per unit 0.1575 0.1654 0.1736<br />
Total Operating costs (3,465) (4,002) (4,622)<br />
Interest Expense (1,260) (1,260) (1,260)<br />
Depreciation<br />
Before tax income<br />
Taxes<br />
Net income<br />
Plus depreciation<br />
(5,940) (8,100) (2,700)<br />
-------- -------- --------<br />
$4,975 $12,162 $28,249<br />
(1,493) (3,649) (8,475)<br />
-------- -------- --------<br />
$3,483 $8,514 $19,775<br />
5,940 8,100 2,700<br />
-------- -------- --------<br />
Net op cash flow $9,423 $16,614 $22,475<br />
41<br />
Fairways 2<br />
Year Year Year Year<br />
0 1 2 3<br />
Net op cash flow $9,422 $16,613 $22,474<br />
Salvage value $1,800<br />
SV tax (162)<br />
Market value of business* 10,000<br />
Tax on sale of business (3,000)<br />
Principal Repayment (10,500)<br />
-----------<br />
Termination CF (1,862)<br />
-------- -------- -------- --------<br />
Project NCF ($10,500) $9,422 $16,613 $20,612<br />
*NWC is captured in the price when the business is sold.<br />
42
With an equity residual model, the<br />
cost of equity, K=25%, is used to find<br />
the project’s NPV, MIRR, and IRR.<br />
43<br />
Adjusted-present-value (APV)<br />
44<br />
NPV<br />
IRR<br />
TV<br />
MIRR<br />
Payback<br />
APV = NPV + NPVF<br />
The value of a project to a levered firm (APV)<br />
is equal to the value of the project to an<br />
unlevered firm (NPV) plus the net present value<br />
of the financing side effects (NPVF).<br />
Adjusted Present Value (APV)<br />
45<br />
Adjusted Present Value (APV)<br />
46<br />
There are four side effects caused by the issuance of<br />
debt:<br />
1.The Tax Subsidy to Debt. (T C B)<br />
2.The Costs of Issuing New Securities.<br />
3.The Costs of Financial Distress.<br />
4. Subsidies to Debt Financing.<br />
<strong>Cash</strong> flows are the same as the typical NPV<br />
estimation:<br />
Year Year Year Year<br />
0 1 2 3<br />
($21,000) $10,305 $17,496 $31,995<br />
However, like the equity residual model, the cost of<br />
equity is used to find the NPV of the unlevered firm:<br />
NPV =<br />
(Unlevered K= 25%)<br />
Note: We can not use the IRR or MIRR for comparison or decision<br />
making.<br />
Adjusted Present Value (APV)<br />
47<br />
Adjusted Present Value (APV)<br />
48<br />
Floatation Costs are paid immediately but are amortized<br />
over the life of the loan.<br />
Floatation Costs<br />
(1% of debt)<br />
Deduction<br />
Tax shield = Deduction * t<br />
Floatation <strong>Cash</strong> <strong>Flow</strong><br />
NPV of Floatation Costs:<br />
(discounted at the risk free rate of 10%)<br />
Year Year Year Year<br />
0 1 2 3<br />
Tax Subsidy<br />
Year Year Year Year<br />
0 1 2 3<br />
Loan Amount $10,500<br />
Interest Paid @ 12%<br />
After tax cost of debt (Int*(1-t))<br />
Balloon payment of debt<br />
<strong>Cash</strong> <strong>Flow</strong><br />
NPV of Tax Subsidy:<br />
(discounted at the risk free rate of 10%)
Adjusted Present Value (APV)<br />
49<br />
If this were a replacement rather than<br />
a new project, would the analysis<br />
change<br />
50<br />
APV = NPV(Equity) + NPV(Floatation Costs) + NPV (Tax Subsidy)<br />
APV =<br />
NPV =<br />
NPV (FTE) =<br />
•Yes. The old equipment would be<br />
sold and the incremental CFs would<br />
be the changes from the old to the<br />
new situation.<br />
Operating <strong>Cash</strong> <strong>Flow</strong>s for a<br />
Replacement Project<br />
(New Revenue - New Cost - New depr)(1-T) + New depr<br />
- (Old Revenue - Old Cost - Old depr)(1-T) + Old depr<br />
---------------------------------------------------------------------------------<br />
(@Revenue - @ Cost - @ depr)(1-T) + @ depr<br />
51<br />
McDwyer Corporation<br />
• Initial Investment: (000)<br />
Price $300,000<br />
Freight $10,000<br />
Change in NWC $0<br />
Sale of old machine $80,000<br />
• Operating <strong>Flow</strong>s and Inflation Rates:<br />
New: Old:<br />
Sales volume 200,000 200,000<br />
Year 0 sales price $3.25 $3.25<br />
Op costs 70.0% 80.0%<br />
Price inflation 4.0% 4.0%<br />
Cost inflation 3.0% 3.0%<br />
• Salvage Value, Tax Rate, and Cost of Capital:<br />
Salvage value $40,000 $30,000<br />
Tax rate 40%<br />
Cost of capital 12%<br />
Depreciation: 3 yr MACRS Straight Line<br />
Current Book Value $100,000<br />
Life 4 years 2 years left<br />
52<br />
Net Investment Outlay:<br />
Price ($300,000)<br />
Freight (10,000)<br />
Sell old machine 80,000<br />
Tax on old machine<br />
-(80,000-100,000)*.4= 8,000<br />
--------<br />
($222,000)<br />
53<br />
McDwyer<br />
Depreciable basis = $310,000<br />
EOY<br />
MACRS Dep. Book<br />
Year Factor Expense Value<br />
------ ------ -------- --------<br />
1 33% $102,300 $207,700<br />
2 45% 139,500 68,200<br />
3 15% 46,500 21,700<br />
4 7% 21,700 0<br />
------ ------------- ----------<br />
100% $310,000<br />
54
Year Year Year<br />
0 1 2<br />
New: -------- -------- --------<br />
55<br />
Year Year<br />
3 4<br />
-------- --------<br />
Unit price $3.25 $3.38 $3.52 $3.66 $3.80<br />
Unit sales 200,000 200,000 200,000 200,000<br />
Old: -------- -------- -------- --------<br />
Unit price $3.25 $3.38 $3.52 $0.00 $0.00<br />
Unit sales 200,000 200,000 0 0<br />
Change in Revenues $0 $0 $731,162 $760,408<br />
New Cost per Unit $2.34 $2.41 $2.49 $2.56<br />
New Operating costs 468,650 482,710 497,191 512,107<br />
Old Cost per Unit 2.68 2.76 0 0<br />
Old Operating costs 535,600 551,668 0 0<br />
Change Operating costs ($66,950) ($68,959) $497,191 $512,107<br />
New Depreciation 102,300 139,500 46,500 21,700<br />
Old Depreciation 50000 50000 0 0<br />
Change in Depreciation 52300 89500 46500 21700<br />
-------- -------- -------- --------<br />
Before tax income $14,650 ($20,541) $187,471 $226,602<br />
Taxes 5,860 (8,217) 74,988 90,641<br />
-------- -------- -------- --------<br />
Change in Net income $8,790 ($12,325) $112,482 $135,961<br />
Plus change in depreciation 52,300 89,500 46,500 21,700<br />
-------- -------- -------- --------<br />
Net change in operating cash flow $61,090 $77,175 $158,982 $157,661<br />
Net change in operating<br />
cash flow<br />
$61,090 $77,175 $158,982 $157,661<br />
-------- -------- -------- --------<br />
Salvage value ($30,000) $40,000<br />
SV tax $12,000 (16,000)<br />
-------- --------<br />
Termination CF ($18,000) $24,000<br />
-------- -------- -------- -------- --------<br />
Project NCF ($222,000) $61,090 $59,175 $158,982 $181,661<br />
56<br />
McDwyer 57<br />
58<br />
How many piano tuners are there in<br />
Omaha<br />
NPV<br />
IRR<br />
TV<br />
MIRR<br />
Payback<br />
Estimating the revenue, operating costs, and external effects<br />
of a project or business plan is similar to the Fermi problem<br />
just discussed.<br />
• If we become bogged down in obtaining the exact estimate,<br />
wasted time and effort may be spent on a superfluous<br />
process, or worse, no estimate is made because of<br />
concerns about being wrong.<br />
• If we simply throw out a guess without breaking down the<br />
estimating process, significant and biased errors may be<br />
made.<br />
• To estimate a project’s revenue, cost, or external effect, we<br />
should break the estimation processes down into several<br />
incremental steps. Because of the law of diversification, an<br />
error made in one step may be corrected by an opposite<br />
error in another step.<br />
• In addition, risk analysis will aid us in identifying those<br />
incremental estimates that significantly affect profitablility<br />
and warrant more research.<br />
59<br />
What is the role of the executive<br />
manager in the cash flow estimation<br />
process<br />
•Coordination with other<br />
departments<br />
•Maintaining consistency of<br />
assumptions<br />
•Elimination of biases in the<br />
forecasts<br />
60
61<br />
62<br />
What is cash flow estimation bias<br />
•CF’s are estimated for many future<br />
periods.<br />
•If company has many projects and<br />
errors are random and unbiased,<br />
errors will cancel out (aggregate<br />
NPV estimate will be OK).<br />
•Studies show that forecasts often are<br />
biased (overly optimistic revenues,<br />
underestimated costs).<br />
What steps can management take to<br />
eliminate the incentives for cash flow<br />
estimation bias<br />
•Routinely compare CF estimates with<br />
those actually realized and reward<br />
managers who are forecasting well,<br />
penalize those who are not.<br />
•When evidence of bias exists, the<br />
project’s CF estimates should be<br />
adjusted to offset the bias.<br />
63<br />
What is option value<br />
•Investment in a project may lead to<br />
other valuable opportunities.<br />
•Investment now may extinguish<br />
opportunity to undertake same<br />
project in the future.<br />
•True project NPV = NPV + value of<br />
options.