Summary Scaling Statistics - Percentages greater than ... - TISC
Summary Scaling Statistics - Percentages greater than ... - TISC
Summary Scaling Statistics - Percentages greater than ... - TISC

You also want an ePaper? Increase the reach of your titles
YUMPU automatically turns print PDFs into web optimized ePapers that Google loves.
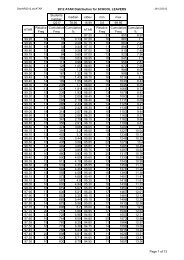
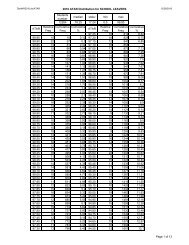
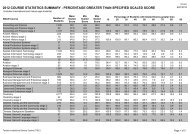
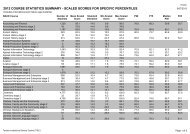
2010 COURSE STATISTICS SUMMARY - PERCENTAGE GREATER THAN SPECIFIED SCALED SCORE<br />
(Includes international and mature age students)<br />
27/12/2010<br />
WACE Course<br />
Number of<br />
Students<br />
Mean<br />
Scaled<br />
Score<br />
Min<br />
Scaled<br />
Score<br />
Max<br />
Scaled<br />
Score<br />
Percentage of Students with Scaled Scores <strong>greater</strong> <strong>than</strong><br />
10 20 30 40 50 60 70 80 90<br />
Computer Science 493 55.1 11.8 90.2 100.0 99.6 95.9 85.6 68.2 37.5 12.8 2.2 0.2<br />
Computer Science stage 2 129 41.8 11.8 70.7 100.0 98.4 86.8 58.1 23.3 4.7 0.8 0.0 0.0<br />
Computer Science stage 3 364 59.8 29.0 90.2 100.0 100.0 99.2 95.3 84.1 49.2 17.0 3.0 0.3<br />
Dance 360 53.2 9.4 90.5 99.7 99.4 94.4 81.4 57.5 34.2 10.3 2.2 0.3<br />
Dance stage 2 202 44.6 9.4 74.3 99.5 99.0 90.1 66.8 29.7 6.9 0.5 0.0 0.0<br />
Dance stage 3 158 64.1 40.8 90.5 100.0 100.0 100.0 100.0 93.0 69.0 22.8 5.1 0.6<br />
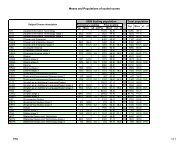
Design 592 52.4 5.0 96.7 99.8 98.5 94.1 80.4 57.9 28.5 11.0 3.4 0.3<br />
Design stage 2 394 47.0 5.0 81.6 99.7 97.7 91.1 72.6 42.9 12.7 3.6 0.3 0.0<br />
Design stage 3 198 63.2 32.2 96.7 100.0 100.0 100.0 96.0 87.9 60.1 25.8 9.6 1.0<br />
Drama 1,097 55.3 5.0 90.4 99.4 98.4 94.2 85.4 67.2 40.1 14.4 3.7 0.2<br />
Drama stage 2 201 37.5 5.0 73.0 96.5 91.0 73.6 44.8 13.9 5.0 0.5 0.0 0.0<br />
Drama stage 3 896 59.3 21.3 90.4 100.0 100.0 98.8 94.5 79.1 48.0 17.5 4.6 0.2<br />
Earth and Environmental Science 271 55.1 17.8 87.9 100.0 99.6 96.3 86.3 68.6 35.8 11.4 2.6 0.0<br />
Earth and Environmental Science stage 2 54 40.9 17.8 69.0 100.0 98.1 83.3 51.9 16.7 3.7 0.0 0.0 0.0<br />
Earth and Environmental Science stage 3 217 58.6 27.9 87.9 100.0 100.0 99.5 94.9 81.6 43.8 14.3 3.2 0.0<br />
Economics 2,073 62.7 16.0 95.1 100.0 99.9 98.6 95.4 85.2 60.5 27.8 7.3 0.7<br />
Economics stage 2 80 42.9 16.0 74.8 100.0 97.5 83.8 60.0 25.0 6.3 1.3 0.0 0.0<br />
Economics stage 3 1,993 63.4 21.3 95.1 100.0 100.0 99.2 96.8 87.7 62.7 28.9 7.6 0.8<br />
Engineering Studies 235 54.8 17.1 87.3 100.0 99.6 97.0 86.4 63.8 39.6 11.1 2.6 0.0<br />
Engineering Studies stage 2 84 43.5 17.1 67.6 100.0 98.8 91.7 66.7 26.2 6.0 0.0 0.0 0.0<br />
Engineering Studies stage 3 151 61.1 30.6 87.3 100.0 100.0 100.0 97.4 84.8 58.3 17.2 4.0 0.0<br />
English 11,788 56.3 2.9 90.8 99.9 99.1 95.7 85.6 69.6 44.0 15.7 2.8 0.0<br />
English stage 2 3,293 41.0 2.9 71.0 99.5 96.6 85.6 53.7 20.3 3.7 0.0 0.0 0.0<br />
English stage 3 8,495 62.2 21.9 90.8 100.0 100.0 99.7 98.0 88.8 59.7 21.7 3.9 0.0<br />
English as an Additional Language/Dialect 1,206 59.3 3.7 96.9 99.8 99.4 97.1 91.0 75.0 49.8 23.0 7.1 1.1<br />
English as an Additional Language/Dialect stage 2 305 47.6 3.7 84.7 99.3 98.0 90.8 74.4 42.0 16.7 5.6 0.7 0.0<br />
English as an Additional Language/Dialect stage 3 901 63.2 15.8 96.9 100.0 99.9 99.2 96.6 86.2 60.9 28.9 9.3 1.4<br />
Food Science and Technology 428 49.0 9.6 93.9 99.8 98.4 91.6 74.8 45.8 21.5 6.8 1.2 0.5<br />
Food Science and Technology stage 2 399 47.5 9.6 83.9 99.7 98.2 91.0 72.9 41.9 16.5 4.3 0.3 0.0<br />
Food Science and Technology stage 3<br />
29 69.6 53.3 93.9<br />
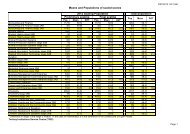
French 391 68.4 30.0 100.0 100.0 100.0 99.7 98.2 91.0 74.9 46.3 19.2 6.1<br />
French stage 2<br />
9 53.0 40.4 72.3<br />
French stage 3 382 68.8 30.0 100.0 100.0 100.0 99.7 98.2 92.1 76.2 46.9 19.6 6.3<br />
Geography 1,983 56.5 7.1 87.2 99.9 99.3 96.8 89.5 71.7 41.4 13.5 2.5 0.0<br />
Geography stage 2 266 40.6 7.1 70.7 99.6 95.5 82.3 52.3 18.8 4.5 0.4 0.0 0.0<br />
Geography stage 3 1,717 58.9 16.8 87.2 100.0 99.9 99.1 95.3 79.9 47.1 15.6 2.9 0.0<br />
Tertiary Institutions Service Centre (<strong>TISC</strong>)<br />
Page 2 of 5