Initiation and Termination of Oriental Fruit Moth Male Response to ...
Initiation and Termination of Oriental Fruit Moth Male Response to ...
Initiation and Termination of Oriental Fruit Moth Male Response to ...

Create successful ePaper yourself
Turn your PDF publications into a flip-book with our unique Google optimized e-Paper software.
<strong>Initiation</strong> <strong>and</strong> <strong>Termination</strong> <strong>of</strong> <strong>Oriental</strong> <strong>Fruit</strong> <strong>Moth</strong> <strong>Male</strong> <strong>Response</strong> <strong>to</strong><br />
Pheromone Concentrations in the Field1<br />
Department <strong>of</strong> En<strong>to</strong>mology, New York State Agricultural Experiment Station, Geneva, New York<br />
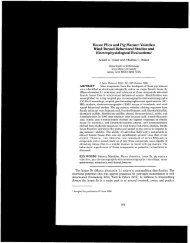
ABSTRACT<br />
Envuon En<strong>to</strong>rnol 10 21 1-218 (1981)<br />
The distance from the pheromone source at which Grapholitha molesta (Busck) males<br />
initiated walking, upwind flight, or wing fanning while walking varied directly with the<br />
pheromone emission rate Roughly a 10-fold increase in emission rate resulted in a ca 2-<br />
fold increase in mean maximum distance for initiation <strong>of</strong> these behaviors Also, an apparent<br />
upper concentration threshold in males caused upwind flight <strong>to</strong> be terminated at increasing<br />
distances from the source with increasing emission rates Thus, upper <strong>and</strong> lower thresholds<br />
apparently determine the boundaries <strong>of</strong> the "active distance" for upwind flight There was<br />
much daily variation in mean maximum active distance, possibly due <strong>to</strong> temperature effects<br />
upon male threshold The active distance estimates were used <strong>to</strong> design an optimal moni<strong>to</strong>ring<br />
trap deployment strategy <strong>to</strong> minimize attraction <strong>of</strong> males from areas surrounding<br />
orchards. Using Bossert <strong>and</strong> Wilson's equation for active space, the average lower (initiation)<br />
threshold for upwind flight was 7 2 x 10-17 g/cm3 <strong>and</strong> the upper (termination) threshold<br />
was 2 1 X 10"13 g/cm3 Their model should be altered so that active space is defined as the<br />
space where pheromone concentration is within both lower <strong>and</strong> upper thresholds for a<br />
particular behavior<br />
Introduction 8-dodecenyl acetate (Z8-12:Ac) (Roel<strong>of</strong>s et a1 1969,<br />
In recent years, the pheromone moni<strong>to</strong>ring trap has<br />
A M Card6 et al 1979), (E)-8-dodecenyl acetate (E8-<br />
become a valuable <strong>to</strong>ol in the management <strong>of</strong> lepidop-<br />
12:Ac) <strong>and</strong> (Z)-8-dodecenyl alcohol (Z8-12:OH) (A M<br />
terous pests While providing essential information on<br />
Card6 et a1 1979, Biwer et al 1979) The Z8-12:Ac<br />
adult population peaks insecticide spray timing or<br />
was purchased from Farchan Corporation <strong>and</strong> found <strong>to</strong><br />
predictive phenological models (Reidl et al 1976,<br />
contain over 3% <strong>of</strong> the (E) isomer as checked on a 10%-<br />
Welch et a1 1978), its usefulness for estimating popu-<br />
XF-1150 (50% cyanoethyl methylsilicone on 100-120<br />
lation density has been limited by a number <strong>of</strong> fac<strong>to</strong>rs<br />
mesh Chromosorb W-AW-DMCS) 2m x 2mm ID glass<br />
One is the lack <strong>of</strong> knowledge <strong>of</strong> the drawing range <strong>of</strong> GLC (gas-liquid chroma<strong>to</strong>gra~h~) "lumn in a Packad<br />
such traps, without which even rudimentary absolute<br />
model 7300 series gas chroma<strong>to</strong>graph An Ha flame ion-<br />
.<br />
density estimates cannot be made Correlating relative<br />
ization detec<strong>to</strong>r was used, <strong>and</strong> N9 at 25 ml/min was the<br />
capture frequencies dnectly <strong>to</strong> economic injury levels<br />
earner gas Oven temperature was 160° Retention<br />
would seem one way around the population estimate<br />
times were 3 1. 3 4, <strong>and</strong> 3 8 min for E8-12:Ac, Z8-<br />
problem, yet correlation accuracies still depend upon<br />
12:Ac, <strong>and</strong> Z8-12:OH, respectively We purified the Z8-<br />
variations in the traps> drawing ranges For example, 12:Ac by low Pressure liquid chroma<strong>to</strong>gra~h~ using a<br />
traps may attract males from outside the crop area, re- high-capacity cm I glass packed with 46<br />
suiting in an overestimation <strong>of</strong> the female population<br />
cm <strong>of</strong> 20% AgN03 on Silica Gel H@ (30-70 mesh) (I<br />
within the crop Such an error would presumably occur<br />
T Baker Co ) using a 955 Skellysolve-B:ethyl acetate<br />
more frequently with smaller plot sizes or with traps<br />
'ystem flOwin~ at mi/min The resulting purplaced<br />
closer <strong>to</strong> crop borders, but we can only speculate<br />
ified Z8-12:Ac contained 0 04% <strong>of</strong> the (E) isomer, deuntil<br />
actual drawing range measurements are made<br />
termined by GLC analysis on XF-1150 (using peak<br />
We wanted <strong>to</strong> make such measurements using several<br />
height X retention time), no detectable Z8-12:OH, <strong>and</strong><br />
Grapholitha molesfa (Busck) (<strong>Oriental</strong> ftuit moth) sex less than 0 1% other volatile impurities The E8-12:Ac,<br />
pheromone blend dosages, since we felt that dosage- obtained from Farchan Corp , also was purified on the<br />
dependent drawing range variation might allow traps <strong>to</strong> 20% AgN03 HPLC column The resulting E8-12:Ac<br />
be tailored for optimal positioning within an<br />
contained no detectable (Z) isomer or Z8-12:OH, <strong>and</strong><br />
Also, because pheromone emission rates had been deless<br />
than 0 5% other volatile impurities The Z8-12:OH,<br />
termined for some <strong>of</strong> the dosages ( ~ et al ~ 1980)~ k ~ made ~ by saponifying the above-~urified Z8-12:Ac> Conwe<br />
were interested in estimating male response threshtained<br />
0 1 % Z8- 12:Ac, 0 04% E8- 12:OH, no detectable<br />
olds <strong>and</strong> how they interact with emission rates <strong>to</strong> define<br />
E8-12:Ac, <strong>and</strong> less than 0 2% other volatile impurities<br />
the ''active distance " <strong>of</strong> pheromone communication as checked on XF-1150 The final three-component<br />
blend checked on XF-1150 was 5 9% E8-12:Ac <strong>and</strong><br />
Materials <strong>and</strong> Methods<br />
3 8% Z8-12:OH in Z8-12:Ac, formulated according <strong>to</strong><br />
Chemicals<br />
the optimal ratio <strong>of</strong> Baker <strong>and</strong> Card6 (1979a)<br />
The following have been identified as G molesta sex R~~~ <strong>and</strong> ~ ~ ~ d l i ~ ~<br />
pheromone components <strong>and</strong> were used in this study: (Z)-<br />
G molesta males were reared on small green thinning<br />
' Received for publication March 24, 1980<br />
apples on a 1691ight:dark pho<strong>to</strong>period regime at 25OC<br />
Present address Division <strong>of</strong> Toxicology <strong>and</strong> Physiology, Department <strong>of</strong> En<strong>to</strong>mology.<br />
University <strong>of</strong> California, Riverside, CA 92521<br />
<strong>and</strong> variable humidity Light:dark lighting intensities<br />
21 1<br />
@I 98 1 En<strong>to</strong>mological Society <strong>of</strong> America 0046-225x18 110202-1 108$02 0010
were 1400 <strong>and</strong> less than 0 3 lux, respectively Pupae<br />
were segregated by sex <strong>and</strong> the adult males were held<br />
at 25OC on a 16:8 pho<strong>to</strong>period regime in 33 X 27 X 3 1<br />
cm screen cages in rearing rooms where no females were<br />
kept <strong>Male</strong>s were additionally segregated by daily age,<br />
<strong>and</strong> were divided in<strong>to</strong> two groups in which sco<strong>to</strong>phase<br />
(dark phase) commenced at 1100 <strong>and</strong> 1500 h, respectively<br />
This pho<strong>to</strong>period shift allowed behavioral observations<br />
<strong>to</strong> be performed outdoors in the morning or<br />
afternoon at 0-3 h before sco<strong>to</strong>phase, the period <strong>of</strong> optimum<br />
pheromone response for G molesta (Baker <strong>and</strong><br />
Card&, 1979b) <strong>Male</strong>s for the mark-release-recapture<br />
experiment, however, were held on a 16:8 regime with<br />
lights-<strong>of</strong>f at 2030 h <strong>to</strong> coincide with outdoor conditions<br />
Measurements <strong>of</strong> Mean Maximum Active Distance <strong>of</strong><br />
<strong>Response</strong> <strong>Initiation</strong><br />
We used a large treeless recreation area with ca 10<br />
cm-high grass at the Geneva Experiment Station for<br />
these measurements A small part <strong>of</strong> the ca 10,000 m2<br />
triangular-shaped area was a gravel parking lot <strong>and</strong> was<br />
bordered by trees on two sides <strong>and</strong> a building on the<br />
third This experimental field had two desirable characteristics<br />
One was the lack <strong>of</strong> turbulence-producing<br />
obstructions or pheromone-adsorptive surfaces, <strong>and</strong> the<br />
other was the lack <strong>of</strong> surfaces that could harbor calling<br />
females (<strong>of</strong> other species) interfering with the measurements<br />
G molesta female interference also was minimized<br />
by conducting experiments in morning or afternoon<br />
using males on shifted pho<strong>to</strong>period schedules<br />
Pheromone was emitted from 1, 10, 100, or 1000 pgloaded<br />
rubber septa (A H Thomas, #8753-D22, sleeve<br />
type) impaled, large opening skyward, on an insect pin<br />
taped <strong>to</strong> the <strong>to</strong>p <strong>of</strong> a 1 7 m high, 5 cm dim steel pole<br />
anchored by a cement base The septum's vertical positioning<br />
made the chemical plume free <strong>of</strong> directionally<br />
biased septum turbulence The pin <strong>and</strong> <strong>to</strong>p <strong>of</strong> the pole<br />
were rinsed with ace<strong>to</strong>ne whenever septa were changed<br />
A smoke plume-generating apparatus was located 3 m<br />
away <strong>to</strong> indicate wind direction <strong>and</strong> <strong>to</strong> provide a parallel<br />
but separate marker for pheromone plume position Ammonium<br />
chloride smoke was produced by pumping air<br />
from a vacuum pump through separate flasks containing<br />
concentrated hydrochloric acid <strong>and</strong> ammonium hydroxide<br />
The vapors traveled up separate tubes whose openings<br />
met at the <strong>to</strong>p <strong>of</strong> an identical 1 7 m high pole where<br />
a dense plume <strong>of</strong> bluish-white smoke formed Depending<br />
on the predominant wind direction, the pheromone<br />
<strong>and</strong> smoke sources were maneuvered <strong>to</strong> minimize the<br />
plumes' overlap as the smoke could affect male behavior<br />
A cage <strong>of</strong> 4-5-day-old males was kept 50-100 m<br />
upwind <strong>of</strong> the pheromone source Immediately before<br />
testing, 3 males were removed <strong>and</strong> placed <strong>to</strong>gether in<br />
an 8 cm high x 10 cm basal diam screen cone completely<br />
open at the base After the males became quiescent,<br />
an observer began walking slowly <strong>to</strong>ward the pheromone<br />
source from several hundred meters downwind,<br />
with the open end <strong>of</strong> the cone held upwind at eye level<br />
The walker tried <strong>to</strong> keep the smoke approximately 3-5<br />
meters <strong>to</strong> the side at all times <strong>to</strong> maximize exposing the<br />
males <strong>to</strong> pheromone at all distances A distinct smoke<br />
plume was not usually visible past 50 m <strong>and</strong> so phero-<br />
mone plume position <strong>of</strong>ten had <strong>to</strong> be inferred by observing<br />
the smoke's direction from a distance Very little<br />
upwind, mostly lateral, walking was used with rapidly<br />
changing wind directions <strong>to</strong> maintain position with respect<br />
<strong>to</strong> the smoke but whenever the direction stabilized,<br />
the observer walked mostly upwind with small (less than<br />
5 m) lateral oscillations Upwind advancement also was<br />
prohibited when wind velocity exceeded 1 5 dsec, as<br />
moni<strong>to</strong>red on a Hastings-Raydist hot-wire anemometer<br />
by another observer near the source Velocities above<br />
1 5 dsec significantly reduced <strong>to</strong> nearly 0 the frequency<br />
<strong>of</strong> flight initiation by males in a labora<strong>to</strong>ry wind tunnel<br />
(see Results) Progress <strong>to</strong>ward the source during high<br />
velocities, therefore, would have biased against upwind<br />
flight active distances relative <strong>to</strong> those <strong>of</strong> walking <strong>and</strong><br />
wing fanning while walking<br />
While walking, the observer watched the males<br />
through the back <strong>of</strong> the cone Two <strong>of</strong> the 3 behaviors<br />
moni<strong>to</strong>red, walking <strong>and</strong> wing fanning while walking<br />
were scored either when one male exhibited the behavior<br />
for 3 or more continuous seconds, or at least 2 <strong>of</strong> the<br />
3 males exhibited the behavior simultaneously regardless<br />
<strong>of</strong> duration Upwind flight was scored when any <strong>of</strong><br />
the 3 males flew upwind out <strong>of</strong> the cage, regardless <strong>of</strong><br />
duration Flight trajec<strong>to</strong>ry was nearly always upwind<br />
initially, but it was not possible <strong>to</strong> follow males for more<br />
than a few meters owing <strong>to</strong> their small size <strong>and</strong> high<br />
flight velocity The upwind approach <strong>of</strong> flying males,<br />
therefore, was measured in a second experiment described<br />
in the next section The observer dropped flags<br />
coded for the behavior, pheromone dosage, <strong>and</strong> replicate<br />
at the site where the behavior was first observed Wind<br />
velocity at the time each flag was dropped was recorded<br />
by the second observer stationed with the anemometer<br />
Distances <strong>to</strong> the flags from the pheromone source were<br />
measured at the completion <strong>of</strong> the observations Cones<br />
were used once per experiment <strong>and</strong> rinsed with ace<strong>to</strong>ne<br />
between uses<br />
Measurements <strong>of</strong> Mean Active Distance <strong>of</strong> Upwind<br />
Flight <strong>Termination</strong><br />
A septum containing one <strong>of</strong> the same four dosages<br />
used above <strong>and</strong> impaled upright on an insect pin was<br />
attached <strong>to</strong> the <strong>to</strong>p <strong>of</strong> a 0 5 cm diam steel rod in the<br />
ground so that the septum was ca 15 cm above the<br />
grass Concentric string circles with radii <strong>of</strong> 10, 30,<br />
100, <strong>and</strong> 300 cm were placed around the septum Observations<br />
were performed between 1200 <strong>and</strong> 1500 h<br />
using 4-5-day-old males at 0-3 h before onset <strong>of</strong> labora<strong>to</strong>ry<br />
sco<strong>to</strong>phase After approaching from sidewind,<br />
the observer placed on the grass 5 m directly downwind<br />
<strong>of</strong> the septum a screen cone containing a single male<br />
The male's flight was then followed <strong>and</strong> scored for the<br />
closest approach <strong>to</strong> the septum using the string circles<br />
as guides A second observer stationed ca one m <strong>to</strong> the<br />
septum's side aided in tracking, capturing, <strong>and</strong> disposing<br />
<strong>of</strong> the males after they either <strong>to</strong>uched the septum or<br />
terminated upwind flight Only one upwind approach<br />
per male was allowed<br />
Mark-Release-Recapture<br />
From July 16 <strong>to</strong> August 3, 1979, at ca 4 h before<br />
sunset 2-5-day-old males were placed, 20 per bag, in<br />
'
April 1981<br />
BAKER AND ROELOFS: PHEROMONE RESPONSE INITIATION AND TERMINATION 213<br />
4-liter polyethylene bags containing a ca 100 mg <strong>of</strong><br />
DaygloB fluorescent powder The bags were agitated <strong>to</strong><br />
dust the males with sufficient powder <strong>to</strong> be visible later<br />
under ultraviolet light The powder's color was the code<br />
for the distance from a central pheromone trap at which<br />
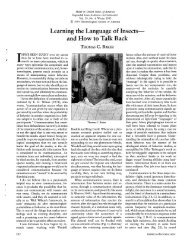
these males were <strong>to</strong> be released Four release points (20<br />
maleslrelease point) were 24 4 m from the trap, 4 were<br />
at 12 2 m, 2 at 6 1 m (40 males <strong>to</strong>tal), <strong>and</strong> 1 was at the<br />
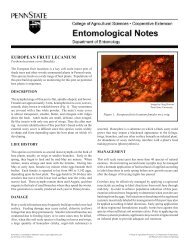
trap tree itself (Fig 1) At ca 2 5 h before sunset the<br />
bags were placed beneath their release-trees in each <strong>of</strong><br />
two semi-dwarf orchard plots, separated by 40 m On<br />
signal, workers in each plot began releasing males in<strong>to</strong><br />
the canopy <strong>of</strong> each tree by gently opening <strong>and</strong> shaking<br />
the bags All males were released within 10 minutes,<br />
<strong>and</strong> within the next 5 minutes, the Pherocona 1C traps<br />
were deployed One trap contained a 10 pg dose, the<br />
other a 100 pg dose per septum <strong>of</strong> the pheromone blend<br />
described earlier<br />
Traps were taken down the next morning <strong>and</strong> the<br />
males examined under UV light Before a new replicate<br />
was run, other traps were placed in the orchards for at<br />
least 3 days <strong>to</strong> capture colored males left in the area<br />
Effects <strong>of</strong> Wind Velocity <strong>and</strong> Temperature<br />
Wind velocity effects were observed in a 2 0 x 0 89<br />
x 0 96 m labora<strong>to</strong>ry wind tunnel (Miller <strong>and</strong> Roel<strong>of</strong>s,<br />
1978) Three males contained in a screen cone like that<br />
described earlier were placed on a 15 cm-high platform<br />
1 m downwind from a fan with the cone's open end<br />
facing upwind At r<strong>and</strong>om 1 <strong>of</strong> 4 wind velocities was<br />
MARK - RELEASE - RECAPTURE OF MALES<br />
Release Stations =@<br />
generated for 15 seconds, whereupon five 10 pg septa<br />
arrayed on 114" mesh screen in a "+ " formation (5 cm<br />
between the center <strong>and</strong> 4 outer septa) were introduced<br />
10 cm upwind <strong>of</strong> the males <strong>to</strong> insure their exposure <strong>to</strong><br />
pheromone The number <strong>of</strong> males walking, wing fanning<br />
while walking, <strong>and</strong> flying were recorded To measure<br />
wind velocities the anemometer was held at the<br />
cone's open end with the septum-holding device in position<br />
upwind <strong>Male</strong>s were used once <strong>and</strong> discarded<br />
To record temperature effects, the same three behaviors<br />
were observed at 14 5O, 16O, <strong>and</strong> 18OC A single 10<br />
pg septum was placed 1 5 m upwind <strong>of</strong> the cone containing<br />
3 males with the tunnel's fan generating wind<br />
at 0 36 dsec Again, males were used only once<br />
Results<br />
Mean Maximum Distances <strong>of</strong> <strong>Response</strong> <strong>Initiation</strong><br />
The distance from the pheromone source at which<br />
previously sitting males first exhibited walking, fanning<br />
while walking, or upwind flight varied directly with the<br />
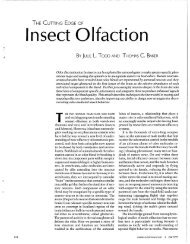
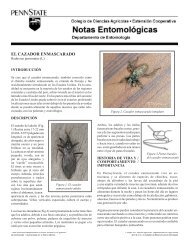
source dosage These mean maximum active distances<br />
(Fig 2) averaged over the entire experiment, showed a<br />
consistent pattern: higher dosages evoked responses at<br />
significantly greater distances than lower dosages In<br />
still air, the emission rates <strong>of</strong> Z8-12:Ac loaded at 10,<br />
100, <strong>and</strong> 1000 pg on septa were 1 2, 12, <strong>and</strong> 219 ng/<br />
h (1 pg is not known) (Baker et a1 , 1980) <strong>and</strong> so ca<br />
a 10-fold increase in emission rate resulted in slightly<br />
greater than a 2-fold increase in mean maximum active<br />
distance for any <strong>of</strong> the 3 behaviors moni<strong>to</strong>red R T<br />
Card6 (1979), using Bossert <strong>and</strong> Wilson's (1963) equa-<br />
Fanning While Walking<br />
males released at trap tree<br />
at 6 1 m (2 sta )<br />
at 12 2 m (4 sta )<br />
at 24 4 m (4 sta )<br />
FIG 1 -Location <strong>of</strong> release points for marked G molesia<br />
males, who were color-coded by distance <strong>of</strong> release from central<br />
moni<strong>to</strong>ring trap Two such plots were used, one with a 10<br />
pg- <strong>and</strong> the other with a 100 pg-baited moni<strong>to</strong>ring trap<br />
DISTANCE (MI FIRST OBSERVATION OF BEHAVIOR<br />
FIG. 2.-Mean maximum active distances <strong>of</strong> walking, upwind<br />
flight, <strong>and</strong> fanning while walking <strong>to</strong> four pheromone dosages<br />
For same behavior, means having no letters in common<br />
are significantly different according <strong>to</strong> an analysis <strong>of</strong> variance<br />
with Waller <strong>and</strong> Duncan's BSD test (P < 0 05). Brackets on<br />
the means indicate st<strong>and</strong>ard enor For 1000, 100, 10, <strong>and</strong> 1<br />
pg, respectively, for walking N = 32, 30, 30, <strong>and</strong> 25 replicates,<br />
upwind flight N = 20, 20, 22, <strong>and</strong> 16, <strong>and</strong> for fanning<br />
while walking N = 18, 23, 30, <strong>and</strong> 22 When a particular<br />
behavior did not occur, no value was entered
214 ENVIRONMENTAL ENTOMOLOGY Vol 10, no 2<br />
tion, calculated that a 10-fold increase in pheromone<br />
emission rate should elevate the mean maximum active<br />
distance 3 7-fold<br />
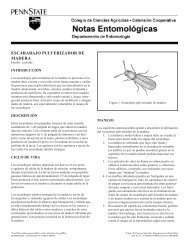
Although considerable daily variation occur~ed, the<br />
active distance rankings always followed those <strong>of</strong> dosage<br />
(Fig 3) These large daily variations appeared <strong>to</strong> be<br />
due <strong>to</strong> a large extent on temperature effects upon males'<br />
response thresholds Many reports have estimated a 16'<br />
flight threshold for male G molesta (Armstrong, 1929:<br />
Reichart <strong>and</strong> Bodor, 1972; Rothschild <strong>and</strong> Minks,<br />
1974) This estimate is supported by our data On days<br />
when the temperature was below 16', no males <strong>to</strong>ok<br />
flight, hence the active distance for flight was effectively<br />
zero Furthermore, in the wind tunnel flight initiation<br />
behavior at 14 5' <strong>and</strong> 16' was significantly less frequent<br />
than at 18' (Table 1) Other behaviors such as walking<br />
also were temperature-affected<br />
Similarly, wind velocity affected behavior, especially<br />
upwind flight, which was <strong>to</strong>tally suppressed at high velocities<br />
(Table 2) No wind suppression bias against upwind<br />
flight relative <strong>to</strong> other behaviors should ha ~e occurred<br />
in the field since the mean wind velocity<br />
concurrent with behavioral responses was 0 51 dsec<br />
(Â 41 S D ; range among dosages <strong>and</strong> behaviors 0 32-<br />
0 73 dsec) Labora<strong>to</strong>ry data suggest that certain velocity<br />
ranges may favor expression <strong>of</strong> one behavior over<br />
another (Table 2) However, walking occurred at as<br />
great a distance as upwind flight (Fig 2) in spite <strong>of</strong> an<br />
apparent bias in favor <strong>of</strong> flight at the lowest velocities,<br />
those predominating in the field This may be explained<br />
by the interaction <strong>of</strong> wind <strong>and</strong> velocity effects The fact<br />
that walking <strong>and</strong> upwind flight active distances were<br />
greater than fanning while walking implies that the first<br />
two behaviors have lower pheromone thresholds than<br />
SEPTUM 1<br />
DOSAGE<br />
100<br />
10 26 Jun 19"<br />
1<br />
100<br />
25 Jun 20'<br />
10 (PMI<br />
1<br />
iooo<br />
100<br />
10<br />
1<br />
1000<br />
100<br />
10<br />
25 Jun 17"<br />
1<br />
I I I I I I I I<br />
0 20 40 60 80 100 120 140<br />
DISTANCE (M) FIRST OBSERVATION OF WALKING<br />
FIG 3 -Daily variation in maximum active distance for<br />
walking apparently influenced by average temperature at the<br />
time <strong>of</strong> the observations. Brackets on means indicate st<strong>and</strong>ard<br />
error N = 3 for each dosage on each date Six other observation<br />
periods are not shown<br />
Table 1.-Effect <strong>of</strong> temperature on the percentage <strong>of</strong> G.<br />
molesta males responding <strong>to</strong> pheromone emitted from a<br />
rubber septum impregnated with 10 ;a.g <strong>of</strong> pheromone. Per -<br />
centages were taken after 30 sec <strong>of</strong> exposure <strong>to</strong> pheromone.<br />
Percentages in same row having no letters in common are<br />
significantly different according <strong>to</strong> a y2 2x2 test <strong>of</strong> independence<br />
with Yates' correction (P < 0.05). N = 45 for all<br />
treatments.<br />
Temperature ('C)<br />
% <strong>Male</strong>s flying 9c 42b 1 OOa<br />
% <strong>Male</strong>s fanning while<br />
walking 7ab 20a Ob<br />
% <strong>Male</strong>s walking 20a 20a Ob<br />
% <strong>Male</strong>s sitting 64a 18b Oc<br />
the latter under the average wind <strong>and</strong> temperature conditions<br />
<strong>of</strong> this study<br />
Average Distance <strong>of</strong> Upwind Flight <strong>Termination</strong><br />
One interesting result <strong>of</strong> this study was that although<br />
the two higher release rates had longer average maximum<br />
active distances than lower rates, the higher rates'<br />
active distances did not extend all the way <strong>to</strong> the source<br />
This was evidenced by a higher percentage <strong>of</strong> males<br />
terminating upwind flight before reaching the source <strong>to</strong><br />
the 1000 <strong>and</strong> 100 pg septa although just as many males<br />
initiated upwind flight as <strong>to</strong> the 10 pg septum (Table<br />
3) R T Carde et a1 (1975), using a different blend,<br />
observed that fewer males l<strong>and</strong>ed near a 1000 pg septum<br />
compared <strong>to</strong> 100 pg even though equal numbers flew<br />
upwind The average termination distances, 155 <strong>and</strong> 20<br />
cm for the 1000 <strong>and</strong> 100 pg septa, respectively (Table<br />
3), represent the upper limits <strong>of</strong> upwind flight active<br />
distances as dictated by an apparent upper response<br />
threshold in males This level probably was not reached<br />
at lower dosages where premature termination was rare<br />
<strong>and</strong> more likely attributable <strong>to</strong> visual responses <strong>to</strong> the<br />
septum or <strong>to</strong>o little pheromone A concentration approaching<br />
the lower threshold was occurring 5 m away<br />
from the one pg septum where males were released; ,<br />
only 40% <strong>of</strong> the males initiated upwind flight <strong>to</strong> one pg<br />
compared <strong>to</strong> 83-93% <strong>to</strong> the higher dosages<br />
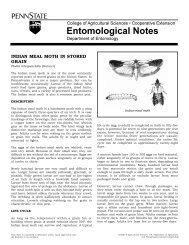
A composite picture <strong>of</strong> the data from both experi-<br />
,<br />
ments illustrates how the average upwind active distances<br />
become skewed away from the source as release<br />
rate increases (Fig 4) Applied <strong>to</strong> trapping strategies,<br />
it is clear that increasing the drawing range past a certain<br />
limit would have its trade-<strong>of</strong>f in losing "efficiency" at<br />
ciose range<br />
Mark-Release-Recapture<br />
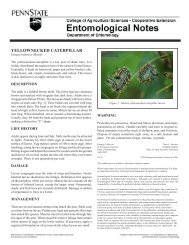
Recapture frequency by 10 pg relative <strong>to</strong> the 100 pg<br />
septum was not sharply reduced at greater than 12 2 m,<br />
contrary <strong>to</strong> what we expected from the average drawing<br />
ranges measured in the previous experiments (Fig 5)<br />
Instead, the 100 pg trap recaptured significantly more<br />
<strong>of</strong> the males released at all distances except at the trap<br />
tree Although dispersal from the release trees could<br />
have caused variation in the recapture pattern, the lack<br />
<strong>of</strong> dramatic drop-<strong>of</strong>f in recapture range may be explained<br />
by short-term fluctuations in active distance
April 1981<br />
BAKER AND ROELOFS: PHEROMONE RESPONSE INITIATION AND TERMINATION 215<br />
Table 2.-Effect<br />
<strong>of</strong> wind velocity in flight tunnel on the percentage <strong>of</strong> males responding <strong>to</strong> 5 septa containing 10 pg <strong>of</strong><br />
pheromone placed 10 cm upwind <strong>of</strong> the males. Percentage in same row having no letters in common are significantly<br />
different according <strong>to</strong> a x2 2x2 test <strong>of</strong> independence with Yates' correction (P < 0.05). N = 21, 39, 36, <strong>and</strong> 33 for the<br />
0.89, 1.18, 1.73, <strong>and</strong> 1.98 mlsec treatments, respectively.<br />
Mean Wind Velocity (mlsec) (± D )<br />
% <strong>Male</strong>s 1 sec<br />
Flying<br />
5 sec<br />
% <strong>Male</strong>s<br />
Fanning while<br />
walking<br />
1 sec<br />
5 sec<br />
% <strong>Male</strong>s 1 sec<br />
Walking<br />
5 sec<br />
% <strong>Male</strong>s 1 sec Ob 8b Ob 33a<br />
Sitting 5 sec Ob 5b 29a 33a<br />
Table 3.-Effect <strong>of</strong> pheromone dosage on upwind flight approaches <strong>to</strong> pheromone source by G molesta males released<br />
individually from 5 m downwind. Thirty males were released <strong>to</strong> each dosage. Those males reaching the source were scored<br />
as approaching <strong>to</strong> 0 cm.<br />
% <strong>Termination</strong> Upwind Flight<br />
-<br />
Septum X Closest approach Before reaching source2<br />
dosage <strong>to</strong> pheromone source1 % Upwind flight2 Before reaching 1m away2 (± D )<br />
1 Pg 8 3528 9cm bc 40% (12130) b 0% (0112) b 8% (1112) b<br />
10 Ug 1 9Â 6 3cm c 87% (26130) a 0% (0126) b 12% (3126) b<br />
100 Pg 20 0524 15cm b 93% (28130) a 4% (1128) b 88% (23128) a<br />
1000 pg 154 8596 Ocm a 83% (25130) a 56% (14125) a 100% (25125) a<br />
' Means in same column having no letters in common are significantly different according <strong>to</strong> the f-test (P < 0 05)<br />
Percentages in same column havmg no letters in common are significantly different according <strong>to</strong> a y2 2x2 test <strong>of</strong> independence with Yates' correction (P < 0 05)<br />
Mean Active Distance - Upwind Flight<br />
SEPTUM 80<br />
DOSAGE<br />
(pa)<br />
1000 77m<br />
100<br />
29m<br />
~~~s~~61<br />
'OOt<br />
RECAPTURED<br />
40 Q*700 pg<br />
1<br />
I I I I I I I<br />
0 2 4 6 8 1 0 1 2<br />
DISTANCE FROM PHEROMONE SOURCE (m)<br />
FIG 4 -A depiction <strong>of</strong> the mean active distances for upwind<br />
flight for the four different septum dosages using a composite<br />
<strong>of</strong> the data from Fig 2 <strong>and</strong> Table 3<br />
Although a time-averaged drawing range can be calculated<br />
(Fig 2), the real-time drawing range may fluctuate<br />
daily, hourly, 01 by the minute as a result <strong>of</strong> wind <strong>and</strong><br />
temperature effects on male response threshold A gust<br />
<strong>of</strong> wind suppressing male flight may send the upwind<br />
flight active distance from 100 m <strong>to</strong> nearly 0 <strong>and</strong> back<br />
<strong>to</strong> 100 in a few seconds as it passes Thus, because the<br />
10 <strong>and</strong> 100 pg active distances should be similarly affected<br />
by such meteorlogical fluctuations, the 100 pg<br />
trap's range should always exceed that <strong>of</strong> 10 pg (Fig<br />
3)<br />
20 long<br />
I I I I I I<br />
0 4 8 12 16 20 24<br />
DISTANCE (MI<br />
<strong>Male</strong>s Released From Moni<strong>to</strong>ring Trap<br />
FIG 5 -Percent recapture <strong>of</strong> males released at various distances<br />
away from a centrally-located moni<strong>to</strong>ring trap containing<br />
either a 10 or 100 pg-baited septum N = 85, 200, 320, <strong>and</strong><br />
320 for the 0, 6 1, 12 2, <strong>and</strong> 24 4 m release points, respectively<br />
Discussion<br />
Sex pheromone lures are usually formulated so that<br />
they capture a maximum number <strong>of</strong> males These maximal<br />
captures result from a trade-<strong>of</strong>f between drawing<br />
range <strong>and</strong> efficiency (males captured divided by number<br />
<strong>of</strong> approaches) that was evident from our data for G<br />
molesta The maximum upwind flight active distance
(drawing range), increased <strong>to</strong> greater distances from the<br />
source with increased pheromone dosage, but so did<br />
termination <strong>of</strong> upwind flight Thus, the boundaries <strong>of</strong><br />
the active distance (Fig 4) apparently are determined<br />
by lower <strong>and</strong> uppex thresholds <strong>of</strong> male response, as hypothesized<br />
from trap catch data by Roel<strong>of</strong>s (1978) for<br />
other species These thresholds explain why, despite a<br />
greater drawing range, traps containing 1000 pg capture<br />
fewer males than those with 200 pg (Roel<strong>of</strong>s <strong>and</strong> Card&,<br />
1974) or 100 pg (Baker <strong>and</strong> Roel<strong>of</strong>s, unpublished data)<br />
Compared <strong>to</strong> 1000 pg, traps containing 100 pg will<br />
have a shorter drawing range, but more males will approach<br />
close enough <strong>to</strong> l<strong>and</strong> <strong>and</strong> be captured (Fig 4)<br />
Knowledge <strong>of</strong> differences in drawing ranges between<br />
dosages can be utilized <strong>to</strong> obtain more accurate withinorchard<br />
population estimates by placing moni<strong>to</strong>ring<br />
traps far enough from edges so that males are not likely<br />
<strong>to</strong> be attracted from surrounding woods <strong>and</strong> fields G<br />
molesta is found genexally only within orchards, so these<br />
considerations are probably not <strong>to</strong>o important for this<br />
species, but they may be for more highly polyphagous<br />
species However, fox G molesta, the upwind flight<br />
active distances indicated that the 10 pg septum is ideally<br />
suited <strong>to</strong> moni<strong>to</strong>r smaller areas near edges, corners<br />
or in small oxchard blocks (Fig 6) The 20 m maximum<br />
recorded upwind flight active distance (dashed line) is<br />
the closest <strong>to</strong> the edge that 10 pg-containing traps should<br />
be placed although the average active distance is 12 m<br />
(solid line) Convexsely, the 100 pg dosage may be used<br />
in traps placed in the centex <strong>of</strong> larger blocks (Fig 6) <strong>to</strong><br />
detect the presence <strong>of</strong> males over a wider area determined<br />
by the 29 m average active distance Placement<br />
<strong>of</strong> the trap at least 80 m from any edge would preclude<br />
attracting males from beyond the orchard Finally, if<br />
fine-grained sampling were needed <strong>to</strong> locate localized<br />
high-density populations, a dense grid <strong>of</strong> small active<br />
distance traps such as 1 or 10 pg could be deployed<br />
Fac<strong>to</strong>rs Affecting the Measurements<br />
All measurements were made in an open field so that<br />
we could measure maximum possible active distances<br />
<strong>and</strong> the measurements from this simplified environment<br />
may not be perfectly applicable <strong>to</strong> an orchard If they<br />
differ though, the orchard distances should be shorter<br />
due <strong>to</strong> reasons discussed earlier<br />
Anothex fac<strong>to</strong>r possibly influencing the measurements<br />
was subthreshold pre-exposure <strong>to</strong> phexomone during the<br />
observer's walk upwind Such low-grade exposure also<br />
likely occurs under orchard conditions <strong>to</strong> both trap- <strong>and</strong><br />
female-emitted pheromone <strong>and</strong> thus our data may actually<br />
be more representative <strong>of</strong> xeal moni<strong>to</strong>ring conditions<br />
than measurements eliminating such exposure Our<br />
objective was not <strong>to</strong> describe moleculax concentration<br />
patterns, a difficult task because male threshold changes<br />
must be fac<strong>to</strong>red out Rather, oux goal merely was <strong>to</strong><br />
measure the average maximum active distances which<br />
vary with both concentrations <strong>and</strong> threshold It appeared<br />
that for G molesta wind <strong>and</strong> temperature-induced<br />
threshold variation may have a great influence upon active<br />
distance<br />
Actzve Space Models<br />
Nakamura (1976a) attempted <strong>to</strong> measure the active<br />
space <strong>of</strong> Spodoptera lztura (F ) sex phexomone at one<br />
FIG 6 -A depiction <strong>of</strong> the possible optimal placement <strong>of</strong><br />
mo~<strong>to</strong>ring traps for G molesta containing the 10 pg septum<br />
(lower dot) <strong>and</strong> 100 pg septum (upper dot) For both traps the<br />
solid line represents the average maximsm drawing range, <strong>and</strong><br />
the dashed line represents the maximum observed drawing<br />
range<br />
dosage <strong>and</strong> compared it <strong>to</strong> the active space generated by<br />
calling females His objectives differed from ours, <strong>and</strong><br />
included trying <strong>to</strong> infer moleculax concentration changes<br />
with wind velocity Using males in completely enclosed<br />
cages, he found that for S lztura the average active<br />
distance for flight (upwind flight could not be measured<br />
within the cages) was ca 35 m In contrast <strong>to</strong> our findings<br />
with G molesta (Fig 21, walking appeared <strong>to</strong> have<br />
the highest threshold, occuxring only near the source,<br />
whereas wing fanning occurred farther away Nakamuxa<br />
(1976b, 1979) concluded that a double active space, one<br />
long <strong>and</strong> the other short, corresponding <strong>to</strong> the two different<br />
S litura phexomone components, was the most<br />
effective model for explaining male attraction For G<br />
molesta the three components used in this study act as<br />
a unit in influencing all stages <strong>of</strong> behavior (Baker <strong>and</strong><br />
Card&, 1979a) Hence, only one active space need be<br />
considered, that produced by the entire blend <strong>and</strong> its<br />
corresponding tl~resholds <strong>of</strong> initiation <strong>and</strong> termination<br />
<strong>of</strong> upwind flight<br />
The equations <strong>of</strong> Sut<strong>to</strong>n (1953) for molecular diffusion<br />
in wind, <strong>and</strong> Bossert <strong>and</strong> Wilson (1963) for the ,<br />
corresponding above-threshold molecular concentration,<br />
or "active space", have been the most widely used for<br />
describing pheromone concentxation effects under varying<br />
wind conditions Bossert <strong>and</strong> Wilson's equation for<br />
maximum actlve distance, Xlllf,x, <strong>of</strong> a continually-emitting<br />
pheromone source in moderate wind is:<br />
Where Q is the emission rate, K is the male response<br />
threshold, U is the average wind velocity, Cy <strong>and</strong> Cz<br />
are diffusion constants determined by wind pr<strong>of</strong>ile <strong>and</strong><br />
surface roughness, <strong>and</strong> n is an undetermined constant<br />
Since emission rates, Q, for 10, 100, <strong>and</strong> 1000 pg septa<br />
<strong>of</strong> Z8-12:Ac in still air at 23'C are 1 2, 12, <strong>and</strong> 219 ngl<br />
h (Baker et a1 , 1980), these values may be substituted<br />
in<strong>to</strong> the above equation for Q Then, solving for K <strong>and</strong><br />
using the suggested values (Sut<strong>to</strong>n, 1953) <strong>of</strong> 0 4 cm1I8,<br />
0 2 cm 'Iu, <strong>and</strong> 114 for Cy, Cz, <strong>and</strong> n, respectively, the
April 198 1<br />
BAKER AND ROELOFS: PHEROMONE RESPONSE INITIATION AND TERMINATION 217<br />
three threshold estimates starting with the lowest <strong>of</strong> the haviorally "active" concentrations delimiting an active<br />
three emission rates are 2 13 X 10-17, 4 50 X 10-17, space<br />
<strong>and</strong> 1 50 X 10-l6 g/cm3 Average wind speed U , was<br />
0 51 m/ sec These values <strong>of</strong> K, within an order <strong>of</strong> AcknowIedgrnent<br />
magnitude <strong>of</strong> each other, indicate that our maximum We thank W, Meyer for excellent technical assistance<br />
active distance measurements conform closely <strong>to</strong> those in the field <strong>and</strong> labora<strong>to</strong>ry, <strong>and</strong> F Wadhams, B, Carney,<br />
predicted by the Bossert <strong>and</strong> Wilson equations, Some <strong>and</strong> K Poole for rearing G molestu adults,<br />
possible reasons for the observed variations are: the values<br />
substituted for the constants Cy, Cz, <strong>and</strong> n may not<br />
REFElUZNCES CITED<br />
be cOrlect the average wind <strong>and</strong> surface Armstrong, T. 1929. Notes on the life his<strong>to</strong>ry <strong>of</strong> the <strong>Oriental</strong><br />
ness in Our experiments; the emi~~i0n late values cal- peach moth at Vinel<strong>and</strong> Station Rep En<strong>to</strong>m01 SOC Ont<br />
culated in still air may not vary linearly with wind ve- 59: 65-72<br />
locity; <strong>and</strong> the initiation <strong>of</strong> upwind flight in males may Baker, T. C., <strong>and</strong> R. T. Carde. 1979a. Analysis <strong>of</strong> pherohave<br />
been due <strong>to</strong> instantaneous pea concentrations mone-mediated behavior in male Grapholitha molesta, the<br />
rather than the time-averaged concentration required by oriental fruit moth, (Lepidoptera: Tortricidae) Environ<br />
Sut<strong>to</strong>n's <strong>and</strong> therefore, Bossert <strong>and</strong> Wilson's equation En<strong>to</strong>mol 8: 956-68<br />
using the same formula, we<br />
the<br />
Baker, T. C., <strong>and</strong> R. T. Card& 1979b. Endogenous <strong>and</strong><br />
exogenous fac<strong>to</strong>rs affecting female calling <strong>and</strong> male sex<br />
thresholds for upwind flight dictated by the average dispheromone<br />
response in Grapholitha molesta (Busck) ,J<br />
tance where upwind flight terminated (Table 3) These Insect physiol 25: 943-50<br />
XVKIZ values <strong>of</strong> 0 20 <strong>and</strong> 1,55 m for the lo0 <strong>and</strong> l0o0 Baker, T. C., R. T. Carde, <strong>and</strong> J. R. Miller. 1980. <strong>Oriental</strong><br />
~g septa (Q for each as before) result in upper thresholds fruit moth pheromone component release rates measured<br />
<strong>of</strong> 2 7 x 10-l3 <strong>and</strong> 1 4 X 10-l3 g/cm3, respectively after collection by glass surface absorption I Chem<br />
Interestingly, the average upper threshold <strong>of</strong> 2 1 X 10-l3 Ecol. 6: 749-58<br />
g/cm3 is about 3,000 times higher than the average lower Biwer, G., c. Descvins, <strong>and</strong> M. Gallvis. 1979. ~tude des<br />
threshold, 7 2 x 10-17 g/cm3 ~ h for this ~ blend, ~ , the constituants volatils presents dans la gl<strong>and</strong>e productrice de<br />
active distance boundaries for upwind flight are dictated<br />
pheromone de la femelle vier% de Grapholitha molests<br />
Busck, Lepidoptere <strong>to</strong>rtricidae (Olethreutinae) C R Acad<br />
by threshold limits differing by only a little more than 3<br />
sc 2gg: 413-6<br />
magnihde a Bossert, W. He, <strong>and</strong> E. 0. WiIsvn. 196'3. The analysis <strong>of</strong><br />
range The data for termination <strong>of</strong> upwind flight give an ol~ac<strong>to</strong>Iy commu~cat~on among ,I ~h~~~~<br />
idea <strong>of</strong> the steepness <strong>of</strong> the time-averaged concentration ~ i 5:'443-69 ~ l<br />
gradient near the source (Table 3) Assuming a constant Carde, A. M., T. C. Baker, <strong>and</strong> R, T. Carde. 1979. Identhreshold,<br />
an 18-fold increase in effective concentration tification <strong>of</strong> a four-component sex phe~omone <strong>of</strong> the fe-<br />
(12 ng/hr <strong>to</strong> 219 nglhr) must have occurred in the 135 male <strong>Oriental</strong> fruit moth, Grapholitha molesta (Lepidopcm<br />
from 20 cm <strong>to</strong> 155 cm from the source where upwind tera: T~rtri~idae) 1 them FkO1 5: 423-7,<br />
flight s<strong>to</strong>pped clearly, B~~~~~~ <strong>and</strong> ~ i l model ~ ~<br />
Carde,<br />
~ 3<br />
R. T. ~<br />
1979. Behavioral responses <strong>of</strong> moths <strong>to</strong> femaleproduced<br />
pheromones <strong>and</strong> the utilization <strong>of</strong> attractantmust<br />
be dtered so that active space is defhed as the<br />
baited traps fox population moni<strong>to</strong>ring In R L Rabb <strong>and</strong><br />
space where pheromone concentration is within both<br />
Kennedy (eds ) Movement <strong>of</strong> highly inlower<br />
<strong>and</strong> upper thresholds for a particular behavior sects: concepts <strong>and</strong> methodology in xeseach North Car-<br />
We do not know whether other blends have more olina St Univ , pp 286-301<br />
restricted threshold ranges <strong>and</strong> correspondingly nar- Carde, R. T., T. C. Baker, <strong>and</strong> W. L. Rvel<strong>of</strong>s. 1975. Ethrower<br />
active distance boundaries, but field obse~vations ological function <strong>of</strong> components <strong>of</strong> a sex attractant system<br />
<strong>of</strong> males flying upwind <strong>to</strong> a range <strong>of</strong> (E)-(z) ratios in- for <strong>Oriental</strong> fruit moth males, Grapholizha rnolesta (Lepdicate<br />
that the upper threshold is probably lower <strong>to</strong> t~eat- idoptera: ' 475-91<br />
MiUer, J. R., <strong>and</strong> W. L. Rvel<strong>of</strong>s. 1978. Sustained-flight tunmerits<br />
with increashg (Baker 2nd 1979a)<br />
nel for measuring insect responses <strong>to</strong> wind-borne sex pher-<br />
<strong>Male</strong>s did not approac5 as closely <strong>to</strong> the dispenser, exomone<br />
them ,+ol 4: 187-9g<br />
hibiting reduced <strong>to</strong>lerance <strong>to</strong> <strong>to</strong>o much (E), This should r+akamura, K. 197~~. The <strong>of</strong> wind velocity on the<br />
create a more restricted active distance, provided the diffusion <strong>of</strong> spodoptera litura (F ) sex pheromone, ~~~l<br />
lower threshold did not also become lower, <strong>and</strong> would ent ZOOI 4: 312-9<br />
explain reduced male captures <strong>to</strong> those blends (Baker Nakamura, K. 1976b. The active space <strong>of</strong> the pheromone <strong>of</strong><br />
<strong>and</strong> Card&, 1979a), On the other h<strong>and</strong>, trap catch data Spodoptera litura <strong>and</strong> the attraction <strong>of</strong> adult males <strong>to</strong> the<br />
from a variety <strong>of</strong> species implies that non-optimal blends pheromone source, PP 145-55 "lnSect <strong>and</strong><br />
CaE duplicate the threshold span <strong>of</strong> fie optimal blend, Their Applications " <strong>of</strong> a ~ Y ~ P on O in- ~ ~ U ~<br />
sect pheromones <strong>and</strong> their applications, Nagaoka <strong>and</strong> Tobut<br />
behavioral observations are needed <strong>to</strong> test this hykyo<br />
December g- 1976<br />
pothesis (Roel<strong>of</strong>s 1978)<br />
Nakamura, K. 1979. Effect <strong>of</strong> the minor component <strong>of</strong> the<br />
It is that a P~~~~~~~~ in pheromone sex pheromone on the male orientation <strong>to</strong> pheromone<br />
&apping, exploiting the full range <strong>of</strong> emitted concentlations<br />
between the lower <strong>and</strong> upper thresholds would be<br />
source in Spodoptera litura (F ), Xemop Hac 4: 153-6<br />
Reichart, G., <strong>and</strong> J. Bvdvr. 1972. Biology <strong>of</strong> the <strong>Oriental</strong><br />
desirable for trapping over the widest possible area, fruit moth (Grapholitha molestu Busck) in Hungay Acta<br />
whereas an emission concentration slightly above the Phy<strong>to</strong>pathol Acad Sci Hung '7: 279-95<br />
lower threshold would be best when a smaller drawing Reidl, H., B. A. Crvfi, <strong>and</strong> A. J. Howitt. 1976. Forecasting<br />
lange is needed Further work should insight as codling moth he no log^ hued on pheromone catches<br />
<strong>to</strong> how changes in blend quality alter the range <strong>of</strong> be.<br />
<strong>and</strong> ~hY~io~o~ica~-time models can En<strong>to</strong>m01 108: 449-<br />
60
218 ENVIRONMENTAL ENTOMOLOGY Vol 10, no 2<br />
Roel<strong>of</strong>s, W. L. 1978. Threshold hypothesis for pheromone<br />
perception J Chem Ecol 4: 685-99<br />
Roel<strong>of</strong>s, W. L., <strong>and</strong> R. T. Carde. 1974. <strong>Oriental</strong> fruit moth<br />
<strong>and</strong> lessex applewo~m attractant mixtures ~efined Envi~on<br />
En<strong>to</strong>mol 3: 586-8<br />
Roel<strong>of</strong>s, W. L., A. Comeau, <strong>and</strong> R. SelIe. 1969. Sex pheromone<br />
<strong>of</strong> the <strong>Oriental</strong> fruit moth Nature 244: 723<br />
Rothschild, G. H. L., <strong>and</strong> A. K. Minks. 1974. Time <strong>of</strong><br />
activity <strong>of</strong> male Oxiental fruit moths at pheromone sources<br />
in the field Environ En<strong>to</strong>mol 3: 1003-7<br />
Sut<strong>to</strong>n, 0. G. 1953. "Micrometeorology " McGraw-Hill,<br />
New Yolk 333 pp<br />
Welch, S. M., B. A. Cr<strong>of</strong>t, J. F. Brunner, <strong>and</strong> M. F. Michels.<br />
1978. PETE: an extension phenology modeling system<br />
for management <strong>of</strong> multi-species pest complex Environ<br />
En<strong>to</strong>mol 7: 487-94<br />
Reprinted from the<br />
ENVIRONMENTAL ENTOMOL,OGY