New Orleans Market Assessment - Louisiana
New Orleans Market Assessment - Louisiana
New Orleans Market Assessment - Louisiana

You also want an ePaper? Increase the reach of your titles
YUMPU automatically turns print PDFs into web optimized ePapers that Google loves.
Institute for Economic Development and Real Estate Research<br />
March 14, 2011<br />
Mr. David Bowman<br />
Director of Research and Special Projects<br />
Disaster Recovery Unit, Office of Community Development<br />
Post Office Box 94095<br />
Baton Rouge, LA 70804‐9095<br />
Dear Mr. Bowman,<br />
We are pleased to deliver our final report focusing on market trends and conditions in the <strong>New</strong><br />
<strong>Orleans</strong> region. This is final report, where appropriate and possible, incorporates suggestions<br />
based on comments received from those who reviewed the draft version of the document.<br />
We have enjoyed working with you on this challenging assignment and look forward to hearing<br />
from you if you have any questions or if we can be of further assistance.<br />
Sincerely,<br />
Ivan J. Miestchovich, Jr., Ph.D.<br />
Director and Associate Professor of Finance<br />
413 Kirschman Hall 2000 Lakeshore Drive <strong>New</strong> <strong>Orleans</strong>, LA 70148 504.280.1408 Fax: 504.280.3952<br />
A Member of the <strong>Louisiana</strong> State University System Committed to Equal Opportunity
Table of Contents<br />
Executive Summary: Overview of Current <strong>Market</strong> Conditions .............................................................. 7<br />
Forward: Overview and Methodology ................................................................................................ 11<br />
Purpose ................................................................................................................................................... 11<br />
Affordable Housing Needs versus Housing Demand .............................................................................. 11<br />
Sources .................................................................................................................................................... 13<br />
Limitations of the Report ........................................................................................................................ 15<br />
History of the Rental <strong>Market</strong> in <strong>New</strong> <strong>Orleans</strong> Metropolitan Area ....................................................... 16<br />
Graph 1: Apartment Occupancy and Permit History .......................................................................... 16<br />
Pre‐1970’s ............................................................................................................................................... 17<br />
Table 1: Profile of Renter Occupied Housing ...................................................................................... 17<br />
Table 2: Age of Structure, Renter Occupied Housing ......................................................................... 18<br />
Table 3: Units in Structure and Age of Structure ................................................................................ 18<br />
The 1970’s ............................................................................................................................................... 19<br />
The 1980’s ............................................................................................................................................... 20<br />
The 1990’s and Beyond ........................................................................................................................... 21<br />
Table 4: Average Occupancy <strong>New</strong> <strong>Orleans</strong> Metropolitan Area, 1974 to 2010 ................................... 23<br />
Table 5: Housing Production and Wage and Salary Employment History by Decade ........................ 24<br />
Residential Construction, 2003 – 2010 ............................................................................................... 25<br />
Single Family <strong>New</strong> Construction ............................................................................................................. 25<br />
Table 6: Residential Building Permits: Single Family Housing, 2000 ‐ November 2010 ..................... 28<br />
Multi‐Family <strong>New</strong> Construction .............................................................................................................. 28<br />
Table 7: Residential Building Permits: Multi‐Family Housing, 2000 ‐ November 2010 ...................... 29<br />
Apartment Occupancy Trends: 2004 – 2010 ...................................................................................... 31<br />
Occupancy Trends: <strong>Market</strong> Rate Units ................................................................................................... 31<br />
Table 8: Household Estimates for <strong>New</strong> <strong>Orleans</strong> Metro Area .............................................................. 35<br />
Table 9: Apartment Occupancy Summary, 2004 ‐ 2010 ..................................................................... 37<br />
Table 10: Apartment Occupancy Summary of Units Reporting Occupancy Each Survey Period, 2004 ‐<br />
2010 .................................................................................................................................................... 38<br />
Occupancy Trends: Age and Size of Property ......................................................................................... 39<br />
<strong>New</strong> <strong>Orleans</strong> <strong>Market</strong> <strong>Assessment</strong> – An Analysis of Supply and Demand Dynamics 1
Table 11: <strong>Market</strong> Rate Apartment Occupancy by Complex Size by Area, 2010 ................................. 40<br />
Table 12: <strong>Market</strong> Rate Apartment Occupancy by Age by Parish, 2010 .............................................. 40<br />
Occupancy Trends: Mixed Income Property ........................................................................................... 41<br />
Table 13: <strong>New</strong> <strong>Orleans</strong> Mixed Income Properties: Occupancy Summary – Total Units, 2010 ........... 41<br />
Table 14: <strong>New</strong> <strong>Orleans</strong> Mixed Income Properties: Occupancy and Rent Summary – <strong>Market</strong> Rate<br />
Units, 2010 .......................................................................................................................................... 41<br />
Table 15: <strong>New</strong> <strong>Orleans</strong> Mixed Income Properties: Occupancy Summary – Rent Assisted Units, 2010<br />
............................................................................................................................................................ 42<br />
Apartment Rent Trends: 2004 – 2010 ................................................................................................ 43<br />
Rent Trends: <strong>Market</strong> Rate Units ............................................................................................................. 43<br />
Table 16: Apartment Rent Summary, 2004 ‐ 2010 ............................................................................. 45<br />
Graph 2: <strong>New</strong> <strong>Orleans</strong> Metro Rent Trends, 2004 ‐ 2010 .................................................................... 45<br />
Table 17: Apartment Rent Summary of Units Reporting Occupancy Each Survey Period, 2004 ‐<br />
2010 .................................................................................................................................................... 46<br />
Graph 3: Apartment Occupancy and Rent Trends, 1973 ‐ 2010 ......................................................... 46<br />
Rent Trends: Mixed Income Property ..................................................................................................... 47<br />
Table 18: <strong>New</strong> <strong>Orleans</strong> Mixed Income Properties <strong>Market</strong> Rate Rent Summary, 2010 ...................... 48<br />
Rent Trends: Subsidized Housing ............................................................................................................ 49<br />
Table 19: 2010 Rent Limits ‐ Income Categories (inclusive of utilities) .............................................. 49<br />
Table 20: Multi‐Family Development Units Renting or Under Construction, by Income Range and<br />
Unit Type, <strong>New</strong> <strong>Orleans</strong> ...................................................................................................................... 49<br />
Table 21: Multi‐Family Units Renting or Under Construction, by Income Range and Unit Type, <strong>New</strong><br />
<strong>Orleans</strong> Metro Area ............................................................................................................................ 50<br />
Profile of Subsidized Rental Housing .................................................................................................. 51<br />
Table 22: Descriptive Profile of Rental Assistance Programs ............................................................. 52<br />
Table 23: Income Distribution by Tenure in <strong>New</strong> <strong>Orleans</strong> .................................................................. 53<br />
Graph 4: Cost of Renting, 2004 vs. 2009 ............................................................................................. 54<br />
Low Income Housing Tax Credit (LIHTC) Properties ............................................................................... 54<br />
Table 24: Subsidized Multi‐Family Development Units Post‐Katrina ................................................. 55<br />
Table 25: LIHTC/Piggyback/LHFA <strong>New</strong> <strong>Orleans</strong> Pipeline by Planning District .................................... 55<br />
Table 26: Mixed Finance Developments (non‐Public Housing) .......................................................... 56<br />
Table 27: Mixed Income Public Housing Redevelopment .................................................................. 57<br />
Table 28: Mixed Finance Developments Placed in Service ................................................................. 58<br />
<strong>New</strong> <strong>Orleans</strong> <strong>Market</strong> <strong>Assessment</strong> – An Analysis of Supply and Demand Dynamics 2
Public Housing Communities .................................................................................................................. 58<br />
Table 29: Public Housing Status Report – <strong>New</strong> Developments .......................................................... 58<br />
Tenant‐based Section 8 Vouchers .......................................................................................................... 59<br />
Table 30: Tenant‐based Vouchers by Planning District, 2010 ............................................................ 60<br />
Profile of the Rental Housing Stock and Storm Damage...................................................................... 62<br />
Table 31: Units per Structure – Occupied Rental Units ...................................................................... 62<br />
Storm Damage Summary and Rebuilding Profile .................................................................................... 63<br />
Table 32: Katrina’s Damage to Rental Stock by Planning District ....................................................... 64<br />
Small‐Scale Rental Properties............................................................................................................. 66<br />
Table 33: Summary of Rents for Small Rentals, Field, Phone and Internet Survey ............................ 67<br />
Map 1: Landscape of Rental Units in <strong>New</strong> <strong>Orleans</strong> by Planning District ............................................. 68<br />
Table 34: Parcel‐Level Analysis of the Rental <strong>Market</strong>, December 2010 ............................................. 69<br />
Graph 5: Occupied Rental Units by Structure Type ............................................................................ 69<br />
Map 2: Owner‐occupied units in 2005; Currently Active but No Homestead Exemption .................. 70<br />
(units either under renovation, for sale/lease, or rented) ................................................................. 70<br />
Road Home Small Rental Program .......................................................................................................... 70<br />
Map 3: Road Home Small Rental Participants by Status .................................................................... 71<br />
Table 35: Summary of Small Rental Program by Parish ...................................................................... 72<br />
Table 36: Summary of Small Rental Program by Planning District in <strong>New</strong> <strong>Orleans</strong> ............................ 73<br />
Profile of MLS Single Family Home Rentals ............................................................................................ 74<br />
Table 37: Summary of Single Family Homes Rented, <strong>New</strong> <strong>Orleans</strong> Region by Parish and Sector:<br />
2008‐2010 ........................................................................................................................................... 76<br />
Table 38: Summary of Single Family Homes Listed for Rent, <strong>New</strong> <strong>Orleans</strong> Region by Parish and<br />
Sector, As of February 15, 2011 .......................................................................................................... 77<br />
Single Family Price and Sales Activity Trends: 2000 to 2010 ................................................................ 78<br />
Regional Overview .................................................................................................................................. 78<br />
Table 39: Summary of Foreclosure Filings, <strong>New</strong> <strong>Orleans</strong> Region, 2009 to 2010 ................................ 80<br />
Table 40: Existing Housing Price Trends, <strong>New</strong> <strong>Orleans</strong> Metropolitan Area ........................................ 81<br />
Table 41: Units Sold and Days on <strong>Market</strong> Single Family Residential, <strong>New</strong> <strong>Orleans</strong> Metropolitan Area<br />
............................................................................................................................................................ 82<br />
Graph 6: Single Family Average Price and Units Sold, Metro <strong>New</strong> <strong>Orleans</strong>: 2004 – 2010 ................. 83<br />
Graph 7: Single Family Average Price and Units Sold, Jefferson Parish: 2004 – 2010 ........................ 83<br />
<strong>New</strong> <strong>Orleans</strong> <strong>Market</strong> <strong>Assessment</strong> – An Analysis of Supply and Demand Dynamics 3
Graph 8: Single Family Average Price and Units Sold, <strong>Orleans</strong> Parish: 2004 – 2010 .......................... 84<br />
Graph 9: Single Family Average Price and Units Sold, St. Tammany Parish: 2004 – 2010 ................. 84<br />
Graph 10: Employment 2001 – 2010, Quarter 1: <strong>Orleans</strong>, Jefferson and St. Tammany Parishes ...... 85<br />
<strong>Orleans</strong> Parish Sales Activity by Condition: 2000 – 2010 ........................................................................ 85<br />
Table 42: Price Per Square Foot by Condition, City of <strong>New</strong> <strong>Orleans</strong> .................................................. 87<br />
Graph 11: Price Per Square Foot by Condition, City of <strong>New</strong> <strong>Orleans</strong> ................................................. 87<br />
Table 43: Average Days on <strong>Market</strong> by Condition, City of <strong>New</strong> <strong>Orleans</strong>.............................................. 87<br />
Graph 12: Average Days on <strong>Market</strong> by Condition, City of <strong>New</strong> <strong>Orleans</strong> ............................................ 88<br />
Table 44: Average Sale Price by Condition, City of <strong>New</strong> <strong>Orleans</strong> ....................................................... 88<br />
Graph 13: Average Sale Price by Condition, City of <strong>New</strong> <strong>Orleans</strong> ...................................................... 89<br />
Relevance to Rental <strong>Market</strong> .................................................................................................................... 89<br />
Table 45: Month’s Supply of Single Family Inventory ......................................................................... 90<br />
First Time Homebuyers ........................................................................................................................... 90<br />
Table 46: Mortgage Denials by Parish, 2009 ...................................................................................... 91<br />
Graph 14: Households by Age and Tenure, <strong>New</strong> <strong>Orleans</strong> MSA .......................................................... 92<br />
Graph 15: Age Distribution of Renters, <strong>New</strong> <strong>Orleans</strong> MSA................................................................. 92<br />
Rebuilding and the Road Home Program ............................................................................................... 93<br />
Table 47: Road Home Homeowner Program – Summary of Grant Amount by Parish ....................... 93<br />
Table 48: Road Home Homeowner Program ‐ Summary by Planning District ................................... 94<br />
Summary of Key <strong>Market</strong> Conditions by Planning District .................................................................... 96<br />
Table 49: Housing Price and Rent by Planning District ....................................................................... 97<br />
Table 50: Activity Levels by Planning District ...................................................................................... 98<br />
Table 51: Quality of Life Indicators by Planning District ..................................................................... 99<br />
Table 52: Funds Invested by Planning District .................................................................................. 100<br />
Map 4: Residential Vacancy in <strong>New</strong> <strong>Orleans</strong> by Planning District .................................................... 102<br />
Projected Renter Demand and Unit Absorption: 2010 to 2015 ......................................................... 103<br />
Table 53: Projected Household Growth, 2010‐2015 ........................................................................ 106<br />
Table 54: Estimated Supply, Demand and Absorption for Renter Units, Moderate Growth Scenario,<br />
2010‐2015 ......................................................................................................................................... 107<br />
Table 55: Income Distribution of Future Renters, Moderate Growth Scenario ............................... 107<br />
Table 56: Family Type of Future Renters, Moderate Growth Scenario ............................................ 108<br />
<strong>New</strong> <strong>Orleans</strong> <strong>Market</strong> <strong>Assessment</strong> – An Analysis of Supply and Demand Dynamics 4
Table 57: Estimated Supply, Demand and Absorption for Renter Units, High Growth Scenario, 2010‐<br />
2015 .................................................................................................................................................. 110<br />
Table 58: Estimated Income Distribution of Future Renters, High Growth Scenario ....................... 110<br />
Table 59: Estimated Family Type of Future Renters, High Growth Scenario .................................... 111<br />
Graph 16: Change in Households, 1990 ‐ 2009 ................................................................................. 112<br />
Conclusion ....................................................................................................................................... 113<br />
Acknowledgments ........................................................................................................................... 115<br />
APPENDIX ........................................................................................................................................ 116<br />
Table A‐1: <strong>New</strong> <strong>Orleans</strong> Metropolitan Area – Apartment Occupancy History, 1974‐1979 .............. 117<br />
Table A‐2: <strong>New</strong> <strong>Orleans</strong> Metropolitan Area – Apartment Occupancy History, 1980 – 1989 ........... 117<br />
Table A‐3: <strong>New</strong> <strong>Orleans</strong> Metropolitan Area – Apartment Occupancy History, 1990 ‐1999 ............. 118<br />
Table A‐4: <strong>New</strong> <strong>Orleans</strong> Metropolitan Area – Apartment Occupancy History, 2000 – 2008 ........... 119<br />
Table A‐5: <strong>New</strong> <strong>Orleans</strong> Metropolitan Area – Apartment Rent History, 1974 – 1979 ..................... 120<br />
Table A‐6: <strong>New</strong> <strong>Orleans</strong> Metropolitan Area – Apartment Rent History, 1980 ‐ 1989 ...................... 120<br />
Table A‐7: <strong>New</strong> <strong>Orleans</strong> Metropolitan Area – Apartment Rent History, 1990 ‐ 1999 ...................... 121<br />
Table A‐8: <strong>New</strong> <strong>Orleans</strong> Metropolitan Area – Apartment Rent History, 2000 – 2008 ..................... 121<br />
Table A‐9: Permit and Employment Trends, <strong>New</strong> <strong>Orleans</strong> Metropolitan Area: 1970 – 2009 .......... 122<br />
Table A‐10: <strong>New</strong> <strong>Orleans</strong> Apartment Survey Summary, <strong>Market</strong> Rate Occupancy, Units Available and<br />
Units Offline: 2008 – 2009 ................................................................................................................ 123<br />
Table A‐11: <strong>New</strong> <strong>Orleans</strong> Apartment Survey, <strong>Market</strong> Rate Rent Summary: 2008 – 2010 ............... 124<br />
Table A‐11: Continued: <strong>New</strong> <strong>Orleans</strong> Apartment Survey, <strong>Market</strong> Rate Rent Summary: 2008 – 2010<br />
.......................................................................................................................................................... 125<br />
Table A‐11: Continued: <strong>New</strong> <strong>Orleans</strong> Apartment Survey, <strong>Market</strong> Rate Rent Summary: 2008 – 2010<br />
.......................................................................................................................................................... 126<br />
Table A‐12: <strong>Orleans</strong> Sales Activity by Condition, 2000 ..................................................................... 127<br />
Table A‐12 Continued: <strong>Orleans</strong> Sales Activity by Condition, 2000 ................................................... 128<br />
Table A‐13: <strong>Orleans</strong> Sales Activity by Condition, 2004 ..................................................................... 129<br />
Table A‐13 Continued: <strong>Orleans</strong> Sales Activity by Condition, 2004 ................................................... 130<br />
Table A‐14: <strong>Orleans</strong> Sales Activity by Condition, 2006 ..................................................................... 131<br />
Table A‐14: Continued: <strong>Orleans</strong> Sales Activity by Condition, 2006 .................................................. 132<br />
Table A‐15: <strong>Orleans</strong> Sales Activity by Condition, 2007 ..................................................................... 133<br />
Table A‐15: Continued: <strong>Orleans</strong> Sales Activity by Condition, 2007 .................................................. 134<br />
Table A‐16: <strong>Orleans</strong> Sales Activity by Condition, 2008 ..................................................................... 135<br />
<strong>New</strong> <strong>Orleans</strong> <strong>Market</strong> <strong>Assessment</strong> – An Analysis of Supply and Demand Dynamics 5
Table A‐16: Continued: <strong>Orleans</strong> Sales Activity by Condition, 2008 .................................................. 136<br />
Table A‐17: <strong>Orleans</strong> Sales Activity by Condition, 2009 ..................................................................... 137<br />
Table A‐17: Continued: <strong>Orleans</strong> Sales Activity by Condition, 2009 .................................................. 138<br />
Table A‐18: <strong>Orleans</strong> Sales Activity by Condition, 2010 ..................................................................... 139<br />
Table A‐18: Continued: <strong>Orleans</strong> Sales Activity by Condition, 2010 .................................................. 140<br />
Table A‐19:‐ Road Home Small Rental Summary by Affordability and Bedroom Size ...................... 141<br />
Map of LHFA Housing Projects .......................................................................................................... 145<br />
City of <strong>New</strong> <strong>Orleans</strong> ‐ Planning District Summary Data ..................................................................... 147<br />
Summary of Planning District 1 ............................................................................................................. 147<br />
Summary of Planning District 2 ............................................................................................................. 153<br />
Summary of Planning District 3 ............................................................................................................. 159<br />
Summary of Planning District 4 ............................................................................................................. 164<br />
Summary of Planning District 5 ............................................................................................................. 171<br />
Summary of Planning District 6 ............................................................................................................. 176<br />
Summary of Planning District 7 ............................................................................................................. 182<br />
Summary of Planning District 8 ............................................................................................................. 187<br />
Summary of Planning District 9 ............................................................................................................. 192<br />
Summary of Planning District 10 ........................................................................................................... 198<br />
Summary of Planning District 12 ........................................................................................................... 205<br />
Summary of Planning District 13 ........................................................................................................... 210<br />
St. Bernard Parish ‐ Summary Data .................................................................................................. 213<br />
Summary of Arabi, LA ........................................................................................................................... 213<br />
Summary of Chalmette, LA ................................................................................................................... 216<br />
Summary of Meraux, LA ........................................................................................................................ 219<br />
Summary of Poydras, LA ....................................................................................................................... 222<br />
Summary of Violet, LA ........................................................................................................................... 225<br />
<strong>New</strong> <strong>Orleans</strong> <strong>Market</strong> <strong>Assessment</strong> – An Analysis of Supply and Demand Dynamics 6
Executive Summary: Overview of Current <strong>Market</strong> Conditions<br />
There is currently a minor oversupply of rental housing in the <strong>New</strong> <strong>Orleans</strong> area stemming from the<br />
unsubsidized rental market, but unlike past construction surges, the recent building boom that the area<br />
experienced has been comparatively short‐lived and should not create a significant enough surplus to<br />
create serious or prolonged imbalances in the market. The most recent construction push is winding<br />
down, with the majority of projects already built and in lease‐up or under construction. So far, the<br />
market has added enough renters to maintain an occupancy rate above 85%, and recent surveys<br />
conducted for this project and third party sources show that occupancy rates have increased over the<br />
past year, now falling between 88% and 90%. A 93% to 94% average occupancy level typically reflects a<br />
more balanced market and is a condition that is achievable within the <strong>New</strong> <strong>Orleans</strong> rental market over<br />
the next few years under normal growth assumptions for the local and regional economy. Rising<br />
occupancy rates and absorption of vacant inventory will also be helped by the relatively low volumes of<br />
new units expected to enter the supply pipeline. In short, the market is signaling caution as we move<br />
forward over the next two to three years. This does not mean that the addition of new inventory is not<br />
warranted but that its entry should be targeted to fill very specific niches—niches potentially defined by<br />
geographical location or price point. The fact that some rental units are performing better than others<br />
suggests that these factors should be examined as part of the due diligence process and that rental<br />
demand within the region is not uniform.<br />
The recent construction of subsidized apartments is not the primary cause of this oversupply. The small<br />
rental market and the for‐sale market are also competing with the older apartment properties that<br />
suffer from varying levels of physical deterioration and functional obsolescence and which may not be<br />
able to offer the same mix and quality of amenities and interior finishes as those in the newly built<br />
inventory. This too is no different than the experience of prior construction surge cycles in the local<br />
apartment market. Over time, existing properties adapt to the competitive environment through<br />
renovations and other capital improvements which make their rental communities more attractive.<br />
Through a geospatial analysis of parcel‐level activity, combined with data from the Assessor’s office,<br />
field and phone surveys, and information provided by the various governmental housing agencies, we<br />
were able to identify a large portion of the rental market. What we found is a very active rental market<br />
outside of the large multi‐family complexes. The recovery of smaller units – the traditional doubles,<br />
triplexes and fourplexes so prevalent in <strong>New</strong> <strong>Orleans</strong> pre‐storm – has exceeded expectations, somewhat<br />
fueled by the Section 8 voucher program, whose generous rents have made renovation without subsidy<br />
feasible. Much of this rebuilding has taken place outside of the subsidized programs, and is therefore<br />
not directly tracked by any city, parish or state agency. This level of analysis also includes single family<br />
homes, many of which were occupied by owners pre‐storm but are now being rented. This surge in forsale<br />
homes moving into rental inventory is a reflection of current economic conditions coupled with<br />
post‐Katrina realities. There is an oversupply of for‐sale housing as well, leading many owners to rent<br />
rather than wait for extended periods to sell, significantly reduce their asking price or offer costly<br />
concessions to prospective buyers.<br />
<strong>New</strong> <strong>Orleans</strong> <strong>Market</strong> <strong>Assessment</strong> – An Analysis of Supply and Demand Dynamics 7
In this overall relatively weak market, some areas are performing far better than others. This too is no<br />
different than the experience of previous cycles. Rents and occupancy rates are highest in the<br />
CBD/French Quarter, and are stable in Mid‐City, Metairie and the west bank of Jefferson Parish. The<br />
rental market is weaker in Kenner and <strong>New</strong> <strong>Orleans</strong> East, with average occupancy rates less than 85%,<br />
and is particularly weak in Algiers, with occupancy rates less than 80%. This discrepancy is due primarily<br />
to location and the condition of the housing stock. There has been a greater level of activity and<br />
investment within the core of <strong>New</strong> <strong>Orleans</strong> driven significantly by the massive public investment focused<br />
on post‐storm rebuilding and redevelopment. This has fueled demand for the area as a primary nucleus<br />
of economic activity and commerce for the region. At the same time, crime activity and the perception<br />
of crime has increased in <strong>New</strong> <strong>Orleans</strong> East, Kenner and Algiers, thus reducing their attraction and<br />
demand for housing, both rental and for sale.<br />
As previously noted, occupancy rates in the future will largely be determined by household and job<br />
growth. Current estimates provided by Nielsen Claritas forecast that 10,000 new renter households will<br />
be added to the region over the next five years, a 1.6% annual growth rate. Under this growth scenario,<br />
there will still be an excess of rental housing but at much healthier occupancy rates above 90%. These<br />
estimates are modest, not taking into account two future economic drivers for the region – the biomedical<br />
district expansion in downtown <strong>New</strong> <strong>Orleans</strong> and the redevelopment of the Marine Corps<br />
Reserve headquarters (Federal City) in Algiers. These two initiatives are investing more than $3 billion in<br />
construction, and according to economic impact analyses commissioned by the BioDistrict and Federal<br />
City, should create 12,000 direct jobs and 30,000 jobs overall when both projects have reached<br />
maturity. With this in mind, the study also provides a high growth scenario which assumes an overall<br />
annual renter household growth rate of 3.0%. This rate is lower than the growth rate of <strong>New</strong> <strong>Orleans</strong><br />
from 2009 to 2010 (4.2%) but exceeds the regional growth rate over this same period (1.8%). There are,<br />
however, economic “clouds” on the horizon which could offset some of the growth induced by these<br />
major economic development projects. Most notably are the impending closure of Avondale Shipyards<br />
and the associated loss of about 5,000 jobs and the on‐going reinvention of the Michoud Assembly<br />
Facility as NASA phases out its shuttle program. Both sites are being aggressively marketed nationally<br />
and globally by state, regional and local economic development organizations with some notable<br />
success. Also, there are no shortages of unrest in strategic corners of the world which could have trickle<br />
down effects on the <strong>New</strong> <strong>Orleans</strong> economy, particularly its trade, tourism and energy sectors.<br />
The study does not attempt to estimate renter demand under a low or no growth scenario. This<br />
condition would only occur under strained economic conditions, with increasing unemployment and job<br />
losses. Under this scenario, the demand for rental units would likely go up, as households lose their<br />
homes or cannot afford to enter homeownership. The extent of this dynamic, in which total number of<br />
renters increases in a period of population loss, has not been thoroughly studied to sufficiently develop<br />
a demand scenario for the <strong>New</strong> <strong>Orleans</strong> region.<br />
<strong>New</strong> <strong>Orleans</strong> <strong>Market</strong> <strong>Assessment</strong> – An Analysis of Supply and Demand Dynamics 8
Key Conclusions:<br />
<br />
<br />
<br />
<br />
<br />
There is a small oversupply of rental housing in the <strong>New</strong> <strong>Orleans</strong> market, but the severity of the<br />
surplus is small in comparison to other periods that followed building booms in the region.<br />
Rental occupancy rates have recovered and are now nearing healthy levels.<br />
Based on days on the market and the overall volume of sales activity, there appears to be an<br />
oversupply of for‐sale housing in the region.<br />
There is a geographical dynamic to the health of the rental market as some sub‐areas of the region<br />
are experiencing strong rents and occupancy rates while others are struggling.<br />
The regional economy and accompanying demographic trends will influence the health of the<br />
rental market through 2015. A moderate growth scenario would result in a small surplus in rental<br />
units, yet occupancy rates would remain healthy nonetheless. A more optimistic, high growth<br />
scenario would yield a moderate regional shortfall in rental units based on the anticipated pipeline<br />
of new rental units in the coming years.<br />
Cumulatively, the diverse housing market topics that this report covers provide an overall portrait of the<br />
present health of the regional rental market. They also inform the two aforementioned growth<br />
scenarios through the year 2015. The fact that this report covers such a tremendous breadth of topics<br />
influences the organization of the document. The report is not structured as a single thesis or narrative.<br />
Rather, each of the disparate (yet related) housing topics is dealt with individually, and key conclusions<br />
have been provided within each section to help the reader arrive at the most salient information. The<br />
structure of the report culminates in the discussion of the moderate and high growth scenarios and their<br />
implications for financing and developing additional rental supply in the coming years. With these<br />
scenarios in hand—along with the accompanying data on rents, occupancy trends, the for sale market,<br />
and a variety of other critical topics—policy makers, financial stakeholders, and developers now have an<br />
extensive body of research and analysis to inform forthcoming decisions regarding rental housing in the<br />
<strong>New</strong> <strong>Orleans</strong> region.<br />
The report is organized as follows:<br />
<br />
<br />
<br />
Forward: Overview and Methodology – summary of the purpose of the report, the<br />
limitations of housing market studies, and a discussion of the methodologies deployed to<br />
arrive at the report’s key conclusions<br />
Rental <strong>Market</strong> History – overview of the rental market in the <strong>New</strong> <strong>Orleans</strong> region, with a<br />
particular focus on the past 40 years; this analysis places the trends in construction,<br />
occupancy, and rents that the market has witnessed in recent years in a broader historical<br />
context<br />
Recent Construction Trends – examination of the geographical dynamics of recent<br />
construction trends across the region and of the volume of construction activity for both<br />
single family and multifamily units<br />
<strong>New</strong> <strong>Orleans</strong> <strong>Market</strong> <strong>Assessment</strong> – An Analysis of Supply and Demand Dynamics 9
Rental Occupancy Trends – analysis of recent rental occupancy levels along a number of<br />
variables, such as geographical location, market rate vs. mixed income status, and age and<br />
size of properties<br />
Rent Trends – analysis of recent rent trends in the region along a number of variables,<br />
such as geographical location and market rate vs. mixed income vs. subsidized status<br />
Subsidized Rental Housing – discussion of what constitutes “affordable” housing and the<br />
profile of subsidized housing in the region, including tax credit properties, public housing,<br />
and section 8<br />
Profile of the Rental Housing Stock and Storm Damage – analysis of the physical profile of<br />
rental housing in the region and the damage inflicted by Katrina<br />
Small Rental Stock – profile of small scale apartment structures (i.e. 1‐ 4 units) within the<br />
region<br />
For Sale Trends – discussion of major trends in the regional for sale market and<br />
implications for the rental market<br />
<strong>New</strong> <strong>Orleans</strong>: Planning District Analysis – profile of real estate activity, hurricane<br />
recovery, public investments, and quality of life for each of the 13 planning districts in<br />
<strong>New</strong> <strong>Orleans</strong><br />
Projected Demand Scenarios – rental demand scenarios through 2015<br />
<br />
Conclusion<br />
Finally, at the conclusion of the document is an appendix with a complete inventory of the tabular data<br />
that have informed the findings and conclusions within this report.<br />
<strong>New</strong> <strong>Orleans</strong> <strong>Market</strong> <strong>Assessment</strong> – An Analysis of Supply and Demand Dynamics 10
Forward: Overview and Methodology<br />
Purpose<br />
This study was commissioned by OCD/DRU primarily to answer the following question: Is there an<br />
oversupply of rental housing in <strong>New</strong> <strong>Orleans</strong>, and if so, how long will it last This question was<br />
addressed by surveying subsidized and non‐subsidized apartment complexes to estimate the overall<br />
rental vacancy rate. This information was combined with two household growth scenarios to determine<br />
the absorption of vacant, livable units over time.<br />
Underlying this primary question are several related issues that emerged beginning in 2008, coinciding<br />
with the large number of new units placed in service post‐Katrina. First, there was growing concern<br />
among landlords and public officials that the hurricane recovery programs were adding unneeded rental<br />
units at the expense of the existing stock. There was widespread belief that with a surplus of rental<br />
units, the market was moving towards the new, multi‐family construction, putting owners of older,<br />
undamaged buildings at a disadvantage. This report aims to address this concern by examining where<br />
the rental market exists outside of the larger complexes, and to what extent it exists within smaller<br />
structures or single family homes. On the same note, many also assumed that units developed using tax<br />
credits were pulling from the same market of potential renters as non‐subsidized apartments. To<br />
address this concern, the report looks at income in comparison to rent distribution pre‐ and post‐<br />
Katrina. Finally, amidst growing consensus that there is a shift in locational preferences post‐Katrina, the<br />
study examines a series of indicators for each planning district in <strong>New</strong> <strong>Orleans</strong>, including property<br />
values, jobs, and overall activity levels, to assess which areas are in higher demand.<br />
Affordable Housing Needs versus Housing Demand<br />
There are two legitimate approaches to market studies that happen to conflict with one another in this<br />
market. The first market study – for affordable housing – largely focuses on the housing needs of current<br />
residents combined with future population growth. Existing households that are cost‐burdened, defined<br />
as paying more than 30% of their income on housing expenses, are considered in need of affordable<br />
housing and are a key factor in the overall demand estimates. This information is reported by both the<br />
U.S. Census and HUD and used in most market studies for subsidized housing developments. It is also<br />
the basis for which HUD issues Community Development Block Grant funds as part of a jurisdiction or<br />
state’s Consolidated Plan. What is generally not factored into this approach is the excess supply once<br />
cost‐burdened households move out of their more expensive unit and into the newly built, more<br />
affordable home.<br />
The other form of market study is more market‐driven and does not specifically focus on a sub‐section<br />
of the existing population. It strictly focuses on the housing needs of new households over time minus<br />
any units that become obsolete through adaptive reuse or demolition. <strong>Market</strong> studies that use this<br />
approach are more concerned with population growth rather than the needs of current households, and<br />
use a low or stable vacancy rate as justification for new construction. This approach is generally used for<br />
<strong>New</strong> <strong>Orleans</strong> <strong>Market</strong> <strong>Assessment</strong> – An Analysis of Supply and Demand Dynamics 11
market rate construction or by municipalities/regions to determine their housing and land needs over<br />
time.<br />
Traditionally, the housing need‐focused market study makes sense. The primary goal of subsidized<br />
housing is to provide more affordable options to the existing population. And with limited resources<br />
allocated to affordable housing development, the extent of new construction is generally not significant<br />
enough to impact the overall market and therefore is not a primary concern relative to the existing<br />
housing stock. For example, <strong>Louisiana</strong> only receives roughly $8 million in Low Income Housing Tax<br />
Credits (LIHTC’s) every year, equivalent to fewer than 500 units. Dispersed throughout the state, these<br />
units pose minimal competition to the existing housing stock. Additionally, this method makes it feasible<br />
for communities with stagnant population growth and significant housing problems to access subsidized<br />
housing funds. Many rural communities struggle with a dilapidated housing stock and are in need of<br />
subsidized housing, with local wages unable to support market rate development. An affordable<br />
housing‐driven market study would document affordable housing need in these areas, whereas a more<br />
traditional market study would not show overall demand.<br />
In the post‐Katrina rebuilding landscape, almost all of the rebuilding funds for rental housing fall into the<br />
subsidized housing category. <strong>Market</strong> studies for these developments have followed affordable housing<br />
market analysis guidelines, showing a persistent need for affordable housing options in reaction to the<br />
post‐Katrina rent increases. At the same time, the construction of new rental units has exceeded renter<br />
household growth, increasing overall vacancy rates. The vacancy rate post‐storm fell to less than 2%;<br />
reports since 2008 have shown the vacancy rate consistently higher than 8%. 1<br />
These two approaches to market analysis have collided in <strong>New</strong> <strong>Orleans</strong>, leading to the dilemma of<br />
showing a documented need for more affordable housing while simultaneously showing an oversupply<br />
of housing overall. Both situations are true. Two recently released reports, Housing Production Needs:<br />
Three Scenarios for <strong>New</strong> <strong>Orleans</strong> 2 , and the 2010 <strong>Louisiana</strong> Housing Needs <strong>Assessment</strong> 3 , both illustrate<br />
this dichotomy. The first report, using vacancy data provided by the 2008 American Community Survey<br />
and employment projections from the <strong>Louisiana</strong> Workforce Commission for 2006 through 2016,<br />
estimates a surplus in housing overall but a substantial shortage of subsidized housing in the coming<br />
years. The second report emphasizes recently released HUD data on affordable housing needs, showing<br />
an increase in cost‐burdened households over the last decade despite a surplus of rental housing.<br />
This report does not factor in affordable housing needs as part of the demand side of the analysis. In<br />
keeping with the scope of work, housing demand as defined in this study primarily relies on the addition<br />
of new households minus new housing supply, factoring in loss of units over time and targeted vacancy<br />
1 Vacancy rates reported by Larry Schedler & Associates, Inc., University of <strong>New</strong> <strong>Orleans</strong> Institute for Economic<br />
Development and Real Estate Research, U.S. Census and REIS, Inc.<br />
2 Allison Plyer, Elaine Ortiz, Margery Austin Turner and Kathryn L.S. Pettit, Housing Production Needs: Three<br />
Scenarios for <strong>New</strong> <strong>Orleans</strong>, Annual Report, 2009, available<br />
https://gnocdc.s3.amazonaws.com/reports/GNOCDCHousingProductionNeeds2009.pdf.<br />
3 <strong>Louisiana</strong> Housing Finance Agency, <strong>Louisiana</strong> Housing Needs <strong>Assessment</strong>‐2010 produced by GCR & Associates,<br />
Inc., available http://www.lhfa.state.la.us/aboutus/Needs<strong>Assessment</strong>.php.<br />
<strong>New</strong> <strong>Orleans</strong> <strong>Market</strong> <strong>Assessment</strong> – An Analysis of Supply and Demand Dynamics 12
ates. While there is a well‐documented need for more affordable housing within the area, this need is<br />
not equated with an immediate demand for additional units within this document.<br />
Sources<br />
The study uses a variety of primary and secondary data to address current and future supply, demand,<br />
prices and locational characteristics of the housing market.<br />
Existing Supply – The study uses individual project data as reported by the LHFA, OCD and HANO to<br />
determine the status, affordability and unit size of subsidized housing. This includes GO Zone and Per<br />
Capita tax credit projects, HOME projects, Piggyback projects, the Road Home Homeowner and Small<br />
Rental Programs, public housing, tenant and project‐based Section 8 vouchers, and any additional<br />
housing programs under the LHFA as reported by the LHFA Pipeline Report effective September 2010.<br />
GCR georeferenced all addresses using GIS technology to determine planning districts and place, and all<br />
reported data for parishes, planning districts and the metro area are based on aggregated summaries of<br />
the provided microdata. Additionally, GCR reviewed the unit and affordability summaries within all<br />
LIHTC applications to determine the affordability and unit size of tax credit projects.<br />
The supply and rents for market rate multi‐family housing were produced by the UNO Institute for<br />
Economic Development and Real Estate Research through a survey conducted in November and<br />
December of 2010. The Institute has been performing annual market assessments for the <strong>New</strong> <strong>Orleans</strong><br />
metropolitan area since 1973 and currently manages the largest survey inventory of multi‐family<br />
properties in the region. For this study, the Institute augmented their current survey data to include<br />
mixed income and tax credit projects funded through the LHFA and OCD.<br />
For the small rental market, the study utilizes field and online surveys of small rental properties, parcellevel<br />
assessment records, Road Home Small Rental data, Section 8 voucher locations, parcel‐level<br />
activity, and recently released data from the American Housing Survey. The assessment records<br />
provided address‐level information on properties that were residential and did not have homestead<br />
exemptions, which are only applicable to owner‐occupied homes. If a property fit this category, it could<br />
either be a rental unit or currently vacant. (We assume there are no errors in reporting, and that all<br />
owner‐occupied homes are receiving a homestead exemption). To exclude pre‐storm owner‐occupied<br />
homes under renovation, the study only examines properties that were active both pre‐storm and in<br />
2010 and that did not have a homestead exemption pre‐storm or in 2010. This information was<br />
combined with voucher locations, the UNO apartment inventory, field surveys, properties listed within<br />
the Small Rental Program, and all subsidized housing as reported by the LHFA and OCD, to develop a<br />
parcel‐level framework of the <strong>New</strong> <strong>Orleans</strong> rental market and aggregations at the planning district level.<br />
It is also important to note that the sample of properties included in the surveys is not based on random<br />
selection but upon the ability to secure cooperation to obtain accurate descriptive information. As such,<br />
no attestation of statistical significance is made or inferred in this report.<br />
Existing Demand – Existing rental demand is defined as the total number of rental units multiplied by<br />
the occupancy rate. The occupancy rate is based on survey results for multi‐family housing conducted in<br />
<strong>New</strong> <strong>Orleans</strong> <strong>Market</strong> <strong>Assessment</strong> – An Analysis of Supply and Demand Dynamics 13
September through December of 2010. Where available, occupancy rates were verified by accounting<br />
for active and non‐active addresses within a project’s footprint. This was accomplished using GIS<br />
technology, in which parcel boundaries were drawn over existing multi‐family developments. Active<br />
addresses as reported by GCR’s Activity Index were compared to the total number of units within the<br />
property and, with older properties, the historic occupancy rates as reported by UNO. Based on these<br />
surveys, the study uses a vacancy rate between 7% and 12%. The study does not use the U.S. Census<br />
reported occupancy rate of 15.2%, due to the age of the data (twelve‐month average versus 4 th quarter<br />
2010), the geography (metro‐wide versus sub‐area) and the fact that it captures properties currently in a<br />
lease‐up stage (i.e. properties recently added to the market that have not had the time to rent their<br />
units), which is excluded from the UNO survey. 4 The occupancy rate for multi‐family housing was<br />
applied to all housing units.<br />
Future Supply – It is impossible to predict what the future housing market will look like with perfect<br />
accuracy. This is particularly true in <strong>New</strong> <strong>Orleans</strong>, where the rebuilding activities of small landlords and<br />
homeowners are not captured by building permit statistics or housing market reports. To estimate<br />
future supply, this study looks at projects or properties currently in the pipeline as reported by the LHFA,<br />
OCD, HANO and regional market analysts. It assumes that all LHFA projects will be constructed, despite<br />
the possibility that many will not meet their placed‐in‐service deadline, and that the Small Rental<br />
Program will continue its current pace of construction activity.<br />
Future Demand – This report relies on a widely used 3 rd party national demographics firm, Nielsen<br />
Claritas Inc., for the baseline household growth estimates. This data source is used by the State of<br />
Vermont, Boston, The Reinvestment Fund, <strong>New</strong> <strong>Orleans</strong> and Los Angeles, amongst others, to determine<br />
future housing needs. The study also provides alternative growth scenarios based on job projections and<br />
economic development opportunities.<br />
Planning Districts/Places – The report incorporates extensive sub‐parish information to gauge the<br />
extent of recovery and viability within specific areas. This includes property values and change in home<br />
prices as reported by the <strong>New</strong> <strong>Orleans</strong> Metropolitan Area Association of Realtors; residential and<br />
commercial vacancies as reported by GCR’s “Activity Index”; total jobs, retail establishments and grocery<br />
stores as reported by Dun and Bradstreet; and recovery investments/economic development initiatives<br />
as reported by FEMA, OCD and local sources.<br />
Limitations of the Data – Many of the findings within this report are based on phone surveys and are<br />
limited to the accuracy and honesty of those individuals providing the information. This includes the<br />
rents (which may or may not include concessions) and the occupancy rates. Additionally, because we are<br />
still in a period of post‐Katrina recovery, with the Road Home, Go Zone and FEMA/CDBG infrastructure<br />
projects still underway, there are quality of life issues that have yet to be addressed which will have a<br />
significant impact on future household projections. Finally, there are a range of possibilities regarding<br />
future housing supply that also rely on the abovementioned amenities plus the financial realities of<br />
today’s market.<br />
4 U.S. Census, Housing Vacancies and Homeownership, 2010.Available at:<br />
http://www.census.gov/hhes/www/housing/hvs/annual10/ann10ind.html.<br />
<strong>New</strong> <strong>Orleans</strong> <strong>Market</strong> <strong>Assessment</strong> – An Analysis of Supply and Demand Dynamics 14
Limitations of the Report<br />
As with any research effort, there are limitations which should be acknowledged and addressed for the<br />
readers and users of this report. They are as follows. Real estate markets are constantly changing. They<br />
are affected by a diverse set of forces and circumstances including demographic and economic growth<br />
trends, consumer preferences; the availability and cost of financing and production, and the regulatory<br />
and tax climate. These dynamics are extremely fluid; consequently, real estate markets are highly<br />
unpredictable. This is particularly true in post‐Katrina <strong>New</strong> <strong>Orleans</strong>, an environment that is without<br />
modern American precedent. Fortunately, the five years that have elapsed since Katrina have provided a<br />
clearer picture of the region’s rebuilding process and the emerging “new normal” for the local real<br />
estate market.<br />
While these limitations should be acknowledged, this analysis of the <strong>New</strong> <strong>Orleans</strong> apartment market has<br />
entailed the vigorous and diligent collection of an exhaustive suite of data; it has utilized readily<br />
accepted methodologies and tools to analyze the information; and it has incorporated the experience<br />
and good judgment of its authors to arrive at its findings and conclusions. Finally, it should be noted that<br />
this report focuses on an overall assessment of apartment market conditions in the region and at the<br />
level of individual parishes and planning districts in <strong>New</strong> <strong>Orleans</strong>. This report does not address the<br />
market, economic or financial feasibility of any individual properties, projects or developments either<br />
existing, under construction or proposed. These are issues which individual developers or project<br />
proponents would or should have otherwise addressed in their own due diligence.<br />
Key Points – Study Overview and Methodology:<br />
<br />
<br />
<br />
<br />
<br />
This report was undertaken as a result of concerns about an oversupply in the <strong>New</strong> <strong>Orleans</strong><br />
regional rental market and accompanying declines in occupancy rates and rents.<br />
Real estate markets, in general, and real estate forecasts, in particular, are inherently<br />
unpredictable due to a variety of factors that affect the supply of and demand for real estate.<br />
This unpredictability is particularly acute in post‐Katrina <strong>New</strong> <strong>Orleans</strong>.<br />
The data collection and methodologies deployed for this report are both comprehensive and<br />
robust, and the report relies on a mixture of primary and secondary data.<br />
The purpose of this report is not to analyze the viability of a particular project but to provide an<br />
overall, comprehensive evaluation of the rental market for the region.<br />
<strong>New</strong> <strong>Orleans</strong> <strong>Market</strong> <strong>Assessment</strong> – An Analysis of Supply and Demand Dynamics 15
History of the Rental <strong>Market</strong> in <strong>New</strong> <strong>Orleans</strong> Metropolitan Area<br />
The apartment market in the <strong>New</strong> <strong>Orleans</strong> region over the past forty years has been characterized by a<br />
relatively low, steady pace of construction punctuated by short term incentive driven surges of new<br />
inventory production. At least two of these surges left excessive inventory overhangs in their wake<br />
which were eventually absorbed through the process of normal market growth dynamics. The return to<br />
a balanced market in two earlier historic periods of the housing market, however, was not without its<br />
economic dislocations and the financial pain usually associated with rising vacancies and falling rents<br />
such as foreclosures, bankruptcies and the occasional failure of a bank or savings and loan.<br />
Unfortunately, there is always some economic fallout in the wake of such extraordinary excesses.<br />
Thankfully, the most recent post‐Katrina surge does not appear to be on the way to producing similar<br />
market imbalances and its associated damage.<br />
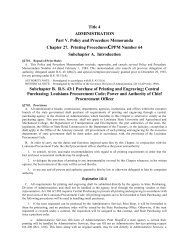
The long term cycles for the <strong>New</strong> <strong>Orleans</strong> region illustrated in Graph 1 and its supporting tables (See<br />
Appendix Tables A‐1 through A‐4) would be somewhat similar to those one might observe in many other<br />
major urban areas for the same time period with the possible exception of the most recent cycle which<br />
followed this area’s unique event – Hurricane Katrina and the devastating flooding which it produced. As<br />
the graphic shows, there are three rather notable periods during which the inventory of apartments in<br />
the <strong>New</strong> <strong>Orleans</strong> region grew significantly. Each of these periods and their aftermath are briefly<br />
discussed in the material which follows. Each cycle has been driven by its own unique circumstances<br />
that generally reflect broader macroeconomic trends at the local and national levels during these<br />
periods.<br />
Graph 1: Apartment Occupancy and Permit History<br />
<strong>New</strong> <strong>Orleans</strong> Metro – 1970 to 2010<br />
12,000<br />
11,000<br />
REITs<br />
& FHA<br />
100.0%<br />
95.0%<br />
10,000<br />
9,000<br />
8,000<br />
7,000<br />
DEREG,<br />
S&Ls, &<br />
1981<br />
TAX ACT<br />
90.0%<br />
85.0%<br />
80.0%<br />
6,000<br />
5,000<br />
4,000<br />
3,000<br />
2,000<br />
1,000<br />
1986 TAX<br />
REFORM<br />
Post‐K<br />
GO<br />
Zone<br />
LIHTCs<br />
75.0%<br />
70.0%<br />
65.0%<br />
60.0%<br />
55.0%<br />
‐<br />
50.0%<br />
1970<br />
1971<br />
1972<br />
1973<br />
1974<br />
1975<br />
1976<br />
1977<br />
1978<br />
1979<br />
1980<br />
1981<br />
1982<br />
1893<br />
1984<br />
1985<br />
1986<br />
1987<br />
1988<br />
1989<br />
1990<br />
1991<br />
1992<br />
1993<br />
1994<br />
1995<br />
1996<br />
1997<br />
1998<br />
1999<br />
2000<br />
2001<br />
2002<br />
2003<br />
2004<br />
2005<br />
2006<br />
2007<br />
2008<br />
2009<br />
2010<br />
Permits<br />
Occupancy<br />
Source: US Census Bureau, Residential Permits; Occupancy Figures from UNO Real Estate Center Surveys<br />
<strong>New</strong> <strong>Orleans</strong> <strong>Market</strong> <strong>Assessment</strong> – An Analysis of Supply and Demand Dynamics 16
Pre‐1970’s: Although some larger (100+ unit) properties were built in the <strong>New</strong> <strong>Orleans</strong> area prior to the<br />
1970’s, the preponderance of the region’s rental stock was concentrated in buildings with under 50<br />
units and particularly in the category of duplex to fourplex properties that made up the core of the<br />
“mom and pop” small investor owned rentals. Tables 1 and 2 summarize the age and size characteristics<br />
of the rental market as of the 1970 U.S. Census of Housing. Renter occupied dwellings with 50 or more<br />
units accounted for 5.4% of the total inventory in the region and 4.8% of the rental stock in <strong>Orleans</strong><br />
Parish. The two to four unit category made up 44.6% of the region’s total renter occupied housing stock<br />
with another 30.7% categorized as single family detached or attached units. In <strong>Orleans</strong> Parish, two to<br />
four unit dwellings accounted for 48.8% of all renter occupied units in 1970 while single family rentals<br />
comprised 26.7% of the total stock. For the most part, this rental market functioned fairly well with few,<br />
if any, extraordinary periods of inventory additions prior to the 1970’s. This in fact contributed to a<br />
relatively aged 1970 rental housing stock in the region, with 45% built in 1939 or earlier. The rental<br />
housing stock was even older in <strong>Orleans</strong> Parish with 54.1% built during this same period. Most<br />
development and construction of apartments was driven by local interests with relatively few outside<br />
(i.e. national or regional) multi‐family developers showing much interest in the <strong>New</strong> <strong>Orleans</strong> region. The<br />
primary reasons typically espoused for this relative lack of interest were an extremely conservative<br />
lending community and comparatively low rent levels that showed only modest upward growth<br />
potential. The former can be attributed to a relatively archaic legal and state regulatory structure that<br />
impeded bank growth and expansion, while the latter is typically attributed to the dominance of “mom<br />
and pop” rental property owners who were reluctant to raise rents for fear of losing good long term<br />
tenants, some of whom may have been immediate family members or relatives. This is the historic<br />
backdrop for the first surge of new apartment construction in the <strong>New</strong> <strong>Orleans</strong> region.<br />
Table 1: Profile of Renter Occupied Housing<br />
<strong>New</strong> <strong>Orleans</strong> Metropolitan Area and <strong>Orleans</strong> Parish, 1970 Census<br />
Size Characteristics<br />
Total<br />
Metro Area<br />
Percent<br />
of Total<br />
Total<br />
Percent<br />
of Total<br />
1 Unit Detached 32,679 21.1% 18,437 15.6%<br />
1 Unit Attached 14,936 9.6% 13,063 11.1%<br />
2 Units 44,205 28.5% 37,180 31.5%<br />
3 and 4 Units 24,887 16.1% 20,378 17.3%<br />
5 to 9 Units 14,229 9.2% 12,227 10.4%<br />
10 to 19 Units 9,511 6.1% 7,185 6.1%<br />
20 to 49 Units 5,393 3.5% 3,562 3.0%<br />
50 or More Units 8,418 5.4% 5,675 4.8%<br />
Mobile Home or Trailer 643 0.4% 155 0.1%<br />
Total Units 154,901 117,862<br />
Source: U.S. Bureau of the Census, 1970 Census of Housing<br />
<strong>Orleans</strong> Parish<br />
<strong>New</strong> <strong>Orleans</strong> <strong>Market</strong> <strong>Assessment</strong> – An Analysis of Supply and Demand Dynamics 17
Table 2: Age of Structure, Renter Occupied Housing<br />
<strong>New</strong> <strong>Orleans</strong> Metropolitan Area and <strong>Orleans</strong> Parish, 1970 Census<br />
Year Built<br />
Metro Area<br />
Percent<br />
Total of Total<br />
<strong>Orleans</strong> Parish<br />
Percent<br />
Total of Total<br />
1965 to March 1970 17,734 11.4% 7,507 6.4%<br />
1960 ‐ 1964 14,938 9.6% 7,724 6.6%<br />
1950 ‐ 1959 24,104 15.6% 16,063 13.6%<br />
1940 ‐ 1949 28,363 18.3% 22,839 19.4%<br />
1939 or Earlier 69,762 45.0% 63,729 54.1%<br />
Total 154,901 117,862<br />
Source: U.S. Bureau of the Census, 1970 Census of Housing<br />
Table 3: Units in Structure and Age of Structure<br />
<strong>New</strong> <strong>Orleans</strong> SMSA and the City of <strong>New</strong> <strong>Orleans</strong>: 1970<br />
<strong>New</strong> <strong>Orleans</strong> SMSA<br />
Total<br />
Percent<br />
of total<br />
1 unit<br />
Percent<br />
of total<br />
2 units<br />
Percent<br />
of total<br />
2 and 4<br />
units<br />
Percent<br />
of total<br />
5 to 9<br />
units<br />
Percent<br />
of total<br />
10 t0 19<br />
units<br />
Mobile<br />
Percent 20 or more Percent Percent<br />
home or<br />
of total units of total of total<br />
trailer<br />
1969 to March 1970 3,104 2.00% 542 0.35% 482 0.31% 677 0.44% 199 0.13% 417 0.27% 739 0.48% 48 0.03%<br />
1965 to 1968 14,630 9.44% 2,652 1.71% 2,790 1.80% 2,228 1.44% 1,228 0.79% 1,596 1.03% 3,949 2.55% 187 0.12%<br />
1960 to 1964 14,938 9.64% 3,933 2.54% 2,883 1.86% 1,480 0.96% 1,027 0.66% 1,175 0.76% 4,284 2.77% 156 0.10%<br />
1950 to 1959 24,104 15.56% 9,048 5.84% 4,923 3.18% 3,811 2.46% 2,575 1.66% 1,187 0.77% 2,396 1.55% 164 0.11%<br />
1940 to 1949 28,363 18.31% 9,474 6.12% 8,525 5.50% 4,946 3.19% 2,985 1.93% 1,523 0.98% 882 0.57% 28 0.02%<br />
1939 or earlier 69,762 45.04% 21,966 14.18% 24,602 15.88% 11,745 7.58% 6,215 4.01% 3,613 2.33% 1,561 1.01% 60 0.04%<br />
Total 154,901 100.0% 47,615 30.7% 44,205 28.5% 24,887 16.1% 14,229 9.2% 9,511 6.1% 13,811 8.9% 643 0.4%<br />
The City of <strong>New</strong> <strong>Orleans</strong><br />
Total<br />
Percent<br />
of total<br />
1 unit<br />
Percent<br />
of total<br />
2 units<br />
Percent<br />
of total<br />
3 and 4<br />
units<br />
Percent<br />
of total<br />
5 to 9<br />
units<br />
Percent<br />
of total<br />
10 to 19<br />
units<br />
Mobile<br />
Percent 20 or more Percent Percent<br />
home or<br />
of total units of total of total<br />
trailer<br />
1969 to March 1970 1,343 1.14% 206 0.17% 321 0.27% 217 0.18% 110 0.09% 186 0.16% 286 0.24% 17 0.01%<br />
1965 to 1968 6,164 5.23% 938 0.80% 1,553 1.32% 505 0.43% 512 0.43% 775 0.66% 1,850 1.57% 31 0.03%<br />
1960 to 1964 7,724 6.55% 1,520 1.29% 1,591 1.35% 685 0.58% 638 0.54% 542 0.46% 2,718 2.31% 30 0.03%<br />
1950 to 1959 16,063 13.63% 4,249 3.61% 3,445 2.92% 3,155 2.68% 2,281 1.94% 848 0.72% 2,062 1.75% 23 0.02%<br />
1940 to 1949 22,839 19.38% 6,215 5.27% 7,232 6.14% 4,511 3.83% 2,707 2.30% 1,353 1.15% 817 0.69% 4 0.00%<br />
1939 or earlier 63,729 54.07% 18,372 15.59% 23,038 19.55% 11,305 9.59% 5,979 5.07% 3,481 2.95% 1,504 1.28% 50 0.04%<br />
Total 117,862 100.0% 31,500 26.7% 37,180 31.5% 20,378 17.3% 12,227 10.4% 7,185 6.1% 9,237 7.8% 155 0.1%<br />
Source: U.S. Census Bureau. 1970 Census of Housing.<br />
<strong>New</strong> <strong>Orleans</strong> <strong>Market</strong> <strong>Assessment</strong> – An Analysis of Supply and Demand Dynamics 18
The 1970’s: The years 1971 and 1972 stand alone as those producing the highest ever levels of multifamily<br />
housing production in the <strong>New</strong> <strong>Orleans</strong> region. In 1971, a record 10,604 multi‐family units were<br />
permitted for new construction followed by another 9,579 units in 1972. The entirety of this cycle<br />
started in 1969 and lasted through the early part of 1974. In 1975, the bottom fell out of the permitted<br />
new construction when the number of units fell to 748.<br />
There were several forces at work during the 1970 to 1974 period that drove these years of<br />
unprecedented new construction in the region when a total of 32,442 units were permitted and added<br />
to the inventory of available multi‐family housing. The two most formidable on the supply side were<br />
directly related to the availability of financial capital: the emergence of REIT’s and FHA insured loan<br />
programs. On the demand side was an economy that was steadily growing and a Baby Boom generation<br />
that was making its initial entry into the housing market as customers. In the first half of the decade,<br />
total employment grew at an average annual rate of 2.13% followed by a 2.77% annual rate for the<br />
energy sector driven economic expansion of the 1975 to 1979 period.<br />
Real Estate Investment Trusts (REIT’s) were a creation of the Tax Code designed to attract and<br />
accumulate capital from low‐threshold investors who had an interest in real estate investment. Abetted<br />
by the general real estate investment “buzz” of the early 1970’s, REIT’s became the repositories of<br />
significant financial resources. This created an environment of too much capital chasing too few viable<br />
real estate opportunities could unfold. This imbalance was compounded by a menu of federal insured<br />
loan programs as part of President Johnson’s Great Society initiative and by lax risk underwriting and<br />
due diligence.<br />
The confluence of these supply‐side elements is what drove the construction of 32,442 units in the <strong>New</strong><br />
<strong>Orleans</strong> region between 1970 and 1974. Although increased household formation rates by Baby<br />
Boomers and relatively stable job growth in the region helped absorb some of this new construction, its<br />
volume outstripped demand and drove occupancy rates and average asking rents down.<br />
This flurry of new construction came to an abrupt stop in late 1974 and into 1975 as a result of three<br />
major events: President Nixon’s moratorium on all FHA insured loan programs; OPEC’s first oil embargo<br />
in October 1973 and the accompanying deep recession; and skyrocketing project defaults and<br />
foreclosures.<br />
In the <strong>New</strong> <strong>Orleans</strong> area, the majority of the 1970’s surge in new apartment construction occurred in<br />
geographic areas that offered an abundance of relatively inexpensive land. These include the westbank<br />
of Jefferson Parish (i.e. Gretna, Harvey and Marrero), eastern <strong>Orleans</strong> Parish, Algiers (the westbank of<br />
<strong>Orleans</strong> Parish) and some areas on the eastbank of Jefferson Parish, particularly Kenner. As the trends<br />
documented in Table 5 illustrate, while the market as a whole may have been overbuilt immediately<br />
following this new construction surge, individual areas were in some cases significantly overwhelmed<br />
with new inventory which required extended periods of time to return these localized markets to some<br />
sense of balance. For example, average occupancy rates at year end 1974 fell to 73% in the Lake Forest<br />
area and 71.9% in Algiers in <strong>Orleans</strong> Parish, while in the Harvey Canal East (Gretna) sector of Jefferson<br />
Parish it dropped to 74.4%.<br />
<strong>New</strong> <strong>Orleans</strong> <strong>Market</strong> <strong>Assessment</strong> – An Analysis of Supply and Demand Dynamics 19
As bad as the overall overhang of inventory was in the region, it could have been worse but for the<br />
strong energy sector induced job growth that ensued for most of the balance of the decade. While<br />
hurting the rest of the national economy, the OPEC oil embargo helped south <strong>Louisiana</strong> and its entire<br />
offshore drilling apparatus. Job growth accelerated for most of the balance of the decade as oil prices<br />
continued to rise and the rapid expansion of offshore oil exploration and production in the Gulf of<br />
Mexico unfolded. This job growth drove demand for housing and fueled absorption of all of the excess<br />
inventory as average occupancy rates rose to 98% and above by the end of the decade. This growth,<br />
together with a recovery in rent levels, fueled a resurgence of new construction in the 1977 to 1979<br />
period when another 13,700 units of new multi‐family housing were added to inventory.<br />
The 1980’s: The oil boom‐fueled surge in new construction was extended into the early 1980’s by two<br />
major factors: deregulation of financial intermediaries, particularly thrifts (i.e. savings and loans and<br />
mutual savings banks) and passage of the 1981 Tax Act. In many respects, S&L’s became to the 1980’s<br />
what REIT’s were to the 1970’s, and both were aided and abetted by significant changes to the federal<br />
Tax code. The results were largely the same: overzealous new construction followed by falling<br />
occupancy and rent levels.<br />
Because of the effects of rising inflation and interest rates, Congress undertook a significant overhaul of<br />
the regulations governing depository institutions. This erased barriers to what was allowable between<br />
commercial banks and thrifts, and the newly deregulated thrifts embarked on loan activity for which<br />
they had little understanding or experience.<br />
For a variety of reasons, thrifts engaged in a number of high risk real estate deals, including speculative<br />
apartment construction. Careless lending practices, insufficient due diligence, and a sudden scarcity of<br />
brokered deposits culminated in the failure, closure, or forced merger of several thousand thrifts across<br />
the U.S. and about 20 to 25 in the <strong>New</strong> <strong>Orleans</strong> area alone.<br />
Compounding the reckless lending practices of thrifts were two major provisions of the 1981 Tax Act:<br />
accelerated depreciation and sheltering of active income with passive losses. These incentives helped to<br />
fuel excessive new construction across the spectrum of real estate properties, including multi‐family<br />
apartments.<br />
This cycle peaked in 1983 and produced a total of about 19,546 units between 1981 and 1985. As in the<br />
1970’s, much of this new construction was concentrated in the same geographic sub‐markets (i.e.<br />
eastern <strong>New</strong> <strong>Orleans</strong>, Algiers, Gretna, etc.) and unfortunately had the same effect (falling occupancy<br />
rates and rents). In <strong>Orleans</strong> Parish, for example, occupancy rates at the end of 1986 averaged 79.0% in<br />
Lake Forest, 69.5% in N.O. East and 77.5% in Algiers, while in the Gretna sector it dropped to 79.5%.<br />
Because the 1980’s were characterized by a more difficult economic environment in the <strong>New</strong> <strong>Orleans</strong><br />
region (i.e. the precipitous decline of the oil and gas industry) it took longer for excess inventories to be<br />
absorbed and for the market to return to more balanced condition characterized by gradually rising<br />
rents and more profitable operating margins.<br />
The new construction surge of the 1980’s ended abruptly with the passage of the 1986 Tax Reform Act,<br />
which stripped real estate of the accelerated depreciation and passive loss provisions that had<br />
<strong>New</strong> <strong>Orleans</strong> <strong>Market</strong> <strong>Assessment</strong> – An Analysis of Supply and Demand Dynamics 20
stimulated the construction boom. Although construction came to a near halt, the damage had already<br />
been done, and several thousand new apartments were being added to inventory at a time when the<br />
regional and state economies were entering the worst stages of an energy‐sector induced decline.<br />
Between 1984 and 1987, the metropolitan area lost over 50,000 wage and salary jobs, while at the state<br />
level, the job losses exceeded 160,000. Total employment in the region grew at an average annual rate<br />
of 0.12% from 1980 to 1984 and then contracted at a rate of just under 0.5% annually during the second<br />
half of the decade. At its worst, average apartment occupancy in the region dipped to just above 80%,<br />
and rents turned down sharply. It took the better part of ten years (1986 to 1997) for average<br />
occupancy to reach 95% and to stay at that level with any consistency.<br />
The 1990’s and Beyond: The most recent cycle actually started in the late 1980’s (probably 1987) after<br />
the worst of the energy sector crash subsided and the region entered a more stable, albeit somewhat<br />
slow growth, economic environment. The late 1980’s and early 1990’s could best be characterized as<br />
picking up the pieces of the badly damaged real estate sector. One of the major players in this clean‐up<br />
activity was the government created Resolution Trust Corporation (RTC), which was designed to market<br />
(typically at deep discounts) foreclosed assets of failed institutions. A wide variety of properties in the<br />
<strong>New</strong> <strong>Orleans</strong> area were handled by RTC during this recovery and clean up period, including a number of<br />
multi‐family apartment complexes.<br />
Although the reality check imposed by these costly financial lessons were not necessarily the sole reason<br />
for the relatively low levels of new apartment construction for about twenty years (1986 to 2006) they<br />
no doubt contributed to reluctance on the part of both lenders and investors to add significantly to the<br />
inventory of available supply. From 1986 to 2006 there were only three years when permits for new<br />
multi‐family construction approached or exceeded 1,000 units in the metropolitan area (1996, 2001 and<br />
2002).<br />
It should also be noted that job growth through much of the 1990’s and early 2000’s was somewhat<br />
anemic in the <strong>New</strong> <strong>Orleans</strong> region. The 1990’s were particularly difficult with annual average gains in the<br />
range of 0.5% to 1.0% and equally sluggish population growth. In fact, <strong>Orleans</strong> and Jefferson Parishes<br />
both lost population during the decade which did relatively little to spur aggressive expansion of the<br />
apartment market’s inventory.<br />
Job growth toward the end of the 1990’s picked up somewhat, particularly in the services sector directly<br />
or indirectly related to tourism and the convention/group meetings business. Steady expansion in these<br />
sectors came to an abrupt pause after the 9/11 terrorist attacks and were just beginning to recover<br />
fairly well when the local market was hit with another severe shock, Hurricane Katrina.<br />
The economic dislocations caused initially by the storm and its flooding were significant and rippled<br />
through every sector of the real estate market. In the apartment sector, the most evident impact was<br />
damaged or destroyed buildings which reduced available inventory driving rents much higher than their<br />
pre‐storm levels.<br />
The response from a production standpoint had been fueled by a package of financing tools and<br />
strategies that created the first significant upturn in new multi‐family permits in over 20 years. And,<br />
<strong>New</strong> <strong>Orleans</strong> <strong>Market</strong> <strong>Assessment</strong> – An Analysis of Supply and Demand Dynamics 21
since the permit volumes shown in Graph 1 reflect only new construction, it understates the full<br />
magnitude of the rebuilding effort that has unfolded over the past four plus years. The volume of units<br />
produced through redevelopment, rehabilitation and adaptive reuse of existing buildings (which in not<br />
reflected in the new construction permits) is covered later in this report. The “boomlet” in new<br />
construction post‐Katrina occurred in 2007 and 2008 and thereafter subsided. This new construction has<br />
been enabled by GO Zone incentives such as expanded access to Low Income Housing Tax Credits<br />
(LIHTC’s), bonus depreciation, generous allocations of tax exempt bonds and direct CDBG funding to fill<br />
financing gaps. Rebuilding and restoring apartment inventories has also been aided by initiatives such as<br />
the LRA’s Small Rental Program (also discussed in more detail later) as well as an unprecedented<br />
infusion of grant and philanthropic funding from foundations and a wide range of nonprofits from across<br />
the U.S.<br />
As the recent historical pattern of average occupancy rates illustrates, unlike previous periods, the two<br />
year surge in new construction has not been disruptive to the regional market’s fundamental balance.<br />
Although average occupancy trended downward in 2008, it has since recovered resting at about 89.5%<br />
as of yearend 2010. The rebound in the market’s overall occupancy levels can probably be attributed in<br />
some part to the relatively small volume of new units permitted when compared to periods in the<br />
1970’s and 1980’s. And, although economic and job growth over the past two years has been somewhat<br />
anemic, household formations and the continued return of previously displaced families and individuals<br />
has helped to fuel demand for housing, particularly apartments in <strong>Orleans</strong> Parish.<br />
In a macro sense, it is fairly safe to say that the most recent multi‐family apartment “boomlet” of new<br />
construction has not been significantly damaging or disruptive to the market’s overall balance as has<br />
been the case in prior periods of surges of new inventory additions. This is not to say that some<br />
geographic sectors of the region’s apartment market are weaker than others in terms of occupancy and<br />
rent patterns documented over the past 18 to 24 months. These market trends will be more fully<br />
discussed in this report.<br />
<strong>New</strong> <strong>Orleans</strong> <strong>Market</strong> <strong>Assessment</strong> – An Analysis of Supply and Demand Dynamics 22
Table 4: Average Occupancy <strong>New</strong> <strong>Orleans</strong> Metropolitan Area, 1974 to 2010<br />
Year Occupancy Year Occupancy<br />
1975 87.1% 1994 94.1%<br />
1976 95.1% 1995 92.5%<br />
1977 98.2% 1996 91.5%<br />
1978 98.2% 1997 92.5%<br />
1979 97.7% 1998 97.8%<br />
1980 98.5% 1999 94.0%<br />
1981 97.9% 2000 95.3%<br />
1982 95.2% 2001 95.5%<br />
1983 93.9% 2002 95.3%<br />
1984 86.0% 2003 94.3%<br />
1985 85.6% 2004 94.9%<br />
1986 81.1% 2005 (Pre‐K) 93.7%<br />
1987 79.4% 2005 (Post‐K) 94.8%<br />
1988 82.2% 2006 92.2%<br />
1989 87.2% 2007 89.7%<br />
1990 87.3% 2008 86.7%<br />
1991 93.4% 2009 87.7%<br />
1992 91.5% 2010 89.0%<br />
1993 93.2%<br />
Note: Occupancy data does not include elderly and low income<br />
subsized housing.<br />
Source: Institute for Economic Development and Real Estate<br />
Research.<br />
<strong>New</strong> <strong>Orleans</strong> <strong>Market</strong> <strong>Assessment</strong> – An Analysis of Supply and Demand Dynamics 23
Table 5: Housing Production and Wage and Salary Employment History by Decade<br />
<strong>New</strong> <strong>Orleans</strong> Area Housing <strong>Market</strong>, 1970 2009<br />
Total<br />
Permits Issued<br />
Single<br />
Family<br />
Multi‐<br />
Family<br />
Permits<br />
Annual Average<br />
Total<br />
Single<br />
Family<br />
Multi‐<br />
Family<br />
Muli‐<br />
Family as a<br />
% of Total<br />
Period<br />
Beginning<br />
Period<br />
End<br />
Employment*<br />
Total<br />
Change<br />
Average<br />
Annual<br />
Change<br />
Average<br />
Annual<br />
%<br />
Change<br />
Beginning<br />
of Period<br />
Unemployment Rate<br />
End of<br />
Period<br />
Change Range<br />
1970 ‐<br />
1974 58,504 26,062 32,442 11,701 5,212 6,488 55.45 457,888 506,549 48,661 9,732 2.13 NA NA NA NA<br />
1975<br />
1979 44,914 28,794 16,120 8,983 5,759 3,224 35.89 520,111 592,183 72,072 14,414 2.77 7.46 5.95 (1.51) 5.95‐7.56<br />
1980 ‐<br />
1984 45,309 24,759 20,550 9,062 4,952 4,110 45.4 612,889 616,468 3,579 716 0.12 5.91 8.94 3.04 5.91 ‐ 10.70<br />
1985 ‐<br />
1989 19,600 14,747 4,853 3,920 2,949 971 24.8 602,972 588,278 (14,694) (2,939) (0.49) 10.35 6.76 (3.59) 6.76 ‐ 10.54<br />
1990 ‐<br />
1994 15,817 14,345 1,472 3,163 2,869 294 9.3 598,593 618,093 19,500 3,900 0.65 6.02 8.48 2.46 6.02 ‐ 9.09<br />
1995 ‐<br />
1999 21,603 18,002 3,601 4,321 3,600 720 16.7 630,917 652,580 21,663 4,333 0.69 7.52 4.53 (2.99) 4.53 ‐ 7.52<br />
2000 ‐<br />
2004 24,918 20,744 4,174 4,984 4,149 835 16.8 656,124 651,658 (4,466) (893) (0.14) 4.68 5.06 0.38 4.68 ‐ 5.53<br />
2005 ‐<br />
2009 25,454 18,794 6,660 5,091 3,759 1,332 26.2 594,688 555,100 (39,588) (7,918) (1.33) 8.28 5.06 6.38 3.44 ‐ 8.28<br />
*2009 employment data is estimated<br />
Source: U.S. Department of Commerce, C‐40 Construction Permit Series and the <strong>Louisiana</strong> Workforce Commission, Labor <strong>Market</strong><br />
Information reports.<br />
Key Conclusions – History of the Rental <strong>Market</strong> in the <strong>New</strong> <strong>Orleans</strong> Region:<br />
<br />
<br />
<br />
<br />
<br />
<br />
<br />
Prior to the early 1970’s, the rental market in the <strong>New</strong> <strong>Orleans</strong> region was dominated by small one<br />
to four unit structures and was characterized by stable rents and occupancy levels.<br />
The <strong>New</strong> <strong>Orleans</strong> market experienced three major apartment building booms between 1970 and<br />
2005: in the early 1970’s, late 1970’s, and early to mid‐1980’s.<br />
In each case, major building activity was followed by declining occupancy levels and asking rents.<br />
These surpluses were absorbed relatively quickly in the 1970’s and early 1980’s due to an<br />
expanding economy, but the 1980’s building boom resulted in a sustained oversupply of rental<br />
housing due to the “oil bust.”<br />
Prior to Katrina, the 1990’s and 2000’s were characterized by slow, steady apartment construction.<br />
The development incentives that followed Hurricane Katrina produced a “boomlet” in apartment<br />
construction that was of a shorter duration and a smaller volume than previous booms.<br />
In terms of occupancy and rent levels, the effects of this recent, smaller construction surge have<br />
been muted, and the rental market appears to be regaining equilibrium.<br />
<strong>New</strong> <strong>Orleans</strong> <strong>Market</strong> <strong>Assessment</strong> – An Analysis of Supply and Demand Dynamics 24
Residential Construction, 2003 – 2010<br />
The ebb and flow of new construction responds to and anticipates many forces at work in the national,<br />
regional and local economic frameworks. <strong>New</strong> supply, for example, enters the inventory pipeline<br />
anticipating economic growth and the accompanying formation and in‐migration of households needing<br />
shelter. Such growth is typically linked to population gains that are driven by economic forces such as<br />
expanded job opportunities, business and industrial expansion and rising income levels. <strong>New</strong> supply, as<br />
previously discussed, is also influenced by the flows of financing available to accommodate both<br />
producers and consumers as well as the occasional extraordinary packages of incentives used to<br />
encourage decisions that might not otherwise be made or delayed to a later date. Interventions by<br />
agencies such as the Fed (to reduce borrowing costs) and HUD (to broaden the scope and availability of<br />
financing) generally do a good job to accomplish the former, while Congressional changes to the Tax<br />
Code address the latter as in the first time home buyer tax credit.<br />
<strong>New</strong> inventory additions may also be impeded by a number of factors as well. Fundamental to new<br />
residential construction is the availability of land suitably located and appropriately zoned to support<br />
community development. Shortages of land either by physical or legal/regulatory restraint has the<br />
potential of slowing if not redirecting patterns of new residential construction. Although such restraints<br />
may typically be associated with multi‐family products resisted by many communities, the sprawl and<br />
unfettered extension of infrastructure and services are often raised as reasons to slow the issuance of<br />
permits for new construction or to impose outright moratoria linked to overburdened sewer and water<br />
systems.<br />
Tables 6 and 7 summarize new construction trends by parish for the <strong>New</strong> <strong>Orleans</strong> metropolitan area<br />
covering the period 2000 through November 2010. This information is drawn from the C‐40 construction<br />
series published by the U.S. Census based upon reports received from permit issuing jurisdictions<br />
throughout the region. This source is generally considered to be the best measure of new supply in<br />
housing market analyses.<br />
If permits for new residential construction are a reflection of a local market’s relative economic<br />
strength, then much of the last decade would generally be characterized as anemic. With the exception<br />
of two years (2006 and 2007) which were notably influenced by the extraordinary conditions imposed<br />
by Hurricane Katrina, new construction in the region has been on a steady downward sloping path. The<br />
two major sectors of new construction, single and multi‐family are discussed in the sections which<br />
follow.<br />
Single Family <strong>New</strong> Construction<br />
<strong>New</strong> single family home production in the <strong>New</strong> <strong>Orleans</strong> region peaked in 2004 at 5,792 units permitted<br />
and, with the exception of post‐Katrina 2006, has steadily trended downward each year through the end<br />
of the decade. Overall, single family permitted new construction averaged 4,139 units annually over the<br />
2000 to 2009 period. Since 2007, annual permit levels have generally fallen below the average annual<br />
production pace and 2010 is likely to end in a similar manner when all reports have been tabulated.<br />
<strong>New</strong> <strong>Orleans</strong> <strong>Market</strong> <strong>Assessment</strong> – An Analysis of Supply and Demand Dynamics 25
Volume through November 2010 stood at 1,713 units or 289 units (14.4% below) the pace set for the<br />
same period in 2009. Extrapolating through the end of the year puts annual single family home<br />
production at about 2,150 to 2,200 units for 2010 or about 2% below 2009’s already low levels. For the<br />
most part, the substantial decline in new residential home construction in the region may very well have<br />
been stemmed by the gradual sell‐off of lingering unsold inventory (both new and used), some of which<br />
was no doubt influenced by first time homebuyer tax incentives available through the first and part of<br />
the second quarters of the year. Other factors that have helped include continuing repopulation of the<br />
region, particularly in <strong>Orleans</strong> Parish, and the persistence of historically low home mortgage interest<br />
rates that have been impacted by massive market intervention by the Fed.<br />
The geographic distribution of new single family home construction in the region has changed<br />
significantly over the past few years. Prior to and just after Hurricane Katrina, new single family<br />
construction was heavily concentrated in fast growing St. Tammany Parish. In fact, for the period 2000<br />
through 2007, 51% of all permits for new single family construction were issued in St. Tammany Parish<br />
with annual shares ranging from 40.2% in 2007 to 54.6% in 2004. Drawn by the prospect of owning a<br />
larger home with more land area in a community with one of the consistently top ranked public school<br />
systems, households have been steadily migrating to St. Tammany Parish since the 1970’s. Although<br />
primarily a bedroom community for those working in <strong>Orleans</strong> and Jefferson Parishes, St. Tammany<br />
Parish’s growth and maturation have also fueled an expanding and diversifying economic base that has<br />
attracted business expansions and relocations from within the region as well as from other markets in<br />
the U.S. This unfolding maturation of its economic base started during the early 1990’s, gained<br />
momentum during the early part of the 2000’s and has accelerated since Katrina in 2005. This latest<br />
phase of its maturation is best evidenced by the relocation of major employers from the Southshore<br />
such as Chevron Oil, LLOG and LOOP and the entry of Globalstar, formerly based in Silicon Valley. These<br />
are all trends that have fueled St. Tammany’s growth and that have driven demand to support new<br />
residential single family home production and sales. This sector of the St. Tammany residential market,<br />
however, is not without its difficulties.<br />
A post‐Katrina surge of new permits in 2005 and 2006 of 2,468 and 2,659 units, respectively, filled the<br />
pipeline of new homes beyond its capacity to be effectively absorbed even in the context of<br />
extraordinary post‐storm growth from hurricane displaced households. And, although representing a<br />
significant drop (39%) in new permits, the 1,631 units added in 2007 only helped to exacerbate the<br />
market’s overhang of unsold inventory. Unlike other areas of the U.S. where sub‐prime lending fed the<br />
tidal wave of new construction, it was excessive and unrealistic expectations in a storm shocked market<br />
that drove subdivision development and new home construction to unsustainable levels in St. Tammany<br />
Parish and other Northshore communities.<br />
The realities of slower growth and resettlement of previously displaced households together with an<br />
abrupt pullback of development and construction lending have combined to drive new home<br />
construction in St. Tammany Parish down to levels not seen since the oil and gas recession of the 1980’s.<br />
Indeed, the St. Tammany housing market has experienced a profound adjustment. Permits for new<br />
single family construction fell to 933 units in 2008 down 65% from 2006’s post‐storm peak) and again to<br />
592 units in 2009. And, although the worst of the downturn may be over, permit activity through<br />
<strong>New</strong> <strong>Orleans</strong> <strong>Market</strong> <strong>Assessment</strong> – An Analysis of Supply and Demand Dynamics 26
November 2010 of 529 units (compared to 541 units for the same period in 2009) indicate that the<br />
year’s total production is not likely to exceed 575 to 600 units. This would just about equal 2009’s total<br />
permit volume but is still well below average annual production volumes for the decade.<br />
Jefferson Parish’s new single family home construction has also followed a pattern similar to St.<br />
Tammany’s for the past decade. After steadily rising in the early part of the decade, permits for new<br />
construction exceeded 1,000 units in the years just before Katrina – 1,168 in 2003 and 1,173 in 2004.<br />
This volume of new construction had become somewhat of a rarity in Jefferson which had urbanized<br />
rapidly on its eastbank during the 1960 to 1990 period leaving few tracts of underdeveloped land. This<br />
pushed development to its less accessible westbank where new subdivision growth along the Lapalco<br />
Boulevard corridor was most evident during the past decade or so.<br />
Since peaking in 2004, permits for new single family construction for the most part steadily edged down<br />
through the end of 2009 and are likely to continue doing so through 2010. The only exception to this<br />
pattern was a slight uptick in permits to 798 in 2007, a post‐Katrina year where expectations of a growth<br />
push fueled new inventory additions. Thereafter, permit volumes fell to 565 units in 2008 (down 29%<br />
from 2007) and 350 units in 2009 (down 56% from the 2007 post‐storm peak and 56% below the<br />
decade’s annual average pace of new construction of 802 units). Permits issued through November<br />
signal yet another year to year decline for 2010, dropping to about 260 units or 26% below 2009. This<br />
continued slowdown can probably be attributed to Jefferson Parish’s gradual population declines, its<br />
somewhat stalled economy and a lingering excess of available single family homes for sale in most<br />
sectors of the market both geographically and by price range. These are conditions not likely to change<br />
significantly over the short term and thus new home construction will probably remain below average<br />
for the next twelve to eighteen months in Jefferson Parish.<br />
Prior to Katrina, new home construction in <strong>Orleans</strong> Parish generally lagged behind fast growing St.<br />
Tammany Parish and its more immediate suburban neighbor Jefferson Parish. From 2000 to 2004,<br />
permits for new single family housing in <strong>Orleans</strong> Parish averaged 465 units annually. By comparison,<br />
average annual production volumes during the same period averaged 2,326 units in St. Tammany Parish<br />
and 938 units in Jefferson Parish. In <strong>Orleans</strong> Parish, permits peaked during this pre‐storm period at 552<br />
units in 2004 as they did likewise in these two suburban parishes.<br />
In 2005, permits in <strong>Orleans</strong> Parish came to a virtual standstill after August with a total of 413 units<br />
permitted for construction during the year. Thereafter, as the rebuilding of the City unfolded, the<br />
volume of permits issued recovered to 468 in 2006 and rose sharply to 1,026 units in 2007. This was<br />
significantly higher than the volume of permits issued in Jefferson Parish (798) and approached the<br />
1,631 units permitted in St. Tammany Parish. Since then, permits in <strong>Orleans</strong> totaled 882 in 2008 (down<br />
14% from 2007) and then increased to 947 units in 2009, the only year to year gain reported among the<br />
region’s eight parishes. It is also interesting to note that this 2009 volume in <strong>Orleans</strong> Parish was<br />
significantly higher (60%) than the number of units permitted in St. Tammany Parish and almost triple<br />
the volume reported for Jefferson Parish in 2009. And, although there has been a gradual slowdown in<br />
permits issued through November of 2010, it appears that the total volume of new single family homes<br />
entering the supply pipeline for the year will range from 825 to 850 units. This will once again surpass<br />
<strong>New</strong> <strong>Orleans</strong> <strong>Market</strong> <strong>Assessment</strong> – An Analysis of Supply and Demand Dynamics 27
the anticipated new 2010 inventory additions in both St. Tammany and Jefferson Parishes and is further<br />
evidence of the on‐going and gradual rebuilding throughout the City.<br />
Table 6: Residential Building Permits: Single Family Housing, 2000 November 2010<br />
Area<br />
<strong>New</strong> <strong>Orleans</strong> Metro<br />
2000 2001<br />
Pre‐Katrina<br />
Post‐Katrina<br />
Aug 2005 Nov YTD Nov YTD<br />
2002 2003 2004<br />
2005 2006 2007 2008 2009<br />
YTD 2009 2010<br />
Total Permits<br />
Jefferson 699 715 937 1,168 1,173 818 912 707 798 565 350 321 238 4,692 3,332 215 938 666 (83)<br />
<strong>Orleans</strong> 348 455 438 530 552 412 413 468 1,026 882 947 881 756 2,323 3,736 (65) 465 747 (125)<br />
Plaquemines 118 125 107 202 155 73 73 99 147 91 62 56 35 707 472 29 141 94 (21)<br />
St. Bernard 96 117 104 98 95 54 46 125 214 99 33 31 22 510 517 66 102 103 (9)<br />
St. Charles 174 196 216 319 319 205 309 574 126 100 115 85 84 1,224 1,224 (15) 245 245 (1)<br />
St. James 14 19 31 29 94 0 172 185 55 47 41 NA NA 187 500 6 37 100 NA<br />
St. John 242 243 280 265 237 159 267 283 57 86 91 87 49 1,267 784 (5) 253 157 (38)<br />
St. Tammany 1,798 1,648 2,244 2,775 3,167 2,091 2,468 2,659 1,631 933 592 541 529 11,632 8,283 341 2,326 1,657 (12)<br />
<strong>New</strong> <strong>Orleans</strong> Metro Total 3,489 3,518 4,357 5,386 5,792 3,812 4,660 5,100 4,054 2,803 2,231 2,002 1,713 22,542 18,848 572 4,508 3,770 (289)<br />
State of <strong>Louisiana</strong> 13,109 13,274 15,225 18,478 20,684 13,908 20,206 23,806 16,640 11,689 10,755 10,167 9,689 80,770 83,096 934 16,154 16,619 (478)<br />
Source: US Census Bureau, Residential Building Permits<br />
2003 annual data is based on the 19,000 place series; 2004 through YTD November 2010 annual data is based on the 20,000 place series.<br />
Monthly data, used here for the November 2009 YTD column, does not contain all of the places included in the annual data.<br />
St. Charles Parish data excludes four or more family buildings. Lafourche data excludes three and four family buildings.<br />
August 2005 data is based on year to date imputation and, in some cases, exceeds annual estimations for 2005. This is because reporting from local permitting agencies is more complete with the annual data.<br />
2000‐<br />
2004<br />
2005‐<br />
2009<br />
Change<br />
2008‐<br />
2009<br />
Average Annual<br />
Volume<br />
2000‐<br />
2004<br />
2004‐<br />
2009<br />
Change<br />
YTD<br />
Nov. 2009‐<br />
Nov 2010<br />
Multi‐Family <strong>New</strong> Construction<br />
As previously discussed, the volume of new multi‐family apartments entering the inventory pipeline<br />
during any particular time period can be driven by a variety of factors that may or may not be fully<br />
reflective of anticipated growth and thus demand. These would include, but not necessarily be limited<br />
to, special financing programs or other financing incentives and favorable treatment within the IRS Tax<br />
Code. For the pre‐storm period of the last decade (2000 to 2004), there was not the same level of such<br />
special financing or tax incentives to substantially influence new multi‐family housing production. This<br />
characteristic of the pre‐Katrina housing market is generally reflected in the number of permits issued<br />
for units built in multi‐family buildings. During the post‐storm period, however, the volume of permits<br />
issued rose sharply in the region, particularly in <strong>Orleans</strong> and St. Tammany Parishes, fueled largely by<br />
financing enhancements and favorable tax treatments designed to attract capital to the rebuilding and<br />
redevelopment process.<br />
From 2000 to 2004, permits for new multi‐family construction (which may include 2+ unit buildings sold<br />
as condominiums or fee simple townhouse) averaged 833 units annually in the eight parish region.<br />
<strong>Orleans</strong>, St. Tammany and Jefferson Parishes accounted for the majority (96%) of this new production<br />
which peaked at 1,057 units in 2002. Likewise, production during this pre‐storm period also peaked in<br />
2002 in Jefferson Parish (367 units) and St. Tammany Parish (483 units). Other parishes in the region<br />
accounted for relatively small additions to multi‐family housing inventory during this period.<br />
Post‐Katrina multi‐family production gained momentum in 2006 with 659 units permitted throughout<br />
the region and then surged to 3,025 and 2,037 units in 2007 and 2008, respectively, as the recovery<br />
related incentives were fully rolled out and utilized by developers. However, unlike previous surges of<br />
incented new apartment construction, this one was comparatively short lived reflecting the short<br />
timeframe in which many of these subsidized properties had to be built as part of the LIHTC program. In<br />
<strong>New</strong> <strong>Orleans</strong> <strong>Market</strong> <strong>Assessment</strong> – An Analysis of Supply and Demand Dynamics 28
2009 total multi‐family permits issued dropped to 646 units in the region, virtually all of which (614<br />
units) were for properties located in <strong>Orleans</strong> Parish. The winding down of some incentives together with<br />
lingering financial market difficulties brought permits for new multi‐family to a near halt in 2010<br />
throughout the region with the exception of <strong>Orleans</strong> Parish. But even here, the 174 units issued through<br />
November (83% of the region’s total) represents a sharp pull back from the production levels of the<br />
previous three years in <strong>Orleans</strong> Parish, an indication that construction activity as part of the post‐storm<br />
rebuilding process may be nearing its end. Between 2005 and 2009, a total of 5,085 units were<br />
permitted for new construction in <strong>Orleans</strong> Parish or about 1,017 units on an average annual basis. This<br />
represented 76.4% of the region’s total multi‐family production for the five year period. By comparison,<br />
the 1,097 units permitted in St. Tammany Parish during this same period accounted for 16.5% of the<br />
region’s total production while the Jefferson Parish volume of 346 units made up 5.1% of the regionwide<br />
addition of new multi‐family inventory. St. Bernard and other suburban parishes have accounted<br />
for relatively few newly built multi‐family units since 2007.<br />
The building permits, as reported by the U.S. Census Bureau, are for new construction, and exclude the<br />
thousands of storm‐damaged rental units rehabilitated since 2005. The majority of large scale multifamily<br />
units repaired post‐Katrina are included in the LHFA pipeline data (Table 25); a portion of small<br />
scale rental units that have come back online are captured in the analysis of homestead exemptions,<br />
surveys and vouchers, as seen in the maps and tables within the small rental discussion starting on page<br />
66.<br />
Table 7: Residential Building Permits: MultiFamily Housing, 2000 November 2010<br />
Pre‐Katrina<br />
Post‐Katrina<br />
Total Permits Change<br />
Average Annual Change<br />
Volume YTD<br />
Area<br />
Aug 2005<br />
Nov YTD Nov YTD 2000‐ 2005‐ 2008‐ 2000‐ 2004‐ Nov. 2009‐<br />
2000 2001 2002 2003 2004<br />
2005 2006 2007 2008 2009<br />
YTD 2009 2010 2004 2009 2009 2004 2009 Nov 2010<br />
<strong>New</strong> <strong>Orleans</strong> Metro<br />
Jefferson 118 521 367 27 44 37 32 9 79 204 22 20 0 1,077 346 182 215 69 (20)<br />
<strong>Orleans</strong> 331 172 178 387 335 204 204 355 2,220 1,692 614 586 174 1,403 5,085 1,078 281 1,017 (412)<br />
Plaquemines 0 0 6 0 2 2 2 3 13 0 0 0 32 8 18 0 2 4 32<br />
St. Bernard 12 46 8 10 2 0 0 4 4 0 0 0 0 78 8 0 16 2 0<br />
St. Charles 2 0 7 0 16 12 14 16 0 0 0 0 0 25 30 0 5 6 0<br />
St. James 2 0 0 0 0 NA 0 40 0 4 4 NA NA 2 48 0 0 10 NA<br />
St. John 8 7 8 0 30 6 0 24 0 2 2 2 2 53 28 0 11 6 0<br />
St. Tammany 221 193 483 348 273 43 41 208 709 135 4 4 2 1,518 1,097 131 304 219 (2)<br />
<strong>New</strong> <strong>Orleans</strong> Metro Total 694 939 1,057 772 702 304 293 659 3,025 2,037 646 612 210 4,164 6,660 1,391 833 1,332 (402)<br />
State of <strong>Louisiana</strong> 1,611 2,379 3,200 3,742 2,305 1,400 2,605 4,865 6,739 4,616 1,758 1,519 848 13,237 20,583 2,858 2,647 4,117 (671)<br />
Source: US Census Bureau, Residential Building Permits<br />
2003 annual data is based on the 19,000 place series; 2004 through YTD November 2010 annual data is based on the 20,000 place series.<br />
Monthly data, used here for the November 2009 YTD column, does not contain all of the places included in the annual data.<br />
St. Charles Parish data excludes four or more family buildings. Lafourche data excludes three and four family buildings.<br />
August 2005 data is based on year to date imputation and, in some cases, exceeds annual estimations for 2005. This is because reporting from local permitting agencies is more complete with the annual data.<br />
<strong>New</strong> <strong>Orleans</strong> <strong>Market</strong> <strong>Assessment</strong> – An Analysis of Supply and Demand Dynamics 29
Key Conclusions – Recent Construction Trends:<br />
<br />
<br />
<br />
<br />
<br />
Since 2000, the peak year for single family permit activity within the region was in 2004. Single<br />
family activity has steadily declined since 2007 and is at less than 40% of the 2004 level of activity.<br />
Single family permit activity has experienced a precipitous decline in Jefferson and St. Tammany<br />
parishes since Katrina while <strong>Orleans</strong> Parish has occupied an increasing share of single family permit<br />
activity in recent years.<br />
There was a post‐Katrina “boomlet” in multi‐family construction between 2006 and 2008, but<br />
multifamily activity subsided in 2009 and 2010.<br />
The bulk of multifamily units permitted between 2005 and 2009 in the region were in <strong>Orleans</strong><br />
Parish.<br />
Multifamily permit activity is at a near standstill in the metropolitan area except in <strong>Orleans</strong> Parish,<br />
though 2010 levels are well below 2009 levels in <strong>Orleans</strong> as well.<br />
<strong>New</strong> <strong>Orleans</strong> <strong>Market</strong> <strong>Assessment</strong> – An Analysis of Supply and Demand Dynamics 30
Apartment Occupancy Trends: 2004 – 2010<br />
Just as there is an ebb and flow of construction activity on the supply side of the housing market, there<br />
are complimentary and reactionary flows on the demand side of the equation. These activity flows or<br />
market indicators are usually measured in terms of changes in rents and patterns in occupancy and<br />
absorption rates. Occupancy rates typically measure inventory utilization levels as of a point in time,<br />
while absorption rates measure space consumption over a specific time period (i.e. week, month, year,<br />
etc.). The analysis which follow and that is summarized in the accompanying tables focuses on demand<br />
ebbs and flows as reflected by reported occupancy rates. The analysis addresses overall occupancy in<br />
the region as a whole and by specific geographic sub‐sectors within it focusing primarily on market rate<br />
multi‐family properties located in <strong>Orleans</strong>, Jefferson and St. Tammany Parishes. A sub‐component of the<br />
analysis addresses a portion of the local housing inventory that is categorized as affordable and mixed<br />
income. The sample of properties consists primarily of those containing twenty or more units with the<br />
largest portion of the properties surveyed having 100 or more units.<br />
Occupancy Trends: <strong>Market</strong> Rate Units<br />
The occupancy trends summarized in Table 9 reflect rather well the somewhat erratic shifts in inventory<br />
utilization rates that would generally be expected in a region visited by one of the most destructive<br />
natural disasters in U.S. history. The combination of economic dislocations, population displacements<br />
and housing inventory damage and destruction produced changes in occupancy rates from one period<br />
to the next that were sharp and somewhat unprecedented in the <strong>New</strong> <strong>Orleans</strong> market. And, although<br />
some level of stability appears to be returning as the market settles into its “new normal,” the<br />
opportunity for yet further adjustments remains on the horizon as new inventory awaits entry into the<br />
production pipeline and the looming uncertainties associated with national and global economic<br />
conditions unfold and produce their imprints on the local market particularly in terms of job creation<br />
and population migration.<br />
After hitting a post‐Katrina average of 95%, occupancy rates from the 2006 to 2008 period steadily<br />
edged downward in the <strong>New</strong> <strong>Orleans</strong> region. By year end 2008, average apartment occupancy had fallen<br />
to 86.9% following two previous year consecutive decreased to 91.9% and 90.1% in 2006 and 2007,<br />
respectively. In 2009, average reported occupancy edged up in the region to 88.3% and by year end<br />
2010 it had risen to 89.5%.<br />
Within the region, particularly in <strong>Orleans</strong>, Jefferson and St. Tammany Parishes, the movement of<br />
average occupancy rates is a direct reflection of how the market responded to the unprecedented<br />
Katrina‐imposed dislocation and subsequent recovery and rebuilding. Jefferson Parish’s experience is<br />
quite illustrative of wide swings in the forces of supply and demand.<br />
In 2004 and in the period just prior to Katrina, apartment managers and owners of properties located in<br />
Jefferson Parish reported average occupancy rates of 94.7% and 94.6%, respectively, with most<br />
geographic subsectors having average occupancy rates of 94% to 95% or above. By most measures of<br />
strength, Jefferson Parish’s apartment market would generally be characterized as very stable to strong.<br />
<strong>New</strong> <strong>Orleans</strong> <strong>Market</strong> <strong>Assessment</strong> – An Analysis of Supply and Demand Dynamics 31
As previously discussed, this is a condition which this sector of the regional market has typically enjoyed<br />
for the better part of two to three decades even with short periods of overbuilding taken into<br />
consideration.<br />
In the period immediately following Hurricane Katrina, average apartment occupancy in Jefferson<br />
soared to near a saturation level of 99.6% parish wide and to 100% in three of its subsectors. The<br />
reasons are abundantly clear as those displaced from flooded homes in portions of Jefferson Parish as<br />
well as <strong>Orleans</strong> and St. Bernard secured short term immediate shelter as they began the process of<br />
rebuilding. This made up one segment of demand for rental units in Jefferson. A second segment<br />
included the many who descended upon the region in the weeks and months immediately following the<br />
storm to assist in the recovery, clean‐up and rebuilding process. This included construction and disaster<br />
recovery crews not otherwise housed in temporary quarters or lodging facilities as well as<br />
representatives from insurance companies and a wide array of government agencies. The need for<br />
shelter was immediate and acute and for many in these immediate post‐disaster months, price (rent)<br />
was no object. It should also be noted, that although Jefferson Parish’s apartment inventory did not<br />
suffer the same level of damage inflicted on units in neighboring <strong>Orleans</strong> Parish, some units were<br />
temporarily unavailable. This was due in large part to wind damage and comparatively light (two to four<br />
inches) of flooding on the ground floors of some garden apartments located in Metairie.<br />
Since the post‐Katrina near saturation peak, average occupancy levels steadily fell in Jefferson Parish<br />
reaching 88.1% at year end 2009. Declines were particularly sharp in some geographic submarkets of<br />
Jefferson. In Kenner, for example, average occupancy fell from a post‐Katrina high of 98.8% to a year<br />
end 2009 average of 81.9%, while in the River Ridge sector, average occupancy over the same period<br />
dropped from 100% to 85.4% in 2009. These patterns are reflective of several forces that through the<br />
end of 2009 did not necessarily favor strong demand for rental apartments in Jefferson Parish.<br />
As owners of relatively lightly flooded homes in Jefferson were able to complete repairs of their<br />
property (with or without insurance proceeds) they were able to vacate their temporarily secured rental<br />
apartments. Also, as recovery and initial clean‐up phases wound down, short term labor and support<br />
crews vacated apartments in Jefferson Parish. These trends had particular influence moving through the<br />
end of 2006 and into 2007. Thereafter, the restoration and rebuilding of homes and rental properties in<br />
many <strong>Orleans</strong> Parish neighborhoods allowed those occupying Jefferson Parish located rental units to<br />
return home or to neighborhoods from which they were displaced. This gained momentum during 2007<br />
and into 2008 particularly in response to funds available through the Road Home and Small Rental<br />
programs. These fueled a steady increase in new housing inventory which was further supplemented by<br />
the introduction of additional apartment inventory linked to tax incented financing programs and<br />
rebuilding efforts funded through insurance proceeds and SBA loans. These forces helped to further<br />
drain demand from Jefferson Parish’s apartment inventory and thus drive the gradual decrease in<br />
average occupancy levels. Further aggravating the situation in Jefferson was a lack of replacement<br />
demand due to stagnant population and employment growth over the past two to three years. Katrina,<br />
in effect, created a short term demand bubble in Jefferson Parish’s apartment market sector which had<br />
not been sustained by necessary market fundamentals.<br />
<strong>New</strong> <strong>Orleans</strong> <strong>Market</strong> <strong>Assessment</strong> – An Analysis of Supply and Demand Dynamics 32
During 2010, the demand for rental apartments in Jefferson Parish strengthened as average occupancy<br />
rose to 96.4%. This improvement was consistent across each of the parish’s sub‐markets with the most<br />
notable strengthening occurring in the West Metairie area where average occupancy rose from 87.9% in<br />
2009 to a yearend 2010 level of 91.6%. Similar resurgences in demand also occurred in the Kenner<br />
sector (81.9% to 83.9%) and East Metairie (91.5% to 94.5%) on the eastbank and in the Harvey Canal<br />
East/Gretna area on the westbank from 91.1% to 92.2%. Although these occupancy rates remain well<br />
below their post‐Katrina peaks, they are in most instances returning to levels which were more typical in<br />
2004 and just prior to Katrina. Despite its lack of population growth and its somewhat stagnant job<br />
gains, Jefferson is the second most populous parish (according to the 2010 Census) in the state with a<br />
relatively stable core of major employers and business centers. These provide jobs at a wide range of<br />
salary levels including service based retail employment which drives demand for rental housing. As the<br />
regional economy grows and expands, these employers are likely to create more jobs that will help<br />
support and sustain demand for rental units across Jefferson Parish.<br />
St. Tammany Parish reflects some similarities to Jefferson in the movements of supply and demand in<br />
the post‐Katrina regional housing market. Between the end of 2004 and just prior to Katrina, average<br />
apartment occupancy in St. Tammany Parish dropped from 95.6% to 88.4%. This was largely the result<br />
of the addition of new inventory which began to enter the supply pipeline in mid‐2003 and was<br />
completed during the middle of 2004. This produced a very short term period of inventory overhand<br />
which was quickly remediated in the weeks and months following Katrina. In the immediate period<br />
following the storm, parish wide average apartment occupancy in St. Tammany rose to 98.7% as<br />
dislocated households moved to the Northshore from flood damaged neighborhoods in <strong>Orleans</strong> and St.<br />
Bernard Parishes. This surge of growth held average occupancy rates at just under 98% through the end<br />
of 2006 and started to drift down in a pattern similar to the experience of Jefferson Parish as dislocated<br />
households returned to their homes on the Southshore and as a cohort of new apartment construction<br />
began entering the supply pipeline. These properties have taken advantage of post‐storm financing and<br />
tax‐treatment incentives and have grown the availability of new rental apartments in both the east and<br />
west sectors of the St. Tammany Parish market. At the same time, population, household and<br />
employment growth rates in the parish have all slowed somewhat. These forces combined to push<br />
average occupancy down to 91.3% in 2007 and then to 81.6% in 2008. Since then, the parish’s slow but<br />
steady growth and virtual halt to new multi‐family construction have combined to absorb the overhang<br />
of new inventory and push average apartment occupancy to 88.3% at year end 2009 and to 91.0% by<br />
the end of 2010. Going forward, with virtually no new units in the construction pipeline, average<br />
apartment occupancy should continue to edge upward over the next 12 to 18 months. Several new<br />
properties have been proposed, but face difficulties in securing the necessary financing. The exception<br />
to this is the 240 unit Brookstone Park Apartments that is under construction on a 14.7 acre parcel just<br />
south of Covington near the intersection of I‐12 and LA Highway 21. The first phase will consist of 128<br />
units with phase two comprising the balance of 112 units. Phase two will not begin, however, until the<br />
128 units in phase one has reached a stabilized operating level. This property will contain a mix of one,<br />
two and three bedroom units ranging in size from 645 to 1,287 square feet with rents ranging from<br />
$1.08 to $1.29 per square foot.<br />
<strong>New</strong> <strong>Orleans</strong> <strong>Market</strong> <strong>Assessment</strong> – An Analysis of Supply and Demand Dynamics 33
In <strong>Orleans</strong> Parish, the apartment market was functioning in a relatively balanced state just prior to<br />
Katrina. In 2004, year end apartment occupancy averaged 94.8% while in the pre‐storm months of 2005<br />
average reported occupancy stood at 94.5%. For the most part, average occupancy rates across each of<br />
the parish’s geographic submarkets exceeded 90% with most at or above 95%. The storm had the<br />
immediate effect of rearranging apartment inventories and abruptly shifting residents who remained in<br />
the region to units in sectors of the parish where storm and flood damage was less severe. As a result,<br />
average occupancy rates experienced wide swings during the immediate post‐Katrina and 2006<br />
reporting periods. Average occupancy rose to 88.2% in 2006 (from 87.5% in post‐Katrina 2005) and then<br />
turned down to 84.4% as new and rehabilitated inventory began entering the supply pipeline. These<br />
additions to inventory have, in the majority of instances, been driven by the mix of tax and financing<br />
incentives made available to help in the rebuilding effort. Another portion of the additional inventory<br />
resulted from initiatives such as the Small Rental Program of the LRA as well as the reinvestment of<br />
insurance proceeds and other capital by individual property owners, and more recently, the large<br />
number of for sale homes that have entered the rental market.<br />
Even with these additions to inventory, the steady return and growth of population and households in<br />
the city has helped to drive demand for rental apartments. The result has been an increase in average<br />
apartment occupancy to 85.3% at year end 2008 followed by a rise to 86.7% in 2009 and 87.2% at the<br />
end of 2010. And, considering the sharp reduction in new construction in the pipeline, parish wide<br />
apartment occupancy rates are likely to continue edging up through 2011 and into 2012. This is not to<br />
say, however, that some geographic sectors of the <strong>Orleans</strong> Parish market are without some challenges.<br />
The strongest performing sectors are the Uptown, Mid‐City and Warehouse District areas, and as<br />
evidenced by our field surveys of small rental properties, the southern portion of the Bywater planning<br />
district. Each of these have reported average occupancy rates at or above 92% and have shown<br />
consistent improvement since 2008 when the market was confronted with the need to absorb a wave of<br />
new inventory additions which continued through much of 2009. These sectors share one significant<br />
common trait, namely access to cores of economic activity and employment opportunities. This includes<br />
the CBD, the redeveloping medical center and the Uptown (St. Charles Avenue/Magazine Street)<br />
corridor. These are all well served by public transit thus making them readily accessible to apartment<br />
residents living in these sectors of the market.<br />
<strong>New</strong> <strong>Orleans</strong> <strong>Market</strong> <strong>Assessment</strong> – An Analysis of Supply and Demand Dynamics 34
The 2010 Census and the <strong>New</strong> <strong>Orleans</strong> Region<br />
The U.S. Census recently released 2010 data for the <strong>New</strong> <strong>Orleans</strong> metropolitan area. This long‐awaited<br />
information provides the community with a benchmark of size status in relation to ten years ago, and more<br />
importantly, how far the region has come in terms of rebuilding during the post‐Katrina period. Prior to having<br />
access to this information, GCR developed a measure for assessing population recovery. Referred to as an “Activity<br />
Index,” it combines several sources of information to determine whether there is residential activity at a particular<br />
address. This includes garbage pickup, utility usage, mail delivery, voter registration and spot surveys. In<br />
comparing this data to the 2010 Census, one sees a sizeable difference in <strong>Orleans</strong>, Jefferson and St. Bernard<br />
parishes. This discrepancy is not a result of error from either source; each data source represents something<br />
slightly different – the Census surveys people whereas the Activity Index surveys places. What is particularly<br />
significant about this discrepancy is the volume of homes that are active without occupants. This pool, consisting<br />
of more than 18,000 units, includes those properties currently being rebuilt as well as those already rebuilt but<br />
vacant, waiting to be rented or sold, or those not used as full time residences. What is also of significance is the<br />
level of recovery that has taken place thus far, particularly in <strong>New</strong> <strong>Orleans</strong>, where 80% of the city flooded. The<br />
population growth over the past five years has exceeded initial expectations and is a testament to the<br />
community’s will to rebuild. Although growth has tapered in recent years, it remains more robust than regional<br />
growth, with the city’s residential activity increasing by 7% in 2009 and 4% in 2010.<br />
Table 8: Household Estimates for <strong>New</strong> <strong>Orleans</strong> Metro Area<br />
Census Activity Index Census Difference<br />
2000 Aug‐05 Jun‐06 Jun‐07 Jun‐08 Jun‐09 Jun‐10 2010 Activity Index<br />
and 2010<br />
Census<br />
<strong>New</strong> <strong>Orleans</strong> 188,251 185,896 94,895 119,671 135,318 144,869 150,881 142,158 6.1% 8,723<br />
Jefferson 176,234 182,718 172,720 176,459 178,553 178,679 178,630 169,647 5.3% 8,983<br />
Plaquemines 9,021 9,170 6,502 7,397 7,575 7,606 7,788 8,077 ‐3.6% ‐289<br />
St. Bernard 23,156 25,264 6,638 11,021 12,852 13,493 14,251 13,221 7.8% 1,030<br />
St. Charles 16,422 17,804 17,986 18,080 18,215 18,216 18,177 18,557 ‐2.0% ‐380<br />
St. John the Baptist 14,283 15,990 16,397 16,572 16,484 16,446 16,283 15,965 2.0% 318<br />
St. Tammany 69,253 n/d 87,521 n/a<br />
Source: U.S. Census 2010 and GCR Activity Index<br />
<strong>New</strong> <strong>Orleans</strong> <strong>Market</strong> <strong>Assessment</strong> – An Analysis of Supply and Demand Dynamics 35
Challenges, however, are evident in several sectors of the <strong>Orleans</strong> Parish market. These include Algiers<br />
(on the westbank) and the Lake Forest and N.O. East sectors. Average occupancy reported in Algiers<br />
through the end of 2010 was 76.7%, the lowest of any geographic sector in the region and somewhat<br />
reminiscent of occupancy levels reported for this area during the overbuilding and weak economy<br />
periods of the early 1970’s and early 1980’s. This is well below the area’s 2004 level of 94.0% and much<br />
weaker than the immediate post‐Katrina level of 98.8%. This sector benefited greatly following the<br />
storm since it was not inundated with flood waters and suffered relatively little wind damage.<br />
Consequently, its available stock of housing was quickly absorbed by those needing shelter as a result of<br />
being displaced or having been relocated to the region to assist with the recovery and rebuilding effort.<br />
Like other areas with similar experiences, as these demand forces lessened the inventory utilization<br />
rates began to soften. These conditions are further complicated by the fact that the Algiers area is not as<br />
readily accessible to employment centers on the eastbank of the river and that some employers (i.e.<br />
LOOP) have relocated out of the area. The Algiers area is also dominated by older rental apartment<br />
stock which, in some cases, may not be as attractive to prospective renters when compared to<br />
competitive properties enjoying better access to job opportunities. Field surveys conducted in the<br />
summer of 2010 further corroborate the decline of certain Algiers properties. Several buildings within<br />
garden complexes were shuttered and boarded up while deferred maintenance issues and disrepair<br />
were evident in at least two of the larger complexes, further limiting demand in the area. However, the<br />
development of the Federal City project is expected to create significant job growth that will be readily<br />
accessible to Algiers area apartment residents and thus help to push occupancy rates higher.<br />
A similar situation with respect to access to employment and economic activity centers is also probably<br />
impacting apartment demand and occupancy levels in the Lake Forest and N.O. East sectors. Although<br />
the 82% average occupancy reported for Lake Forest is below the parish wide level of 87.2%, it does<br />
represent a steady improvement since 2008 when new and rebuilt units reentered the area’s rental<br />
inventory. Given the virtual absence of commercial and business activity in the area, this should be<br />
considered a sign of strength for this sector of the market bolstered by the significant return of<br />
homeowners to the area, as seen through the strong rebuilding activity amongst Road Home grant<br />
recipients. As office and retail locations repopulate this once seriously damaged part of the city, demand<br />
for rental apartments and rising average occupancy rates should become even more sustainable. This<br />
will only gain more strength and momentum as public and institutional investments to restore<br />
infrastructure and medical services to the area unfold. These investments will have a twofold benefit to<br />
this area of the city. They will help to both improve the quality of life and broaden job opportunities for<br />
those attracted to the area.<br />
<strong>New</strong> <strong>Orleans</strong> <strong>Market</strong> <strong>Assessment</strong> – An Analysis of Supply and Demand Dynamics 36
Area<br />
Table 9: Apartment Occupancy Summary, 2004 2010<br />
<strong>New</strong> <strong>Orleans</strong> Metropolitan Area<br />
2004 Pre Katrina<br />
Occupancy Rates<br />
Post<br />
Katrina 2006 2007 2008 2009 2010<br />
<strong>New</strong> <strong>Orleans</strong><br />
A Uptown 98.0% 100.0% 100.0% 95.0% 87.5% 93.0% NA 92.8%<br />
B Mid‐City/Gentilly/Lakefront 91.0% 88.9% 99.0% 88.5% 94.8% 77.6% 90.6% 91.9%<br />
C Lake Forest 93.7% 95.5% 50.0% 63.3% 79.9% 72.2% 80.1% 82.0%<br />
D NO East 95.5% 95.8% NA NA NA NA NA 84.0%<br />
E Algiers 94.0% 90.7% 98.8% 100.0% 87.8% 94.5% 83.3% 76.7%<br />
M Warehouse District 96.5% 96.0% 89.7% 94.0% 71.8% 89.0% 92.7% 95.9%<br />
Parish Total<br />
94.8% 94.5% 87.5% 88.2% 84.4% 85.3% 86.7% 87.2%<br />
St. Tammany<br />
F East St. Tammany 92.7% 87.0% 97.3% 98.4% 88.7% 91.3% 87.9% 88.7%<br />
N West St. Tammany 98.5% 89.8% 100.0% 97.4% 93.9% 71.8% 88.6% 93.3%<br />
Parish Total<br />
95.6% 88.4% 98.7% 97.9% 91.3% 81.6% 88.3% 91.0%<br />
Jefferson<br />
G Kenner 94.0% 92.9% 98.8% 96.3% 93.8% 86.2% 81.9% 83.9%<br />
H West Metairie 94.7% 95.0% 99.9% 91.9% 94.6% 90.4% 87.9% 91.6%<br />
I East Metairie 97.7% 98.0% 100.0% 97.8% 92.9% 92.8% 91.5% 94.5%<br />
J River Ridge 90.7% 90.4% 100.0% 95.9% 91.5% 88.9% 85.4% 89.5%<br />
K Harvey Canal West 95.3% 96.0% 100.0% 85.0% 100.0% NA 91.0% NA<br />
L Harvey Canal East 95.8% 95.1% 98.6% 94.9% 88.6% 92.1% 91.1% 92.4%<br />
Parish Total<br />
94.7% 94.6% 99.6% 93.6% 93.6% 90.1% 88.1% 90.4%<br />
<strong>New</strong> <strong>Orleans</strong> Metro Total 94.9% 93.7% 94.8% 92.2% 89.7% 86.7% 87.7% 89.0%<br />
Excluding Rent Assisted/Federally Subsidized<br />
Rent Assisted/Federally Subsidized 96.6% 96.9% 98.5% 88.5% 95.9% 89.9% 95.9% 96.1%<br />
including Elderly<br />
<strong>New</strong> <strong>Orleans</strong> Metro Total 95.0% 93.9% 95.0% 91.9% 90.1% 86.9% 88.3% 89.5%<br />
Source: Survey of property owners and managers compiled by the UNO Institute for Economic Development & Real Estate Research<br />
Note: The adjacent map<br />
depicts the apartment<br />
areas used by UNO to<br />
disaggregate the regional<br />
rental market. Data have<br />
been reported for these<br />
geographies in this report<br />
to facilitate longitudinal<br />
comparisons with prior<br />
years’ data on occupancy<br />
and rent levels collected<br />
through UNO’s rental<br />
surveys.<br />
<strong>New</strong> <strong>Orleans</strong> <strong>Market</strong> <strong>Assessment</strong> – An Analysis of Supply and Demand Dynamics 37
Table 10: Apartment Occupancy Summary of Units Reporting Occupancy Each Survey Period,<br />
2004 2010<br />
<strong>New</strong> <strong>Orleans</strong> Metropolitan Area<br />
Area<br />
2004 Pre Katrina<br />
Number of Units Reporting Occupancy<br />
Post<br />
Katrina 2006 2007 2008 2009 2010<br />
<strong>New</strong> <strong>Orleans</strong><br />
A Uptown 172 172 172 172 172 172 135 495<br />
B Mid‐City/Gentilly/Lakefront 1,651 1,507 861 1,639 1,495 1,493 1,260 1,552<br />
C Lake Forest 6,006 6,006 6,006 6,022 5,493 4,803 3,344 3,793<br />
D NO East 940 940 940 940 944 1,060 738 206<br />
E Algiers 3,783 3,783 2,357 2,689 3,750 3,741 2,601 2,223<br />
M Warehouse District 1,084 1,084 1,100 881 1,114 1,114 849 1,510<br />
Parish Total<br />
13,636 13,492 11,436 12,343 12,968 12,383 8,927 9,779<br />
St. Tammany<br />
F East St. Tammany 825 825 1,377 1,447 1,423 1,560 1,623 1,290<br />
N West St. Tammany 668 668 689 858 837 1,125 1,222 1,445<br />
Parish Total<br />
1,493 1,493 2,066 2,305 2,260 2,685 2,845 2,735<br />
Jefferson<br />
G Kenner 3,321 3,321 996 3,728 4,098 4,181 4,086 4,096<br />
H West Metairie 8,277 8,277 6,900 8,156 7,936 7,929 7,257 7,641<br />
I East Metairie 1,878 1,878 1,280 1,946 1,629 1,895 1,688 1,705<br />
J River Ridge 2,836 2,836 2,703 3,140 3,625 3,655 3,547 3,594<br />
K Harvey Canal West 556 556 384 556 100 484 100 0<br />
L Harvey Canal East 5,023 5,023 2,586 5,196 5,236 5,115 3,895 4,621<br />
Parish Total<br />
21,891 21,891 14,849 22,722 22,624 23,259 20,573 21,657<br />
<strong>New</strong> <strong>Orleans</strong> Metro Total 37,020 36,876 28,351 37,370 37,852 38,327 32,345 34,171<br />
Excluding Rent Assisted/Federally Subsidized<br />
Rent Assisted/Federally Subsidized 2,322 2,322 982 1,812 1,762 1,902 1,282 2,855<br />
including Elderly<br />
<strong>New</strong> <strong>Orleans</strong> Metro Total 39,342 39,198 29,333 39,182 39,614 40,229 33,627 37,026<br />
Source: Survey of property owners and managers compiled by the UNO Institute for Economic Development & Real Estate Research<br />
<strong>New</strong> <strong>Orleans</strong> <strong>Market</strong> <strong>Assessment</strong> – An Analysis of Supply and Demand Dynamics 38
Occupancy Trends: Age and Size of Property<br />
Tables 11 and 12 summarize 2010 occupancy rates for apartments in the <strong>New</strong> <strong>Orleans</strong> region by<br />
property size and age. This sample only includes properties for which a size classification and age were<br />
provided by the owners or managers. It should also be noted that the chronological age reported may<br />
not fully reflect a property’s effective age in that many in the sample have been subject to significant<br />
renovations in the past 30 years, particularly following Hurricane Katrina. However, these tables reveal<br />
some useful observations regarding the region’s rental stock within larger apartment properties.<br />
Overall, average occupancy is highest among smaller (under 100 unit) properties (93.2%) and trends<br />
downward as complex sizes become larger falling to 91.8% for 100 to 299 unit communities and to<br />
86.3% in those with 300+ apartments. This pattern is consistent for properties in both <strong>Orleans</strong> and St.<br />
Tammany Parishes, but not in Jefferson. In <strong>Orleans</strong> Parish, average occupancy among the smallest<br />
development size category averaged 95.5% at year end 2010, while among those in the 100 to 299 unit<br />
and 300+ unit size categories reported occupancy levels averaging 92.4% and 85.0%, respectively. The<br />
latter category was significantly influenced by the 76.7% average occupancy reported in Algiers, all of<br />
which were properties with 300 or more units.<br />
In Jefferson Parish, the smaller properties reported an average occupancy rate of 91.1% in 2010, while<br />
those with 100 to 299 and 300+ units reported occupancy rates as a group of 92.1% and 87.6%,<br />
respectively. One of the lowest average occupancy rates for any size category of property was the 70.6%<br />
in the Kenner sector for apartment communities with 300 or more units. In some cases this included<br />
older low to moderate income properties developed during the 1970’s and 1980’s, some of which suffer<br />
from deferred maintenance and functional obsolescence.<br />
Based upon the historical apartment construction patterns previously discussed, it should not be<br />
surprising that a large portion of the reporting inventory of units (96 properties) were built prior to 1980<br />
and that the second largest group (49 properties) was built between 1980 and 1989. On average, this<br />
middle‐aged group of properties reported the highest average occupancy rate (92.8%) followed by the<br />
newest (1990 or later) segment at 90.4%. Not surprisingly, the lowest average occupancy (88.4%) was<br />
recorded for the oldest inventory in the apartment stock—those units built prior to 1980. Although<br />
these properties may tend to offer lower rents, they would typically have the most deferred<br />
maintenance and be in the most need of upgrade and modernization to bring them up to current<br />
competitive standards. The slightly lower average occupancy rates for the newest portion of the rental<br />
stock could very well be attributed to some resistance to the higher rents charged by such properties.<br />
The major exception to this pattern is <strong>Orleans</strong> Parish where the recent entry of new or reentry of<br />
renovated properties has been rather well received by the local market. This is particularly true based<br />
upon occupancy levels for a newly emerging group of rental communities generally referred to as mixed<br />
income properties.<br />
<strong>New</strong> <strong>Orleans</strong> <strong>Market</strong> <strong>Assessment</strong> – An Analysis of Supply and Demand Dynamics 39
Table 11: <strong>Market</strong> Rate Apartment Occupancy by Complex Size by Area, 2010<br />
<strong>New</strong> <strong>Orleans</strong> Metropolitan Area<br />
Property Size by Units<br />
Under 100 units 100 ‐ 299 units 300+ units<br />
Occupancy<br />
Properties<br />
Reporting<br />
Occupancy<br />
Properties<br />
Reporting<br />
Occupancy<br />
Properties<br />
Reporting<br />
<strong>New</strong> <strong>Orleans</strong><br />
A Uptown 97.0% 1 91.3% 3<br />
B Mid‐City 93.5% 2 89.3% 4 95.8% 2<br />
C Lake Forest 90.3% 3 75.8% 4<br />
D NO East 94.0% 1<br />
E Algiers 76.7% 3<br />
M Warehouse District 96.0% 3 97.0% 4 91.6% 1<br />
Parish Total 95.5% 6 92.4% 15 85.0% 10<br />
St. Tammany<br />
F East St. Tammany 86.0% 3 90.0% 6<br />
N West St. Tammany 100.0% 1 92.0% 5<br />
Parish Total 93.0% 4 91.0% 11<br />
Jefferson<br />
G Kenner 91.2% 5 90.0% 5 70.6% 5<br />
H West Metairie 90.5% 32 92.5% 27 93.4% 5<br />
I East Metairie 95.1% 12 92.3% 3 94.0% 1<br />
J River Ridge 82.9% 7 93.9% 11 89.0% 3<br />
K Harvey Canal West<br />
L Harvey Canal East 96.0% 3 92.0% 17 91.0% 3<br />
Parish Total 91.1% 59 92.1% 63 87.6% 17<br />
<strong>New</strong> <strong>Orleans</strong> Metro 93.2% 69 91.8% 89 86.3% 27<br />
Table 12: <strong>Market</strong> Rate Apartment Occupancy by Age by Parish, 2010<br />
<strong>New</strong> <strong>Orleans</strong> Metropolitan Area<br />
Property by Year Built<br />
Parish Pre‐1980 1980 ‐ 1989 1990 and later<br />
Properties<br />
Properties<br />
Properties<br />
Occupancy Reporting Occupancy Reporting Occupancy Reporting<br />
<strong>Orleans</strong> 85.5% 12 89.4% 7 92.6% 10<br />
Jefferson 90.0% 81 92.6% 40 89.7% 9<br />
St. Tammany 89.7% 3 96.5% 2 88.9% 8<br />
<strong>New</strong> <strong>Orleans</strong> Metro 88.4% 96 92.8% 49 90.4% 27<br />
Source: Survey of property owners and managers compiled by the UNO Institute for Economic Development & Real<br />
Estate Research<br />
<strong>New</strong> <strong>Orleans</strong> <strong>Market</strong> <strong>Assessment</strong> – An Analysis of Supply and Demand Dynamics 40
Occupancy Trends: Mixed Income Property<br />
The emergent segment of mixed income apartment communities is driven by financing structures<br />
(including LIHTC’s) which require the introduction of rent assisted units alongside those which rent at<br />
full market rates. This is the dominant HUD model for replacing dilapidated and failed “old model”<br />
public housing communities and a major component of inventory being added with a myriad of tax and<br />
other financing incentives. These properties, for the most part, are changing the landscape of rental<br />
housing across the U.S. and in the <strong>New</strong> <strong>Orleans</strong> region, particularly post‐Katrina.<br />
Tables 13 through 15 summarize occupancy rates for a sample of 2,374 mixed income units located in<br />
properties in <strong>Orleans</strong> Parish. The overall average occupancy for the properties as a whole is 93%, while<br />
the rates for the market and assisted units are 93.1% and 93.0%, respectively. In essence, the market at<br />
this point, makes no distinction between these two different unit classes embodied within the same<br />
properties. Although there are minor variations by sub‐market area, they do not appear to be divergent<br />
enough to imply that one product is necessarily more or less acceptable to consumers who qualify for<br />
either.<br />
Table 13: <strong>New</strong> <strong>Orleans</strong> Mixed Income Properties: Occupancy Summary – Total Units, 2010<br />
Area<br />
Occupancy Rate Total Units<br />
A Uptown 93.4% 655<br />
B Mid‐City/Gentilly/Lakefront 89.7% 1,014<br />
M Warehouse District 95.9% 705<br />
Parish Total<br />
93.0% 2,374<br />
Table 14: <strong>New</strong> <strong>Orleans</strong> Mixed Income Properties: Occupancy and Rent Summary – <strong>Market</strong><br />
Rate Units, 2010<br />
Area<br />
Occupancy Rate<br />
Average Rent<br />
Total <strong>Market</strong><br />
Rate Units<br />
A Uptown 90.3% $1,443 360<br />
B Mid‐City/Gentilly/Lakefront 92.0% $1,202 603<br />
M Warehouse District 97.0% $1,288 456<br />
Parish Total<br />
93.1% $1,350 1,419<br />
<strong>New</strong> <strong>Orleans</strong> <strong>Market</strong> <strong>Assessment</strong> – An Analysis of Supply and Demand Dynamics 41
Table 15: <strong>New</strong> <strong>Orleans</strong> Mixed Income Properties: Occupancy Summary – Rent Assisted Units,<br />
2010<br />
Area<br />
Occupancy Rate<br />
Total Units<br />
A Uptown 97.3% 295<br />
B Mid‐City/Gentilly/Lakefront 87.8% 411<br />
M Warehouse District 94.0% 249<br />
Parish Total<br />
93.0% 955<br />
Source: Survey of property owners and managers compiled by the UNO Institute for<br />
Economic Development & Real Estate Research<br />
Key Conclusions – Recent Apartment Occupancy Trends:<br />
<br />
<br />
<br />
<br />
<br />
<br />
<br />
Occupancy rates throughout the region hit a post‐Katrina peak of 95% immediately after Katrina,<br />
due to the constrained supply of rental housing and the tremendous number of displaced<br />
households and temporary workers.<br />
Occupancy rates declined from 2006 to 2008 with the addition of substantial apartment inventory,<br />
but they rose in 2009 and 2010. Occupancy rates are nearing a healthy market equilibrium of 93 ‐<br />
94%.<br />
Since 2005, occupancy rates have fluctuated greatly, particularly at the level of sub‐market areas<br />
(e.g. Kenner, <strong>New</strong> <strong>Orleans</strong> East, etc.).<br />
While the <strong>New</strong> <strong>Orleans</strong> market has posted strong gains in occupancy since 2007, there are areas of<br />
weaker demand, such as Lake Forest, <strong>New</strong> <strong>Orleans</strong> East, and Algiers.<br />
Data from the 2010 Census show continued population gains in <strong>Orleans</strong> Parish but a major<br />
discrepancy between the number of households and the number of housing units showing<br />
residential “activity.” This suggests that a number of houses are still being renovated, are vacant,<br />
or are occupied by temporary residents.<br />
Occupancy rates tend to be highest for the smallest properties (under 100 units) and for properties<br />
built between 1980 and 1989. The occupancy rate for this age cohort may be due to these<br />
apartments’ amenities and relative affordability.<br />
Occupancy rates have been strong for mixed income properties. Occupancy rates for market rate<br />
and income restricted units are nearly identical.<br />
<strong>New</strong> <strong>Orleans</strong> <strong>Market</strong> <strong>Assessment</strong> – An Analysis of Supply and Demand Dynamics 42
Apartment Rent Trends: 2004 – 2010<br />
In addition to occupancy and absorption rates, another critical measures of rental market demand is<br />
average rent. As with occupancy trends, the following analysis of rent trends addresses occupancy<br />
within the region, within its constituent parishes, and within individual sub‐sectors. This analysis also<br />
focuses on subsidized and mixed income properties. The sample of properties consists primarily of<br />
those containing twenty or more units with the largest portion of the properties surveyed having 100 or<br />
more units.<br />
Rent Trends: <strong>Market</strong> Rate Units<br />
In typically balanced housing markets rent levels gradually rise in response to steady or growing<br />
apartment demand driven by employment, household and income growth. This is certainly a pattern<br />
reflected in long term trends for the <strong>New</strong> <strong>Orleans</strong> region and not too dissimilar from comparable<br />
markets when size and demographic composition are taken into consideration. Nominal asking rents for<br />
units in larger properties in the <strong>New</strong> <strong>Orleans</strong> region have gradually risen on an annual average basis<br />
since the early 1970’s. These increases have, as would be expected, been interrupted or moderated by<br />
periods of excess supply as reflected by a slowing of demand and decrease in average occupancy.<br />
However, for the most part, these adjustment periods were relatively short‐lived and gradual rent gains<br />
resumed. This somewhat typical pattern was abruptly altered by the damage and destruction Katrina<br />
inflicted on the region’s housing stock, particularly its rental apartment inventory. (See Graph 2). It<br />
should be noted that asking rents do not necessarily equate to actual, contract or effective rents<br />
received by property owners since they do not usually take into consideration the number or dollar<br />
value of discounts, special offers or concessions that may have been made available.<br />
In the period immediately following the storm asking rents spiked by 36.5% rising from an average of<br />
$679 in 2004 to $927 in 2005 just after Katrina. As previously discussed, this immediate post storm<br />
period was characterized by an unprecedented rush to secure housing by those displaced or who moved<br />
into the region quickly to participate in the initial recovery and rebuilding efforts. This surge in demand<br />
absorbed just about all of the region’s available apartment inventory and pushed rents up at a record<br />
pace as for many price (rent) was no object. This spike moderated somewhat in 2006, but resumed in<br />
2007 and 2008 as asking rents rose to $993 and $1,030, respectively.<br />
Although extraordinary by historical standards, these rent increases have become layered into the rental<br />
housing structure of the local market and form the basis for the emergent complex funding strategies<br />
linked to financing the construction of new inventory. This in turn has given rise to development<br />
strategies using LIHTC’s and other sources of non‐conventional financing which by design mandate the<br />
inclusion of affordable units. These financing strategies, in turn, affect the level of market rate rents that<br />
must be achieved to produce an economically feasible product. Although this study has not specifically<br />
addressed this point, there is a fairly widespread belief that the values attached to vouchers based upon<br />
immediate post‐storm rent spikes continue to support relatively high asking rent levels across the<br />
market. The difficulty here is that when incentives and the massive volume of government funded<br />
rebuilding efforts play out, market fundamentals might not be strong enough to sustain these<br />
<strong>New</strong> <strong>Orleans</strong> <strong>Market</strong> <strong>Assessment</strong> – An Analysis of Supply and Demand Dynamics 43
historically high apartment rent levels. At a minimum, this could be damaging to property owners of<br />
both large and small properties, who face a much different and higher operating cost structure (i.e.<br />
insurance, taxes, utilities, etc.). These risks no doubt would be mitigated by a stronger pace of economic,<br />
job and income growth over the long term which would sustain demand and support rent payments that<br />
provide sufficient operating margins for property owners while reducing the rent‐to‐income payment<br />
burden on renter households. The recovery and rebuilding investments by the public sector are<br />
providing the resources upon which to build a sound economic development infrastructure. The<br />
challenge for local and state leaders is to effectively leverage these resources and not squander the<br />
opportunity to attract private capital in a sustained, long term manner. This would include the return of<br />
equity and debt from more traditional sources—those not requiring government intervention or<br />
incentives—in order to produce new rental housing. A return to a less dependent financing environment<br />
would produce a more balanced and typical market more directly influenced by the forces of supply and<br />
demand.<br />
Average asking rent in the region through year end 2009 dropped to $934 or by 9.3% when compared to<br />
yearend 2008. This is partly attributed to sampling anomalies caused by non‐cooperative property<br />
owners/managers and a roll‐back of asking rents in sectors of the market adjusting to the entry of new<br />
inventory, particularly in the Warehouse District in <strong>New</strong> <strong>Orleans</strong> and on the Northshore in St. Tammany<br />
Parish. In the Warehouse District sectors, averaging asking rent dropped from $1,763 to $1,465 (16.9%),<br />
while in St. Tammany Parish it dropped from $1,038 to $897 or by 13.6%. In Jefferson Parish, average<br />
reported rents edged down from $951 at year end 2008 to $929 at the end of 2008 or by 2.3%. The<br />
decline in rents in Jefferson Parish was most notable in the East Metairie (down 6.3%) and Harvey Canal<br />
East/Gretna (down 8.0%) sectors.<br />
Asking rents in the region rose to an average of $972 through the end of 2010 or by 4.1%. Rent gains<br />
were reported for properties in <strong>Orleans</strong> and St. Tammany Parishes while in Jefferson average rents<br />
continued in a slightly downward trend. The presence of new inventory in the mix of units offered is<br />
quite evident in the Uptown, Mid‐City and Warehouse District sectors of <strong>Orleans</strong> Parish and helped push<br />
the average asking rent to $1,126 at year end 2010 (up 7.5% over 2009). Similarly in St. Tammany Parish,<br />
the entry of new product, particularly in the western sector, pushed average asking rent to $953 by year<br />
end 2010, an increase of 6.2% over 2009.<br />
In Jefferson Parish, the movement to higher average occupancy levels was generally facilitated by more<br />
aggressive and competitive pricing. Overall, parish‐wide average asking rent edged down from $929 to<br />
$914 or by 1.6% with properties in all sub‐sectors reporting either reductions or remaining mostly<br />
unchanged since yearend 2009.<br />
<strong>New</strong> <strong>Orleans</strong> <strong>Market</strong> <strong>Assessment</strong> – An Analysis of Supply and Demand Dynamics 44
Table 16: Apartment Rent Summary, 2004 2010<br />
<strong>New</strong> <strong>Orleans</strong> Metropolitan Area<br />
Area<br />
2004 Pre Katrina<br />
Average Rental Rates<br />
Post<br />
Katrina 2006 2007 2008 2009 2010<br />
<strong>New</strong> <strong>Orleans</strong><br />
A Uptown $756 $791 $834 $895 $927 $914 $1,078 $1,325<br />
B Mid‐City/Gentilly/Lakefront $888 $959 $1,584 $1,407 $1,404 $1,402 $1,100 $1,117<br />
C Lake Forest $565 $584 $768 $793 $826 $813 $793 $751<br />
D NO East $559 $575 NA NA NA NA NA $712<br />
E Algiers $635 $660 $735 $698 $808 $802 $789 $786<br />
M Warehouse District $1,362 $1,337 $1,243 $1,402 $1,660 $1,763 $1,465 $1,749<br />
Parish Total<br />
$767 $791 $1,055 $1,000 $1,150 $1,166 $1,047 $1,126<br />
St. Tammany<br />
F East St. Tammany $700 $887 $944 $982 $982 $969 $915 $895<br />
N West St. Tammany $725 $763 $1,025 $964 $1,094 $1,094 $891 $980<br />
Parish Total<br />
$709 $803 $981 $966 $969 $1,038 $897 $953<br />
Jefferson<br />
G Kenner $635 $688 $923 $827 $819 $826 $830 $811<br />
H West Metairie $702 $661 $759 $834 $929 $918 $928 $913<br />
I East Metairie $664 $699 $738 $867 $877 $922 $864 $853<br />
J River Ridge $626 $690 $790 $857 $864 $844 $849 $794<br />
K Harvey Canal West $539 $527 $459 $725 $900 NA $900 NA<br />
L Harvey Canal East $595 $627 $803 $816 $840 $904 $832 $831<br />
Parish Total<br />
$658 $735 $784 $850 $931 $951 $929 $914<br />
<strong>New</strong> <strong>Orleans</strong> Metro Total $679 $747 $927 $904 $993 $1,030 $934 $972<br />
Source: Survey of property owners and managers compiled by the UNO Institute for Economic Development & Real Estate Research<br />
Graph 2: <strong>New</strong> <strong>Orleans</strong> Metro Rent Trends, 2004 2010<br />
$1,200<br />
$1,150<br />
$1,100<br />
$1,050<br />
$1,000<br />
$950<br />
$900<br />
$850<br />
$800<br />
$750<br />
$700<br />
Metro<br />
<strong>Orleans</strong><br />
Jefferson<br />
St. Tammany<br />
$650<br />
$600<br />
$550<br />
$500<br />
2004 Pre Katrina Post<br />
Katrina<br />
2006 2007 2008 2009 2010<br />
Source: Survey of property owners and managers compiled by the UNO Institute for Economic Development & Real Estate<br />
Research<br />
<strong>New</strong> <strong>Orleans</strong> <strong>Market</strong> <strong>Assessment</strong> – An Analysis of Supply and Demand Dynamics 45
Table 17: Apartment Rent Summary of Units Reporting Occupancy Each Survey Period,<br />
2004 2010<br />
<strong>New</strong> <strong>Orleans</strong> Metropolitan Area<br />
Number of Units Reporting Rent<br />
Post<br />
Area<br />
2004 Pre Katrina Katrina 2006 2007 2008 2009 2010<br />
<strong>New</strong> <strong>Orleans</strong><br />
A Uptown 172 172 172 172 172 172 135 497<br />
B Mid‐City/Gentilly/Lakefront 1,651 1,507 711 1,161 1,161 1,342 1,286 1,553<br />
C Lake Forest 6,006 6,006 302 1,221 2,457 3,733 3,780 3,799<br />
D NO East 940 940 0 0 0 0 0 206<br />
E Algiers 3,783 3,783 2,073 1,645 2,670 2,437 2,659 2,222<br />
M Warehouse District 1,084 1,084 411 1,114 1,114 1,114 1,135 1,517<br />
Parish Total<br />
13,636 13,492 3,669 5,313 7,574 8,798 8,995 9,794<br />
St. Tammany<br />
F East St. Tammany 825 1,415 1,287 1,371 1,324 1,523 1,623 1,291<br />
N West St. Tammany 668 1,126 638 638 869 1,125 1,222 1,450<br />
Parish Total<br />
1,493 2,541 1,925 2,009 2,193 2,648 2,845 2,741<br />
Jefferson<br />
G Kenner 3,321 3,837 2,854 3,728 4,148 4,095 4,097 4,117<br />
H West Metairie 8,277 8,406 6,831 7,173 7,585 7,435 7,335 7,747<br />
I East Metairie 1,878 1,975 1,140 1,812 1,629 1,802 1,695 1,739<br />
J River Ridge 2,836 3,655 3,522 3,607 3,625 3,655 3,547 3,595<br />
K Harvey Canal West 556 556 384 100 100 0 100 0<br />
L Harvey Canal East 5,023 4,995 2,365 4,243 4,227 3,388 4,652 4,941<br />
Parish Total<br />
21,891 23,424 17,096 20,663 21,314 20,375 21,426 22,139<br />
<strong>New</strong> <strong>Orleans</strong> Metro Total 37,020 39,457 22,690 27,985 31,081 31,821 33,266 34,674<br />
Source: Survey of property owners and managers compiled by the UNO Institute for Economic Development & Real Estate Research<br />
Graph 3: Apartment Occupancy and Rent Trends, 1973 2010<br />
<strong>New</strong> <strong>Orleans</strong> Metropolitan Area<br />
$1,100<br />
$1,000<br />
$900<br />
$800<br />
$700<br />
$600<br />
$500<br />
$400<br />
$300<br />
$200<br />
$100<br />
$0<br />
100.0%<br />
95.0%<br />
90.0%<br />
85.0%<br />
80.0%<br />
75.0%<br />
70.0%<br />
65.0%<br />
60.0%<br />
55.0%<br />
50.0%<br />
1973<br />
1974<br />
1975<br />
1976<br />
1977<br />
1978<br />
1979<br />
1980<br />
1981<br />
1982<br />
1893<br />
1984<br />
1985<br />
1986<br />
1987<br />
1988<br />
1989<br />
1990<br />
1991<br />
1992<br />
1993<br />
1994<br />
1995<br />
1996<br />
1997<br />
1998<br />
1999<br />
2000<br />
2001<br />
2002<br />
2003<br />
2004<br />
2005<br />
2006<br />
2007<br />
2008<br />
2009<br />
2010<br />
Rent<br />
Occupancy<br />
Source: Survey of property owners and managers compiled by the UNO Institute for Economic Development & Real Estate Research<br />
<strong>New</strong> <strong>Orleans</strong> <strong>Market</strong> <strong>Assessment</strong> – An Analysis of Supply and Demand Dynamics 46
Rent Trends: Mixed Income Property<br />
The entry of mixed income housing communities is not only changing the product profile of the local<br />
apartment market, but is also having a notable influence on the rent profile of the market rate<br />
inventory. Table 18 summarizes the year end 2010 asking rents for the 1,422 market rate units located<br />
in mixed income developments in <strong>Orleans</strong> Parish. These units are within properties located in the<br />
Uptown, Mid‐City/Gentilly and Warehouse District sectors of the market and represent a cross section<br />
of different product types that have entered the market over the past several years.<br />
Overall, mixed income property rents averaged $1.14 per square foot (PSF) or $1,350 at the end of 2010.<br />
On a rent per square foot basis, this is about 16% higher than the average rent productivity reported for<br />
all market rate rental properties included in the sample located in <strong>Orleans</strong> Parish. Using rent PSF helps<br />
to normalize the comparison with other units in the market and in effect provides a control for<br />
variations in unit size. The higher PSF rents are usually associated with variations in property age and<br />
thus costs associated with newer construction as well as for differences in factors such as location,<br />
services offered and amenity packages. This relationship appears to hold true for efficiency and one<br />
bedroom units and to a slightly lesser degree (10% to 13% higher) for three bedroom apartments. Two<br />
bedroom models offer the widest premium over parish‐wide asking rents per square foot at 24% to<br />
27%.<br />
Whether these spreads in asking rents remain steady or begin to narrow will be driven by unfolding<br />
market dynamics. <strong>New</strong>ly built market‐rate units are typically in the upper tier of asking rents due to cost<br />
and financing considerations. Over time the gaps between newly built and existing inventory are likely<br />
to narrow as older and obsolete properties are upgraded to more closely mirror current market<br />
standards. This is a process that typically evolves over a number of years and through several market<br />
cycles. Properties that are not sufficiently brought to market standards will eventually drop out of the<br />
market rate inventory and eventually out of the rental stock entirely. These units leave the market to<br />
accommodate replacement inventory or for the adaptation of sites to higher and better uses.<br />
<strong>New</strong> <strong>Orleans</strong> <strong>Market</strong> <strong>Assessment</strong> – An Analysis of Supply and Demand Dynamics 47
Table 18: <strong>New</strong> <strong>Orleans</strong> Mixed Income Properties <strong>Market</strong> Rate Rent Summary, 2010<br />
Number of Units Average Size Average Rent Avg Pr Sq/Ft<br />
Area Reporting Rent (Square Feet) (Dollars) (Cents)<br />
<strong>New</strong> <strong>Orleans</strong> Total 1,422 1,183 $1,350 $1.14<br />
Efficiencies Flat 7 528 $969 $1.84<br />
1 BR Flat 671 717 $974 $1.36<br />
1BR<br />
Townhouse<br />
2 BR/1.X BA Flat 52 1,086 $1,445 $1.33<br />
2 BR/1.X BA Townhouse 10 1,900 $2,090 $1.10<br />
2 BR/2.x BA Flat 360 1,147 $1,386 $1.21<br />
2 BR/2.x BA Townhouse 211 1,118 $1,087 $0.97<br />
3 BR Flat 44 1,322 $1,396 $1.06<br />
3 BR Townhouse 54 1,315 $1,302 $0.99<br />
4 BR Flat 13 1,512 $1,500 $0.99<br />
4 BR Townhouse<br />
A ‐ Uptown 362 1,276 $1,443 $1.13<br />
Efficiencies Flat<br />
1 BR Flat 147 693 $998 $1.44<br />
1BR<br />
Townhouse<br />
2 BR/1.X BA Flat 14 1,400 $1,650 $1.18<br />
2 BR/1.X BA Townhouse 10 1,900 $2,090 $1.10<br />
2 BR/2.x BA Flat<br />
2 BR/2.x BA Townhouse 177 1,081 $1,173 $1.09<br />
3 BR Flat<br />
3 BR Townhouse 14 1,307 $1,304 $1.00<br />
4 BR Flat<br />
4 BR Townhouse<br />
B ‐ Mid‐City/Gentilly/Lakefront 603 1,126 $1,202 $1.07<br />
Efficiencies Flat<br />
1 BR Flat 226 766 $889 $1.16<br />
1BR<br />
Townhouse<br />
2 BR/1.X BA Flat 20 1,025 $1,291 $1.26<br />
2 BR/1.X BA Townhouse<br />
2 BR/2.x BA Flat 262 1,141 $1,265 $1.11<br />
2 BR/2.x BA Townhouse 34 1,154 $1,000 $0.87<br />
3 BR Flat 21 1,349 $1,467 $1.09<br />
3 BR Townhouse 40 1,322 $1,300 $0.98<br />
4 BR Flat<br />
4 BR Townhouse<br />
M ‐ Warehouse District/CBD 457 1,002 $1,288 $1.29<br />
Efficiencies Flat 7 528 $969 $1.84<br />
1 BR Flat 298 692 $1,034 $1.49<br />
1BR<br />
Townhouse<br />
2 BR/1.X BA Flat 18 834 $1,395 $1.67<br />
2 BR/1.X BA Townhouse<br />
2 BR/2.x BA Flat 98 1,152 $1,507 $1.31<br />
2 BR/2.x BA Townhouse<br />
3 BR Flat 23 1,294 $1,325 $1.02<br />
3 BR Townhouse<br />
4 BR Flat 13 1,512 $1,500 $0.99<br />
4 BR Townhouse<br />
Source: Survey of property owners and managers and Internet research compiled by the<br />
UNO Institute for Economic Development & Real Estate Research<br />
<strong>New</strong> <strong>Orleans</strong> <strong>Market</strong> <strong>Assessment</strong> – An Analysis of Supply and Demand Dynamics 48
Rent Trends: Subsidized Housing<br />
The multi‐family construction boom that began in 2006 and is now starting to wane is predominantly<br />
attributed to apartment developments funded through the Low Income Housing Tax Credit (LIHTC)<br />
Program and Road Home’s Small Rental and Piggyback programs. All three programs provided some<br />
form of equity or tax incentive to a project in exchange for lower rents. As a result, rents are not a direct<br />
reflection of demand, as with non‐subsidized units, but are largely predetermined by the federal<br />
program financing the development. The maximum rent for a unit funded with tax credits is 60% of Area<br />
Median Income (AMI), roughly equivalent to $650 for a one‐bedroom apartment. A third to 50% of all<br />
LHFA‐funded units targeted this income group. A large share of LHFA projects also received Community<br />
Development Block Grant (CDBG) dollars through the Piggyback Program in exchange for a more diverse<br />
mix of incomes amongst tenants. This includes much deeper affordability thresholds (less than 30% AMI)<br />
and non‐subsidized units. The majority of deeply affordable units are funded with Section 8 vouchers or<br />
serve as public housing units, and therefore are open to a range of incomes. For the purposes of this<br />
study, they are categorized within the less than 30% AMI range, which is the predominant income group<br />
among voucher holders and public housing residents.<br />
The non‐subsidized units are priced according to a) the market of their particular area and b) the<br />
demand for non‐subsidized housing within a subsidized development. As an example, we can compare<br />
the mixed income redevelopment of the St. Bernard public housing complex (Columbia Parc) with Nine<br />
27, a mixed income mid‐rise building located downtown. A one‐bedroom apartment at Columbia Parc<br />
rents for $750 per month, significantly less than the $1100 for a one‐bedroom at Nine 27. This reflects<br />
the pricing of different markets (Mid City/Gentilly versus CBD) and the structure of the particular<br />
development. Columbia Parc targets a range of income groups (20% of AMI and up) whereas Nine 27<br />
targets households earning 50% of AMI and above.<br />
Table 19: 2010 Rent Limits Income Categories (inclusive of utilities)<br />
30% AMI 50% AMI 60% AMI 80% AMI<br />
1 BR $367 $612 $735 $858<br />
2 BR $413 $688 $826 $980<br />
3 BR $459 $765 $918 $1,102<br />
4 BR $495 $826 $991 $1,224<br />
Source: Novogradac and Company<br />
Table 20: MultiFamily Development Units Renting or Under Construction, by Income Range<br />
and Unit Type, <strong>New</strong> <strong>Orleans</strong><br />
80% AMI Total<br />
1 BR 1,125 365 1,120 52 589 3,251<br />
2 BR 530 238 1,160 136 653 2,717<br />
3 BR 464 194 718 9 323 1,708<br />
4 BR 135 50 124 14 50 373<br />
Total 2,254 847 3,122 211 1,615 8,049<br />
Source: GCR and Associates’ analysis of LHFA Pipeline Report, September 2010 and GCR analysis of Rental Income<br />
worksheets within individual LIHTC applications. Data excludes 191 units not defined by income or bedroom size.<br />
<strong>New</strong> <strong>Orleans</strong> <strong>Market</strong> <strong>Assessment</strong> – An Analysis of Supply and Demand Dynamics 49
Table 21: MultiFamily Units Renting or Under Construction, by Income Range and Unit Type,<br />
<strong>New</strong> <strong>Orleans</strong> Metro Area<br />
80% AMI Total<br />
1 BR 1,147 411 1,242 66 753 3,619<br />
2 BR 538 345 1,698 145 957 3,683<br />
3 BR 470 273 1,043 9 428 2,223<br />
4 BR 149 100 243 18 131 641<br />
Total 2,304 1,129 4,226 238 2,269 10,166<br />
Source: GCR and Associates’ analysis of LHFA Pipeline Report, September 2010 and GCR analysis of Rental Income<br />
worksheets within individual LIHTC applications. Data excludes 322 units not defined by income or bedroom size.<br />
Key Conclusions – Recent Rent Trends:<br />
<br />
<br />
<br />
<br />
In general, rents have risen gradually in the <strong>New</strong> <strong>Orleans</strong> region since the mid‐1970’s. However,<br />
immediately prior to Katrina, rents began to rise at a steeper rate, and there was a substantial<br />
post‐Katrina increase in rents.<br />
<strong>Market</strong> rate rents peaked in 2008 with an average asking rent of over $1,000. Rents have subsided<br />
somewhat over the past two years, but they remain well above pre‐Katrina levels. This pattern is<br />
generally true for the three parishes that have the largest number of rental units in the region:<br />
<strong>Orleans</strong>, Jefferson, and St. Tammany.<br />
<strong>Market</strong> rate units within mixed income developments are renting at a 16% premium above market<br />
rate units generally. This premium may be associated with a newer vintage of construction,<br />
building/apartment amenities, and location advantages.<br />
Through the Low Income Housing Tax Credit program, the CDBG “Piggyback” program, and the<br />
redevelopment of public housing, a tremendous inventory of subsidized units has reached the<br />
market in recent years. These units vary substantially by income mix and by the pricing of market<br />
rate units within mixed income developments.<br />
<strong>New</strong> <strong>Orleans</strong> <strong>Market</strong> <strong>Assessment</strong> – An Analysis of Supply and Demand Dynamics 50
Profile of Subsidized Rental Housing<br />
The definition of “affordable housing” varies, making it difficult to discuss in general terms among local<br />
housing advocates, stakeholders and legislators. In many circles, it is synonymous with “subsidized<br />
housing”, or housing that is built using some form of public subsidy in exchange for a set number of<br />
units reserved for low income households. For the purpose of this study, “affordable housing” is defined<br />
as housing affordable to low income households, regardless of subsidy, while “subsidized housing” will<br />
strictly refer to government‐subsidized housing. “Affordable” is defined as housing costs which are less<br />
than 30% of gross household income. Affordable housing, in some contexts may also refer to workforce<br />
housing or units that are within the financial reach of various job sectors of a local market, particularly<br />
those essential to the provision of community services (i.e. teachers, police, firemen, etc.) or to filling<br />
positions that are crucial to core sectors such as tourism/hospitality (i.e. services, retail, entertainment,<br />
etc). In this context, the linkages of affordable housing and economic development are somewhat<br />
obvious and strategically important to a community.<br />
There are three forms of subsidized housing in the U.S. – tenant‐based, project‐based and governmentowned.<br />
“Tenant‐based” subsidies, or Section 8 vouchers, are grants administered by HUD to local<br />
housing authorities to subsidize rents for low income households. These subsidies are attached to a<br />
household, not a unit, and are therefore flexible to move from place to place. “Project‐based” refers to<br />
subsidies offered for new construction or substantial rehabilitation, where the developer/property<br />
owner reserves a set number of units for low income households in exchange for equity investment. The<br />
equity can come directly from the government, as with Community Development Block Grant (CDBG)<br />
funds, or through an investor, who provides capital to a project in exchange for tax incentives. The latter<br />
refers to the Low Income Housing Tax Credit (LIHTC) Program, the largest facilitative incentive for<br />
affordable housing in the country. It is administered through the U.S. Treasury, which offers tax credits<br />
to State housing finance agencies, who then award these credits to projects on a competitive basis. The<br />
developers are able to sell these credits to investors in exchange for equity. Finally, government‐owned<br />
housing is synonymous with public housing, in which HUD, through a local housing authority, builds,<br />
owns and manages housing for low income households. HUD’s current strategy to provide such<br />
affordable housing is to do so within the context of mixed income communities where residents occupy<br />
either market rate or rent assisted units depending on their respective income qualifications. Another<br />
key element of this development strategy is to reduce housing densities in an effort to further mitigate<br />
concentrations of low income households and to create a more attractive living environment in which all<br />
residents can take pride and ownership. These communities are also developed with a set of selfcontained<br />
amenities and services some of which are focused on integrating the developments more<br />
closely to the fabric of the neighborhood in which they are located.<br />
The incomes of households that use these programs vary greatly. For LIHTC developments, the<br />
affordability threshold is usually set at 60% of Area Median Income (AMI), while the majority of the<br />
households who reside in public housing or who receive a voucher earn less than 30% AMI. Following is<br />
a summary of typical income categories, the earnings and rents associated with each category, and the<br />
subsidized housing programs that serve these various income groups.<br />
<strong>New</strong> <strong>Orleans</strong> <strong>Market</strong> <strong>Assessment</strong> – An Analysis of Supply and Demand Dynamics 51
Table 22: Descriptive Profile of Rental Assistance Programs<br />
Extremely Low Very Low Income LIHTC limit Low Median<br />
Income<br />
Income Income<br />
30% AMI 50% AMI 60% AMI 80% AMI 100% AMI<br />
1 person – Income $12,870 $21,450 $25,740 $34,320 $42,900<br />
1 person (Studio) –<br />
$321 $536 $643 $858 $1,072<br />
Max Affordable Rent<br />
Family of 4 ‐ Income $18,360 $30,600 $33,060 $48,960 $61,200<br />
Family of 4 (3 BR)–<br />
Max Affordable Rent<br />
$459 $765 $918 $1,224 $1,530<br />
After Hurricane Katrina, the federal government provided substantial resources to the Gulf Coast to<br />
rebuild housing by means of CDBG funds and a boost in tax credits for parishes and counties that<br />
suffered hurricane damage. In total, <strong>Louisiana</strong> has invested approximately $12 billion in housing<br />
recovery and development, with roughly 75% of this concentrated within the <strong>New</strong> <strong>Orleans</strong> region, with<br />
the bulk of these funds dedicated to the Road Home Homeowner Program. Due to the density of the city<br />
and the preexisting count of rental units, the majority of these funds were targeted within <strong>New</strong> <strong>Orleans</strong><br />
proper. In all, 8,240 rental units have been developed or are under construction in the city using some<br />
form of subsidy. The extent of strictly market rate rental development has been minimal since 2005,<br />
consisting of approximately 700 units within the Central Business District (CBD). Given the flood of nonconventional<br />
financing that washed into the City and surrounding region to facilitate the rebuilding<br />
process, the retreat to the sidelines for conventional lenders and investors should come as no surprise.<br />
As these programs run their course, a return of conventional financing sources and FHA‐insured<br />
mortgages is likely and is already evident in suburban sectors of the market such as St. Tammany Parish.<br />
There will always be a place for the creative layered financing which has driven much of the new<br />
inventory expansion over the past four years. However, markets tend to return to levels of natural<br />
balance, and <strong>New</strong> <strong>Orleans</strong> is not likely to be any different going forward. The extraordinary<br />
circumstances which created the need for these financing structures, however, will probably contribute<br />
to a slightly longer path of return to this new balance. Continued turmoil in global and national financial<br />
markets may also extend the time it takes to attract private capital as a primary vehicle for financing<br />
rental housing communities.<br />
In light of a recent study published by the Bureau of Governmental Research (BGR) titled, “The House<br />
that Uncle Sam Built,” which documents with some concern a significant increase in subsidized housing<br />
post‐Katrina, it is relevant to examine whether <strong>New</strong> <strong>Orleans</strong> is saturated with subsidized housing. 5 This<br />
requires a more complete understanding of the income restrictions that are required for subsidy.<br />
Because of the aforementioned distinction between “affordable” and “subsidized,” it is possible for<br />
subsidized units to rent for more than market rate units. HUD and the LIHTC restrictions set rent limits<br />
at roughly $600 to $800 for a one‐bedroom unit, which represents the 50% to 60% AMI range. Based on<br />
the income distribution of renters, half of all renter households earn less than 50% AMI and would have<br />
5 Bureau of Governmental Research, “The House That Uncle Sam Built: The Continued Expansion of Subsidized<br />
Housing in <strong>New</strong> <strong>Orleans</strong>,” May 2009.<br />
<strong>New</strong> <strong>Orleans</strong> <strong>Market</strong> <strong>Assessment</strong> – An Analysis of Supply and Demand Dynamics 52
difficulty affording a unit with this level of subsidy. To target a greater share of the market, the recovery<br />
programs provided additional subsidy in exchange for even lower rents. Both the Road Home Piggyback<br />
Program and the Small Rental Program include housing for households earning less than 50% AMI.<br />
Table 23: Income Distribution by Tenure in <strong>New</strong> <strong>Orleans</strong><br />
80% AMI<br />
AMI<br />
AMI<br />
Owners 10.0% 9.6% 15.7% 64.7%<br />
Renters 29.6% 20.6% 17.7% 32.1%<br />
All Households 19.8% 15.1% 16.7% 48.4%<br />
Percentage of Owners that are low<br />
35.3%<br />
income<br />
Percentage of Renters that are low<br />
67.9%<br />
income<br />
Source: GCR & Associates, Inc. analysis of HUD CHAS 2009 data<br />
Before Katrina, there was an abundance of market rate (i.e. non‐subsidized) housing that was affordable<br />
to households earning less than 50% AMI. In 2004, 28% of rental units cost less than $500 per month;<br />
today only 12% charge less than $500 per month, despite the overall increase in subsidized housing. The<br />
greatest decrease in rental supply is within housing priced between $500 and $800 per month, generally<br />
the price point targeted by subsidized housing. Almost half of all units were priced in this range pre‐<br />
Katrina compared to one in six today, with the bulk of these units shifting into a higher rent category. It<br />
is presumed that these price changes reflect the recent rise in operating expenses (insurance, utilities,<br />
etc.) and the improvements made post‐storm. The issue today is that the majority of renters cannot<br />
afford these units, which is why the lack of affordable housing remains a problem despite subsidized<br />
building programs. <strong>Market</strong> rate rental housing was affordable to most renters before Hurricane Katrina<br />
without subsidy and now is not. In reality, the majority of subsidized units are unaffordable for a third of<br />
the rental market.<br />
<strong>New</strong> <strong>Orleans</strong> <strong>Market</strong> <strong>Assessment</strong> – An Analysis of Supply and Demand Dynamics 53
Graph 4: Cost of Renting, 2004 vs. 2009<br />
25.0%<br />
20.0%<br />
15.0%<br />
10.0%<br />
5.0%<br />
0.0%<br />
2004 2009<br />
Source: U.S. Census American Housing Survey, 2004 and 2009<br />
With newly built subsidized housing priced comparably to what was available pre‐storm (without<br />
subsidy), there is little evidence to support the claim that government‐sponsored building activity has<br />
created a glut of low priced rental housing. In fact, the subsidized rebuilding programs have contributed<br />
to a large segment of the region’s workforce housing (housing priced between $500 and $800 per<br />
month) that would not be available otherwise. The real topic of concern is the mismatch between what<br />
renters earn and the oversupply of rental units priced above $800 per month. Current estimates<br />
provided by HUD find that 70% of renters earning less than 50% AMI are paying an excessive amount on<br />
housing relative to their incomes. 6<br />
Low Income Housing Tax Credit (LIHTC) Properties<br />
The primary vehicle for recent multi‐family construction has been through the LIHTC Program, including<br />
the annual allocation of tax credits and the boost in tax credits that came with the Gulf Opportunity<br />
Zone (GO ZONE) Program. Additionally, HOME funds, bonds, and 4% tax credits played a significant part<br />
in funding multi‐family construction. Since 2006, the <strong>Louisiana</strong> Housing Finance Agency has funded<br />
approximately 140 projects in the <strong>New</strong> <strong>Orleans</strong> metro area, with 104 of those projects centered in <strong>New</strong><br />
6 HUD Comprehensive Housing Affordability Strategy (CHAS), 2009. Data aggregated by GCR & Associates, Inc.<br />
CHAS data based on American Community Survey data for 2005 to 2007.<br />
<strong>New</strong> <strong>Orleans</strong> <strong>Market</strong> <strong>Assessment</strong> – An Analysis of Supply and Demand Dynamics 54
<strong>Orleans</strong>, totaling 9,452 units. Of those 9,000+ units, 2,644 units are a component of public housing<br />
redevelopment sponsored by the Housing Authority of <strong>New</strong> <strong>Orleans</strong> (HANO) including the<br />
redevelopment of the “Big Four” into mixed income communities. The remaining 6,800 units represent a<br />
diverse mix of rental housing options catering to a mix of household types and incomes. Table 24<br />
summarizes the LIHTC award pipeline by parish in the region.<br />
Table 24: Subsidized MultiFamily Development Units PostKatrina<br />
LIHTC/Piggyback/LHFA Housing Pipeline by Parish<br />
Renting Under Construction Planned Total<br />
<strong>Orleans</strong> 5,755 2,485 1,492 9,732<br />
Jefferson 1,209 33 151 1,393<br />
Plaquemines 0 32 44 76<br />
St. Bernard 0 0 288 288<br />
St. Charles 0 21 0 21<br />
St. John the Baptist 0 0 0 0<br />
St. Tammany 786 144 218 1,148<br />
Total 7,750 2,715 2,193 12,658<br />
Source: GCR and Associates’ analysis of LHFA Pipeline Report, September 2010<br />
Planning districts with the highest concentrations of LIHTC funded properties include Mid‐City (2,842<br />
units), the Garden District/Central City (1,785 units), <strong>New</strong> <strong>Orleans</strong> East (1,044 units) and Algiers (1,044<br />
units). Overall, these four areas of the City account for just over 71% of all LIHTC projects approved for<br />
funding by the LHFA and that are at one stage of development or another. In Algiers, all of the units<br />
approved and in the pipeline are targeted to low income households, while <strong>New</strong> <strong>Orleans</strong> East and Mid‐<br />
City units targeted to low income residents account for 81% and 71% of the inventory pipeline,<br />
respectively. City‐wide 78% or 7,373 of the units scheduled for entry into the market are targeted to low<br />
income residents 7 .<br />
Table 25: LIHTC/Piggyback/LHFA <strong>New</strong> <strong>Orleans</strong> Pipeline by Planning District<br />
Planning Districts 1 2 3 4 5 6 7 8 9 10 11 12 13 Total<br />
<strong>Market</strong> Rate 212 665 88 815 88 0 12 199 0 0 2,079<br />
Placed in Service 201 316 79 469 0 0 0 126 0 0 1,191<br />
Under Construction 11 262 0 201 88 0 0 73 0 0 635<br />
Financing Closed or Not<br />
Closed/not broken ground 0 87 9 145 0 0 12 0 0 0 253<br />
Low Income 498 1,120 276 2,027 375 473 113 845 602 1,044 7,373<br />
Placed in Service 278 850 218 763 313 314 89 796 206 774 4,601<br />
Under Construction 184 178 0 375 62 159 0 49 396 160 1,563<br />
Financing Closed or Not<br />
Closed/not broken ground 36 92 58 889 0 0 24 0 0 110 1,209<br />
Total Units 710 1,785 364 2,842 463 473 125 1,044 602 1,044 9,452<br />
Placed in Service 479 1,166 297 1,232 313 314 89 922 206 774 5,792<br />
Under Construction 195 440 0 576 150 159 0 122 396 160 2,198<br />
Financing Closed or Not<br />
Closed/not broken ground 36 179 67 1,034 0 0 36 0 0 110 1,462<br />
Note: Does not include 280 scattered site units within multiple planning districts.<br />
Source: GCR and Associates’ analysis of LHFA Pipeline Report, September 2010, and individual LIHTC applications.<br />
7 This figure refers to the total percentage of rent‐restricted unites within LIHTC properties.<br />
<strong>New</strong> <strong>Orleans</strong> <strong>Market</strong> <strong>Assessment</strong> – An Analysis of Supply and Demand Dynamics 55
One quarter of these pipeline projects are mixed finance developments, where a combination of CDBG<br />
funds, tax credits and private equity are packaged together to finance multi‐family housing with a<br />
variety of unit types and rents. These include the following developments:<br />
Table 26: Mixed Finance Developments (nonPublic Housing)<br />
Development Name Status <strong>Market</strong> Rate<br />
Units<br />
Very Low<br />
Income<br />
Units<br />
Low Income<br />
Units<br />
Total<br />
Units<br />
Blue Plate Lofts not closed 22 15 35 72 4<br />
GCHP‐MLK not closed 21 15 34 70 2<br />
Douglas & Andry not closed 6 3 9 18 8<br />
Eleven 37 under const. 28 10 11 49 4<br />
St. Joe Lofts under const. 11 10 40 61 1A<br />
The Muses II under const. 41 11 0 52 2<br />
Crescent Garden Homes under const. 86 57 0 143 2<br />
The Muses under const. 135 76 0 211 2<br />
Planning<br />
District<br />
Chateau Carre under const. 88 31 31 150 6<br />
Georgetown Manor under const. 73 23 26 122 9<br />
Palmetto Apt Homes PIS 74 25 25 124 3<br />
Constance Lofts PIS 27 10 13 50 1A<br />
Nine 27 PIS 60 16 0 76 1A<br />
200 Carondelet PIS 114 38 38 190 1A<br />
Falstaff Apartments PIS 72 2 73 147 4<br />
The Preserve PIS 109 37 37 183 4<br />
The Crescent Club PIS 136 50 42 228 4<br />
The Marquis Apartments PIS 150 50 50 250 4<br />
Walnut Square Apartments PIS 125 42 42 209 9<br />
Total 1,378 521 506 2,405<br />
Source: GCR and Associates’ analysis of <strong>Louisiana</strong> Housing Finance Agency Pipeline Report, September 2010<br />
Additionally, the Housing Authority of <strong>New</strong> <strong>Orleans</strong> (HANO) has incorporated mixed‐finance<br />
developments into their revitalization plans for public housing. This includes the demolition and<br />
redevelopment of the “Big Four” initiated in 2007 – St. Bernard, C.J. Peete, B.W. Cooper and Lafitte – as<br />
well as the St. Thomas redevelopment that began in the 1990s and continues today. Overall, there are<br />
1,801 units in these redeveloped public housing communities with a total of 675 market rate units or<br />
about 37.5% of this new inventory. The balance is made up of units targeted to very low income<br />
households (29%) and low income households (33.6%).<br />
<strong>New</strong> <strong>Orleans</strong> <strong>Market</strong> <strong>Assessment</strong> – An Analysis of Supply and Demand Dynamics 56
Table 27: Mixed Income Public Housing Redevelopment<br />
Development Name Status <strong>Market</strong> Rate<br />
Units<br />
Very Low<br />
Income Units<br />
Low Income<br />
Units<br />
Total<br />
Units<br />
Lafitte Blocks 1‐3 Under const. 0 74 60 134 4<br />
BW Cooper II closed 123 136 151 410 4<br />
St. Bernard II under const. 17 16 16 49 4<br />
St. Bernard I under const. 156 150 160 466 4<br />
CJ Peete I PIS 130 157 173 460 2<br />
Rivergarden CS II PIS 186 62 62 310 2<br />
Total 675 521 605 1,801<br />
Source: GCR and Associates’ analysis of LHFA Pipeline Report, September 2010 and individual LIHTC applications<br />
Planning<br />
District<br />
With the exception of Walnut Square, all of the mixed finance developments in <strong>New</strong> <strong>Orleans</strong> are<br />
concentrated in the East Bank of <strong>New</strong> <strong>Orleans</strong> west of the Inner Harbor Navigational Canal (IHNC) which<br />
separates the Lower 9 th Ward and <strong>New</strong> <strong>Orleans</strong> East. (See map in Appendix). In order to attract market<br />
rate renters, the developers constructed the units and provided amenities in a way that is similar to nonsubsidized<br />
apartments, offering superior interior features and public amenities than those available in<br />
100% affordable developments. This includes higher end finishes like solid countertops, maple cabinets,<br />
in‐unit washers and dryers and storage space, as well as public amenities like swimming pools,<br />
clubhouses and secured entry.<br />
The vast majority of mixed finance projects (not including public housing initiatives) have already<br />
opened or are currently under construction. This includes all but 49 of the market rate units.<br />
<strong>Market</strong> Rate units ‐ renting 867<br />
<strong>Market</strong> Rate units ‐ under construction 462<br />
<strong>Market</strong> Rate units ‐ pending 49<br />
According to a recent survey conducted by GCR and the University of <strong>New</strong> <strong>Orleans</strong>, all of the mixed<br />
finance developments have occupancy rates at or above 90%. According to recent survey data collected<br />
by the <strong>Louisiana</strong> Office of Community Development, the overall occupancy rate for market rate units is<br />
89% while the overall occupancy rate for affordable units is 96%, making the overall occupancy rate<br />
92%. This is in line with UNO’s survey information, which finds an occupancy rate of 93% for the area’s<br />
mixed income developments.<br />
<strong>New</strong> <strong>Orleans</strong> <strong>Market</strong> <strong>Assessment</strong> – An Analysis of Supply and Demand Dynamics 57
Table 28: Mixed Finance Developments Placed in Service<br />
Development Name Occupancy Rate (December 2010)<br />
The Muses 91%<br />
Palmetto Apartment Homes 90%<br />
Constance Lofts 92%<br />
Nine 27 100%<br />
200 Carondelet 93%<br />
Falstaff Apartments 95%<br />
The Preserve 94%<br />
The Crescent Club 98%<br />
The Marquis Apartments 100%<br />
Walnut Square Apt 98%<br />
Source: <strong>Louisiana</strong> Office of Community Development, December 2010, and phone surveys conducted by GCR & Associates, Inc.<br />
and the University of <strong>New</strong> <strong>Orleans</strong> Institute for Economic Development and Research in December, 2010<br />
Public Housing Communities<br />
The redevelopment of public housing into mixed income communities is an initiative promoted by HUD<br />
since the mid‐1990s. Initially part of the HOPE VI Program, this type of redevelopment is now supported<br />
by a variety of funding sources, including LIHTC, historic tax credits, CDBG funds and Project‐based<br />
Section 8 vouchers. To date, HANO has redeveloped three public housing complexes into mixed income<br />
communities, including St. Thomas (now River Garden), St. Bernard (now Columbia Parc) and C.J. Peete<br />
aka Magnolia (now Harmony Oaks) with construction underway at Lafitte and B.W. Cooper. According to<br />
current occupancy data reported by property managers, these developments are quite successful, with<br />
occupancy rates at River Garden at approximately 92% and tenant commitments for the remaining<br />
properties exceeding available units. More significantly, the market rate and LIHTC units are leasing up<br />
quickly, indicating the high quality of the redevelopment and continued demand for workforce rental<br />
housing in centrally located areas. 8 In total, HANO currently operates roughly 2,000 public housing units<br />
in <strong>New</strong> <strong>Orleans</strong>. 9 The remaining units (consisting of LIHTC and market rate units) are managed by third<br />
party management firms.<br />
Table 29: Public Housing Status Report – <strong>New</strong> Developments<br />
Total Under Construction or<br />
Already Built<br />
Pending PIS Extension<br />
and Financing<br />
Tenant‐based Section 8 Vouchers<br />
The most significant contributor to affordable housing supply in <strong>New</strong> <strong>Orleans</strong> is the Tenant‐based<br />
Section 8 Housing Program. Prior to the storm, the city had close to 9,000 Section 8 voucher holders and<br />
roughly 5,000 occupied public housing units. Today, the city has more than 15,000 Section 8 voucher<br />
holders and 2,000± occupied public housing units, marking an overall increase of 3,500± subsidized<br />
households under the Housing Authority of <strong>New</strong> <strong>Orleans</strong>. 10 In total, HANO serves 17,636 households, a<br />
very large portion of the renters in the city and a greater percentage of renters than was served prestorm.<br />
The Section 8 Program works in a very unique and flexible way, differing from the typical understanding<br />
of subsidized housing. Households, usually earning less than 30% AMI, are provided with a voucher that<br />
covers the difference between what they can afford to pay and what is available on the open market.<br />
HUD has established that 30% of a household’s income goes towards rent and utilities, and the<br />
remaining balance is paid by HUD directly to the landlord via the local housing authority. Because any<br />
landlord can rent or choose not to rent to a Section 8 voucher holder, there is no direct corollary<br />
between a voucher and a “fixed” or “hard” affordable unit, which is guaranteed to rent only to low<br />
income households for a set number of years. Under this system, the overall number of units rented to<br />
voucher holders can decrease. This can occur when a landlord chooses to no longer lease to a voucher<br />
holder, when a voucher holder leaves the city, taking his or her voucher with them, or when the funds<br />
committed to the program cover fewer units. As a result of this flexibility, we do not define vouchers as<br />
affordable units per se but still incorporate them into the overall schema of subsidized housing.<br />
As part of this study, the 15,000+ voucher locations were geocoded and mapped relative to their<br />
neighborhoods and in relation to the city’s large‐scale multi‐family properties. This was accomplished by<br />
overlaying the geo‐referenced voucher data onto the parcel footprints of the larger complexes. The<br />
analysis is somewhat limited because it does not include any of the vouchers administered by housing<br />
authorities within Jefferson Parish, thereby excluding the larger complexes in Metairie and Kenner.<br />
Additionally, due to the confidentiality requirements for the Tenant‐based Voucher Program, this report<br />
does not identify which multi‐family complexes host large concentrations of vouchers. But the data does<br />
reveal an extremely salient point – the vast majority (+14,000) tenant‐based vouchers are being utilized<br />
in smaller structures, which include small complexes, doubles and triples, and single family homes. We<br />
also see a significant concentration of vouchers within the <strong>New</strong> <strong>Orleans</strong> East, Mid‐City and Algiers<br />
planning districts. From this analysis, we were able to determine the following:<br />
<br />
<br />
<br />
<br />
A large number of small‐scale rental units have returned to the market post‐Katrina without<br />
using recovery subsidies;<br />
These small‐scale rental units are in competition with larger complexes;<br />
The majority of newer multi‐family complexes are maintaining healthy occupancy rates without<br />
tenant‐based voucher assistance; and<br />
The preferred housing type in <strong>New</strong> <strong>Orleans</strong> may be for smaller scale rental units.<br />
10 Housing Authority of <strong>New</strong> <strong>Orleans</strong>, summary data by project, effective November 2010.<br />
<strong>New</strong> <strong>Orleans</strong> <strong>Market</strong> <strong>Assessment</strong> – An Analysis of Supply and Demand Dynamics 59
Another useful indicator is the usage rate for Section 8 vouchers. What often occurs in tight markets is<br />
that households with vouchers cannot find landlords willing to participate in the program. There are<br />
some areas of the country where one in four or one in three households with vouchers cannot use<br />
them. This is not the case in <strong>New</strong> <strong>Orleans</strong>, with an overall usage rate above 90%. This is one indicator<br />
that the city has a weak market for rental housing. 11<br />
Planning District<br />
Table 30: Tenantbased Vouchers by Planning District, 2010<br />
Count<br />
Not Defined 341<br />
1 ‐ French Quarter/CBD 23<br />
2 ‐ Garden District/Central City 1,434<br />
3 ‐ Uptown 1,341<br />
4 ‐ Mid City 2,866<br />
5 ‐ Lakeview 91<br />
6 ‐ Gentilly 1,702<br />
7 ‐ Bywater 1,348<br />
8 ‐ Lower 9th Ward 298<br />
9 ‐ <strong>New</strong> <strong>Orleans</strong> East 3,923<br />
10 ‐ Village De L'Est 183<br />
11 ‐ Viavant/Venetian Isles n/a<br />
12 ‐ Algiers 2,128<br />
13 ‐ English Turn n/a<br />
Grand Total 15,680<br />
Source: Housing Authority of <strong>New</strong> <strong>Orleans</strong>, December 2010; Analysis provided by GCR & Associates, Inc.<br />
11 HUD uses voucher utilization rates as one measure for determining the adequacy of affordable housing supply.<br />
<strong>New</strong> <strong>Orleans</strong> <strong>Market</strong> <strong>Assessment</strong> – An Analysis of Supply and Demand Dynamics 60
Key Conclusions – Profile of Subsidized Housing:<br />
<br />
<br />
<br />
<br />
<br />
<br />
<br />
<br />
Approximately 75% of the $12 billion dedicated for post‐hurricane housing recovery has been<br />
expended in the <strong>New</strong> <strong>Orleans</strong> area. The majority of these funds have been spent in <strong>Orleans</strong> Parish.<br />
Most of the large scale multifamily housing activity since Katrina has been underwritten through<br />
government subsidies and incentives.<br />
While concerns have been raised about an oversaturation of subsidized housing in <strong>Orleans</strong> Parish,<br />
higher post‐hurricane rents have rendered market rate housing unaffordable. Many new<br />
subsidized units are comparable in pricing to the market rate units that were available prior to<br />
Katrina.<br />
There appears to be a dearth of affordable housing for very low income individuals, as over two<br />
thirds of renters earning less than 50% AMI are paying an excessive amount of their incomes on<br />
housing.<br />
The Low Income Housing Tax Credit (LIHTC) program has been the primary vehicle for the<br />
construction of affordable housing post‐Katrina.<br />
The mixed income redevelopment of HANO’s major public housing developments has proven<br />
successful in attracting both market rate and income restricted tenants. The on‐going<br />
redevelopment of St. Bernard, Lafitte, C.J. Peete, and B.W. Cooper will add substantial inventory to<br />
the deeply affordable housing market.<br />
The Section 8 program occupies an enhanced role in the provision of affordable housing in <strong>New</strong><br />
<strong>Orleans</strong>. The city has approximately 66% more Section 8 vouchers in use than it did before<br />
Katrina.<br />
An analysis of the location of voucher users suggests that many storm‐damaged rental units were<br />
restored without a recovery subsidy; new multi‐family complexes enjoy strong occupancy rates<br />
without the use of vouchers; the preferred housing type among voucher recipients appears to be<br />
small scale units.<br />
<strong>New</strong> <strong>Orleans</strong> <strong>Market</strong> <strong>Assessment</strong> – An Analysis of Supply and Demand Dynamics 61
Profile of the Rental Housing Stock and Storm Damage<br />
Unlike many areas of the country, the majority of the rental housing stock in <strong>New</strong> <strong>Orleans</strong> was<br />
integrated within its neighborhoods, along with single family homes, shotgun doubles, triplexes,<br />
fourplexes and a variety of buildings containing fewer than ten living units. This is not uncommon for an<br />
older city such as <strong>New</strong> <strong>Orleans</strong> and was the favored form of rental housing, with 66% of all renters living<br />
in structures that had four units or fewer in 2000. There was also a significant number of households<br />
living within larger structures, or structures that had fifty or more units. In 2000, almost 12,000<br />
households lived within large complexes, equivalent to 12% of all renters. Almost half (44%) of these<br />
renters were living in public housing complexes, and the remainder were largely concentrated within<br />
the multi‐family complexes in <strong>New</strong> <strong>Orleans</strong> East and Algiers. In 1970, over three‐fourths of renter<br />
households in <strong>New</strong> <strong>Orleans</strong> lived in buildings of four or fewer units, while those occupying larger (50+<br />
unit) buildings accounted for 4.8% of all renter households in the City. This significant shift towards<br />
larger complexes can be attributed to the surges of new multi‐family inventory additions during the<br />
1970’s and 1980’s which produced the majority of the larger (100+ unit) properties located in the City<br />
and the region as a whole. According to the 2009 American Housing Survey of <strong>New</strong> <strong>Orleans</strong>, the<br />
distribution of renter households across properties of different sizes once again mirrors the 1970 profile,<br />
with 79% of renter households occupying buildings with four or fewer living units. This is a direct<br />
reflection of the damage to the rental housing stock inflicted by Katrina, particularly the loss of units in<br />
larger (50+ unit) properties where now about 6% of renter households reside.<br />
Of particular note, the share of renter households occupying single family homes is substantially higher<br />
today than in 2000, and in fact exceeds 2000 levels. This illustrates the transition of many owneroccupied<br />
homes to rental units, an issue that is further elaborated upon within the Small Scale Rental<br />
Properties section of this report beginning on page 66.<br />
Table 31: Units per Structure – Occupied Rental Units<br />
Source: U.S. Census 2000 and 2009 Census American Housing Survey for <strong>New</strong> <strong>Orleans</strong><br />
2000 2009 Estimate Change 2000 ‐ 2009<br />
Count Percent Count Percent Count Percent<br />
Single Family 14,551 14% 14,800 25% 249 11%<br />
Townhome 18,514 18% 11,300 19% (7,214) 1%<br />
2 ‐ 4 units 34,509 34% 20,800 35% (13,709) 1%<br />
5 ‐ 9 units 8,993 9% 3,200 5% (5,793) ‐4%<br />
10 ‐ 19 units 7,352 7% 3,100 5% (4,252) ‐2%<br />
20 ‐ 49 units 4,862 5% 2,500 4% (2,362) ‐1%<br />
50+ units 11,701 12% 3,400 6% (8,301) ‐6%<br />
Other 234 0% 0 0% (234) n/a<br />
Total 100,716 100% 59,100 100% (41,616) n/a<br />
<strong>New</strong> <strong>Orleans</strong> <strong>Market</strong> <strong>Assessment</strong> – An Analysis of Supply and Demand Dynamics 62
Storm Damage Summary and Rebuilding Profile<br />
Hurricane Katrina severely damaged or destroyed 37% of the city’s rental stock. This included the large<br />
complexes in <strong>New</strong> <strong>Orleans</strong> East, the majority of the public housing stock and the small, “mom and pop”<br />
rentals located within the denser neighborhoods. In Mid City alone, more than 10,000 rental units were<br />
removed from the market. This included the damage incurred at the St. Bernard, B.W. Cooper, and<br />
Lafitte public housing complexes as well as the many doubles and three‐unit buildings concentrated in<br />
Mid‐City neighborhoods like Bayou St. John. The loss of 7,700 rental units in <strong>New</strong> <strong>Orleans</strong> East<br />
represented, for the most part, a handful of large complexes constructed in the mid‐1970’s and 1980’s.<br />
Many of these developments consisted of more than 250 units in a garden‐apartment layout. More than<br />
2,500 of these units were owned and/or funded by HUD programs (i.e. Section 221(d)3, 221(d)4, 202<br />
and 236), with only a fraction (1/3) currently planned for redevelopment. 12 The severity of damage to<br />
the rental housing stock as a result of Hurricane Katrina varied across the City in relation to the extent,<br />
depth and duration of flooding incurred. Damage was particularly intense in the Lower 9 th Ward where<br />
the equivalent of 76.8% of the rental stock counted in the 2000 Census was severely damaged or<br />
destroyed. Very close behind were the Lakeview area (69.2%), <strong>New</strong> <strong>Orleans</strong> East (65.1%) and Gentilly<br />
(59.2%). Areas such as Uptown and the Garden District had comparatively moderate damage (24.1% and<br />
11.8%, respectively). In terms of the number of units damaged or destroyed, the Mid‐City and <strong>New</strong><br />
<strong>Orleans</strong> East areas had the largest net loss of rental housing inventory at 10,768 and 7,701 units,<br />
respectively. Although the damage inflicted by Katrina’s flooding affected a broad cross section of the<br />
population, some of the greatest damage occurred in neighborhoods that were already economically<br />
fragile and least able to begin rebuilding without significant commitments of capital. This tended to<br />
come in the form of a package of incentive financing programs packaged within the GO Zone legislation.<br />
12 HUD summary of pre‐Katrina housing profile in <strong>New</strong> <strong>Orleans</strong> East and status summary effective November,<br />
2008.<br />
<strong>New</strong> <strong>Orleans</strong> <strong>Market</strong> <strong>Assessment</strong> – An Analysis of Supply and Demand Dynamics 63
Table 32: Katrina’s Damage to Rental Stock by Planning District<br />
Severely Damaged/Destroyed<br />
Rental Units<br />
All Rental Units<br />
(2000 Census)<br />
Percent of Rental Units<br />
Severely Damaged or Destroyed<br />
Uptown 3,450 14,300 24.1%<br />
Garden District 1,680 14,288 11.8%<br />
French Quarter/CBD 32 1,944 1.6%<br />
Mid‐City 10,768 22,061 48.8%<br />
Bywater 3,499 8,596 40.7%<br />
Gentilly 2,765 4,669 59.2%<br />
Lower 9th Ward 2,084 2,715 76.8%<br />
Lakeview 1,282 1,852 69.2%<br />
<strong>New</strong> <strong>Orleans</strong> East 7,701 11,837 65.1%<br />
Village de L'Est 970 1,713 56.6%<br />
Venetian Isles 42 430 9.8%<br />
Algiers 224 8,680 2.6%<br />
<strong>New</strong> Aurora/English Turn 26 300 8.7%<br />
Total 34,523 93,385 37.0%<br />
Source: HUD Damage Estimates for Hurricanes Katrina, Rita and Wilma, February 2006.<br />
The recovery programs that were developed to rebuild lost rental stock fall under two categories: new<br />
construction or extensive rehabilitation for large‐scale multi‐family development; and grant assistance<br />
to existing, small‐scale landlords. The Gulf Opportunity (GO) Zone legislation incentivized private<br />
developers to acquire land and build multi‐family developments in storm‐damaged areas while the State<br />
used CDBG funds to finance the Road Home Program, which provided gap funds to GO Zone projects<br />
(Piggyback Program) or provided grant assistance to small landlords to rebuild the smaller, 2 to 4 unit<br />
per structure, rental stock (Small Rental Program).<br />
To date, the bulk of the rebuilding funds for rental housing have gone to the larger developments, most<br />
notably the Low Income Housing Tax Credit (LIHTC) Program. This program has awarded tax credits to<br />
12,681 units in the <strong>New</strong> <strong>Orleans</strong> MSA; of which 9,732 are concentrated in <strong>New</strong> <strong>Orleans</strong> and 85% are<br />
currently in operation or under construction. 13 Compared to the LIHTC Program, the Road Home Small<br />
Rental Program has a much smaller share of the rebuilding effort, providing commitment letters to<br />
landlords for 8,524 units, with 3,162 currently being rented. 14 But this is not to say that small‐scale<br />
rentals have not returned to the market; on the contrary, while little subsidy has been channeled to the<br />
rebuilding of two to four unit complexes, there is still an active market within this group, with<br />
construction costs funded through insurance proceeds, equity and private mortgage financing. This<br />
conclusion was reached through an analysis of Tenant‐based Section 8 vouchers, <strong>New</strong> <strong>Orleans</strong><br />
Assessor’s Data and the 2009 U.S. Census American Housing Survey for the <strong>New</strong> <strong>Orleans</strong> housing<br />
market. The methodology for determining this non‐subsidized rebuilding activity is further discussed<br />
within the Small‐scale Rental section of this report (page 66). Historically, small rental properties have<br />
13 LHFA Pipeline Report, September 2010.<br />
14 Source: LA OCD Road Home Small Rental microdata; analysis provided by GCR & Associates, Inc.<br />
<strong>New</strong> <strong>Orleans</strong> <strong>Market</strong> <strong>Assessment</strong> – An Analysis of Supply and Demand Dynamics 64
een the predominant component of the rental stock in <strong>New</strong> <strong>Orleans</strong>, contributing to the supply of<br />
affordable units while offering a greater flexibility and less stringent regulatory environment than larger<br />
complexes. These properties are so prevalent as to be an integral part of the neighborhood fabric, and<br />
their return to commerce or decay will presumably determine the future health of many neighborhoods.<br />
The integration of varied housing styles and tenure types is very much what gives the City its unique<br />
character and quality of life. As important as this segment of the housing market is, however, it is also<br />
the most challenging to monitor and assess.<br />
The data are limited for small rentals in many respects due to the fact that there is no comprehensive<br />
program for tracking rental housing information and no central repository of information pertaining to<br />
rental housing. In lieu of complete information, this study combines a variety of data sources into a<br />
geospatial context. The sources of information include primary data collection of occupancy and rent<br />
data, Assessor’s records, GCR’s Activity Index 15 , and information from the various government entities.<br />
The end result is a sample of more than 20,000 parcels that represent some form of rental activity for<br />
smaller properties. Although not as desirable as a census of the entire stock, this is enough of a sample<br />
to infer some broader trends regarding the recovery of properties in this portion of the City’s rental<br />
housing inventory. The results of this analysis are presented within the following section.<br />
Key Conclusions – Profile of the Rental Housing Stock and Storm Damage:<br />
<br />
<br />
<br />
<br />
<br />
<br />
<br />
<br />
<br />
Before Katrina, the rental market in <strong>New</strong> <strong>Orleans</strong> was dominated by smaller apartment buildings<br />
with 66% of renters residing in 1 – 4 unit structures in the year 2000.<br />
That percentage has increased since Katrina as 79% of all renters now reside in 1 – 4 unit buildings.<br />
This is a reflection of the significant damage to larger apartment buildings.<br />
Based on this data, new multi‐family development is not the primary contributor to an increased<br />
rental vacancy rate.<br />
<strong>New</strong> <strong>Orleans</strong> also now has a substantially higher percentage of rental units in single family<br />
structures—perhaps a reflection of a sluggish for‐sale housing market.<br />
Katrina destroyed or severely damaged over 37% of the city’s rental stock, though the degree of<br />
damage varied significantly by sub‐area.<br />
The recovery of the small rental stock has been abetted by the State’s Small Rental Program, but<br />
many owners of small scale rental properties have rebuilt through other means.<br />
The increase in Section 8 vouchers is also a likely contributor to the recovery of small rentals.<br />
<strong>Market</strong> rate units within mixed income developments are renting at a 16% premium above market<br />
rate units generally. This premium may be associated with a newer vintage of construction,<br />
building/apartment amenities, and location advantages.<br />
Through the Low Income Housing Tax Credit program, the CDBG “Piggyback” program, and the<br />
redevelopment of public housing, a tremendous inventory of subsidized units has reached the<br />
market in recent years. These units vary substantially by income mix and by the pricing of market<br />
rate units within mixed income developments.<br />
15 The GCR Activity Index is a measure developed to indicate whether a particular address or parcel shows any sign<br />
of activity. It includes utility information, postal service delivery data, garbage collection, voter registration and<br />
ongoing spot surveys. The Index is tracked on a monthly basis for all addresses and parcels within <strong>New</strong> <strong>Orleans</strong>, St.<br />
Bernard Parish, Jefferson Parish and a portion of St. Tammany Parish.<br />
<strong>New</strong> <strong>Orleans</strong> <strong>Market</strong> <strong>Assessment</strong> – An Analysis of Supply and Demand Dynamics 65
Small‐Scale Rental Properties<br />
The small‐scale rental market was the backbone of <strong>New</strong> <strong>Orleans</strong>’ rental stock pre‐storm, with two out of<br />
three renters living in a structure with four units or fewer. The majority of these units were rendered<br />
uninhabitable by Katrina, and the rate of their recovery has not been as readily tracked as the larger<br />
developments or the rebuilding of owner‐occupied homes. This can be attributed to the structure of<br />
rental recovery programs, which by their nature favored larger developments, and the limited resources<br />
allocated to smaller structures.<br />
The assistance programs for rental housing, namely the GO Zone tax credit program and the Road Home<br />
Small Rental Program, did not provide federal recovery funds to the majority of pre‐Katrina rental units.<br />
The process for receiving rebuilding funds was not “as of right,” but a competitive process with multiple<br />
funding rounds, often times requiring complex applications and lengthy review processes. Also, due to<br />
the complexity of financing structures, many landlords and developers could not secure the financing<br />
necessary to break ground. For the larger developments, GO Zone developers were required to find<br />
LIHTC investors to fund their projects, a difficult task after the collapse of the credit markets. Although<br />
this did not inhibit developers from applying to the program, the difficulties associated with the lack of<br />
capital caused some projects to withdraw. In the case of the Small Rental Program, small‐scale landlords<br />
were required to access interim construction loans and did not receive grant proceeds until the unit was<br />
rented. The program has since been revised to include interim construction financing but this previous<br />
requirement of a construction loan is considered the primary reason for the program’s ineffectiveness<br />
during the first two years of operation. Many “mom and pop” landlords were not financially qualified to<br />
readily access construction loans. As a result, approximately 6,000 rental units within the two to four<br />
unit structures are participating in the Small Rental Program, a small fraction of <strong>New</strong> <strong>Orleans</strong>’ rental<br />
stock. Probably the most significant reason for this limited participation is the rent restriction in<br />
exchange for subsidy. Under program guidelines, property owners are under a covenant that caps rents<br />
to a specific income level; if the landlord does not follow the restrictions, he or she is required to pay<br />
back the “soft second” mortgage that would have otherwise been forgiven after a ten year period. With<br />
increasing ancillary costs (insurance, utilities) and higher risks associated with owning property in <strong>New</strong><br />
<strong>Orleans</strong>, the limited potential cash flow embedded within the Small Rental Program likely deterred<br />
many participants.<br />
As a result, only a fraction of the rental market participated in a recovery program, rendering the data<br />
provided by third party sources incomplete. The only information readily tracked is the subsidized<br />
developments (LIHTC, CDBG and Small Rental) and the large‐scale multi‐family complexes that have<br />
been a part of UNO’s rental surveys pre‐ and post‐Katrina. The status of the other 30,000+ small rental<br />
units that did not receive public assistance is still largely unknown in any complete sense.<br />
To supplement the information readily available, this study performed a field, phone and internet survey<br />
of the small‐scale rental market, resulting in a sample of 1,800 small‐scale rentals throughout the city.<br />
This included listings provided by Latter and Blum, Prudential, craigslist.org, Gambit Weekly, Times<br />
<strong>New</strong> <strong>Orleans</strong> <strong>Market</strong> <strong>Assessment</strong> – An Analysis of Supply and Demand Dynamics 66
Picayune, and field surveys within each planning district over a two week period. The information is<br />
accurate and up to date as of late September through early October, 2010.<br />
Table 33: Summary of Rents for Small Rentals, Field, Phone and Internet Survey<br />
Studio 1 BR 2 BR 3 BR 4 BR 5 BR Sample Size<br />
1 $750 $1,458 $2,210 n/a n/a n/a 50<br />
2 $714 $818 $1,005 $1,843 $1,238 n/a 218<br />
3 $492 $775 $985 $1,119 $1,918 $1,250 244<br />
4 $750 $805 $878 $1,059 $1,235 $1,512 283<br />
5 n/a $845 $1,021 $1,530 $1,663 n/a 42<br />
6 $450 $734 $850 $1,226 $1,464 $1,350 102<br />
7 $592 $661 $829 $1,063 $1,224 $1,350 178<br />
8 n/a $503 $796 $1,082 $1,072 n/a 39<br />
9 $600 $701 $893 $1,190 $1,370 $1,425 185<br />
10 n/a $400 $725 $1,168 $1,300 $1,600 15<br />
11 n/a n/a n/a $1,100 n/a n/a 1<br />
12 n/a $768 $988 $1,188 $1,473 $1,836 116<br />
13 $515 $850 $965 $1,350 n/a n/a 5<br />
Source: GCR & Associates, Inc. based on field, phone and internet surveys, effective September and October, 2010.<br />
Survey data were further augmented with approximately 14,000 vouchers currently being used within<br />
smaller structures. Finally, the overall assessment of the rental market incorporated active residential<br />
properties that did not have a homestead exemption in either 2005 or 2010. This microdata was<br />
provided by the <strong>Louisiana</strong> Tax Commission and tied at the address level to GCR’s Activity Index, the LHFA<br />
and OCD data, Section 8 vouchers, and all survey data.<br />
We have concrete evidence that State, voucher and survey addresses represent rental properties, but<br />
the Assessor’s data rely on several key assumptions to make that determination. The analysis is<br />
conservative in approach and likely excludes many properties that are currently serving as rental units.<br />
First, it assumes that if a property is a) classified as residential; b) was active in 2005 and 2010; and c)<br />
had no homestead exemption in 2005 or 2010, then it is a rental property. This methodology assumes<br />
that all homeowners who qualify for a homestead exemption are receiving one, and likewise all<br />
landlords who do not qualify are not receiving one. Traditionally, one could easily assume that active<br />
residential properties without homestead exemptions captured the bulk of rental property in the city.<br />
This is not the case post‐Katrina, as thousands of active homes without a homestead exemption may be<br />
in the process of renovation or may be vacant and for sale. In neither condition would the structure be a<br />
rental property. Any properties that converted to rental units since 2005 are excluded from this pool<br />
unless there is a voucher associated with it. Finally, it should be mentioned that the assumed rental<br />
market relies on data provided by the <strong>New</strong> <strong>Orleans</strong> Assessor’s office and GCR’s Activity Index, both<br />
susceptible to error from third party sources.<br />
The following map (Map 1) represents the variety of rental units captured in this analysis, including<br />
large‐scale multi‐family units, small rentals that were surveyed or participated in some form of subsidy,<br />
<strong>New</strong> <strong>Orleans</strong> <strong>Market</strong> <strong>Assessment</strong> – An Analysis of Supply and Demand Dynamics 67
and active properties without a homestead exemption in both 2005 and 2010. The analysis was<br />
provided at the parcel‐level to illustrate the size of many multi‐family developments and avoid doublecounting<br />
of multiple units within the same structure. From this geo‐spatial analysis, we see a<br />
widespread rental market, with substantial activity taking place in Mid City, the Bywater, Gentilly and<br />
specific areas of Uptown.<br />
Map 1: Landscape of Rental Units in <strong>New</strong> <strong>Orleans</strong> by Planning District<br />
<strong>New</strong> <strong>Orleans</strong> <strong>Market</strong> <strong>Assessment</strong> – An Analysis of Supply and Demand Dynamics 68
Table 34: ParcelLevel Analysis of the Rental <strong>Market</strong>, December 2010<br />
Residential Activity – <strong>New</strong> <strong>Orleans</strong><br />
Planning District Total Residential<br />
Parcels<br />
Total Active Residential<br />
Parcels<br />
Parcels identified as Rental<br />
Residential<br />
PD 1 964 930 601<br />
PD 2 7,686 6,517 3,476<br />
PD 3 17,077 15,072 5,408<br />
PD 4 11,616 8,762 5,857<br />
PD 5 8,744 6,413 1,778<br />
PD 6 13,718 9,439 3,293<br />
PD 7 8,990 6,160 4,213<br />
PD 8 4,635 1,571 2,095<br />
PD 9 18,095 13,686 4,500<br />
PD 10 2,097 1,750 409<br />
PD 11 322 257 35<br />
PD 12 12,509 11,654 2,675<br />
PD 13 337 330 36<br />
Citywide 106,790 82,541 34,376<br />
Source: GCR & Associates, Inc. using data provided by the <strong>Louisiana</strong> Housing Finance Agency, <strong>Louisiana</strong> Office of Community<br />
Development/Disaster Recovery Unit, University of <strong>New</strong> <strong>Orleans</strong> Institute for Economic Development and Research, Housing<br />
Authority of <strong>New</strong> <strong>Orleans</strong>, <strong>Louisiana</strong> Tax Commission, GCR Activity Index and primary data collection.<br />
One component of the rental market missing from this analysis, at least from a geo‐spatial perspective,<br />
is the inventory of rental properties that came from the for‐sale market. As stated earlier in the report, a<br />
large number of single family properties that were once owner‐occupied have entered the rental market<br />
due to the recent financial downturn and the possible oversupply of for‐sale properties. The most recent<br />
American Housing Survey data illustrate this point; there are more single‐family properties for rent<br />
today than in 2000 despite the loss of population post‐Katrina.<br />
40,000<br />
35,000<br />
30,000<br />
25,000<br />
20,000<br />
15,000<br />
10,000<br />
5,000<br />
0<br />
Graph 5: Occupied Rental Units by Structure Type<br />
2000<br />
2009 estimate<br />
Source: U.S. Census and Census American Housing Survey, 2009<br />
<strong>New</strong> <strong>Orleans</strong> <strong>Market</strong> <strong>Assessment</strong> – An Analysis of Supply and Demand Dynamics 69
This study also looked at the owner‐occupied properties pre‐storm that appear to have been a) rebuilt<br />
but are no longer owner‐occupied or b) are in the process of rebuilding. While this map certainly<br />
overstates the extent of owned homes that may have entered the rental market, it does convey the<br />
extent to which rebuilt/rebuilding homes, at one time owner‐occupied, have moved into another<br />
segment of the market (either vacant or for rent).<br />
Map 2: Owneroccupied units in 2005; Currently Active but No Homestead Exemption<br />
(units either under renovation, for sale/lease, or rented)<br />
Road Home Small Rental Program<br />
A significant portion of the small rental market is returning to commerce via the Road Home Small<br />
Rental Program. Table 35 summarizes the number of units included in this program by parish, status and<br />
target household income group. Map 3 graphically shows their location in <strong>New</strong> <strong>Orleans</strong> across each<br />
planning district. Overall, there are 8,524 units covered by this program, 37.1% of which (or 3,162 units)<br />
have closed. The highest geographic concentration is in <strong>Orleans</strong> Parish (6,895 units or 80.1% of the total)<br />
followed by St. Bernard with 792 units (9.3%) and Jefferson with 652 units (7.6% of the total). The other<br />
parishes in the region account for relatively few units since these areas either have few small rental<br />
properties in the overall housing inventory and/or had relatively moderate storm damage. The extensive<br />
damage to the City’s two to four unit properties and their importance historically to providing a source<br />
of moderately priced rental housing explains not only the geographic concentration but also the high<br />
<strong>New</strong> <strong>Orleans</strong> <strong>Market</strong> <strong>Assessment</strong> – An Analysis of Supply and Demand Dynamics 70
concentration of units targeted to low income households. Overall, 6,037 units (71% of the total) are<br />
targeted to very low income households while in <strong>Orleans</strong> Parish there are 4,888 such units which also<br />
accounts for 71% of the total. In St. Bernard Parish, 608 units are targeted to very low income<br />
households (77% of the total), while in Jefferson this target segment makes up 61% of the units<br />
approved for the Road Home Small Rental Program.<br />
Not surprisingly, the highest concentrations of small rental properties taking advantage of the Road<br />
Home Program are in historically low and moderate income neighborhoods. These include Mid City,<br />
Bywater and Central City. This is a reflection of the housing stock in these areas, namely small rental<br />
units, and also points to the funding structure of the program itself. In order to receive the maximum<br />
grant, the unit would need to be affordable to a very low income household. This is equivalent to $515<br />
for a one‐bedroom unit and $620 for a two bedroom unit. When factoring in the increased insurance<br />
and utility expenses, many landlords could earn more income without the grant, using traditional<br />
financing but charging higher prices. Three‐fourths of the units in Bywater are targeted to very low<br />
income households while in Mid City and <strong>New</strong> <strong>Orleans</strong> East areas, similarly targeted units account for<br />
69% and 72%, respectively.<br />
Map 3: Road Home Small Rental Participants by Status<br />
Source: <strong>Louisiana</strong> Office of Community Development/Disaster Recovery Unit, Small Rental data effective November, 2010.<br />
<strong>New</strong> <strong>Orleans</strong> <strong>Market</strong> <strong>Assessment</strong> – An Analysis of Supply and Demand Dynamics 71
Table 35: Summary of Small Rental Program by Parish<br />
Road Home Small Rental ‐ Closed (<strong>New</strong> <strong>Orleans</strong> MSA)<br />
Very Low Low Income Moderate Income Total<br />
Income<br />
Jefferson Parish 168 92 19 279<br />
<strong>Orleans</strong> Parish 1,708 536 132 2,376<br />
Plaquemines Parish 3 3 1 7<br />
St. Bernard Parish 351 97 5 453<br />
St. Tammany Parish 33 10 4 47<br />
Grand Total 2,263 738 161 3,162<br />
Road Home Small Rental ‐ Not Closed (<strong>New</strong> <strong>Orleans</strong> MSA)<br />
Very Low Low Income Moderate Income Total<br />
Income<br />
Jefferson Parish 230 102 41 373<br />
<strong>Orleans</strong> Parish 3,180 989 350 4,519<br />
Plaquemines Parish 15 3 18<br />
St. Bernard Parish 257 67 15 339<br />
St. Tammany Parish 92 12 9 113<br />
Grand Total 3,774 1,173 415 5,362<br />
Road Home Small Rental ‐ All (<strong>New</strong> <strong>Orleans</strong> MSA)<br />
Very Low Low Income Moderate Income Total<br />
Income<br />
Jefferson Parish 398 194 60 652<br />
<strong>Orleans</strong> Parish 4,888 1,525 482 6,895<br />
Plaquemines Parish 18 6 1 25<br />
St. Bernard Parish 608 164 20 792<br />
St. Tammany Parish 125 22 13 160<br />
Grand Total 6,037 1,911 576 8,524<br />
Source: LA OCD Road Home Small Rental microdata; analysis provided by GCR & Associates, Inc.<br />
<strong>New</strong> <strong>Orleans</strong> <strong>Market</strong> <strong>Assessment</strong> – An Analysis of Supply and Demand Dynamics 72
Table 36: Summary of Small Rental Program by Planning District in <strong>New</strong> <strong>Orleans</strong><br />
Road Home Small Rental ‐ Closed (<strong>New</strong> <strong>Orleans</strong>)<br />
Very Low<br />
Income<br />
Low<br />
Income<br />
Moderate<br />
Income Total<br />
No Designation 3 4 0 7<br />
Planning District 1 0 0 0 0<br />
Planning District 2 128 56 10 194<br />
Planning District 3 188 47 16 251<br />
Planning District 4 363 109 38 510<br />
Planning District 5 42 19 4 65<br />
Planning District 6 156 55 15 226<br />
Planning District 7 212 73 3 288<br />
Planning District 8 175 33 7 215<br />
Planning District 9 391 115 27 533<br />
Planning District 10 26 4 0 30<br />
Planning District 12 24 21 12 57<br />
Planning District 13 0 0 0 0<br />
Grand Total 1,708 536 132 2,376<br />
Road Home Small Rental ‐ Not Closed (<strong>New</strong> <strong>Orleans</strong>)<br />
Very Low<br />
Income<br />
Low<br />
Income<br />
Moderate<br />
Income Total<br />
No Designation 110 28 18 156<br />
Planning District 1 2 1 0 3<br />
Planning District 2 252 87 40 379<br />
Planning District 3 338 132 41 511<br />
Planning District 4 750 262 91 1,103<br />
Planning District 5 48 29 29 106<br />
Planning District 6 245 66 18 329<br />
Planning District 7 592 148 46 786<br />
Planning District 8 426 76 19 521<br />
Planning District 9 350 113 40 503<br />
Planning District 10 8 10 1 19<br />
Planning District 11 1 0 0 1<br />
Planning District 12 58 37 7 102<br />
Planning District 13 0 0 0 0<br />
Grand Total 3,180 989 350 4,519<br />
Road Home Small Rental ‐ All (<strong>New</strong> <strong>Orleans</strong>)<br />
Very Low<br />
Income<br />
Low<br />
Income<br />
Moderate<br />
Income Total<br />
No Designation 113 32 18 163<br />
Planning District 1 2 1 0 3<br />
Planning District 2 380 143 50 573<br />
Planning District 3 526 179 57 762<br />
Planning District 4 1,113 371 129 1,613<br />
Planning District 5 90 48 33 171<br />
Planning District 6 401 121 33 555<br />
Planning District 7 804 221 49 1,074<br />
Planning District 8 601 109 26 736<br />
Planning District 9 741 228 67 1,036<br />
Planning District 10 34 14 1 49<br />
Planning District 11 1 0 0 1<br />
Planning District 12 82 58 19 159<br />
Planning District 13 0 0 0 0<br />
Grand Total 1,525 482 4,888 6,895<br />
Source: <strong>Louisiana</strong> Recovery Authority<br />
<strong>New</strong> <strong>Orleans</strong> <strong>Market</strong> <strong>Assessment</strong> – An Analysis of Supply and Demand Dynamics 73
Profile of MLS Single Family Home Rentals<br />
Aside from extensive, costly, and time consuming field surveys, one of the most comprehensive sources<br />
of information regarding the single family rental market is the Multiple Listing Service (MLS). It provides<br />
a relatively good snapshot of properties rented and offered for rent by geographic area and unit type for<br />
situations in which the owner has enlisted the assistance of a licensed agent or broker to rent rather<br />
than sell a home. Although the MLS is a good source of information for understanding this segment of<br />
the rental market, it is far from perfect and no doubt significantly understates the number of units in<br />
this pool of housing inventory. The reasons for this are rather straightforward. First, most property<br />
owners who find it necessary or desirable to rent their homes will attempt to do so themselves thus<br />
avoiding payment of a commission. Second, before owners would resort to an MLS listing, they may also<br />
attempt to use an apartment finders service or enter their property into one of several online databases<br />
(i.e. Craigslist). Third, the listing of for‐rent homes will typically by design be biased toward the upper<br />
end of price/rent levels in the market. Therefore, many moderate to low priced single family rentals will<br />
be under‐represented. Fourth, it is also possible that properties offered under distressed conditions (i.e.<br />
bank owned foreclosure units) will also not be adequately represented since many institutions are likely<br />
to handle these transactions internally through their Liquidations/REO/Collections Department. In short,<br />
the numbers shown on Tables 37 and 38, while illustrative of single family rental activity, only partially<br />
describe its extent throughout the regional market.<br />
Overall, the number of single family homes rented with broker assistance has risen over the last three<br />
years from 1,688 units in 2008 to 1,923 units in 2010 or by just under 14%. The largest increase (10.1%)<br />
occurred most recently between 2009 and 2010. Over the same period, average rents for single family<br />
units have fallen from $1,479 ($0.85 PSF) to $1,325 ($0.78 PSF) or by 10.4%.<br />
St. Tammany Parish over the past three years has typically accounted for about one‐half of the broker<br />
assisted single family rentals in the <strong>New</strong> <strong>Orleans</strong> region. This is not surprising given the excess supply of<br />
single family units built in the parish post‐Katrina and the previously mentioned bias of MLS rental<br />
listings to higher priced properties. Since 2008, the number of single family MLS rentals in St. Tammany<br />
Parish rose by just under 17% (from 790 to 924) as average monthly rents fell from $1,653 ($0.90 PSF) to<br />
$1,368 ($0.74 PSF) or by 17.2%. This experience correlates fairly well with the price compression and<br />
extended marketing times which have characterized the single family sale market over the past three<br />
years and is consistent with a distressed market experiencing an unwelcome rise in foreclosure filings.<br />
Broker assisted home rentals in <strong>Orleans</strong> Parish have edged up from 299 in 2008 to 327 in 2010 or by<br />
about 9.4%. Overall, these rentals have typically accounted for about 17% to 18% of all such units in the<br />
MLS for the <strong>New</strong> <strong>Orleans</strong> area. Again, because of the inherent bias toward higher priced properties, the<br />
City’s relative share measured by this database is understated. Unlike the St. Tammany experience,<br />
average rents have remained relatively stable over the past three years at about $1,595 or $0.86 PSF.<br />
This appears to be true across all geographic sectors of the market within the city.<br />
Jefferson Parish’s broker assisted single family rentals rose from 578 in 2008 to 635 in 2010 or by just<br />
under 10%–numbers similar to those in <strong>New</strong> <strong>Orleans</strong>. At the same time, however, average rents fell<br />
<strong>New</strong> <strong>Orleans</strong> <strong>Market</strong> <strong>Assessment</strong> – An Analysis of Supply and Demand Dynamics 74
from $1,434 ($0.83 PSF) to $1,346 ($0.80 PSF) or by 6.1%. Decreases in average home rentals from 2008<br />
to 2010 were generally consistent across the various geographic sub‐markets in Jefferson.<br />
Active MLS listings through February 15, 2011 in the <strong>New</strong> <strong>Orleans</strong> area totaled 345 at an average asking<br />
rent of $1,667 ($0.84 PSF). St. Tammany Parish continues to account for the largest share— about 44%<br />
with 151 units offered at an average rent of $1,643 ($0.81 PSF). Jefferson Parish’s 121 listings (35% of<br />
the total) are offered at an average rent of $1,632 ($0.88 PSF), while in <strong>Orleans</strong> Parish the 69 listings<br />
posted through mid‐February have monthly rents averaging $2,044 or $1.03 PSF. The Uptown/CBD<br />
sector of the market has the highest asking rents of the entire region at $2,747 or $1.35 PSF.<br />
Although gross monthly rents are typically higher than those of a comparable bedroom/bath unit<br />
offering in an apartment community, rents PSF of living area are quite competitive and they are likely to<br />
become more so if the overhang of unsold homes remains high. Rent compression in this sector of the<br />
housing stock could also become more noticeable if the number of foreclosures and other distressed<br />
conditions persist for an extended period of time. This could push even more single family units into the<br />
rental stock thus keeping market wide vacancy rates above 8% to 9%.<br />
<strong>New</strong> <strong>Orleans</strong> <strong>Market</strong> <strong>Assessment</strong> – An Analysis of Supply and Demand Dynamics 75
Table 37: Summary of Single Family Homes Rented, <strong>New</strong> <strong>Orleans</strong> Region by Parish and<br />
Sector: 20082010<br />
Average<br />
Size<br />
Average<br />
Rent<br />
Average<br />
Rent PSF<br />
Parish/Year/Sector No.<br />
Jefferson<br />
2008 578 1,728 $1,434 $0.83<br />
Kenner 74 1,856 $1,561 $0.84<br />
Metairie 280 1,779 $1,495 $0.84<br />
Harahan/River Ridge 65 1,427 $1,264 $0.89<br />
Westbank 159 1,700 $1,337 $0.79<br />
2009 564 1,751 $1,395 $0.80<br />
Kenner 82 1,995 $1,556 $0.78<br />
Metairie 265 1,815 $1,495 $0.82<br />
Harahan/River Ridge 51 1,530 $1,247 $0.81<br />
Westbank 166 1,594 $1,200 $0.75<br />
2010 635 1,677 $1,346 $0.80<br />
Kenner 89 1,829 $1,411 $0.77<br />
Metairie 283 1,717 $1,434 $0.84<br />
Harahan/River Ridge 65 1,448 $1,217 $0.84<br />
Westbank 198 1,628 $1,234 $0.76<br />
<strong>Orleans</strong><br />
2008 299 1,860 $1,595 $0.86<br />
Algiers 53 1,964 $1,468 $0.75<br />
Uptown/CBD 102 1,866 $1,773 $0.95<br />
Mid‐City/Lakefront/Gentilly 123 1,829 $1,548 $0.85<br />
NO East 21 1,759 $1,331 $0.76<br />
2009 309 1,902 $1,605 $0.84<br />
Algiers 52 2,141 $1,530 $0.71<br />
Uptown/CBD 102 1,853 $1,793 $0.97<br />
Mid‐City/Lakefront/Gentilly 129 1,879 $1,551 $0.83<br />
NO East 26 1,724 $1,282 $0.74<br />
2010 327 1,851 $1,592 $0.86<br />
Algiers 54 2,106 $1,471 $0.70<br />
Uptown/CBD 101 1,665 $1,787 $1.07<br />
Mid‐City/Lakefront/Gentilly 131 1,876 $1,608 $0.86<br />
NO East 41 1,897 $1,214 $0.64<br />
St. Bernard<br />
2008 21 1,538 $1,235 $0.80<br />
2009 20 1,647 $988 $0.60<br />
2010 37 1,439 $994 $0.69<br />
St. Tammany<br />
2008 790 1,847 $1,653 $0.90<br />
East St. Tammany 361 1,858 $1,305 $0.70<br />
West St. Tammany 429 1,837 $1,946 $1.06<br />
2009 854 1,864 $1,559 $0.84<br />
East St. Tammany 406 1,853 $1,227 $0.66<br />
West St. Tammany 448 1,874 $1,891 $0.99<br />
2010 924 1,839 $1,368 $0.74<br />
East St. Tammany 456 2,245 $1,247 $0.56<br />
West St. Tammany 468 1,852 $1,486 $0.80<br />
Region<br />
2008 1,688 1,743 $1,479 $0.85<br />
2009 1,747 1,791 $1,387 $0.77<br />
2010 1,923 1,702 $1,325 $0.78<br />
Source: <strong>New</strong> <strong>Orleans</strong> Metropolitan Association of Realtors<br />
<strong>New</strong> <strong>Orleans</strong> <strong>Market</strong> <strong>Assessment</strong> – An Analysis of Supply and Demand Dynamics 76
Table 38: Summary of Single Family Homes Listed for Rent, <strong>New</strong> <strong>Orleans</strong> Region by Parish<br />
and Sector, As of February 15, 2011<br />
Parish/Sector No.<br />
Average<br />
Size<br />
Average<br />
Rent<br />
Average<br />
Rent PSF<br />
Jefferson 121 1,856 $1,632 $0.88<br />
Kenner 19 1,945 $1,578 $0.81<br />
Metairie 46 2,172 $2,098 $0.97<br />
Harahan/River Ridge 14 1,668 $1,409 $0.84<br />
Westbank 42 1,532 $1,220 $0.80<br />
<strong>Orleans</strong> 69 1,979 $2,044 $1.03<br />
Algiers 19 2,307 $2,237 $0.97<br />
Uptown/CBD 18 2,038 $2,747 $1.35<br />
Mid‐City/Lakefront/Gentilly 22 1,824 $1,632 $0.89<br />
NO East 10 1,588 $1,322 $0.83<br />
St. Bernard 4 2,067 $1,350 $0.65<br />
St. Tammany 151 2,037 $1,643 $0.81<br />
East St. Tammany 78 1,984 $1,525 $0.77<br />
West St. Tammany 73 2,094 $1,770 $0.85<br />
Region 345 1,985 $1,667 $0.84<br />
Source: <strong>New</strong> <strong>Orleans</strong> Metropolitan Association of Realtors<br />
Key Conclusions – Small Rental Properties:<br />
Because information is limited on small rental properties, this report conducted a survey of the<br />
small rental market resulting in a sample size of 1,800 small scale rental units throughout <strong>Orleans</strong><br />
Parish.<br />
Based on this survey and other forms of analysis, the small rental market is vibrant throughout the<br />
city, with major pockets of activity in Mid‐City, Bywater, Gentilly, and portions of Uptown.<br />
An analysis of active units that were owner occupied in 2005 yet that no longer have a homestead<br />
exemption illustrates the extent to which formerly owner occupied houses are now potentially<br />
being rented. This phenomenon extends throughout the city and is documented in the most<br />
recent (2009) American Housing Survey of <strong>New</strong> <strong>Orleans</strong>.<br />
The number of single family homes listed for‐rent by a real estate broker has increased by 14%<br />
over the past three years, suggesting again that many owner occupied homes are transitioning (at<br />
least temporarily) to renter occupied status.<br />
Rents per square foot for broker‐listed single family homes are competitive with other rental<br />
products. An increase in home foreclosures could add these structures to the rental market,<br />
thereby increasing the rental vacancy rate.<br />
Approximately 37% of the rental units participating in the Small Rental Program have closed on<br />
their assistance package.<br />
Over 80% of the small rental participants are in <strong>Orleans</strong> Parish. Within the city, these units tend to<br />
be concentrated within traditionally lower income areas.<br />
<strong>New</strong> <strong>Orleans</strong> <strong>Market</strong> <strong>Assessment</strong> – An Analysis of Supply and Demand Dynamics 77
Single Family Price and Sales Activity Trends: 2000 to 2010<br />
Regional Overview<br />
Historically, single family homes have represented a significant portion of the housing stock in the <strong>New</strong><br />
<strong>Orleans</strong> region occupied by renter households. In 1970, as previously discussed, single family attached<br />
and detached units accounted for 30.7% of all the renter occupied housing stock in the metropolitan<br />
area and 26.7% in <strong>Orleans</strong> Parish. This predated the two decades of multi‐family construction surges<br />
which introduced a large number of new rental units primarily in buildings with 100+ units. These<br />
increases in new inventory during the 1970’s and 1980’s reduced the relative share that one family<br />
dwellings contributed to the rental stock in <strong>New</strong> <strong>Orleans</strong> to 14.0% by the 2000 Census. In spite of its<br />
declining importance, single family structures remained a relatively significant component of the City’s<br />
rental housing stock. The storm destroyed or significantly damaged to larger properties, particularly in<br />
<strong>New</strong> <strong>Orleans</strong> East, once again increased the share of renter occupied units within single family buildings<br />
to 25% by 2009. This level is relatively close to where it was almost 40 years earlier in 1970. As newly<br />
built and redeveloped properties enter the market, particularly the larger complexes financed with tax<br />
or other incentives, the share of renter households occupying single family dwellings is likely to trend<br />
downward. However, single family homes will continue to comprise a substantial share of the rental<br />
housing stock.<br />
Another notable aspect of this segment of the rental stock is that single family homes become rental<br />
units for a variety of reasons over extended periods of time and in a relatively subtle manner. A major<br />
force pushing single family homes into the rental stock is economic conditions that make it difficult for<br />
owners to sell their homes due to a necessary relocation for job, due to other personal reasons such as a<br />
change in location, or due to housing style preference. The ability to sell in either of these contexts is<br />
often linked to the market’s overall level of economic and job creating activity; growth fundamentals<br />
that attract net inflows of new households; and rising levels of income which allows households to<br />
extract equity from their homes and either trade up to a large home or in the case of the growing cohort<br />
of aging “Baby Boomers” downsize to a different housing styles and community type as they near<br />
retirement. While the collapse of the housing prices in many areas of the U.S. has reduced the ability of<br />
many to sell their homes, the <strong>New</strong> <strong>Orleans</strong> area has generally escaped the worst of this cycle, a period<br />
which has also been characterized by wide‐spread “underwater mortgages” and high levels of<br />
foreclosure activity. The <strong>New</strong> <strong>Orleans</strong> region has largely been bypassed by these trends since it was not<br />
particularly afflicted by the questionable financial instruments that inflicted this damage, namely subprime<br />
mortgage lending and related forms of specious home mortgage finance. In a way, the<br />
dislocations and disruptions caused by Katrina largely insulated the <strong>New</strong> <strong>Orleans</strong> region from the<br />
questionable origination and underwriting practices that characterized much of the sub‐prime lending<br />
activity that swept across the country from 2003 to 2007.<br />
This is not to say that the region has not been impacted by the general downturn of housing prices and<br />
related real estate induced weaknesses in the national economy. Housing prices in the region have in<br />
fact trended downward since 2006 coming off their post‐Katrina peaks, and the volume of units sold has<br />
<strong>New</strong> <strong>Orleans</strong> <strong>Market</strong> <strong>Assessment</strong> – An Analysis of Supply and Demand Dynamics 78
also consistently edged down over the same period, flattening out somewhat through the end of 2010.<br />
The post‐Katrina spikes were particularly evident in suburban parishes such as Jefferson and St.<br />
Tammany which were not seriously inundated with flood water and which quickly attracted dislocated<br />
residents from <strong>Orleans</strong> and St. Bernard Parishes who in many cases paid an immediate post disaster<br />
premium to secure a place to live while their primary residence underwent repairs. In most suburban<br />
parishes the spikes were double digit rates of increase which tended to be relatively short lived events.<br />
Between 2004 and 2005, average single family home prices in the regional market rose from $185,547<br />
to $211,818 or by just under 14.2% and then by 5.2% from 2005 to 2006. In addition to suburban<br />
parishes that experienced hefty gains, portions of the City, particularly its traditional footprint along the<br />
river, also saw average home prices rise significantly over 2004 (21.9%) as households clamored to<br />
secure a place to live with little consideration given to the price paid.<br />
Since the post‐Katrina spike, which was evident in the market’s pricing structure through the middle of<br />
2007, prices have tended to level out or gradually edge downward particularly in suburban parishes like<br />
Jefferson and St. Tammany. Both have experienced decreases in average price since 2007 although the<br />
pace of price compression slowed during 2010. In St. Tammany Parish, for example, average home<br />
prices have fallen from their 2007 peak of $248,605 to $223,543 (or by 10.1%) through the end of 2010,<br />
while in Jefferson average prices have dropped from $215,547 in 2007 to $184,286 (14.5%) in 2010.<br />
Driven largely by home price appreciation in <strong>Orleans</strong> Parish, the average sales price rose by just under<br />
4.9% through the end of 2010 from $204,021 to $214,000. Average prices dropped by 1.5% in Jefferson<br />
Parish through year end 2010 while in St. Tammany they fell by 0.51% when compared to 2009. In both<br />
parishes, price weakness is particularly notable among larger (4BR+) homes which are typically at more<br />
expensive levels and which take longer to sell. In Jefferson Parish, for example, the average price of a<br />
single family home with four or more bedrooms dropped by 7.4% (from $283,330 to $262,400) between<br />
2008 and 2009, while in St. Tammany Parish similarly sized unit average prices fell by an average of 4.9%<br />
over the same period from $305,590 to $290,469. In St. Tammany Parish, however, prices of smaller<br />
single family homes since 2008 have fallen at a slightly faster pace than those at the larger and more<br />
expensive end of the inventory scale. This was particularly true between 2008 and 2009 when prices of<br />
homes with two or fewer bedrooms fell by 19.6% and those with three bedrooms dropped by 7.5%.<br />
Although the sales records do not reflect it, there is good reason to believe that many homes that sold<br />
at these discounts were originally purchased at premiums by storm dislocated households and are now<br />
being liquidated. Those not willing to incur a capital loss are more likely to place many of these units in<br />
the rental stock.<br />
The St. Tammany Parish trends are a direct reflection of an over‐abundance of new inventory which<br />
outstripped this parish’s consistently healthy growth rate, while in Jefferson Parish the declines can be<br />
attributed to a local economy which has seen flat to no growth for several years and the loss of 23,000<br />
people and 6,590 households between 2000 and 2010. In both cases, however, these conditions are<br />
producing an uncomfortable rise in foreclosure activity as well as a rise in the number of units entering<br />
the rental stock due to the inability to sell or to sell without experiencing a significant capital loss.<br />
Although still somewhat below the foreclosure rates reported for the U.S. as a whole, foreclosure filings<br />
in the <strong>New</strong> <strong>Orleans</strong> region have risen over the past two years to signal some levels of concern. Through<br />
<strong>New</strong> <strong>Orleans</strong> <strong>Market</strong> <strong>Assessment</strong> – An Analysis of Supply and Demand Dynamics 79
the end of 2010, Realty Trac reported that the number of foreclosures in the <strong>New</strong> <strong>Orleans</strong> area rose to<br />
7,822 (up 36.3% from 2009) and represented a rate of one for every 57 households in the region. By<br />
comparison, the U.S. average as of yearend 2010 was one for every 45 households, while in <strong>Louisiana</strong><br />
the rate stood at one for every 120 households. Foreclosure filings in <strong>Orleans</strong> Parish rose from 2,290 in<br />
2009 to 2,449 in 2010 or by 6.9% pushing the rate to one for every 47 households, while in St. Tammany<br />
Parish filings rose by 51.6% (1,284 to 1,946) producing a rate of one in 50 households. Both of these<br />
rates are disturbingly close to the national average and Jefferson Parish’s 44.8% increase in filings (from<br />
2,111 to 3,056) places its rate within striking distance of the U.S. experience as well. Rising levels of<br />
foreclosure activity typically produce two major effects on local housing markets: 1) further price<br />
compression as more homes are sold under distressed conditions and 2) further increases in vacant<br />
home inventory much of which is returned to commerce as rental units if only temporarily. Both of<br />
these can be very destabilizing to markets as a whole but particularly to individual neighborhoods where<br />
foreclosure activity might be concentrated.<br />
Table 39: Summary of Foreclosure Filings, <strong>New</strong> <strong>Orleans</strong> Region, 2009 to 2010<br />
Parish Filings 2010 Filings 2009<br />
Percent Change<br />
2009‐2010<br />
Households in<br />
Foreclosure 2010<br />
<strong>Orleans</strong> 2,449 2,290 +6.9% 1 in 47<br />
St. Tammany 1,946 1,284 +51.6% 1 in 50<br />
Jefferson 3,056 2,111 +44.3% 1 in 59<br />
St. Charles 262 26 +100 plus % 1 in 77<br />
St. Bernard 54 19 +100 plus % 1 in 159<br />
St. John 54 10 +100 plus % 1 in 325<br />
Plaquemines 1 1 ‐ 1 in 8,867<br />
<strong>New</strong> <strong>Orleans</strong> 7,822 5,741 +32.6% 1 in 57<br />
<strong>Louisiana</strong> 15,753 11,750 +34.1% 1 in 120<br />
United States 2.87 million 2.8 million +2.5% 1 in 45<br />
Source: Realty Trac<br />
These patterns typically gain momentum as the gap between units available for sale and those actually<br />
sold widens and average marketing time (reflected by Days on <strong>Market</strong> or DOM) extends. In the region<br />
overall, DOM has lengthened from an average of 55 in 2006 to 111 through the end of 2010. This<br />
doubling of marketing times is also consistent with a steady drop in unit sales which peaked in 2006 at<br />
13,168 units falling to 6,891 units sold through 2010, a decrease of 47.7%. The decline in unit sales is<br />
also a reflection of reduced availability of for‐sale inventories as sellers withdraw their for sale offerings<br />
from the market in an attempt to await the recovery of a more favorable and attractive pricing<br />
structure. These units may, if the owner relocates, be placed into the rental housing stock in an attempt<br />
to mitigate the monthly costs of ownership. The next section focuses specifically on home sales in<br />
<strong>Orleans</strong> Parish.<br />
<strong>New</strong> <strong>Orleans</strong> <strong>Market</strong> <strong>Assessment</strong> – An Analysis of Supply and Demand Dynamics 80
Table 40: Existing Housing Price Trends, <strong>New</strong> <strong>Orleans</strong> Metropolitan Area<br />
Parish 2004 2005 2006 2007 2008 2009 2010<br />
Jefferson $179,761 $200,408 $211,053 $215,547 $199,070 $187,095 $184,286<br />
East $224,518 $244,909 $249,025 $256,192 $237,063 $217,708 $218,374<br />
West $126,843 $143,635 $163,114 $164,250 $148,888 $141,631 $134,763<br />
<strong>Orleans</strong> $201,706 $237,768 $226,716 $189,610 $205,970 $214,358 $254,309<br />
Westbank $190,390 $193,308 $213,884 $213,343 $183,344 $172,640 $162,649<br />
Central $232,208 $283,020 $262,938 $238,085 $253,689 $262,298 $312,332<br />
Eastern $120,533 $135,941 $79,731 $82,513 $102,532 $113,856 $112,513<br />
Plaquemines $214,892 $241,293 $273,391 $286,753 $255,402 $302,976 $225,916<br />
St. Bernard $103,192 $114,433 $49,791 $76,913 $98,151 $100,772 $102,744<br />
St. Tammany $187,072 $213,013 $238,178 $248,605 $240,014 $224,688 $223,543<br />
Eastern $151,166 $168,443 $180,772 $193,166 $187,487 $175,060 $172,815<br />
Western $217,926 $245,389 $291,212 $291,817 $272,834 $256,172 $255,616<br />
Metro <strong>New</strong> <strong>Orleans</strong> $185,547 $211,818 $222,826 $213,069 $210,122 $204,021 $214,000<br />
Parish<br />
Percent<br />
Change 04<br />
vs. 05<br />
Percent<br />
Change 05<br />
vs. 06<br />
Percent<br />
Change 06<br />
vs. 07<br />
Percent<br />
Change 07<br />
vs. 08<br />
Percent<br />
Change 08<br />
vs. 09<br />
Percent<br />
Change 09<br />
vs. 10<br />
Jefferson 11.49% 5.31% 2.13% ‐7.64% ‐6.02% ‐1.50%<br />
East 9.08% 1.68% 2.88% ‐7.47% ‐8.16% 0.31%<br />
West 13.24% 13.56% 0.70% ‐9.35% ‐4.87% ‐4.85%<br />
<strong>Orleans</strong> 17.88% ‐4.65% ‐16.37% 8.63% 4.07% 18.64%<br />
Westbank 1.53% 10.64% ‐0.25% ‐14.06% ‐5.84% ‐5.79%<br />
Central 21.88% ‐7.10% ‐9.45% 6.55% 3.39% 19.08%<br />
Eastern 12.78% ‐41.35% 3.49% 24.26% 11.04% ‐1.18%<br />
Plaquemines 12.29% 13.30% 4.89% ‐10.93% 18.63% ‐25.43%<br />
St. Bernard 10.89% ‐56.49% 54.47% 27.61% 2.67% 1.96%<br />
St. Tammany 13.87% 11.81% 4.38% ‐3.46% ‐6.39% ‐0.51%<br />
Eastern 11.43% 7.32% 6.86% ‐2.94% ‐6.63% ‐1.28%<br />
Western 12.60% 18.67% 0.21% ‐6.51% ‐6.11% ‐0.22%<br />
Metro <strong>New</strong> <strong>Orleans</strong> 14.16% 5.20% ‐4.38% ‐1.38% ‐2.90% 4.89%<br />
Source: <strong>New</strong> <strong>Orleans</strong> Metropolitan Association of Realtors<br />
<strong>New</strong> <strong>Orleans</strong> <strong>Market</strong> <strong>Assessment</strong> – An Analysis of Supply and Demand Dynamics 81
Table 41: Units Sold and Days on <strong>Market</strong> Single Family Residential, <strong>New</strong> <strong>Orleans</strong><br />
Metropolitan Area<br />
2006<br />
2007 2008<br />
Unit Average Days on Unit Average Days on Unit Average Days on<br />
AREA Sales Price <strong>Market</strong> Sales Price <strong>Market</strong> Sales Price <strong>Market</strong><br />
Jefferson Parish<br />
East Jefferson 2,713 $249,025 54 1,777 $256,192 77 1,441 $237,063 98<br />
West Jefferson 2,149 $163,114 53 1,408 $164,250 70 1,091 $148,888 87<br />
Parish Total 4,862 $211,053 54 3,185 $215,547 74 2,532 $199,070 93<br />
<strong>Orleans</strong> Parish<br />
Westbank <strong>Orleans</strong> 712 $213,884 65 462 $213,343 96 353 $183,344 113<br />
Central <strong>Orleans</strong> 2,127 $262,938 62 1,771 $238,085 95 1,393 $254,400 105<br />
Eastern N.O. 462 $79,731 60 904 $82,513 80 575 $102,532 82<br />
Parish Total 3,301 $226,716 62 3,137 $189,610 90 2,321 $205,970 100<br />
Plaquemines Parish 133 $273,391 63 72 $286,753 82 79 $255,402 98<br />
St. Bernard Parish 197 $49,791 53 365 $76,913 77 318 $98,151 82<br />
St. Tammany Parish<br />
E. St. Tammany 2,245 $180,772 43 1,357 $193,166 78 896 $187,487 91<br />
W. St. Tammany 2,430 $291,212 47 1,741 $291,817 79 1,434 $272,834 98<br />
Parish Total 4,675 $238,178 45 3,098 $248,605 79 2,330 $240,014 95<br />
<strong>New</strong> <strong>Orleans</strong> Metro 13,168 $222,826 55 9,857 $213,069 80 7,580 $210,122 93<br />
2009 2010<br />
Unit Average Days on Unit Average Days on<br />
AREA Sales Price <strong>Market</strong> Sales Price <strong>Market</strong><br />
Jefferson Parish<br />
East Jefferson 1,552 $217,708 99 1,386 $218,374 95<br />
West Jefferson 1,045 $141,631 86 954 $134,763 84<br />
Parish Total 2,597 $187,095 93 2,340 $184,286 90<br />
<strong>Orleans</strong> Parish<br />
Westbank <strong>Orleans</strong> 308 $183,344 125 290 $162,649 100<br />
Central <strong>Orleans</strong> 1,398 $262,298 100 1,311 $312,332 90<br />
Eastern N.O. 539 $113,856 93 349 $112,513 104<br />
Parish Total 2,245 $214,358 106 1,950 $254,309 98<br />
Plaquemines Parish 68 $302,976 111 73 $225,916 139<br />
St. Bernard Parish 317 $100,772 107 282 $102,744 132<br />
St. Tammany Parish<br />
E. St. Tammany 878 $175,060 99 870 $172,815 97<br />
W. St. Tammany 1,384 $256,172 104 1,376 $255,616 95<br />
Parish Total 2,262 $224,688 102 2,246 $223,543 96<br />
<strong>New</strong> <strong>Orleans</strong> Metro 7,489 $204,021 104 6,891 $214,000 111<br />
Source: <strong>New</strong> <strong>Orleans</strong> Metropolitan Association of Realtors<br />
<strong>New</strong> <strong>Orleans</strong> <strong>Market</strong> <strong>Assessment</strong> – An Analysis of Supply and Demand Dynamics 82
Graph 6: Single Family Average Price and Units Sold, Metro <strong>New</strong> <strong>Orleans</strong>: 2004 – 2010<br />
$220,000<br />
16,000<br />
$205,000<br />
$190,000<br />
$175,000<br />
$160,000<br />
$145,000<br />
$130,000<br />
$115,000<br />
14,000<br />
12,000<br />
10,000<br />
8,000<br />
6,000<br />
4,000<br />
2,000<br />
Ave Price<br />
Units Sold<br />
$100,000<br />
2004 2005 2006 2007 2008 2009 2010<br />
0<br />
Source: <strong>New</strong> <strong>Orleans</strong> Metropolitan Association of Realtors<br />
Graph 7: Single Family Average Price and Units Sold, Jefferson Parish: 2004 – 2010<br />
$220,000<br />
6,000<br />
$210,000<br />
$200,000<br />
$190,000<br />
$180,000<br />
$170,000<br />
5,000<br />
4,000<br />
3,000<br />
2,000<br />
1,000<br />
Ave Price<br />
Units Sold<br />
$160,000<br />
2004 2005 2006 2007 2008 2009 2010<br />
0<br />
Source: <strong>New</strong> <strong>Orleans</strong> Metropolitan Association of Realtors<br />
<strong>New</strong> <strong>Orleans</strong> <strong>Market</strong> <strong>Assessment</strong> – An Analysis of Supply and Demand Dynamics 83
Graph 8: Single Family Average Price and Units Sold, <strong>Orleans</strong> Parish: 2004 – 2010<br />
$275,000<br />
3,500<br />
$250,000<br />
$225,000<br />
$200,000<br />
$175,000<br />
$150,000<br />
$125,000<br />
3,000<br />
2,500<br />
2,000<br />
1,500<br />
1,000<br />
500<br />
Ave Price<br />
Units Sold<br />
$100,000<br />
2004 2005 2006 2007 2008 2009 2010<br />
0<br />
Source: <strong>New</strong> <strong>Orleans</strong> Metropolitan Association of Realtors<br />
Graph 9: Single Family Average Price and Units Sold, St. Tammany Parish: 2004 – 2010<br />
$275,000<br />
5,000<br />
$250,000<br />
4,500<br />
4,000<br />
$225,000<br />
3,500<br />
$200,000<br />
3,000<br />
2,500 Ave Price<br />
$175,000<br />
2,000 Units Sold<br />
$150,000<br />
1,500<br />
1,000<br />
$125,000<br />
500<br />
$100,000<br />
0<br />
2004 2005 2006 2007 2008 2009 2010<br />
Source: <strong>New</strong> <strong>Orleans</strong> Metropolitan Association of Realtors<br />
<strong>New</strong> <strong>Orleans</strong> <strong>Market</strong> <strong>Assessment</strong> – An Analysis of Supply and Demand Dynamics 84
Graph 10: Employment 2001 – 2010, Quarter 1: <strong>Orleans</strong>, Jefferson and St. Tammany Parishes<br />
300,000<br />
250,000<br />
200,000<br />
150,000<br />
100,000<br />
50,000<br />
0<br />
Q1/2001 Q1/2005<br />
August<br />
2005<br />
Q1/2006 Q4/2007 Q4/2008 Q4/2009 Q1/2010<br />
Jefferson 212,974 210,801 214,370 183,587 200,936 199,505 193,761 190,052<br />
<strong>Orleans</strong> 261,646 242,843 241,264 142,812 170,544 173,630 169,368 170,148<br />
St. Tammany 57,840 67,369 69,457 65,704 75,516 74,785 75,287 73,947<br />
Source: Labor <strong>Market</strong> Statistics, Quarterly Census of Employment & Wages Program<br />
<strong>Orleans</strong> Parish Sales Activity by Condition: 2000 – 2010<br />
Although they may take longer to sell, single family homes in <strong>Orleans</strong> Parish that are considered to be in<br />
Average condition or better have generally experienced the most consistent average price and price per<br />
square foot (PSF) appreciation since 2004 immediately preceding Hurricane Katrina. Properties rated as<br />
Poor have had a more erratic price history over the 2004 to 2010 period, although such properties<br />
generally sell faster (see Tables 42 through 44 and Graphs 11 through 13). The erratic price history for<br />
Poor condition properties after 2004 is no doubt influenced by the abundance of flooded, gutted (and<br />
maybe not gutted) units that entered the inventory of for sale housing. These units may have sparked<br />
interest among many who saw an opportunity to own property in neighborhoods which had been<br />
unaffordable prior to Katrina. This is rather clear in 2006 when the average price of such units rose to<br />
$84,455 and then leveled out to $66,378 and $62,104 in 2007 and 2008, respectively. At the same time,<br />
average marketing times rose to 94 and 90 days, up significantly from 53 days in 2005 and 41 days in<br />
both 2000 and 2004. These extended marketing times also reflect some resistance to higher prices for<br />
these Poor quality homes as well as periods of uncertainty that settled upon the City as the recovery<br />
process unfolded. These uncertain conditions included seemingly interminable delays in deploying much<br />
needed financial resources as well as any number of mixed signals about how resources would be<br />
focused in support of the redevelopment effort. The initial uptick in the average price of for sale homes<br />
is also indicative of neighborhoods that attracted the most immediate interest of those who saw a<br />
unique buying opportunity (i.e. Lakeview, Lakeshore, Lake Vista and Mid‐City) which historically have<br />
had slightly large homes on more expensive land.<br />
<strong>New</strong> <strong>Orleans</strong> <strong>Market</strong> <strong>Assessment</strong> – An Analysis of Supply and Demand Dynamics 85
The downward drift of prices for Poor conditions properties in 2009 and 2010 ($48,296 and $48,015,<br />
respectively) illustrates the entry of smaller homes in less desirable neighborhoods in the City. The fact<br />
that there have been purchases in these neighborhoods, however, also constitutes a vote of confidence<br />
in these areas. In many cases, these purchases have been influenced by post‐storm financing assistance<br />
for first time homebuyers as well as the untiring efforts of local neighborhood organizations, non‐profits<br />
and housing advocates to restore stability and a sense of community to areas badly damaged by Katrina.<br />
On a PSF basis, prices for Poor and Fair quality single family homes spiked in 2006 and have since leveled<br />
out or edged down through 2010. Since 2004, for example, the PSF for Poor quality units sold in <strong>New</strong><br />
<strong>Orleans</strong> fell from $39.51 to $26.58 or by almost a third. This is yet another indication that more<br />
properties purchased in this condition are more widely spread across a range of neighborhoods and<br />
possibly involving a greater number of more severely damaged (i.e. flooded) homes than was the case<br />
pre‐Katrina in 2004. However, at $26.58 PSF, this represents for many an unprecedented opportunity to<br />
become a homeowner or to acquire property as an investment at a low enough level to offer attractive<br />
upside profit potential.<br />
The highest price appreciation in the <strong>Orleans</strong> Parish market has been imbedded among existing<br />
properties rated Very Good or Excellent and those classified as <strong>New</strong>. Since 2004, homes classified as<br />
being in Very Good condition have seen their average price rise from $172,027 ($129.17 PSF) to<br />
$284,005 ($123.03 PSF) or by 65.1%, while the average marketing time for such properties rose from 55<br />
days to 107 days. However, this includes a post‐Katrina price spike that has since moderated from the<br />
2006 peak of $265,745 resulting in an appreciation rate of just under 7% since 2006 for this quality of<br />
home sold through 2010.<br />
Similarly, homes rated as being in Excellent condition experienced a significant (42%) rise in price<br />
between 2004 and 2006 only to see this post‐storm premium moderate from 2007 through 2009.<br />
Overall, since 2006 the average price for this category of single family home fell by 7.5% through the end<br />
of 2010.<br />
Not surprisingly, the highest average PSF has typically been recorded for “<strong>New</strong>” properties sold. These<br />
properties have also on average taken the longest to sell. The average PSF for <strong>New</strong> homes sold through<br />
the end of 2010 was $143.98 in <strong>New</strong> <strong>Orleans</strong> as compared to $142.83 PSF and $123.03 PSF for<br />
properties of Excellent or Very Good condition. Their total price, however, has consistently been<br />
somewhat lower than existing homes sold in Excellent condition and until 2010, they took significantly<br />
longer to market. In fact, the average DOM for <strong>New</strong> units spiked in 2008 and 2009 (181 and 188 days,<br />
respectively) as the inventory surge of newly constructed units worked its way through the pipeline,<br />
settling back to a more typical 101 days in 2010. This adjustment was likely influenced by a curtailment<br />
of new construction as well as tax credit incentives which were available to homebuyers through April<br />
2010.<br />
For the most part, these pricing patterns are reflective of the somewhat unique conditions that have<br />
impacted the City’s housing inventory post‐Katrina and the equally unique rebuilding and<br />
redevelopment patterns that have unfolded since 2006. These have been largely influenced by the rate<br />
<strong>New</strong> <strong>Orleans</strong> <strong>Market</strong> <strong>Assessment</strong> – An Analysis of Supply and Demand Dynamics 86
and patterns of repopulation as well as by the availability, cost and type of financial resources which<br />
have fueled the redevelopment effort. Going forward, it would be reasonable to expect similarly<br />
disparate trends as yet more units reenter the City’s housing inventory, particularly Road Home<br />
acquired properties that are being released for sale by the <strong>Louisiana</strong> Land Trust through local<br />
organizations such as the <strong>New</strong> <strong>Orleans</strong> Redevelopment Authority.<br />
Tables in the Appendix of this report summarize price trends by condition for each of the City’s thirteen<br />
planning districts for the period 2000 to 2010.<br />
Table 42: Price Per Square Foot by Condition, City of <strong>New</strong> <strong>Orleans</strong><br />
Condition 2000 2004 2006 2007 2008 2009 2010<br />
Poor $28.45 $39.51 $46.02 $36.09 $33.96 $28.10 $26.58<br />
Fair $39.79 $53.39 $59.68 $43.67 $42.96 $40.55 $40.52<br />
Average $60.08 $78.37 $84.29 $82.92 $84.80 $73.88 $72.44<br />
Very Good $74.13 $97.17 $129.17 $125.80 $118.42 $155.19 $123.03<br />
Excellent $87.71 $122.12 $158.56 $146.10 $138.46 $133.89 $142.82<br />
<strong>New</strong> $89.39 $124.84 $132.91 $132.09 $121.53 $133.19 $143.98<br />
Graph 11: Price Per Square Foot by Condition, City of <strong>New</strong> <strong>Orleans</strong><br />
$180<br />
$160<br />
$140<br />
$120<br />
$100<br />
$80<br />
$60<br />
$40<br />
$20<br />
$0<br />
2000 2004 2006 2007 2008 2009 2010<br />
Poor Fair Average Very Good Excellent <strong>New</strong><br />
Table 43: Average Days on <strong>Market</strong> by Condition, City of <strong>New</strong> <strong>Orleans</strong><br />
Condition 2000 2004 2006 2007 2008 2009 2010<br />
Poor 41 41 53 94 90 85 76<br />
Fair 81 51 56 88 87 99 98<br />
Average 64 58 70 106 107 97 92<br />
Very Good 42 55 67 91 104 104 107<br />
Excellent 58 59 64 86 103 103 93<br />
<strong>New</strong> 99 97 115 108 181 188 101<br />
<strong>New</strong> <strong>Orleans</strong> <strong>Market</strong> <strong>Assessment</strong> – An Analysis of Supply and Demand Dynamics 87
Graph 12: Average Days on <strong>Market</strong> by Condition, City of <strong>New</strong> <strong>Orleans</strong><br />
200<br />
180<br />
160<br />
140<br />
120<br />
100<br />
80<br />
60<br />
40<br />
20<br />
0<br />
2000 2004 2006 2007 2008 2009 2010<br />
Poor Fair Average Very Good Excellent <strong>New</strong><br />
Table 44: Average Sale Price by Condition, City of <strong>New</strong> <strong>Orleans</strong><br />
Condition 2000 2004 2006 2007 2008 2009 2010<br />
Poor $45,503 $58,322 $84,455 $66,378 $62,104 $48,296 $48,015<br />
Fair $62,046 $78,557 $130,895 $90,871 $86,304 $82,354 $80,098<br />
Average $99,641 $130,643 $173,130 $157,332 $165,381 $159,642 $134,512<br />
Very Good $134,934 $172,027 $265,745 $267,754 $244,612 $255,449 $284,005<br />
Excellent $197,506 $265,892 $377,093 $344,178 $320,345 $295,115 $348,890<br />
<strong>New</strong> $193,660 $276,975 $301,478 $245,517 $214,303 $269,895 $319,752<br />
Total $154,322 $201,970 $226,952 $189,168 $205,490 $213,939 $247,043<br />
<strong>New</strong> <strong>Orleans</strong> <strong>Market</strong> <strong>Assessment</strong> – An Analysis of Supply and Demand Dynamics 88
Graph 13: Average Sale Price by Condition, City of <strong>New</strong> <strong>Orleans</strong><br />
$400,000<br />
$350,000<br />
$300,000<br />
$250,000<br />
$200,000<br />
$150,000<br />
$100,000<br />
$50,000<br />
$0<br />
2000 2004 2006 2007 2008 2009 2010<br />
Poor Fair Average Very Good<br />
Excellent <strong>New</strong> Total<br />
Source: <strong>New</strong> <strong>Orleans</strong> Metropolitan Association of Realtors<br />
Relevance to Rental <strong>Market</strong><br />
The recent downturn in the housing market has had an impact on the rental market overall. The stability<br />
of the for‐sale housing market is intrinsically tied to the rental market for a variety of reasons. First,<br />
tighter lending requirements will make it more difficult for first‐time homebuyers to purchase a home.<br />
The lax lending criteria that marked much of this decade allowed young households with little to no<br />
down payment and less than perfect credit the opportunity to purchase a home. This is no longer the<br />
case, with banks now requiring closer to 20% in down payment and much higher credit scores to qualify<br />
for a home mortgage. Despite the fact that it is an excellent time to purchase a home, with home prices<br />
today slightly lower than in 2007 and interest rates at historic lows, the stringent lending criteria will<br />
make it difficult for many renters to enter into homeownership. The relatively high cost of renting in this<br />
market limits the amount of savings for down payment and the lack of long‐term credit history and job<br />
stability for many young households weakens credit scores. And given the increasing regulatory scrutiny<br />
lenders now face, the ability of many to qualify for home mortgages is not likely to become any less<br />
difficult in the foreseeable future.<br />
The graphic below shows a very significant shift of householders between 25 and 35 years old moving<br />
into homeownership. Under current economic conditions, this shift will presumably be less pronounced<br />
in the coming years, with a greater share of young renter households remaining in the rental housing<br />
market, thereby weakening demand for new home purchases. This will be made even more challenging<br />
for those who have difficulty entering the workforce at wage levels that would enable them to qualify<br />
for a home. Consequently, many young households will not be in a position to take advantage of buying<br />
<strong>New</strong> <strong>Orleans</strong> <strong>Market</strong> <strong>Assessment</strong> – An Analysis of Supply and Demand Dynamics 89
opportunities in many redeveloping neighborhoods in <strong>New</strong> <strong>Orleans</strong> and will be forced to rent longer or<br />
possibly relocate to find more attractive job and housing options. Long term, this will extend the<br />
repopulation and rebuilding process thus lowering the average annual absorption potential for both<br />
new and existing housing inventory in the City. This would only serve to push prices down and force<br />
more sellers into the role of landlord at least on an interim basis.<br />
Table 45: Month’s Supply of Single Family Inventory<br />
Total Sales 2009 2,242<br />
Sales per Month 187<br />
Current Supply (MLS) 1,633<br />
12‐month Absorption Rate 73%<br />
Month’s Supply 9<br />
Another way in which the for‐sale market affects the rental market is simply a matter of supply and<br />
demand. The average number of days homes are on the market is indicative of demand; and data<br />
through the end of 2009 suggests there is an oversupply of housing for sale, with an estimated nine (9)<br />
months of supply compared to a more typical four (4) months’ supply. According to the U.S. Census<br />
estimates for a month’s supply of housing on a national basis, this rate is similar to national figures—an<br />
indication that the region is not immune to the national downturn in the housing market. What this<br />
means for <strong>New</strong> <strong>Orleans</strong> is that some product within the for‐sale market is transferring over to the rental<br />
market, as homeowners who cannot sell their home opt to rent as a means to reduce costs and<br />
minimize losses. This is documented in the <strong>New</strong> <strong>Orleans</strong> Assessor’s data, which illustrates a shift in<br />
active residential properties without a homestead exemption within traditional single family<br />
neighborhoods, as well as the recently released American Housing Survey for <strong>New</strong> <strong>Orleans</strong>, showing a<br />
significant rise in the share of rental units within single family homes.<br />
Based on this information, it is increasingly evident that historically owner‐occupied units are playing a<br />
significant role in the increase of rental supply, exacerbating the surplus problem. This is more likely<br />
manifested within the demand for non‐subsidized units, pulling market rate renters from apartment<br />
complexes to single‐family homes with yards and other amenities at comparable price points.<br />
First Time Homebuyers<br />
Despite the documented oversupply of for‐sale housing, there remains a demand from homeownership<br />
as existing renter households become owners. In some respects, the surplus of housing for sale and the<br />
slight decrease in prices indicates a “buyers market” in which it is an ideal time to enter into the<br />
homeownership realm. At the same time, the overall increase in prices post‐Katrina coupled with more<br />
stringent lending policies means that many renter households that would normally transition into<br />
homeownership are not able to do so. This is particularly true for moderate income households with<br />
limited budgets or savings for down payments. Prior to the mortgage crisis, many households acquired<br />
mortgages with poor credit and/or little to no money down through 80/20 loans and adjustable rate<br />
mortgages. Due to the toxicity of many of these loans and the resultant foreclosure spike, the market<br />
has since retracted these lending practices, making it more difficult for renters to become owners. The<br />
<strong>New</strong> <strong>Orleans</strong> <strong>Market</strong> <strong>Assessment</strong> – An Analysis of Supply and Demand Dynamics 90
current Home Mortgage Disclosure Act data reveals that one in four mortgage applications in the region<br />
were denied in 2009, with higher denial rates for minority applicants. 16<br />
Table 46: Mortgage Denials by Parish, 2009<br />
Mortgage Applications ‐ FHA, FSH/RHS & VA and Conventional<br />
Originated Denied Denial Rate<br />
Jefferson 2,706 567 21.0%<br />
<strong>Orleans</strong> 2,512 612 24.4%<br />
St. Bernard 318 87 27.4%<br />
St. Charles 434 117 27.0%<br />
St. John 360 97 26.9%<br />
St. Tammany 2,201 485 22.0%<br />
Plaquemines 137 91 66.4%<br />
Total 8,668 2,056 23.7%<br />
Source: Home Mortgage Disclosure Act, 2009<br />
Similar to much of the country, first time homebuyers tend to have smaller household sizes, lower<br />
incomes and are younger than the general buyer. As Graph 14 illustrates, 40% of renter households<br />
between adulthood and age 35 transition into homeownership. According to a recent survey conducted<br />
by the National Association of Homebuilders, 30% to 40% of new home sales are from first‐time<br />
homebuyers. 17 If we apply this figure to the <strong>New</strong> <strong>Orleans</strong> region, then 2,000 to 2,800 of the home sales<br />
in 2010 were from first‐time homebuyers. Using the mortgage denial figure, an additional 450 to 650<br />
renters were denied a mortgage and were not able to access homeownership. Continued financial<br />
literacy training, soft‐second mortgages and credit repair assistance should assist these households in<br />
purchasing a home, alleviating a portion of the oversupply in for‐sale housing.<br />
It should also be noted that the supply of homes for sale priced below $150,000 has significantly<br />
decreased since Katrina, making it financially difficult for moderate income households to purchase a<br />
home. According to MLS data for <strong>Orleans</strong> Parish, 40% of sold homes in 2004 that were in Very Good,<br />
Excellent or <strong>New</strong> Condition sold for less than $150,000; today that figure is 23%. Applied to 2009 figures,<br />
this marks a loss of 235 units affordable to moderate income households.<br />
16 James R. Hagerty, “U.S. Data Show High Mortgage Denial Rates for Blacks,” Wall Street Journal, October 6, 2009,<br />
retrieved March 12, 2011, http://online.wsj.com/article/SB125434471703353677.html.<br />
17 Heather Taylor, “Characteristics of <strong>New</strong> and First‐Time Homebuyers,” National Association of Homebuilders,<br />
September 1, 2010, retrieved March 2011, http://www.nahb.org/generic.aspxgenericContentID=143996.<br />
<strong>New</strong> <strong>Orleans</strong> <strong>Market</strong> <strong>Assessment</strong> – An Analysis of Supply and Demand Dynamics 91
Graph 14: Households by Age and Tenure, <strong>New</strong> <strong>Orleans</strong> MSA<br />
100%<br />
90%<br />
80%<br />
70%<br />
60%<br />
50%<br />
40%<br />
30%<br />
20%<br />
10%<br />
0%<br />
15 to 24<br />
years<br />
25 to 34<br />
years<br />
35 to 44<br />
years<br />
45 to 54<br />
years<br />
55 to 59<br />
years<br />
60 to 64<br />
years<br />
65 to 74<br />
years<br />
75 to 84<br />
years<br />
85 years<br />
and over<br />
Renter<br />
Owner<br />
Source: U.S. Census 2000<br />
Graph 15: Age Distribution of Renters, <strong>New</strong> <strong>Orleans</strong> MSA<br />
30%<br />
25%<br />
20%<br />
15%<br />
10%<br />
5%<br />
0%<br />
Under 25<br />
years<br />
25 to 34 35 to 44 45 to 54 55 to 64 65 to 74 75 years<br />
and over<br />
2000 2009<br />
Source: U.S. Census 2000 and 2009 American Housing Survey, <strong>New</strong> <strong>Orleans</strong><br />
<strong>New</strong> <strong>Orleans</strong> <strong>Market</strong> <strong>Assessment</strong> – An Analysis of Supply and Demand Dynamics 92
Rebuilding and the Road Home Program<br />
The Road Home Homeowner Program, commonly referred to as the “Road Home Program,” is the<br />
largest source of recovery funds for damaged housing stock post‐Hurricanes Katrina and Rita. It is not a<br />
rebuilding program per se; its original intention was to compensate homeowners for their financial loss.<br />
As a result, homeowners would be compensated whether they chose to rebuild (Option 1) or sell their<br />
property to the state (Option 2 or Option 3). The compensation calculation was based on the lesser of<br />
the pre‐storm value or estimated cost of damage minus and insurance or FEMA proceeds, with a<br />
maximum amount of $150,000. Households with incomes at or below 80% AMI qualified for an<br />
additional grant to cover gap rebuilding costs. Homeowners who chose Option 2, defined as selling the<br />
home to the State of <strong>Louisiana</strong> and relocating somewhere within the state, received full benefit, while<br />
Option 3 applicants, who sold their homes and relocated out of state, were penalized 40% of pre‐storm<br />
value when calculating the final grant amount.<br />
With the compensation structure based on pre‐storm value rather than replacement cost, the majority<br />
of homeowners could not rebuild using Road Home proceeds alone, requiring them to tap into savings<br />
or acquire additional financing. The program was later augmented to include additional grants for low<br />
income homeowners who did not have adequate funds to rebuild. As of January, 2010, almost $9 billion<br />
has been disbursed throughout <strong>Louisiana</strong>, of which $6.8 is concentrated in the <strong>New</strong> <strong>Orleans</strong><br />
metropolitan area and $3.8 billion is concentrated within the City of <strong>New</strong> <strong>Orleans</strong>. 18<br />
Table 47: Road Home Homeowner Program – Summary of Grant Amount by Parish<br />
Option 1 Option 2 Option 3 Total<br />
Jefferson $1,247,786,646 $13,391,957 $2,198,699 $1,263,377,303<br />
<strong>Orleans</strong> $3,322,836,189 $321,245,071 $108,651,276 $3,752,732,536<br />
Plaquemines $152,358,606 $13,996,882 $837,718 $167,193,206<br />
St. Bernard $607,762,061 $295,164,688 $46,473,210 $949,399,960<br />
St. John the Baptist $30,986,668 $0 $0 $30,986,668<br />
St. Tammany $658,748,985 $11,437,030 $1,779,749 $671,965,763<br />
Grand Total $6,020,479,155 $655,235,628 $159,940,652 $6,835,655,435<br />
Source: Road Home data provided by <strong>Louisiana</strong> Office of Community Development/Disaster Recovery Unit; data effective<br />
September, 2010<br />
More than five years after the storm, there are a significant number of homeowners who have yet to<br />
rebuild. There are a large number of legitimate reasons for why this is the case, including contractor<br />
fraud, a delay in receiving grant assistance, title and related legal issues, etc. But there is also a<br />
significant portion of Option 1 homeowners who have since decided to relocate elsewhere and have no<br />
intention of rebuilding. The State is currently in the process of reaching out to Option 1 households who<br />
have not yet rebuilt, offering case management services for those facing difficulty in the rebuilding<br />
18 <strong>Louisiana</strong> Office of Community Development/Disaster Recovery Unit, data available via www.road2la.org<br />
<strong>New</strong> <strong>Orleans</strong> <strong>Market</strong> <strong>Assessment</strong> – An Analysis of Supply and Demand Dynamics 93
process, and working towards transferring the remainder of properties to the State as an Option 2 or 3.<br />
In essence, these blighted homes are leaving gaps in the form and fabric of neighborhoods throughout<br />
the city. The result is a redevelopment pattern looking very much like the much dreaded “jack‐olantern”<br />
effect of vacant and abandoned property mixed in among residents who have taken the<br />
initiative and risk to rebuild. These are conditions that would be unattractive to both existing and<br />
prospective homeowners, and have the effect of reducing neighborhood property values, possibly<br />
pushing even more units into the rental stock if properties become increasingly difficult to sell. While<br />
the Road Home Option 1 properties are a fraction of the overall blight problem in the city of <strong>New</strong><br />
<strong>Orleans</strong>, it is the one target most readily remedied through existing covenants within the program.<br />
Although there is no current consensus on how this problem will be solved, it is relevant to this study<br />
because these damaged homes contribute to neighborhood blight, which in turn affects the overall<br />
desirability and recovery of an area. In Gentilly and the Lower 9 th Ward, for example, vacant Road Home<br />
properties comprise 17.5% and 27.9% of all housing stock, respectively. Both of these areas also indicate<br />
lower activity levels for all residential and commercial uses. Similarly troubling numbers of vacant Road<br />
Home properties are located in <strong>New</strong> <strong>Orleans</strong> East (13%), Lakeview (12.5%) and Bywater (10.3%).<br />
Planning District<br />
Table 48: Road Home Homeowner Program Summary by Planning District<br />
Homeowners<br />
Who Chose to<br />
Rebuild<br />
(Option 1)<br />
Active<br />
Option 1<br />
Addresses<br />
Percent<br />
Option 1<br />
Active<br />
Properties<br />
Sold to<br />
State<br />
Inactive<br />
Road Home<br />
Addresses as<br />
% all<br />
Residential<br />
1 ‐ French Quarter/CBD 18 12 66.7% 0 0.3%<br />
2 ‐ Garden District/Central City 1,496 935 62.5% 41 4.2%<br />
3 ‐ Uptown 3,851 3,157 82.0% 162 3.3%<br />
4 ‐ Mid City 4,046 3,155 78.0% 257 5.6%<br />
5 ‐ Lakeview 3,249 2,413 74.3% 581 12.5%<br />
6 ‐ Gentilly 7,293 5,765 79.0% 1,260 17.5%<br />
7 ‐ Bywater 3,512 2,503 71.3% 458 10.3%<br />
8 ‐ Lower 9th Ward 1,994 1,055 52.9% 746 27.9%<br />
9 ‐ <strong>New</strong> <strong>Orleans</strong> East 10,222 8,460 82.8% 993 13.0%<br />
10 ‐ Village De L'Est 1,401 1,217 86.9% 47 7.5%<br />
11 ‐ Viavant/Venetian Isles 328 208 63.4% 29 29.6%<br />
12 ‐ Algiers 2,608 2,367 90.8% 20 1.6%<br />
13 ‐ English Turn 37 32 86.5% 0 0.9%<br />
Undefined 7 6 85.7% 0 n/a<br />
Total 40,080 31,297 78.1% 4,594 8.8%<br />
Source: GCR & Associates, Inc. using data provided by Activity Index© and Road Home data provided by <strong>Louisiana</strong> Office of<br />
Community Development/Disaster Recovery Unit<br />
<strong>New</strong> <strong>Orleans</strong> <strong>Market</strong> <strong>Assessment</strong> – An Analysis of Supply and Demand Dynamics 94
Key Conclusions – Single Family Housing <strong>Market</strong>:<br />
<br />
<br />
While the region has not experienced the severe housing market decline that other areas of the<br />
country have, both sales prices and units sold have decreased since the post‐Katrina peak in 2006.<br />
Prices have been particularly volatile in suburban markets such as St. Tammany and Jefferson that<br />
did not experience the same level of damage as <strong>Orleans</strong> and St. Bernard. In these communities,<br />
initial price spikes have been counteracted by subsequent declines in value.<br />
Driven largely by <strong>Orleans</strong> Parish, single family housing prices increased from 2009 to 2010.<br />
<br />
<br />
<br />
<br />
<br />
While still slightly lower than national averages, foreclosure filings within the metro area have<br />
risen substantially and are near national levels in many parishes within the region.<br />
Within <strong>Orleans</strong> Parish, the greatest and most consistent increases in prices have been for those<br />
houses that are in average or better condition. The price history of poor condition homes (many of<br />
them likely flooded) has been more erratic since Katrina.<br />
Changing economic and demographic conditions and tighter lending practices will likely keep many<br />
households in the renter rather than homeowner status in the coming years.<br />
Days on the market data suggest an oversupply of for sale housing. While four months constitutes<br />
a typical supply of for sale homes, the region currently has an estimated nine months of supply.<br />
This is an inventory that is similar to national figures.<br />
While most Road Home “option 1”homeowners have rebuilt, a substantial number have not. This<br />
has implications for the residential market as well as for the health and appeal of neighborhoods<br />
struggling with the “jack‐o‐lantern” effect of blighted structures and vacant lots.<br />
<strong>New</strong> <strong>Orleans</strong> <strong>Market</strong> <strong>Assessment</strong> – An Analysis of Supply and Demand Dynamics 95
Summary of Key <strong>Market</strong> Conditions by Planning District<br />
Under current conditions, it is unlikely that there will be a shortage of rental housing in the <strong>New</strong> <strong>Orleans</strong><br />
area over the next five years. Therefore, developers cannot rely on demand alone to determine their<br />
success but must also factor in their project’s particular attributes related to location, features and<br />
target markets. To address the most critical issue – location – this report identifies four critical indicators<br />
with which to measure desirability of an area, as follows:<br />
<br />
<br />
<br />
<br />
Value of housing, as measured by sale prices and rents<br />
Area activity, as measured by occupied residential and commercial addresses<br />
Neighborhood livability, as measured by restaurants, retail, grocery stores and number of<br />
workers<br />
Public and private investment, as measured by the Road Home Program, LHFA‐funded multifamily<br />
developments, FEMA Recovery Projects and private investment<br />
The first indicator, Valuation, reconfirms what most <strong>New</strong> Orleanians already know – that the French<br />
Quarter, Garden District, Uptown, Lakeview and English Turn Planning Districts are the highest priced<br />
markets both for homeownership and rental units. What is perhaps more interesting is the change that<br />
has occurred in the markets since Hurricane Katrina. The best measure for this would be a comparison<br />
of homes categorized by the selling agents as “in excellent condition,” meaning newly remodeled and<br />
updated with all systems in working order. This measure is preferred over the complete pool of listed<br />
homes due to the glut of homes in poor or below average condition that entered the market after 2005,<br />
skewing the results. These data show that the French Quarter, CBD and Bywater all increased in value by<br />
30% to 40%, whereas Lakeview and English Turn have lost value. Even more striking, the Lower 9 th Ward<br />
increased substantially over this time period. This may be due to a shift in sales activity towards the Holy<br />
Cross neighborhood, an area with higher property values, or a reflection of an improved housing stock<br />
brought about by significant capital investment.<br />
<strong>New</strong> <strong>Orleans</strong> <strong>Market</strong> <strong>Assessment</strong> – An Analysis of Supply and Demand Dynamics 96
Planning District<br />
Table 49: Housing Price and Rent by Planning District<br />
Average<br />
Sale<br />
Price,<br />
Single<br />
Family<br />
Home,<br />
2009<br />
in<br />
average<br />
sale<br />
price,<br />
'04 ‐ '09<br />
Average<br />
Sale Price,<br />
Single<br />
Family<br />
Home in<br />
Excellent<br />
Condition,<br />
2009<br />
in<br />
Average<br />
Sale Price,<br />
Home in<br />
Excellent<br />
Condition,<br />
'04 ‐ '09<br />
in<br />
Average<br />
Sale Price<br />
per sq. ft.,<br />
Home in<br />
Excellent<br />
Condition,<br />
’04‐‘09<br />
Median<br />
Rent,<br />
1BR,<br />
2010<br />
1 French Quarter/CBD $884,375 30.1% $1,054,772 51.7% 32.3% $1,400<br />
2 Garden District/Central City $340,362 8.4% $460,528 12.0% 15.2% $750<br />
3 Uptown $352,093 7.9% $431,068 12.2% 8.1% $788<br />
4 Mid City $142,484 12.5% $205,134 10.4% 22.7% $750<br />
5 Lakeview $248,074 ‐18.2% $305,032 ‐8.1% ‐7.9% $895<br />
6 Gentilly $127,094 ‐6.5% $181,395 7.2% 3.1% $750<br />
7 Bywater $130,286 8.0% $283,576 51.9% 45.5% $650<br />
8 Lower 9th Ward $46,810 ‐9.9% $127,800 48.2% 40.9% $502<br />
9 <strong>New</strong> <strong>Orleans</strong> East $113,348 ‐6.6% $157,893 6.5% 9.2% $700<br />
10 Village De L'Est $58,129 ‐43.6% $135,633 18.3% 19.2% $400<br />
11 Viavant/Venetian Isles $235,865 40.5% $257,228 21.6% 17.8% n/a<br />
12 Algiers $141,673 ‐6.3% $186,924 4.2% 4.3% $700<br />
13 English Turn $492,938 ‐16.0% $516,139 ‐12.8% ‐11.0% $850<br />
Source: University of <strong>New</strong> <strong>Orleans</strong> Institute for Economic Development and Real Estate Research and GCR<br />
& Associates, Inc., MLS microdata from 2004 through 2010 provided by <strong>New</strong> <strong>Orleans</strong> Metropolitan<br />
Association of Realtors; median rent determined using field, phone and internet surveys.<br />
The second indicator, Activity, is measured through an index which factors in several criteria used to<br />
determine whether or not a household or business is currently occupying an address. These factors<br />
include the following:<br />
<br />
<br />
<br />
Address currently receives mail, as determined by the U.S. Postal Service;<br />
Address actively uses utility services, as determined by electricity and water usage; and<br />
Address is currently and regularly having garbage collected by the City, as determined by<br />
the City’s sanitation providers.<br />
From this data, it is not surprising to see that the areas which received the least flooding are the most<br />
active. This has been documented since 2007, as various researchers have attempted to track recovery<br />
rates by neighborhood. What is interesting about this data, particularly the residential activity, is the<br />
change that has occurred in heavily flooded areas since 2008, three years after the storm. It was at this<br />
point that extensive rebuilding activity gained momentum through the GO Zone and Road Home<br />
recovery programs. An owner’s decision to rebuild, after living elsewhere for two to three years, is<br />
reflective of that individual’s own assessment regarding the viability of his or her neighborhood. When<br />
we compare the rebuilding rates after 2008, we see that <strong>New</strong> <strong>Orleans</strong> East recovered at a faster rate<br />
than either Lakeview or Gentilly in both residential and commercial activity, and now exceeds both<br />
planning districts in the percentage of residential addresses that are active. There have also been<br />
<strong>New</strong> <strong>Orleans</strong> <strong>Market</strong> <strong>Assessment</strong> – An Analysis of Supply and Demand Dynamics 97
substantial increases in residential activity within the Lower 9 th Ward since 2008. Although this area<br />
remains the least active section of the city (32% of all residential addresses are active), the recent<br />
change indicates the commitment many households have to return. Again not surprising, the westbank<br />
of the city (Algiers and English Turn) have lost residents in recent years as displaced households have<br />
returned to recovering neighborhoods.<br />
Table 50: Activity Levels by Planning District<br />
Planning District Residential Commercial<br />
%<br />
All Active % Active<br />
%<br />
Change<br />
'08 ‐ '10 All Active % Active<br />
Change<br />
'08 ‐<br />
'10<br />
1 French Quarter/CBD 1,899 1,818 95.7% 7.9% 1,790 1,570 87.7% ‐0.3%<br />
2 Garden District/Central City 14,193 11,648 82.1% 8.2% 1,660 1,331 80.2% 3.9%<br />
3 Uptown 26,260 22,451 85.5% 2.8% 1,244 1,031 82.9% ‐5.6%<br />
4 Mid City 20,387 14,866 72.9% 15.1% 2,366 1,601 67.7% 3.2%<br />
5 Lakeview 11,296 8,095 71.7% 14.0% 361 262 72.6% ‐0.6%<br />
6 Gentilly 15,944 10,941 68.6% 16.0% 479 293 61.2% 0.4%<br />
7 Bywater 14,230 9,565 67.2% 11.6% 1,039 726 69.9% 3.5%<br />
8 Lower 9th Ward 6,029 1,948 32.3% 41.4% 232 87 37.5% ‐9.2%<br />
9 <strong>New</strong> <strong>Orleans</strong> East 21,155 15,789 74.6% 18.3% 994 644 64.8% 7.7%<br />
10 Village De L'Est 3,086 2,183 70.7% 9.2% 178 132 74.2% ‐1.1%<br />
11 Viavant/Venetian Isles 504 371 73.6% 13.5% 34 18 52.9% ‐3.2%<br />
12 Algiers 16,054 14,558 90.7% ‐0.9% 613 518 84.5% ‐8.8%<br />
13 English Turn 566 549 97.0% ‐0.7% 19 18 94.7% 13.8%<br />
Source: GCR Activity Index; compares November 2010 with August 2005.<br />
The third indicator measures a certain Quality of Life, defined in this report as a measure of access to<br />
retail establishments, grocery stores and restaurants as well as the opportunity to live in close proximity<br />
to work centers. The following summary illustrates the total number of commercial properties; retail<br />
and restaurant establishments; earnings at those establishments; and counts of employees within each<br />
planning district (all industries). Again, as would be expected, the French Quarter and CBD have the<br />
greatest concentration of employees, retail opportunities, restaurants and retail earnings. The data does<br />
reveal some surprises, though, with Mid City comparable to the Garden District and Uptown in terms of<br />
establishments and exceeding these two locations in total retail earnings. Additionally, <strong>New</strong> <strong>Orleans</strong> East<br />
and Algiers are comparable in the number of establishments, despite <strong>New</strong> <strong>Orleans</strong> East receiving<br />
substantial flooding in 2005 while Algiers remained relatively unscathed. (The earnings in <strong>New</strong> <strong>Orleans</strong><br />
East are considerably higher per establishment due to the large number of car dealerships in the area.)<br />
Unfortunately, similar to the residential recovery, very few restaurants or retail establishments have<br />
returned to the Lower Ninth Ward.<br />
A key indicator for quality of life is one’s ability to live in close proximity to job opportunities. Based on<br />
the data, the majority of jobs in <strong>New</strong> <strong>Orleans</strong> are concentrated in the French Quarter/CBD followed by<br />
Mid‐City and Uptown. Not surprisingly, these areas are the most “in demand,” commanding higher rents<br />
<strong>New</strong> <strong>Orleans</strong> <strong>Market</strong> <strong>Assessment</strong> – An Analysis of Supply and Demand Dynamics 98
and home sale prices. Many low wage workers are not able to afford living in these areas and resort to<br />
less expensive rental units in Algiers and <strong>New</strong> <strong>Orleans</strong> East, locations that oftentimes require extensive<br />
commute times.<br />
Planning District<br />
Table 51: Quality of Life Indicators by Planning District<br />
% of Pre‐<br />
Katrina<br />
Commercial<br />
Properties<br />
Currently<br />
Active<br />
Total retail<br />
establishments,<br />
restaurants and<br />
grocery stores<br />
Earnings – retail<br />
establishments,<br />
restaurants and<br />
grocery stores<br />
Employees<br />
1 French Quarter/CBD 87.7% 930 $1,041,089,000 77,670<br />
2 Garden District/Central City 80.2% 372 $606,197,000 14,413<br />
3 Uptown 82.9% 338 $715,494,000 24,339<br />
4 Mid City 67.7% 317 $1,008,541,000 45,092<br />
5 Lakeview 72.6% 71 $133,650,000 4,123<br />
6 Gentilly 61.0% 61 $100,371,000 7,904<br />
7 Bywater 69.9% 174 $539,943,000 7,127<br />
8 Lower 9th Ward 37.5% 6 $4,847,000 816<br />
9 <strong>New</strong> <strong>Orleans</strong> East 64.8% 164 $875,845,000 8,746<br />
10 Village De L'Est 74.2% 46 $76,652,000 6,613<br />
11 Viavant/Venetian Isles 52.9% 6 $6,609,000 54<br />
12 Algiers 84.5% 144 $363,071,000 8,297<br />
13 English Turn 94.7% 4 $1,854,000 73<br />
Source: GCR Activity Index and GCR & Associates, Inc. analysis of Dun and Bradstreet microdata, 2010.<br />
Finally, the fourth indicator reflects the amount of Funds Invested in each planning district as reported<br />
by the housing recovery programs (LHFA and Road Home), FEMA recovery projects and the governmentsponsored<br />
economic development initiatives within the BioDistrict, CBD and Federal City. From this<br />
data, it can be seen that both <strong>New</strong> <strong>Orleans</strong> East and Gentilly reporting a significant amount of recovery<br />
spending (exceeding $1 billion each), largely a reflection of homeowners rebuilding damaged homes<br />
using funds from the Road Home Program. Alternatively, the bulk of funds in the Garden District/Central<br />
City were directed at large‐scale multi‐family construction, which includes the Muses, Harmony Oaks<br />
and River Garden mixed income developments. The areas with the most significant infrastructure and<br />
economic development interest are in the French Quarter/CBD, Algiers and Mid City. Overall, Mid City<br />
has experienced the largest influx of rebuilding investment, with extensive residential and commercial<br />
development. This includes the LSU‐VA Complex, on the border of Mid City and the CBD, and the mixed<br />
income residential developments around Tulane Avenue (e.g. The Preserve, The Meridian, The Marquis).<br />
In fact, more than one fourth of the $11.3 billion invested in the city (not including levee repair) is within<br />
Planning District 4.<br />
<strong>New</strong> <strong>Orleans</strong> <strong>Market</strong> <strong>Assessment</strong> – An Analysis of Supply and Demand Dynamics 99
Planning District<br />
Table 52: Funds Invested by Planning District<br />
Total<br />
Development<br />
Cost, LHFA<br />
Developments<br />
Built or Under<br />
Construction<br />
Total<br />
Development<br />
Cost, Small<br />
Rental Units<br />
(Closed)<br />
Estimated Cost<br />
of Damage,<br />
Active Road<br />
Home Option 1<br />
Properties<br />
Public<br />
Investment<br />
Total<br />
1 French Quarter/CBD $163,206,077 $0 $57,557 475,321,304 $800,084,938<br />
2 Garden<br />
$346,637,162 $19,948,549 $116,434,336 35,387,733 $518,407,780<br />
District/Central City<br />
3 Uptown $36,054,449 $29,842,079 $487,847,810 29,342,431 $583,086,769<br />
4 Mid City $403,347,504 $59,362,848 $521,021,709 2,128,624,789 $3,112,356,850<br />
5 Lakeview $0 $7,828,280 $552,854,394 87,920,480 $648,603,154<br />
6 Gentilly $59,928,672 $30,624,938 $1,125,056,124 55,824,269 $1,271,434,003<br />
7 Bywater $71,839,279 $32,559,316 $427,390,218 35,934,473 $567,723,286<br />
8 Lower 9th Ward $16,641,207 $26,083,116 $187,914,424 31,879,586 $262,518,333<br />
9 <strong>New</strong> <strong>Orleans</strong> East $167,119,300 $78,404,207 $1,809,616,386 74,095,390 $2,129,235,283<br />
10 Village De L'Est $54,378,396 $4,356,173 $216,978,877 1,700,000 $277,413,446<br />
11 Viavant/Venetian<br />
$0 $0 $69,557,661 2,517,204 $72,074,865<br />
Isles<br />
12 Algiers $119,650,783 $6,634,846 $122,723,308 790,995,687 $1,040,004,624<br />
13 English Turn $0 $0 $3,776,359 0 $3,776,359<br />
Source: GCR & Associates, Inc. analysis of FEMA recovery investments;, LHFA Pipeline Report, September 2010;<br />
microdata provided by the <strong>Louisiana</strong> Office of Community Development/Disaster Recovery Unit for the Road Home<br />
Homeowner and Small Rental Program; construction cost estimates provided by the BioDistrict, Downtown<br />
Development District and Federal City for the LSU/VA Hospitals, Cancer Research Center, BioInnovation Center;<br />
expansion of World War II Museum; and Federal City.<br />
In summary, the majority of the planning districts have recovered substantially since the storm, but<br />
there are signs that indicate the market is recalibrating towards the center of the city. Home prices have<br />
significantly increased in areas east of the river that did not substantially flood, while the west bank has<br />
declined in favor despite receiving limited flood damage. Jobs, retail and non‐residential public<br />
investments are concentrating within the CBD and Mid City areas, furthering demand for this area. The<br />
exception to this is Federal City in Algiers, which may succeed in rekindling growth on the west bank if<br />
properly integrated with the community.<br />
The city’s historically black/African American middle and upper class communities ‐ <strong>New</strong> <strong>Orleans</strong> East<br />
and Gentilly ‐ show positive signs of recovery, both in terms of activity and home value. Similar to<br />
<strong>New</strong> <strong>Orleans</strong> <strong>Market</strong> <strong>Assessment</strong> – An Analysis of Supply and Demand Dynamics 100
Lakeview, both areas serve as suburban‐type communities within the city, all built in low‐lying areas and<br />
thus significantly flooded during Katrina. The three areas have recovered approximately 70% of their<br />
housing stock, yet Lakeview has fared somewhat better in the return of its neighborhood retail and<br />
services, with 73% of pre‐Katrina commercial addresses active today, compared to less than 65% for<br />
Gentilly and <strong>New</strong> <strong>Orleans</strong> East. Investors and residents have frequently mentioned this gap as limitation<br />
for continued growth, particularly in <strong>New</strong> <strong>Orleans</strong> East, where a large number of big‐box and<br />
neighborhood retailers once aggregated. With lagging commercial growth, combined with the large<br />
volume of vacant properties and the likely influx of rental housing in homes once owned, these two<br />
planning districts are susceptible to a downturn in future years.<br />
The city’s predominantly white, upper class suburban‐type communities – Lakeview and English Turn –<br />
continue to be in demand, as reflected in the sale prices of recent real estate transactions, but appear to<br />
be losing favor, with home prices dropping between 8% and 11% over a five‐year period. This may not<br />
be cause for alarm, considering the loss in home values across the country in recent years, but it is<br />
significant in comparison to the other planning districts. In comparison, Uptown remains highly valued<br />
and stable, with modestly increasing property values and a large portion of the city’s workforce (12%).<br />
Based on several indicators, it appears the Algiers Planning District is losing favor, with decreases in<br />
population, commercial activity and average sale prices. The fact that prices for homes in excellent<br />
condition increased over the five year period implies the decline may stem from an aging, hence less<br />
desirable housing stock. This is further substantiated with the high vacancy rates for multi‐family<br />
developments in the area, the majority of which were constructed twenty to thirty years ago. With<br />
increased economic development activity within Federal City and substantial conversion of older<br />
housing and commercial stock, Algiers has the capacity to reverse this decline.<br />
Unfortunately, the Lower Ninth Ward is the one planning district that has truly struggled in its recovery,<br />
with an estimated 30% of its population back. Its commercial activity is less than 40%, and average sale<br />
prices have declined over the last five years. That being said, there are some positive signs. Home prices<br />
for homes in excellent condition have increased significantly, and population growth since 2008 has<br />
exceeded all other planning districts. Although this planning district represents a fraction of its prestorm<br />
population, these recent changes indicate continued growth. How long and to what extent this<br />
growth will continue is unknown, but presumably will be determined by macro‐level events (new jobs,<br />
community services, infrastructure investment) coupled with the personal decisions of those who were<br />
displaced from the Lower Nine and face the possibility of return.<br />
<strong>New</strong> <strong>Orleans</strong> <strong>Market</strong> <strong>Assessment</strong> – An Analysis of Supply and Demand Dynamics 101
Map 4: Residential Vacancy in <strong>New</strong> <strong>Orleans</strong> by Planning District<br />
Note: Map indicates “inactive” parcels by Planning District.<br />
Source: GCR Activity Index, November 2010.<br />
Key Conclusions – <strong>Market</strong> Conditions by <strong>New</strong> <strong>Orleans</strong> Planning District:<br />
<br />
<br />
<br />
Given that there is likely a small surplus of rental housing in the regional market, developers and<br />
policy makers must carefully consider the location‐based characteristics of proposed projects. The<br />
quality of life and the market demand within various areas of the city of <strong>New</strong> <strong>Orleans</strong> vary widely.<br />
This analysis factored in a myriad of planning district‐specific characteristics including valuation,<br />
changes in residential activity, quality of life, and major public investment.<br />
Along these measures, recovery is progressing in every area of the city, but certain communities—<br />
the Lower Ninth Ward chief among them—face more formidable recovery challenges than others<br />
do.<br />
<strong>New</strong> <strong>Orleans</strong> <strong>Market</strong> <strong>Assessment</strong> – An Analysis of Supply and Demand Dynamics 102
Projected Renter Demand and Unit Absorption: 2010 to 2015<br />
As was stated previously in this report, housing markets are not perfectly synchronized with demand but<br />
instead function in a cyclical manner, marked by periods of robust residential construction activity<br />
followed by lulls in new development as excess housing supply is absorbed. This is the third construction<br />
boom in <strong>New</strong> <strong>Orleans</strong> since the 1970’s, and it is relatively modest in comparison to the previous building<br />
cycles. Largely fueled by post‐Katrina recovery investments, the building momentum is starting to wane,<br />
and the region is now left with a manageable surplus of vacant, livable housing units. Many of these<br />
vacant units will be absorbed over the next few years as the region adds households, but the rate at<br />
which surplus is absorbed is dependent on the household growth rate. Projecting household growth<br />
post‐Katrina has been a difficult task, and has largely relied on a combination of recovery trends<br />
(households returning and/or rebuilding their homes) and economic drivers.<br />
Housing markets are best characterized as a constantly changing mix of moving parts that are subject to<br />
a wide range of unpredictable forces, some of which can be quantified and calibrated, in an effort to<br />
make some guarded and informed statements about the future. These forecasts can then be used to<br />
frame decisions by those who have vested financial interests in the housing market’s performance going<br />
forward. Since the market is subject to wide variation and thus great uncertainty, the supply‐demand<br />
analysis which follows assumes at least two growth scenarios (Moderate and High) to evaluate the<br />
estimated flows of inventory into the market and absorption of it over the 2010 to 2015 period. These<br />
forecasts are informed by the various previously discussed elements of this housing market analysis and<br />
provide a basis for estimating the extent to which the rental market might be over or under‐built by the<br />
middle of the decade. These forecasts are presented at the parish level for the seven parish region and<br />
provide a macro assessment of inventory utilization with which to evaluate the advisability of making<br />
new investments designed to bring new supply into the pipeline.<br />
Growth rates and thus housing demand are ultimately driven by an expanding economic base that<br />
provides new jobs, fuels increases in household income and attracts greater private investment. Since<br />
Katrina, much of the region’s economic activity has been induced by the rebuilding and redevelopment<br />
effort in the City as well as expansions into suburban parishes in the region to accommodate the<br />
movement of people and businesses from one area to another. This activity has been fueled by massive<br />
infusions of capital to rebuild/replace destroyed housing, institutional buildings and infrastructure. By<br />
some estimates, there are approximately $25 to $30 billion of infused investments that are working<br />
their way through the economy over the next five years. 19 Additionally, post‐storm investments in<br />
facilities such as the BioInnovation Center and the <strong>Louisiana</strong> Cancer Research Center will provide a<br />
strategic nucleus for the redeveloping Biomedical District that will be anchored by a new LSU/VA<br />
19 This includes $15 billion invested by the U.S. Army Corps of Engineers for the <strong>New</strong> <strong>Orleans</strong> Metro Area Hurricane<br />
Protection System; $7 billion in Road Home funds; $1.8 billion for the <strong>New</strong> <strong>Orleans</strong> Recovery School Program; $2<br />
billion for the Huey P. Long Bridge and Twinspan expansion; $2 billion in multi‐family development, including<br />
public housing redevelopment; $1.5 billion in FEMA infrastructure funding; and $2 billion for Federal City and the<br />
LSU/VA Hospital Complex.<br />
<strong>New</strong> <strong>Orleans</strong> <strong>Market</strong> <strong>Assessment</strong> – An Analysis of Supply and Demand Dynamics 103
medical center complex, while the development of the Federal City project in Algiers will solidify the<br />
presence of government agencies and the military in the region for many years into the future.<br />
Of course these very positive economic drivers may be somewhat offset over the next five years by<br />
unfolding events that could lower job growth expectations and in fact provide periods of slow to no<br />
growth in the region. This includes, for example, the impending closure of Avondale Shipyards (currently<br />
scheduled for 2013) and the concurrent loss of 5,000 jobs and the repositioning of the Michoud<br />
Assembly Facility (MAF) as NASA pursues alternatives to the space shuttle vehicle. To mitigate the<br />
impact of potential job losses associated with these events, <strong>Louisiana</strong> Economic Development (LED)<br />
together with regional and local economic development agencies throughout the region are aggressively<br />
marketing these two facilities on a national and global scale. One recent success was the attraction of<br />
European‐based Blade Dynamics to the MAF to manufacture equipment for alternative energy wind<br />
farms. This will bring an immediate 150 to 200 jobs to the facility and as many as 600 jobs as demand for<br />
the company’s product grows.<br />
A formidable unknown for the present is the long term effects of the BP oil spill. Damage to several<br />
sectors of the fishing and shellfish harvesting industry has been severe, and the spill’s ultimate impacts<br />
may potentially be long term. The BP spill has also impacted segments of the tourism and hospitality<br />
industry and has forced marketers into an aggressive mindset to reestablish the region’s brand identity<br />
and allay fears of food contamination and contamination in <strong>New</strong> <strong>Orleans</strong> itself. ,. Overcoming negative<br />
perceptions generated by five months of non‐stop media coverage takes time and significant financial<br />
investments. While BP has committed considerable financial resources to mitigate the spill’s impacts,<br />
the passage of time is the ultimate—though not necessarily the fastest—resolution to many of the spill’s<br />
effects. At this point, the hospitality industry has weathered the spill as well as could be expected and is<br />
positioned to make an even stronger comeback if the national and global economies continue to<br />
recover. This recovery is absolutely crucial to a resurgence of convention and group meetings bookings<br />
which bring high per capita spending visitors to the city and surrounding region.<br />
The film, video and digital media sector is another which provides upside growth opportunity for the<br />
regional market. The state has aggressively courted this industry sector with generous tax credits<br />
designed to attract new investment and the creation of new high paying jobs. There are, however,<br />
doubts in the minds of some lawmakers that the sector’s job creating potential has not lived up to<br />
expectations and that in a period of state fiscal crisis, generous tax credits are a luxury that <strong>Louisiana</strong><br />
cannot afford. The upcoming legislative session might very well see proposals to suspend or reduce<br />
these and other tax credits as a means of filling a gaping $1.6 billion hole in the 2011‐2012 state<br />
operating budget. Any such move could very well slow investments in this sector with the accompanying<br />
loss of jobs.<br />
The <strong>Louisiana</strong> Workforce Commission (LWC) recently released their employment projections for 2008<br />
through 2018 by regional labor market areas (RLMAs). The <strong>New</strong> <strong>Orleans</strong> RLMA includes all of the<br />
parishes within the metropolitan area along with St. James Parish. The methodology is based on<br />
historical data and announced economic development projects as of April, 2010, further supplemented<br />
with input from regional business meetings and comments from significant <strong>Louisiana</strong> firms. Using this<br />
<strong>New</strong> <strong>Orleans</strong> <strong>Market</strong> <strong>Assessment</strong> – An Analysis of Supply and Demand Dynamics 104
methodology, the LWC estimates that the <strong>New</strong> <strong>Orleans</strong> regional employment will grow at an annual rate<br />
of only 0.3%‐‐significantly less than the 0.8% projected for <strong>Louisiana</strong> and the lowest growth rate of any<br />
economic region in the state. The projected state growth rate is less than the projected national growth<br />
rate of 1.0%, meaning <strong>Louisiana</strong> is expected to recover from the recession at a slower rate than the<br />
country as a whole.<br />
The current projections estimate an additional 17,180 jobs over the next ten years, with substantial<br />
gains in white collar and service industry jobs counterbalanced with significant job loss in blue collar<br />
industries. According to these projections, the <strong>New</strong> <strong>Orleans</strong> RLMA is slated to gain an additional 28,600<br />
jobs in health care, professional services, education and tourism industries while losing roughly 10,500<br />
jobs in manufacturing, construction, oil and gas and transportation. Using these estimates, combined<br />
with the standard ratio of 2.11 for jobs to households, the LED data indicates an increase of 21,500<br />
households over the next five years, which is less than the moderate growth scenario supplied in this<br />
analysis. As mentioned previously, an economic downturn is possible given the recently announced<br />
manufacturing losses and ramifications of the BP oil spill. This analysis does not include a breakdown of<br />
projected renters under this scenario, assuming the shifts in economic stability will cause an increase in<br />
renter demand, with more renters struggling to enter homeownership and existing homeowners or<br />
forced to relinquish their homes.<br />
A. Supply‐Demand Analysis ‐ Moderate Growth Scenario<br />
The current moderate growth scenario utilizes household projections produced by Nielsen Claritas<br />
Inc. (Claritas), a national demographic firm, as the baseline for household growth. These projections<br />
were developed using the U.S. Census, postal service information, construction statistics produced<br />
by Hanley Wood, input from local government entities, Equifax, and consultation with local data<br />
experts. 20 According to the Claritas estimates, the <strong>New</strong> <strong>Orleans</strong> MSA will add 28,795 households (of<br />
which 10,508 will be renters) over the next five years, representing an annual growth rate of 1.3%<br />
While this growth rate exceeds the growth rate from 1990 to 2000, the change in households since<br />
2005 indicates a continuing repopulation as part of the post‐Katrina recovery process. By all<br />
accounts, <strong>New</strong> <strong>Orleans</strong> has exceeded expectations of its recovery and continues to add new<br />
households at a rate exceeding pre‐Katrina growth rates. Based on the Activity Index, the estimated<br />
household growth rate from 2008 to 2009, and from 2009 to 2010, was 7% and 5%, respectively. In<br />
light of this continued population growth as part of the region’s ongoing recovery, and with an<br />
estimated 35,000 fewer renter households today than pre‐Katrina, the 1.3% annual change<br />
constitutes a conservative and reasonable estimate.<br />
Using the assumptions of future supply and obsoletion rates established in this report, this<br />
moderate growth scenario produces estimates of likely supply overhang or surplus by the year 2015<br />
for both <strong>Orleans</strong> and Jefferson Parishes. In <strong>Orleans</strong> Parish the potential surplus is estimated at 2,786<br />
20 Nielsen Claritas, PopFacts Demographics Methodology,<br />
http://www.tetrad.com/pub/documents/popfactsmeth09‐2010.pdf.<br />
<strong>New</strong> <strong>Orleans</strong> <strong>Market</strong> <strong>Assessment</strong> – An Analysis of Supply and Demand Dynamics 105
units while in Jefferson Parish the potential surplus is estimated at 1,046 units. In both cases, neither<br />
of these estimates should be considered excessive or problematic as occupancy rates should remain<br />
above 90%. Slight increases in growth rates, a faster rate of inventory removal or the reduction in<br />
anticipated entries of proposed inventory to the supply pipeline all have the potential of shrinking<br />
these estimated supply surpluses. For example, if the reported number of rental units categorized as<br />
“units with severe physical problems” were removed from the market altogether (a total of 4,909<br />
units), there would be a shortage of close to 1,500 units by 2015. 21 Alternatively, a significant shift of<br />
for‐sale properties into the rental market or new development not currently in the pipeline can<br />
increase this surplus. In each of the other parishes in the region, the estimates through 2015<br />
indicate room for the addition of new inventory to fill anticipated renter housing shortages. The<br />
highest supply gap is estimated for St. Tammany (‐996 units) followed by St. Bernard (‐357 units)<br />
and St. John the Baptist Parish (‐179 units).<br />
Table 53: Projected Household Growth, 20102015<br />
2010 2015 Change<br />
Households Renters Owners Households Renters Owners Households Renters Owners<br />
<strong>Orleans</strong> 141,177 67,140 74,037 154,590 73,556 81,034 13,413 6,416 6,997<br />
Jefferson 172,889 57,304 115,585 175,673 58,248 117,425 2,784 944 1,840<br />
Plaquemines 7,565 2,348 5,217 8,198 2,548 5,650 633 200 433<br />
St. Bernard 15,458 5,687 9,771 17,996 6,625 11,371 2,538 938 1,600<br />
St. Charles 17,791 3,068 14,723 18,411 3,177 15,234 620 109 511<br />
St. John the Baptist 16,060 3,397 12,663 16,777 3,549 13,228 717 152 565<br />
St. Tammany 86,247 18,553 67,694 94,337 20,302 74,035 8,090 1,749 6,341<br />
TOTAL 457,187 157,497 299,690 485,982 168,005 317,977 28,795 10,508 18,287<br />
Source: Nielsen Claritas, Inc.<br />
21 According to the 2009 Census American Housing Survey, 1,520 rental units in <strong>Orleans</strong>, 2,853 rental units in<br />
Jefferson, and 314 rental units in St. Tammany were determined to have severe housing problems.<br />
<strong>New</strong> <strong>Orleans</strong> <strong>Market</strong> <strong>Assessment</strong> – An Analysis of Supply and Demand Dynamics 106
Table 54: Estimated Supply, Demand and Absorption for Renter Units, Moderate Growth<br />
Scenario, 20102015<br />
2<br />
Current<br />
Vacant<br />
Units<br />
Vacant +<br />
Under<br />
Construction<br />
+<br />
Minus<br />
supply<br />
for<br />
healthy<br />
turnover<br />
5 Minus<br />
Units<br />
Leaving<br />
<strong>Market</strong><br />
Parish<br />
1 Estimated<br />
Occupancy<br />
Rate (estimate)<br />
3 Under<br />
Construction<br />
4 Anticipated<br />
2015 Anticipated (7%) (0.75%) Supply<br />
6 Demand Surplus<br />
<strong>Orleans</strong> 88% 9,155 2,302 3,658 15,115 5,341 572 9,202 6,416 2,786<br />
Jefferson 90% 6,367 33 524 6,924 4,457 478 1,990 944 1,046<br />
Plaquemines 93% 177 32 62 271 177 19 75 200 ‐125<br />
St. Bernard 93% 428 0 627 1,055 428 46 581 938 ‐357<br />
St. Charles 93% 231 21 0 252 231 25 ‐4 109 ‐113<br />
St. John the 93% 256 0 0 256 256 27 ‐27 152 ‐179<br />
Baptist<br />
St. Tammany 91% 1,835 167 331 2,333 1,427 153 753 1,749 ‐996<br />
Total 18,449 2,555 5,202 26,205 12,316 1,320 12,570 10,508 2,062<br />
1<br />
Estimated occupancy rates for <strong>Orleans</strong>, Jefferson and St. Tammany are based on University of <strong>New</strong> <strong>Orleans</strong> (UNO) Institute for Economic Development<br />
and Real Estate Research Multi‐Family Survey, conducted Fall 2010. 7% vacancy rate assumed for less populated parishes based on historic occupancy<br />
rates for the metropolitan area as determined by UNO surveys conducted since 1978.<br />
2<br />
Based on estimate of total renters by parish provided by Nielsen Claritas, Inc. 2010 divided by estimated occupancy rate.<br />
3<br />
Includes multi‐family housing funded through the <strong>Louisiana</strong> Housing Finance Agency. Source: LHFA Pipeline Report, September 2010. Based on currently<br />
available information, there are no market‐rate multi‐family developments in the construction phase at this time. This figure does not include scattered<br />
site rental properties that may be in the process of construction but are not monitored by any public or private organization.<br />
4<br />
Sources: LHFA Pipeline Report, September 2010, <strong>Louisiana</strong> Office of Community Development Small Rental Status Report, November 2010, and the<br />
Housing Authority of <strong>New</strong> <strong>Orleans</strong> Status Update, December 2010. Anticipated figure assumes the Small Rental Program will add approximately 600 units<br />
per year over the next five years, comparable to historic trends, and all LHFA and HANO developments with tax credits that have not begun construction<br />
will be constructed by 2015. Figure also includes HANO's Florida redevelopment and public scattered site properties. Figure does not include the<br />
redevelopment of Iberville or pending downtown developments that have not been awarded tax credits or obtained construction financing. Figure also<br />
does not include market‐rate small‐scale development that is currently not monitored by any public or private organization.<br />
5<br />
Represents a standard obsoletion rate for units that become uninhabitable over time. This includes properties that are demolished to make way for new<br />
development and properties that are no longer marketable due to deteriorated condition or longstanding neglect.<br />
6<br />
Estimated renter household growth provided by Nielsen Claritas Inc. 2010.<br />
Table 55: Income Distribution of Future Renters, Moderate Growth Scenario<br />
Parish 80% AMI Total<br />
<strong>Orleans</strong> 1,901 1,322 1,134 2,059 6,416<br />
Jefferson 208 163 183 390 944<br />
Plaquemines 26 34 59 81 200<br />
St. Bernard 195 166 202 374 938<br />
St. Charles 25 14 13 57 109<br />
St. John the Baptist 41 27 33 51 152<br />
St. Tammany 309 318 384 737 1,749<br />
Total 2,705 2,044 2,009 3,750 10,508<br />
Source: Income distribution by tenure uses HUD CHAS 2009 income distribution data.<br />
<strong>New</strong> <strong>Orleans</strong> <strong>Market</strong> <strong>Assessment</strong> – An Analysis of Supply and Demand Dynamics 107
Parish<br />
Table 56: Family Type of Future Renters, Moderate Growth Scenario<br />
1 Large<br />
family<br />
2 Nonfamily,<br />
elderly<br />
Renters<br />
3 Non‐family,<br />
non‐elderly<br />
4 Small<br />
family,<br />
elderly<br />
5<br />
Small<br />
family, nonelderly<br />
Total<br />
<strong>Orleans</strong> 337 827 2,783 328 2,141 6,416<br />
Jefferson 67 100 366 43 369 944<br />
Plaquemines 22 13 39 20 107 200<br />
St. Bernard 86 124 255 46 426 938<br />
St. Charles 15 8 32 4 49 109<br />
St. John the Baptist 15 9 49 2 76 152<br />
St. Tammany 104 216 608 85 736 1,749<br />
Total 645 1,298 4,133 527 3,904 10,508<br />
Source: Family type by tenure based on HUD CHAS 2009 data.<br />
1 Large Family defined as household of five or more related persons.<br />
2 Non‐Family Elderly defined as household of one or more unrelated persons in which head of household is 62<br />
years of age or older<br />
3 Non‐Family Non‐Elderly defined as household with one or more unrelated persons<br />
4 Small Family Non‐Elderly defined as household of two to four related persons where head of household is less<br />
than 62 years old<br />
5 Small Family Elderly defined as household with two to four related persons where head of household is 62<br />
years of age or older<br />
B. Supply‐Demand Analysis ‐ High Growth Scenario<br />
The demand for housing, either rentals or homeownership, will ultimately depend on local<br />
economic conditions. Fortunately the <strong>New</strong> <strong>Orleans</strong> metropolitan area was able to avoid the brunt of<br />
the “Great Recession,” with unemployment peaking at 8.1% in 2010, still below the national rate of<br />
10.6%. The construction industry, particularly infrastructure, was a significant contributor to the<br />
region’s economy, with more than $18 billion being invested in new levees, roads, bridges and<br />
pumping stations. 22 The majority of this work will continue into 2014. According to recent data<br />
provided by the <strong>Louisiana</strong> Economic Outlook for 2011‐2012, the <strong>New</strong> <strong>Orleans</strong> MSA is projected to<br />
add 8,300 jobs through 2012, even when taking into account the closure of Avondale Shipyards and<br />
reuse of the Michoud Assembly Facility/Lockheed Martin campus in <strong>New</strong> <strong>Orleans</strong> East. 23 There are<br />
several firms expanding or moving into the area, including Blade Dynamics, which will ultimately add<br />
600 manufacturing and engineering jobs, as well as an expansion of the Folgers Coffee plant, which<br />
will add an additional 450 jobs. 24 Beyond <strong>Louisiana</strong> Economic Development’s list of pending<br />
22 <strong>New</strong> <strong>Orleans</strong> City Business, “Top Ten Construction Projects, 2010,” February 22, 2010, retrieved February 2,<br />
2011, http://neworleanscitybusiness.com/wp‐files/events/construction‐2010.pdf.<br />
23 <strong>Louisiana</strong> State University E.J. Ourso College of Business, <strong>Louisiana</strong> Economic Outlook, 2011‐2012, October 14,<br />
2010, retrieved February 2, 2011,<br />
http://www.lsu.edu/ur/ocur/lsunews/MediaCenter/<strong>New</strong>s/2010/10/item20422.html.<br />
24 <strong>Louisiana</strong> Economic Development, projected employment expansions and relocations for 2010‐2011, data<br />
provided September, 2010.<br />
<strong>New</strong> <strong>Orleans</strong> <strong>Market</strong> <strong>Assessment</strong> – An Analysis of Supply and Demand Dynamics 108
elocations/expansions, there are two developments taking place that are not yet reflected in job<br />
forecasts but will add a substantial number of jobs to the area.<br />
First, the Federal City development in the Algiers neighborhood of <strong>New</strong> <strong>Orleans</strong> is estimated to add<br />
a total of 10,000 jobs once the project is completed in 2023. 25 The first phase of the development, a<br />
new headquarters for the Marine Reserve and a facility for the <strong>New</strong> <strong>Orleans</strong>‐based Coast Guard, will<br />
be completed in 2012, retaining 1,900 military positions and creating an additional 300 positions.<br />
This will be followed by additional office space to accommodate civilian contractors and other<br />
government agencies. The scope of this phase has not been fully defined.<br />
Second, the biomedical district in downtown <strong>New</strong> <strong>Orleans</strong> is slated for significant investment within<br />
its hospitals and research facilities. More than $2 billion has been committed or is currently going<br />
towards construction of a new LSU teaching hospital, VA Hospital, the <strong>Louisiana</strong> Cancer Research<br />
Center and an incubator for biomedical research and development (the BioInnovation Center). A<br />
recent economic impact analysis conducted by Dr. James Richardson of LSU provides conservative<br />
estimates of 9,800 direct job growth and an overall job growth of 22,000 attributable to the<br />
Biomedical District. The BioInnovation Center and the <strong>Louisiana</strong> Cancer Research Center are both<br />
scheduled to begin operations in 2011 and the two hospitals are scheduled to open in 2014.<br />
Although we currently do not know what the full impact will be from these two initiatives, it is<br />
reasonable to assume that the <strong>New</strong> <strong>Orleans</strong> area has the potential to exceed the current growth<br />
projection of 1.3%. For the high growth scenario, we assume an annual growth rate of 3% for <strong>New</strong><br />
<strong>Orleans</strong> and St. Tammany parishes and a 1% growth rate for Jefferson Parish. The success of these<br />
two initiatives will ultimately be based on private investment and corporate relocations, which have<br />
more to do with the national economy and the quality of life in <strong>New</strong> <strong>Orleans</strong> than the value of<br />
construction. With that said, the high growth scenario example illustrates how minor changes in<br />
population growth will determine whether or not there will be a surplus or shortfall of rental<br />
housing. Using these modestly higher growth rates, and under current projections for construction<br />
activity and development, the metropolitan area would have a potential shortfall of 5,401 rental<br />
units by the end of 2015.<br />
25 Alexandra Stroud, “Federal City is More than a Reorganized Military Base, it’s a <strong>New</strong> Town Center for Algiers,”<br />
The Examiner, April 10, 2010, retrieved February 2, 2011, http://www.examiner.com/real‐estate‐in‐neworleans/federal‐city‐is‐more‐than‐a‐reorganized‐military‐base‐it‐s‐a‐new‐town‐center‐for‐algiers.<br />
<strong>New</strong> <strong>Orleans</strong> <strong>Market</strong> <strong>Assessment</strong> – An Analysis of Supply and Demand Dynamics 109
Table 57: Estimated Supply, Demand and Absorption for Renter Units, High Growth Scenario,<br />
20102015<br />
Parish<br />
<strong>Orleans</strong><br />
Jefferson<br />
Plaquemines<br />
St. Bernard<br />
St. Charles<br />
St. John the<br />
Baptist<br />
St. Tammany<br />
Total<br />
1 Estimated<br />
Occupancy<br />
Rate<br />
2 Current<br />
Vacant<br />
Units<br />
(estimate)<br />
3 Under<br />
Construction<br />
4 Anticipated<br />
2015<br />
Vacant +<br />
Under<br />
Construction<br />
+<br />
Anticipated<br />
Minus<br />
supply for<br />
healthy<br />
turnover<br />
(7%)<br />
5 Minus<br />
Units<br />
Leaving<br />
<strong>Market</strong><br />
(0.75%) Supply<br />
6 Demand Surplus<br />
88% 9,155 2,302 3,658 15,115 5,341 572 9,202 10,694 ‐1,492<br />
90% 6,367 33 524 6,924 4,457 478 1,990 2,923 ‐933<br />
93% 177 32 62 271 177 19 75 200 ‐125<br />
93% 428 0 627 1,055 428 46 581 938 ‐357<br />
93% 231 21 0 252 231 25 ‐4 109 ‐113<br />
93% 256 0 0 256 256 27 ‐27 152 ‐179<br />
91% 1,835 167 331 2,333 1,427 153 753 2,955 ‐2,202<br />
18,449 2,555 5,202 26,205 12,316 1,320 12,570 17,971 ‐5,401<br />
1 Estimated occupancy rates for <strong>Orleans</strong>, Jefferson and St. Tammany based on University of <strong>New</strong> <strong>Orleans</strong> Real Estate Research Center<br />
multi‐family survey, conducted Fall 2010.<br />
2 Based on estimate of total renters by parish provided by Nielsen Claritas, Inc. 2010 divided by estimated occupancy rate<br />
3 Includes multi‐family housing funded through the <strong>Louisiana</strong> Housing Finance Agency. Source: LHFA Pipeline Report, September 2010.<br />
Based on currently available information, there are four multi‐family market rate developments in the construction phase at this time<br />
representing less than 500 units. This figure does not include scattered site rental properties that may be in the process of construction<br />
but are not monitored by any public or private organization.<br />
4 Sources: LHFA Pipeline Report, September 2010, <strong>Louisiana</strong> Office of Community Development Small Rental Status Report, November<br />
2010, and the Housing Authority of <strong>New</strong> <strong>Orleans</strong> Status Update, December 2010. Anticipated figure assumes the Small Rental Program will<br />
add approximately 600 units per year over the next five years, comparable to historic trends, and all LHFA and HANO developments with<br />
tax credits that have not begun construction will be constructed by 2015. Figure also includes HANO's Florida redevelopment and public<br />
scattered site properties. Figure does not include the redevelopment of Iberville or pending downtown developments that have not been<br />
awarded tax credits or obtained construction financing. Figure also does not include market‐rate small‐scale development that is currently<br />
not monitored by any public or private organization.<br />
5 Represents a standard obsoletion rate for units that become uninhabitable over time. This can include properties that are demolished to<br />
make way for new development and properties that are no longer marketable due to deteriorated condition or longstanding neglect.<br />
6 Estimated renter household growth at 3% for <strong>Orleans</strong> and St. Tammany; 1% for Jefferson. Used Nielsen Claritas estimates for all other<br />
parishes.<br />
Table 58: Estimated Income Distribution of Future Renters, High Growth Scenario<br />
Parish 80% AMI Total<br />
<strong>Orleans</strong> 3,168 2,203 1,891 3,432 10,694<br />
Jefferson 645 505 566 1,207 2,923<br />
Plaquemines 26 34 59 81 200<br />
St. Bernard 195 166 202 374 938<br />
St. Charles 25 14 13 57 109<br />
St. John the Baptist 41 27 33 51 152<br />
St. Tammany 522 537 650 1,246 2,955<br />
Total 4,622 3,486 3,414 6,449 17,971<br />
Source: Income distribution by tenure uses HUD CHAS 2009 income distribution data.<br />
<strong>New</strong> <strong>Orleans</strong> <strong>Market</strong> <strong>Assessment</strong> – An Analysis of Supply and Demand Dynamics 110
Parish<br />
Table 59: Estimated Family Type of Future Renters, High Growth Scenario<br />
1 Large family<br />
2 Non‐family,<br />
Total<br />
elderly<br />
3 Nonfamily,<br />
nonelderly<br />
4 Small<br />
family,<br />
elderly<br />
5<br />
Small<br />
family, nonelderly<br />
<strong>Orleans</strong> 561 1,379 4,638 547 3,568 10,694<br />
Jefferson 206 310 1,133 132 1,142 2,923<br />
Plaquemines 22 13 39 20 107 200<br />
St. Bernard 86 124 255 46 426 938<br />
St. Charles 15 8 32 4 49 109<br />
St. John the<br />
15 9 49 2 76 152<br />
Baptist<br />
St. Tammany 175 365 1,028 144 1,243 2,955<br />
Total 1,081 2,208 7,175 894 6,612 17,971<br />
Source: Family type by tenure based on HUD CHAS 2009 data.<br />
1 Large Family defined as household of five or more related persons.<br />
2 Non‐Family Elderly defined as household of one or more unrelated persons in which head of household is 62 years of<br />
age or older<br />
3 Non‐Family Non‐Elderly defined as household with one or more unrelated persons<br />
4 Small Family Non‐Elderly defined as household of two to four related persons where head of household is less than 62<br />
years old<br />
5 Small Family Elderly defined as household with two to four related persons where head of household is 62 years of age<br />
or older<br />
It is also worth considering the long‐term population trends of <strong>New</strong> <strong>Orleans</strong>, the region and the state as<br />
a whole in comparison with similar areas over the past twenty years. The region and state experienced<br />
almost stagnant growth pre‐Katrina despite the national migration that took place in the 1990s and<br />
2000s, where a substantial number of companies and households moved south. There are several places<br />
that were comparable in size to <strong>New</strong> <strong>Orleans</strong> as of 1990 that have experienced tremendous growth,<br />
relying on their culture, institutions, quality of life and warmer climate to attract new businesses and<br />
residents. The examples used in Graph 16 ‐ Orlando, Jacksonville, Nashville and Austin – were all smaller<br />
in size in 1990 but have grown at a rapid rate over the last twenty years and now far exceed <strong>New</strong><br />
<strong>Orleans</strong> in size. The <strong>New</strong> <strong>Orleans</strong> region did not participate in this expansive growth for a myriad of<br />
reasons. The limitations of the area’s current industries are a predominant factor, but certain quality of<br />
life indicators (crime and schools, most notably) also served as a deterrent for corporate relocations.<br />
Capitalizing on the post‐Katrina recovery, the City, State and Federal resources are intended to not just<br />
rebuild the region but also to improve the overall quality of life. This should also have the effect of<br />
improving the economic prospects of the region. Tens of billions in construction activity are targeted<br />
towards high‐wage growth industries, new housing, schools, parks and public facilities, as a catalyst for<br />
growth similar to the region’s southern neighbors. Consequently, it could be argued that <strong>New</strong> <strong>Orleans</strong><br />
might very well be positioned to enjoy growth comparable to the experience of some of its “sister” cities<br />
in the South and Southwest.<br />
<strong>New</strong> <strong>Orleans</strong> <strong>Market</strong> <strong>Assessment</strong> – An Analysis of Supply and Demand Dynamics 111
Graph 16: Change in Households, 1990 2009<br />
2009 2000 1990<br />
<strong>New</strong> <strong>Orleans</strong> MSA<br />
Orlando MSA<br />
Nashville MSA<br />
Jacksonville MSA<br />
Austin MSA<br />
435,086<br />
505,579<br />
455,178<br />
740,669<br />
625,248<br />
401,659<br />
598,055<br />
479,569<br />
375,831<br />
505,657<br />
425,584<br />
343,526<br />
614,047<br />
471,855<br />
303,871<br />
Key Conclusions – Projected Renter Demand and Unit Absorption, 2010 to 2015:<br />
<br />
<br />
<br />
<br />
The fundamental drivers of demand for rental housing in the <strong>New</strong> <strong>Orleans</strong> region will be economic<br />
growth and an accompanying increase in households.<br />
Under a moderate growth scenario—utilizing household projections from Nielsen Claritas—there<br />
would be a minor surplus of rental housing in the metropolitan region, though occupancy rates<br />
would be above 90%.<br />
Under a somewhat more aggressive scenario—one that hinges on stronger economic and<br />
population growth—the region would have an apartment deficit of approximately 5,400 units in<br />
2015.<br />
If key potential economic drivers in the region truly take hold—such as the biomedical industry,<br />
the film industry, and the Federal City complex—the region could more closely mimic the growth<br />
patterns experienced by other southern cities over the past twenty years, thereby producing a<br />
stronger rental market than even the high growth scenario within this report.<br />
<strong>New</strong> <strong>Orleans</strong> <strong>Market</strong> <strong>Assessment</strong> – An Analysis of Supply and Demand Dynamics 112
Conclusion<br />
Incentive‐driven surges of new apartment construction are part of the history of the <strong>New</strong> <strong>Orleans</strong><br />
housing market. There were two extraordinary periods of new inventory additions in the 1970’s and<br />
1980’s which added record numbers of new multi‐family units in a relatively brief period (three to four<br />
years). These inflows of new units were followed by adjustment periods which saw occupancy and rents<br />
fall as the normal course of population and economic growth restored balance to the marketplace.<br />
These adjustment periods were not without financial pain for investors and lenders which in some ways<br />
contributed to the difficulty in attracting private capital to develop and build new apartment properties<br />
during the 1990’s.<br />
The most recent surge of incentive‐driven new supply has not approached volume levels reached in the<br />
past nor has it generated extraordinary imbalances such as those experienced during the 1970’s and<br />
1980’s. <strong>New</strong> inventory additions, both market rate and subsidized, are being well received as indicated<br />
by their absorption rates during initial rent‐up and their now near stabilized 93% average occupancy.<br />
This is most notable in properties located in the CBD, Uptown and Mid‐City sectors of the market where<br />
the majority of the new construction has occurred.<br />
Older and less competitively positioned apartment communities are facing challenges in attracting and<br />
retaining tenants, particularly in the Algiers, Kenner and <strong>New</strong> <strong>Orleans</strong> East sectors of the market. To<br />
some extent, the competitive difficulties some properties face are somewhat self‐inflicted as a result of<br />
poor or deferred maintenance and a failure to remediate functional obsolescence or to upgrade<br />
amenities and services offered. The competitiveness of these older properties (many which were built<br />
during the 1970’s and 1980’s) is being further weakened by a better than expected recovery and<br />
rebuilding of small (two to four unit) rental properties and the entry of slow‐to‐sell single family homes<br />
into the rental stock. The latter are competitively priced to attract households whose needs are better<br />
served by a property in a lower density living environment, offering a private yard and more storage<br />
space as well as proximity and accessibility to neighborhood level services and conveniences, schools<br />
and public transportation. One to four family rental units satisfy these consumer preferences and are<br />
well distributed across a variety of neighborhoods throughout the <strong>New</strong> <strong>Orleans</strong> region.<br />
Although the majority of the City’s planning districts have experienced significant recovery since the<br />
storm there are several that have recovered more quickly and more extensively than others. This is<br />
particularly true in the CBD, Garden District/Central City and Mid‐City areas, where significant capital<br />
investments have been focused to rebuild critical elements of the region’s institutional and commercial<br />
infrastructure. These same areas have also been the recipients of many newly developed housing<br />
communities that have taken advantage of post‐storm financial incentives to offer high quality living<br />
environments that are readily accessible to the City’s core of business and commercial activity as well as<br />
an eclectic mix of restaurants and entertainment venues that very much contribute to the <strong>New</strong> <strong>Orleans</strong><br />
identity. Housing demand in these areas remains comparatively strong when measured in terms of<br />
prices, rent and occupancy levels.<br />
<strong>New</strong> <strong>Orleans</strong> <strong>Market</strong> <strong>Assessment</strong> – An Analysis of Supply and Demand Dynamics 113
There are areas of the City, however, that continue to struggle through the redevelopment and<br />
rebuilding process or that have lost momentum in the past two years as other stronger areas have<br />
moved forward more rapidly. Areas which fall into the first category include the Lower 9 th Ward and<br />
<strong>New</strong> <strong>Orleans</strong> East, while Algiers falls into the second category. Despite the best efforts of a broad crosssection<br />
of interests, the Lower 9 th Ward has recovered about 30% of its pre‐storm population and about<br />
40% of its business and commercial activity. This area was economically stressed before Katrina and the<br />
extensive flooding and destruction it experienced only added more injury to a struggling group of<br />
neighborhoods. Their continued recovery and rebuilding will be a challenge and will likely take longer<br />
than other areas of the City.<br />
<strong>New</strong> <strong>Orleans</strong> East, although it has regained about 70% of its pre‐storm population lags behind in its<br />
recovery of business and commercial activity as well as the restoration of critical community services<br />
such as hospitals. Consequently, the area lacks some essential elements of neighborhood cohesion that<br />
provide for a better quality of life for its residents and that provide a critical mass of jobs and<br />
employment opportunities for those who live in or would be attracted to the area. This is especially<br />
problematic for renter households seeking jobs in sectors such as retail, restaurants or services where<br />
opportunities are currently somewhat limited. This impacts newly built and rebuilt apartment<br />
communities in this area of the City.<br />
Algiers, which received an immediate post‐storm surge of growth, is now lagging behind other planning<br />
districts in terms of population growth, housing demand and commercial activity. Its challenges<br />
regarding housing demand are best evidenced by weakened average sales prices for single family homes<br />
as well as declining average rent and occupancy levels in rental apartments. As troubling as these trends<br />
are they may very well be relatively short‐lived as the Algiers area begins to realize the economic<br />
benefits of the Federal City development. This is a long term project that will help stabilize the area’s<br />
economy and provide a wide range of civilian job opportunities for residents. In the short term,<br />
however, competitive pressures are likely to create more rent and occupancy challenges for property<br />
owners.<br />
<strong>New</strong> <strong>Orleans</strong> <strong>Market</strong> <strong>Assessment</strong> – An Analysis of Supply and Demand Dynamics 114
Acknowledgments<br />
The authors of this report benefitted from the tremendous cooperation of the owners and managers of<br />
apartment properties throughout the <strong>New</strong> <strong>Orleans</strong> area. To them, we express our great appreciation<br />
and gratitude. We would also like to express our appreciation to organizations or agencies which<br />
provided information used in this report. This includes the LHFA, OCD/DRU, the Housing Authority of<br />
<strong>New</strong> <strong>Orleans</strong> (HANO), the <strong>Louisiana</strong> State Tax Commission and the <strong>New</strong> <strong>Orleans</strong> Metropolitan<br />
Association of Realtors (NOMAR).<br />
<strong>New</strong> <strong>Orleans</strong> <strong>Market</strong> <strong>Assessment</strong> – An Analysis of Supply and Demand Dynamics 115
APPENDIX<br />
<strong>New</strong> <strong>Orleans</strong> <strong>Market</strong> <strong>Assessment</strong> – An Analysis of Supply and Demand Dynamics 116
Table A1: <strong>New</strong> <strong>Orleans</strong> Metropolitan Area – Apartment Occupancy History, 19741979<br />
1974 1975<br />
1976<br />
1977<br />
1978<br />
1979<br />
Parish/Area Units Occupancy Units Occupancy Units Occupancy Units Occupancy Units Occupancy Units Occupancy<br />
<strong>Orleans</strong> Parish NA 78.1% NA 85.4% 12,531 94.6% 13,101 98.4% 13,101 98.4% 12,015 96.0%<br />
Jefferson Parish NA 87.5% NA 88.8% 15,462 95.6% 16,705 97.9% 16,705 97.9% 19,152 97.2%<br />
St. Tammany Parish NA NA NA NA NA NA 0 NA 0 NA 80 100.0%<br />
<strong>New</strong> <strong>Orleans</strong> Metro Total NA 82.8% NA 87.1% 27,993 95.1% 29,806 98.2% 29,806 98.2% 31,247 97.7%<br />
Excluding Elderly & Fed. Subsidized<br />
Elderly NA NA NA NA NA NA NA NA NA NA NA NA<br />
Fed. Subsidized NA NA NA NA NA NA NA NA NA NA NA NA<br />
<strong>New</strong> <strong>Orleans</strong> Metro Total NA 82.8% NA 87.1% 27,993 95.1% 29,806 98.2% 16,705 98.2% 31,247 97.7%<br />
Table A2: <strong>New</strong> <strong>Orleans</strong> Metropolitan Area – Apartment Occupancy History, 1980 – 1989<br />
1980 1981 1982 1983 1984<br />
Parish/Area Units Occupancy Units Occupancy Units Occupancy Units Occupancy Units Occupancy<br />
<strong>Orleans</strong> Parish 8,704 98.3% 9,369 96.6% 8,954 96.3% 11,300 93.8% 14,126 85.2%<br />
Jefferson Parish 14,572 97.2% 16,873 97.5% 18,039 95.0% 18,624 95.4% 20,012 89.9%<br />
St. Tammany Parish 80 100.0% 199 99.5% 912 94.2% 854 92.4% 949 83.0%<br />
<strong>New</strong> <strong>Orleans</strong> Metro Total 23,356 98.5% 26,441 97.9% 27,905 95.2% 30,778 93.9% 35,087 86.0%<br />
Excluding Elderly & Fed. Subsidized<br />
Elderly NA NA NA NA NA NA NA NA NA NA<br />
Fed. Subsidized NA NA NA NA NA NA NA NA NA NA<br />
<strong>New</strong> <strong>Orleans</strong> Metro Total 23,356 98.5% 26,441 97.9% 27,905 95.2% 30,778 93.9% 35,087 86.0%<br />
1985 1986 1987 1988 1989<br />
Parish/Area Units Occupancy Units Occupancy Units Occupancy Units Occupancy Units Occupancy<br />
<strong>Orleans</strong> Parish 14,842 84.6% 16,740 78.9% 20,376 77.8% 21,827 81.9% 22,273 80.0%<br />
Jefferson Parish 20,209 88.3% 23,995 82.7% 25,643 84.7% 34,488 85.8% 35,601 87.6%<br />
St. Tammany Parish 814 84.0% 432 77.3% 887 75.6% 416 88.9% 460 87.6%<br />
<strong>New</strong> <strong>Orleans</strong> Metro Total 35,865 85.6% 41,167 79.6% 46,906 79.4% 56,731 85.5% 58,334 85.1%<br />
Excluding Elderly & Fed. Subsidized<br />
Z Elderly NA NA NA NA NA NA 1,923 97.5% 1,909 92.6%<br />
Y Fed. Subsidized NA NA NA NA NA NA NA NA NA NA<br />
<strong>New</strong> <strong>Orleans</strong> Metro Total 35,865 85.6% 41,167 79.6% 46,906 79.4% 58,654 91.5% 60,243 88.8%<br />
<strong>New</strong> <strong>Orleans</strong> <strong>Market</strong> <strong>Assessment</strong> – An Analysis of Supply and Demand Dynamics 117
Table A3: <strong>New</strong> <strong>Orleans</strong> Metropolitan Area – Apartment Occupancy History, 1990 1999<br />
1990 1991 1992 1993 1994<br />
Parish/Area Units Occupancy Units Occupancy Units Occupancy Units Occupancy Units Occupancy<br />
<strong>Orleans</strong> Parish 18,482 78.5% 14,198 88.1% 13,098 84.7% 15,379 88.5% 15,100 89.4%<br />
Jefferson Parish 24,077 89.0% 19,609 92.7% 21,382 91.5% 21,002 92.7% 20,936 94.5%<br />
St. Tammany Parish 888 94.4% 371 99.5% 735 98.4% 758 98.4% 735 98.5%<br />
<strong>New</strong> <strong>Orleans</strong> Metro Total 43,447 87.3% 34,178 93.4% 35,215 91.5% 37,139 93.2% 36,771 94.1%<br />
Excluding Elderly & Fed. Subsidized<br />
Elderly 1,940 92.7% 1,468 95.0% 1,924 96.7% 1,789 98.0% 1,789 98.0%<br />
Fed. Subsidized NA NA NA NA 636 98.3% 636 96.8% 636 96.8%<br />
<strong>New</strong> <strong>Orleans</strong> Metro Total 45,387 90.0% 35,646 94.2% 37,775 94.5% 39,564 95.3% 39,196 95.8%<br />
1995 1996 1997 1998 1999<br />
Parish/Area Units Occupancy Units Occupancy Units Occupancy Units Occupancy Units Occupancy<br />
<strong>Orleans</strong> Parish 15,162 90.7% 14,193 87.7% 14,567 87.6% 14,075 89.4% 14,146 91.6%<br />
Jefferson Parish 20,948 94.9% 20,908 94.3% 21,933 95.0% 21,759 95.7% 21,653 95.3%<br />
St. Tammany Parish 740 92.0% 752 92.5% 788 95.0% 812 97.8% 842 95.1%<br />
<strong>New</strong> <strong>Orleans</strong> Metro Total 36,850 92.5% 35,853 91.5% 37,288 92.5% 36,646 97.8% 36,641 94.0%<br />
Excluding Elderly & Fed. Subsidized<br />
Elderly 1,828 96.8% 1,790 96.9% 1,790 98.2% 1,904 96.9% 1,904 98.0%<br />
Fed. Subsidized 636 96.7% 636 99.2% 636 99.6% 636 97.7% 636 97.7%<br />
<strong>New</strong> <strong>Orleans</strong> Metro Total 39,314 94.5% 38,279 94.8% 39,714 95.7% 39,186 97.6% 39,181 95.9%<br />
<strong>New</strong> <strong>Orleans</strong> <strong>Market</strong> <strong>Assessment</strong> – An Analysis of Supply and Demand Dynamics 118
Table A4: <strong>New</strong> <strong>Orleans</strong> Metropolitan Area – Apartment Occupancy History, 2000 – 2008<br />
2000 2001 2002 2003 2004<br />
Parish/Area Units Occupancy Units Occupancy Units Occupancy Units Occupancy Units Occupancy<br />
<strong>Orleans</strong> Parish 14,136 93.9% 13,618 94.2% 13,618 93.8% 14,041 94.4% 14,111 94.8%<br />
Jefferson Parish 25,970 94.3% 23,197 94.2% 23,197 94.1% 22,138 94.1% 21,928 94.7%<br />
St. Tammany Parish 1,172 97.8% 1,239 98.2% 1,239 96.2% 1,570 94.5% 2,066 95.6%<br />
<strong>New</strong> <strong>Orleans</strong> Metro Total 41,278 95.3% 38,054 95.5% 38,054 94.7% 37,749 94.3% 38,105 95.0%<br />
Excluding Elderly & Fed. Subsidized<br />
Elderly 1,906 97.6% 1,910 97.8% 1,910 96.0% 1,911 94.1% 1,909 94.8%<br />
Fed. Subsidized 636 96.0% 636 96.1% 636 95.0% 636 99.6% 636 99.6%<br />
<strong>New</strong> <strong>Orleans</strong> Metro Total 43,820 96.1% 40,600 96.2% 40,600 95.1% 40,296 95.6% 40,650 96.1%<br />
2005 (Pre‐K) 2005 (Post‐K) 2006 2007<br />
2008<br />
Parish/Area Units Occupancy Units Occupancy Units Occupancy Units Occupancy Units Occupancy<br />
<strong>Orleans</strong> Parish 11,436 94.5% 3,033 87.5% 12,343 88.2% 12,252 84.4% 10,007 85.3%<br />
Jefferson Parish 14,849 94.6% 10,789 99.6% 22,722 93.6% 20,757 93.6% 22,481 90.1%<br />
St. Tammany Parish 2,066 88.4% 1,962 98.7% 2,305 97.9% 2,260 91.6% 2,685 81.6%<br />
<strong>New</strong> <strong>Orleans</strong> Metro Total 28,351 92.5% 15,784 95.3% 37,370 93.2% 35,269 89.9% 35,173 85.7%<br />
Excluding Elderly & Fed. Subsidized<br />
Elderly 458 94.5% NA 0.0% 117 77.0% 1,522 91.7% 1,123 81.0%<br />
Fed. Subsidized 524 100.0% 105 100.0% 248 100.0% 380 100.0% 380 98.7%<br />
<strong>New</strong> <strong>Orleans</strong> Metro Total 29,333 94.9% 15,889 97.6% 37,735 91.0% 37,171 92.9% 36,676 87.8%<br />
Source: University of <strong>New</strong> <strong>Orleans</strong> Real Estate Research Center, <strong>New</strong> <strong>Orleans</strong> Metropoli tan Real Estate <strong>Market</strong> Analysis Reports<br />
<strong>New</strong> <strong>Orleans</strong> <strong>Market</strong> <strong>Assessment</strong> – An Analysis of Supply and Demand Dynamics 119
Table A5: <strong>New</strong> <strong>Orleans</strong> Metropolitan Area – Apartment Rent History, 1974 – 1979<br />
1974 1975 1976 1977 1978 1979<br />
Parish/Area Units Rent Units Rent Units Rent Units Rent Units Rent Units Rent<br />
<strong>Orleans</strong> Parish NA NA NA NA 12,531 $217 13,101 $217 13,101 $217 12,015 $249<br />
Jefferson Parish NA NA NA NA 15,462 $181 16,705 $216 16,705 $216 19,152 $263<br />
St. Tammany Parish NA NA NA NA NA NA 0 NA 0 NA 80 NA<br />
<strong>New</strong> <strong>Orleans</strong> Metro Total NA NA NA NA 27,993 $199 29,806 $217 29,806 $217 31,167 $256<br />
Table A6: <strong>New</strong> <strong>Orleans</strong> Metropolitan Area – Apartment Rent History, 1980 1989<br />
1980 1981 1982 1983 1984<br />
Parish/Area Units Rent Units Rent Units Rent Units Rent Units Rent<br />
<strong>Orleans</strong> Parish 8,704 $269 9,369 $326 8,954 $347 11,300 $360 14,126 $396<br />
Jefferson Parish<br />
Jefferson Parish 14,572 $291 16,873 $322 18,039 $340 18,624 $357 20,012 $349<br />
St. Tammany Parish 80 NA 199 $351 912 $361 854 $338 949 $369<br />
<strong>New</strong> <strong>Orleans</strong> Metro Total 23,356 $280 26,441 $333 27,905 $349 30,778 $352 35,087 $371<br />
1985 1986 1987 1988 1989<br />
Parish/Area Units Rent Units Rent Units Rent Units Rent Units Rent<br />
<strong>Orleans</strong> Parish 14,842 $396 16,740 $376 20,376 $396 21,827 $360 22,273 $361<br />
Jefferson Parish 20,209 $347 23,995 $334 25,643 $356 34,488 $349 35,601 $355<br />
St. Tammany Parish 814 $362 432 $342 887 $325 416 $314 460 $342<br />
<strong>New</strong> <strong>Orleans</strong> Metro Total 35,865 $368 41,167 $351 46,906 $359 56,731 $341 58,334 $353<br />
<strong>New</strong> <strong>Orleans</strong> <strong>Market</strong> <strong>Assessment</strong> – An Analysis of Supply and Demand Dynamics 120
Table A7: <strong>New</strong> <strong>Orleans</strong> Metropolitan Area – Apartment Rent History, 1990 1999<br />
1990 1991 1992 1993 1994<br />
Parish/Area Units Rent Units Rent Units Rent Units Rent Units Rent<br />
<strong>Orleans</strong> Parish 18,482 $362 14,198 $416 13,098 $414 15,379 $433 15,100 $436<br />
Jefferson Parish 24,077 $378 19,609 $405 21,382 $427 21,002 $423 20,936 $440<br />
St. Tammany Parish 888 $352 371 $364 735 $379 758 $393 735 $423<br />
<strong>New</strong> <strong>Orleans</strong> Metro Total 43,447 $364 34,178 $395 35,215 $407 37,139 $416 36,771 $433<br />
1995 1996 1997 1998 1999<br />
Parish/Area Units Rent Units Rent Units Rent Units Rent Units Rent<br />
<strong>Orleans</strong> Parish 15,162 $450 14,193 $471 14,567 $491 14,075 $497 14,146 $508<br />
Jefferson Parish 20,948 $458 20,908 $472 21,933 $485 21,759 $496 21,653 $506<br />
St. Tammany Parish 740 $444 752 $461 788 $482 812 $492 842 $504<br />
<strong>New</strong> <strong>Orleans</strong> Metro Total 36,850 $451 35,853 $468 37,288 $486 36,646 $495 36,641 $506<br />
Table A8: <strong>New</strong> <strong>Orleans</strong> Metropolitan Area – Apartment Rent History, 2000 – 2008<br />
2000 2001 2002 2003 2004<br />
Parish/Area Units Rent Units Rent Units Rent Units Rent Units Rent<br />
<strong>Orleans</strong> Parish 14,136 $528 13,618 $547 13,618 $585 14,041 $590 14,111 $767<br />
Jefferson Parish 25,970 $589 23,197 $604 23,197 $545 22,138 $566 21,928 $658<br />
St. Tammany Parish 1,172 $541 1,239 $560 1,239 $618 1,570 $651 1,493 $709<br />
<strong>New</strong> <strong>Orleans</strong> Metro Total 41,278 $553 38,054 $570 38,054 $583 37,749 $602 37,532 $711<br />
2005 (Pre‐K) 2005 (Post‐K) 2006 2007 2008<br />
Parish/Area Units Rent Units Rent Units Rent Units Rent Units Rent<br />
<strong>Orleans</strong> Parish 11,436 $818 3,033 $1,055 12,343 $1,000 12,252 $1,150 10,007 $1,167<br />
Jefferson Parish 14,849 $699 10,789 $784 22,722 $850 20,757 $872 22,481 $950<br />
St. Tammany Parish 2,541 $803 1,993 $981 2,009 $966 2,260 $961 2,685 $1,014<br />
<strong>New</strong> <strong>Orleans</strong> Metro Total 28,826 $773 15,815 $940 37,074 $939 35,269 $994 35,173 $1,044<br />
Source: University of <strong>New</strong> <strong>Orleans</strong> Real Estate Research Center, <strong>New</strong> <strong>Orleans</strong> Metropoli tan Real Estate <strong>Market</strong> Analysis Reports<br />
<strong>New</strong> <strong>Orleans</strong> <strong>Market</strong> <strong>Assessment</strong> – An Analysis of Supply and Demand Dynamics 121
Table A9: Permit and Employment Trends, <strong>New</strong> <strong>Orleans</strong> Metropolitan Area: 1970 – 2009<br />
Year<br />
Single<br />
Family<br />
Multifamily<br />
Total<br />
Multfamily<br />
Percent of<br />
Total<br />
Employment<br />
Total<br />
Change<br />
Ten Year<br />
Average<br />
Percent<br />
Change<br />
1970 5,361 3,836 9,197 41.7 457,888 1,814 -8.83<br />
1971 5,379 10,604 15,983 66.3 459,400 1,512 0.33<br />
1972 7,417 9,579 16,996 56.4 474,487 15,087 3.28<br />
1973 4,409 7,039 11,448 61.5 494,110 19,623 4.14<br />
1974 3,496 1,384 4,880 28.4 506,549 12,439 2.52<br />
1975 3,970 748 4,718 15.9 520,111 13,562 2.68<br />
1976 5,640 1,673 7,313 22.9 539,259 19,148 3.68<br />
1977 7,169 5,825 12,994 44.8 554,492 15,233 2.82<br />
1978 6,397 3,884 10,281 37.8 576,220 21,728 3.92<br />
1979 5,618 3,990 9,608 41.5 592,183 15,963 2.77<br />
Total Change Emp 136,109 13,611 2.63<br />
Total Permits Issued:<br />
1970's<br />
54,856 48,562 103,418 47.0<br />
Average<br />
Employment: 1970's<br />
517,470<br />
Ten Year<br />
Average<br />
13.01<br />
1980 4,319 4,114 8,433 48.8 612,889 20,706 3.50<br />
1981 3,568 3,358 6,926 48.5 627,275 14,386 2.35<br />
1982 4,119 2,463 6,582 37.4 619,602 (7,673) -1.22<br />
1983 6,853 6,452 13,305 48.5 604,548 (15,054) -2.43<br />
1984 5,900 4,163 10,063 41.4 616,468 11,920 1.97<br />
1985 4,196 3,110 7,306 42.6 602,972 (13,496) -2.19<br />
1986 3,271 603 3,874 15.6 583,813 (19,159) -3.18<br />
1987 3,089 189 3,278 5.8 572,236 (11,577) -1.98<br />
1988 2,216 481 2,697 17.8 580,952 8,716 1.52<br />
1989 1,975 470 2,445 19.2 588,278 7,326 1.26<br />
Total Change Emp (3,905) (391) -0.06<br />
Total Permits Issued<br />
1980's<br />
39,506 25,403 64,909 39.1<br />
Average Change in<br />
Employment: 1980's<br />
600,903<br />
Ten Year<br />
Average<br />
16.12<br />
1990 1,979 303 2,282 13.3 598,593 10,315 1.75<br />
1991 2,340 140 2,480 5.6 600,109 1,516 0.25<br />
1992 3,031 261 3,292 7.9 601,447 1,338 0.22<br />
1993 3,373 260 3,633 7.2 605,518 4,071 0.68<br />
1994 3,622 508 4,130 12.3 618,093 12,575 2.08<br />
1995 3,268 752 4,020 18.7 630,917 12,824 2.07<br />
1996 3,682 1,055 4,737 22.3 634,950 4,033 0.64<br />
1997 3,597 460 4,057 11.3 644,294 9,344 1.47<br />
1998 3,678 731 4,409 16.6 651,425 7,131 1.11<br />
1999 3,777 603 4,380 13.8 652,580 1,155 0.18<br />
Total Change Emp 64,302 6,430 1.03<br />
Total Permits Issued:<br />
1990's<br />
32,347 5,073 37,420 13.6<br />
Average Change in<br />
Employment: 1990's<br />
623,793<br />
Ten Year<br />
Average<br />
3.81<br />
2000 1,691 694 2,385 29.1 656,124 4,699 0.54<br />
2001 3,518 949 4,467 21.2 655,362 (762) -0.12<br />
2002 4,357 1,057 5,414 19.5 647,894 (7,468) -1.14<br />
2003 5,386 772 6,158 12.5 649,034 1,140 0.18<br />
2004 5,792 702 6,494 10.8 651,658 2,624 0.40<br />
2005 4,660 293 4,953 5.9 594,688 (56,970) -8.74<br />
2006 5,100 659 5,759 11.4 519,982 (74,706) -12.56<br />
2007 4,041 3,025 7,066 42.8 552,958 32,976 6.34<br />
2008 2,793 2,037 4,830 42.2 565,316 12,358 2.23<br />
2009 2,231 646 2,877 22.5 555,100 * (10,216) -1.81<br />
Total Change Emp (96,325) (9,633) -1.59<br />
Total Permits Issued:<br />
2000's<br />
39,569 10,834 50,403 21.5<br />
Average Change in<br />
Employment: 2000's<br />
*2009 employment data is estimated<br />
604,812 -3.04<br />
<strong>New</strong> <strong>Orleans</strong> <strong>Market</strong> <strong>Assessment</strong> – An Analysis of Supply and Demand Dynamics 122
Table A10: <strong>New</strong> <strong>Orleans</strong> Apartment Survey Summary, <strong>Market</strong> Rate Occupancy, Units<br />
Available and Units Offline: 2008 – 2009<br />
Occupancy 2010<br />
2008 2009 2010<br />
Total Units<br />
Surveyed<br />
Total Units<br />
Not<br />
Responding<br />
Units<br />
Offline<br />
Units to be<br />
Demolished<br />
Total Units<br />
Available<br />
Reporting<br />
<strong>New</strong> <strong>Orleans</strong><br />
A Uptown 93.0% NA 92.8% 534 37 2 495<br />
B Mid-City 77.6% 90.6% 91.9% 1,704 150 2 1,552<br />
C Lake Forest 72.2% 80.1% 82.0% 4,316 517 6 3,793<br />
D NO East NA NA 84.0% 322 116 0 206<br />
E Algiers 94.5% 83.3% 76.7% 3,189 966 0 2,223<br />
M Warehouse District 89.0% 92.7% 95.9% 1,517 0 7 1,510<br />
Parish Total<br />
85.3% 86.7% 87.2% 11,582 1,786 17 9,779<br />
St. Tammany<br />
F East St. Tammany 91.3% 87.9% 88.7% 1,291 0 1 1,290<br />
N West St. Tammany 71.8% 88.6% 93.3% 1,450 0 5 1,445<br />
Parish Total<br />
81.6% 88.3% 91.0% 2,741 0 6 2,735<br />
Jefferson<br />
G Kenner 86.2% 81.9% 83.9% 4,165 0 69 4,096<br />
H West Metairie 90.4% 87.9% 91.6% 7,929 170 118 7,641<br />
I East Metairie 92.8% 91.5% 94.5% 1,836 97 34 1,705<br />
J River Ridge 88.9% 85.4% 89.5% 3,657 62 1 3,594<br />
K Harvey Canal West NA 91.0% NA 484 100 384 0<br />
L Harvey Canal East 92.1% 91.1% 92.4% 5,332 415 296 4,621<br />
Parish Total<br />
90.1% 88.1% 90.4% 23,403 844 902 21,657<br />
<strong>New</strong> <strong>Orleans</strong> Metro Total<br />
Excluding Rent Asst./Fed. Subsidized 86.7% 87.7% 89.0% 37,726 2,630 925 34,171<br />
Rent Assisted/Federall Subsidized<br />
Including Elderly 88.6% 95.6% 96.1% 3,256 401 0 2,855<br />
<strong>New</strong> <strong>Orleans</strong> Metro Total 86.8% 88.3% 89.5% 40,982 3,031 925 0 37,026<br />
Source: Survey of property owners and managers compiled by the UNO Institute for Economic Development & Real Estate Research<br />
<strong>New</strong> <strong>Orleans</strong> <strong>Market</strong> <strong>Assessment</strong> – An Analysis of Supply and Demand Dynamics 123
Table A11: <strong>New</strong> <strong>Orleans</strong> Apartment Survey, <strong>Market</strong> Rate Rent Summary: 2008 – 2010<br />
Number of Units<br />
Reporting Rent<br />
Average Size Average Rent<br />
Ave Rent Change Avg Pr Sq/Ft<br />
(Square Feet)<br />
(Dollars)<br />
2008 vs. 2009 2009 vs. 2010<br />
(Cents)<br />
Area 2008 2009 2010 2008 2009 2010 2008 2009 2010 Dollars Percent Dollars Percent 2008 2009 2010<br />
<strong>New</strong> <strong>Orleans</strong><br />
<strong>New</strong> <strong>Orleans</strong> Total 8,798 8,995 9,794 1,071 1,067 1,144 $1,166 $1,047 $1,126 ($120) -10.27% $79 7.55% $1.09 $0.98 $0.98<br />
Efficiencies Flat 345 386 382 495 481 493 $817 $737 $784 ($80) -9.82% $47 6.34% $1.65 $1.53 $1.59<br />
1 BR Flat 3,769 3,494 4,151 730 749 703 $1,064 $871 $815 ($194) -18.19% ($55) -6.35% $1.46 $1.16 $1.16<br />
1BR Tow nhouse 175 205 295 978 989 997 $1,159 $1,170 $1,025 $11 0.91% ($145) -12.36% $1.18 $1.18 $1.03<br />
2 BR/1.X BA Flat 1,238 1,546 1,302 935 939 997 $784 $884 $1,034 $100 12.71% $150 16.95% $0.84 $0.94 $1.04<br />
2 BR/1.X BA Tow nhouse 312 625 398 1,088 1,156 1,247 $861 $830 $1,116 ($32) -3.66% $287 34.54% NA $0.72 $0.89<br />
2 BR/2.x BA Flat 2,063 2,106 2,358 1,067 1,011 1,025 $1,146 $1,083 $1,149 ($63) -5.51% $66 6.11% $1.07 $1.07 $1.12<br />
2 BR/2.x BA Tow nhouse 545 158 333 1,257 1,331 1,277 $1,394 $1,365 $1,363 ($29) -2.10% ($2) -0.12% NA $1.03 $1.07<br />
3 BR Flat 334 408 353 1,418 1,393 1,406 $1,494 $1,321 $1,328 ($173) -11.58% $7 0.55% $1.05 $0.95 $0.94<br />
3 BR Tow nhouse 17 67 203 1,674 1,551 1,639 $1,778 $1,160 $1,483 ($617) -34.72% $322 27.79% $1.06 $0.75 $0.90<br />
4 BR Flat 0 0 13 NA NA 1,512 NA NA $1,500 NA NA NA NA NA NA $0.99<br />
4 BR Tow nhouse 0 0 6 NA NA 1,290 NA NA $785 NA NA NA NA NA NA $0.61<br />
A - Uptown 172 135 497 768 722 1,102 $914 $1,078 $1,325 $165 18.02% $247 22.86% $1.19 $1.49 $1.20<br />
Efficiencies Flat 103 103 103 415 415 415 $700 $715 $715 $15 2.14% $0 0.00% $1.69 $1.72 $1.72<br />
1 BR Flat 52 18 165 780 875 739 $1,008 $1,235 $1,057 $227 22.52% ($178) -14.41% $1.29 $1.41 $1.43<br />
1BR<br />
Tow nhouse<br />
2 BR/1.X BA Flat 0 0 14 NA NA 1,400 NA NA $1,650 NA NA NA NA NA NA $1.18<br />
2 BR/1.X BA Tow nhouse 0 0 10 NA NA 1,900 NA NA $2,090 NA NA NA NA NA NA $1.10<br />
2 BR/2.x BA Flat 17 14 14 1,108 875 875 $1,033 $1,285 $1,285 $252 24.39% $0 0.00% $0.93 $1.47 $1.47<br />
2 BR/2.x BA Tow nhouse 0 0 177 NA NA 1,081 NA NA $1,173 NA NA NA NA NA NA $1.09<br />
3 BR Flat<br />
3 BR Tow nhouse 0 0 14 NA NA 1,307 NA NA $1,304 NA NA NA NA NA NA $1.00<br />
4 BR Flat<br />
4 BR Tow nhouse<br />
B - Mid-City 1,342 1,286 1,553 944 968 1,049 $1,402 $1,100 $1,117 ($302) -21.54% $17 1.57% $1.49 $1.14 $1.07<br />
Efficiencies Flat 134 134 134 510 510 510 $1,163 $875 $935 ($288) -24.76% $60 6.86% $2.28 $1.72 $1.83<br />
1 BR Flat 515 502 592 763 763 764 $1,844 $845 $878 ($999) -54.18% $33 3.91% $2.42 $1.11 $1.15<br />
1BR Tow nhouse 26 0 0 845 NA NA $1,200 NA NA NA NA NA NA $1.42 NA NA<br />
2 BR/1.X BA Flat 198 218 138 923 949 1,042 $765 $911 $972 $146 19.08% $61 6.70% $0.83 $0.96 $0.93<br />
2 BR/1.X BA Tow nhouse<br />
2 BR/2.x BA Flat 420 383 548 1,159 1,159 1,119 $1,466 $1,187 $1,204 ($279) -19.03% $17 1.43% $1.26 $1.02 $1.08<br />
2 BR/2.x BA Tow nhouse 0 0 34 NA NA 1,154 NA NA $1,000 NA NA NA NA NA NA $0.87<br />
3 BR Flat 49 49 67 1,461 1,461 1,429 $1,975 $1,683 $1,533 ($292) -14.78% ($150) -8.91% $1.35 $1.15 $1.07<br />
3 BR Tow nhouse 0 0 40 NA NA 1,322 NA NA $1,300 NA NA NA NA NA NA $0.98<br />
4 BR Flat<br />
4 BR Tow nhouse<br />
Number of Units<br />
Average Size<br />
Average Rent<br />
Ave Rent Change<br />
Avg Pr Sq/Ft<br />
Reporting Rent<br />
(Square Feet)<br />
(Dollars)<br />
2008 vs. 2009 2009 vs. 2010<br />
(Cents)<br />
Area 2008 2009 2010 2008 2009 2010 2008 2009 2010 Dollars Percent Dollars Percent 2008 2009 2010<br />
C - Lake Forest 3,733 3,780 3,799 1,024 1,095 1,021 $813 $793 $751 ($20) -2.46% ($42) -5.24% $0.79 $0.72 $0.74<br />
Efficiencies Flat<br />
1 BR Flat 1,335 1,339 1,406 679 682 672 $665 $615 $605 ($50) -7.52% ($10) -1.63% $0.98 $0.90 $0.90<br />
1BR Tow nhouse 0 0 90 NA NA 1,013 NA NA $745 NA NA NA NA NA NA $0.74<br />
2 BR/1.X BA Flat 562 648 702 946 1,034 1,019 $839 $777 $756 ($62) -7.39% ($21) -2.70% $0.89 $0.75 $0.74<br />
2 BR/1.X BA Tow nhouse 267 580 299 1,100 1,108 1,086 $824 $777 $712 ($47) -5.70% ($65) -8.37% $0.75 $0.70 $0.66<br />
2 BR/2.x BA Flat 1,082 998 1,145 1,000 997 1,003 $791 $744 $740 ($47) -5.94% ($4) -0.54% $0.79 $0.75 $0.74<br />
2 BR/2.x BA Tow nhouse 355 34 0 1,049 1,120 NA $769 $795 NA $26 3.38% NA NA $0.73 $0.71 NA<br />
3 BR Flat 132 167 157 1,370 1,372 1,334 $989 $952 $950 ($37) -3.74% ($2) -0.21% $0.72 $0.69 $0.71<br />
3 BR Tow nhouse 0 14 0 NA 1,350 NA NA $890 NA NA NA NA NA NA $0.66 NA<br />
4 BR Flat<br />
4 BR Tow nhouse<br />
D - N.O East 0 0 206 NA NA 886 NA NA $712 NA NA NA NA NA NA $0.80<br />
Efficiencies Flat<br />
1 BR Flat 0 0 52 NA NA 570 NA NA $570 NA NA NA NA NA NA $1.00<br />
1BR<br />
Tow nhouse<br />
2 BR/1.X BA Flat 0 0 46 NA NA 720 NA NA $720 NA NA NA NA NA NA $1.00<br />
2 BR/1.X BA Tow nhouse 0 0 44 NA NA 800 NA NA $800 NA NA NA NA NA NA $1.00<br />
2 BR/2.x BA Flat<br />
2 BR/2.x BA Tow nhouse<br />
3 BR Flat<br />
3 BR Tow nhouse 0 0 58 NA NA 1,050 NA NA $687 NA NA NA NA NA NA $0.65<br />
4 BR Flat<br />
4 BR Tow nhouse 0 0 6 NA NA 1,290 NA NA $785 NA NA NA NA NA NA $0.61<br />
E - Algiers 2,437 2,659 2,222 1,083 1,085 1,102 $802 $789 $786 -$13 -1.58% ($3) -0.37% $0.74 $0.73 $0.71<br />
Efficiencies Flat 98 138 138 550 518 518 $498 $540 $516 $42 8.43% ($24) -4.44% $0.91 $1.04 $1.00<br />
1 BR Flat 1,298 1,138 1,109 722 733 752 $629 $610 $611 -$19 -3.02% $1 0.16% $0.87 $0.83 $0.81<br />
1BR Tow nhouse 2 58 58 1,000 888 888 $660 $709 $700 $49 7.42% ($9) -1.27% $0.66 $0.80 $0.79<br />
2 BR/1.X BA Flat 478 662 384 935 937 965 $749 $713 $710 -$36 -4.81% ($3) -0.42% $0.80 $0.76 $0.74<br />
2 BR/1.X BA Tow nhouse 45 45 45 1,075 1,203 1,203 $898 $882 $862 -$16 -1.78% ($20) -2.27% $0.84 $0.73 $0.72<br />
2 BR/2.x BA Flat 287 403 300 978 998 1,005 $723 $766 $775 $43 5.95% $9 1.17% $0.74 $0.77 $0.77<br />
2 BR/ 2.Xba Tow nhouse 123 57 55 1,180 1,330 1,330 $1,025 $871 $851 -$154 -15.02% ($20) -2.30% $0.87 $0.65 $0.64<br />
3 BR Flat 102 118 45 1,404 1,367 1,468 $857 $918 $965 $61 7.12% $47 5.12% $0.61 $0.67 $0.66<br />
3 BR Tow nhouse 4 40 88 1,900 1,791 1,791 $1,175 $1,091 $1,084 -$84 -7.15% ($7) -0.64% $0.62 $0.61 $0.61<br />
4 BR Flat<br />
4 BR Tow nhouse<br />
<strong>New</strong> <strong>Orleans</strong> <strong>Market</strong> <strong>Assessment</strong> – An Analysis of Supply and Demand Dynamics 124
Table A11: Continued: <strong>New</strong> <strong>Orleans</strong> Apartment Survey, <strong>Market</strong> Rate Rent Summary: 2008 –<br />
2010<br />
Number of Units Average Size Average Rent<br />
Ave Rent Change<br />
Avg Pr Sq/Ft<br />
Reporting Rent<br />
(Square Feet) (Dollars)<br />
2008 vs. 2009 2009 vs. 2010<br />
(Cents)<br />
Area 2008 2009 2010 2008 2009 2010 2008 2009 2010 Dollars Percent Dollars Percent 2008 2009 2010<br />
M - Warehouse District 1,114 1,135 1,517 1,117 1,069 1,275 $1,763 $1,465 $1,749 ($298) -16.88% $283 19.35% $1.58 $1.37 $1.37<br />
Efficiencies Flat 10 11 7 505 482 528 $908 $818 $969 ($90) -9.91% $151 18.46% $1.80 $1.70 $1.84<br />
1 BR Flat 569 497 827 706 692 721 $1,175 $1,048 $1,171 ($127) -10.81% $123 11.74% $1.66 $1.51 $1.62<br />
1BR Tow nhouse 147 147 147 1,090 1,090 1,090 $1,617 $1,630 $1,630 $13 0.80% $0 0.00% $1.48 $1.50 $1.50<br />
2 BR/1.X BA Flat 0 18 18 NA 834 834 NA $1,135 $1,395 NA NA $260 22.91% NA $1.36 $1.67<br />
2 BR/1.X BA Tow nhouse<br />
2 BR/2.x BA Flat 257 308 351 1,092 1,025 1,123 $1,718 $1,433 $1,742 ($285) -16.59% $309 21.56% $1.57 $1.40 $1.55<br />
2 BR/ 2.Xba Tow nhouse 67 67 67 1,543 1,543 1,543 $2,388 $2,428 $2,428 $40 1.68% $0 0.00% $1.55 $1.57 $1.57<br />
3 BR Flat 51 74 84 1,437 1,372 1,394 $2,153 $1,729 $1,863 ($424) -19.69% $134 7.75% $1.50 $1.26 $1.34<br />
3 BR Tow nhouse 13 13 3 1,447 1,512 2,726 $2,380 $1,500 $3,039 ($880) -36.97% $1,539 102.60% $1.64 $0.99 $1.11<br />
4 BR Flat 0 0 13 NA NA 1,512 NA NA $1,500 NA NA NA NA NA NA $0.99<br />
4 BR Tow nhouse<br />
St. Tammany<br />
St. Tammany Total 2,648 2,845 2,741 1,087 1,045 1,120 $1,038 $897 $953 -$141 -13.55% $55 6.17% $0.96 $0.86 $0.85<br />
Efficiencies Flat 20 20 21 650 650 620 $725 $725 $691 $0 0.00% ($35) -4.76% $1.12 $1.12 $1.11<br />
1 BR Flat 1,095 1,235 1,135 764 754 775 $816 $725 $771 -$91 -11.16% $46 6.35% $1.07 $0.96 $0.99<br />
1BR Tow nhouse 19 19 19 1,183 1,183 1,183 $1,275 $1,050 $1,300 -$225 -17.65% $250 23.81% $1.08 $0.89 $1.10<br />
2 BR/1.X BA Flat 285 203 133 1,011 881 885 $922 $696 $705 -$227 -24.57% $10 1.37% $0.91 $0.79 $0.80<br />
2 BR/1.X BA Tow nhouse 84 52 52 1,090 930 930 $925 $850 $850 -$75 -8.11% $0 0.00% $0.85 $0.91 $0.91<br />
2 BR/2.x BA Flat 802 874 950 1,122 1,099 1,678 $1,153 $1,038 $1,087 -$115 -9.97% $49 4.67% $1.03 $0.94 $0.65<br />
2 BR/ 2.Xba Tow nhouse 148 180 140 1,302 1,267 1,220 $1,327 $1,034 $962 -$293 -22.08% ($72) -6.96% $1.02 $0.82 $0.79<br />
3 BR Flat 140 203 221 1,253 1,336 1,398 $1,047 $1,097 $1,193 $50 4.78% $97 8.80% $0.84 $0.82 $0.85<br />
3 BR Tow nhouse 55 59 70 1,409 1,305 1,392 $1,154 $864 $1,018 -$291 -25.17% $155 17.89% $0.82 $0.66 $0.73<br />
4 BR Flat<br />
4 BR Tow nhouse<br />
F - E. St. Tammany 1,523 1,623 1,291 1,102 1,101 1,026 $969 $915 $895 -$54 -5.55% ($20) -2.18% $0.88 $0.83 $0.87<br />
Efficiencies Flat 0 0 1 NA NA 590 NA NA $595 NA NA NA NA NA NA $1.01<br />
1 BR Flat 673 753 563 748 748 772 $761 $705 $730 -$56 -7.36% $25 3.55% $1.02 $0.94 $0.95<br />
1BR<br />
Tow nhouse<br />
2 BR/1.X BA Flat 160 180 110 961 936 945 $800 $764 $763 -$36 -4.50% ($1) -0.13% $0.83 $0.82 $0.81<br />
2 BR/1.X BA Tow nhouse 52 52 52 930 930 930 $850 $850 $850 $0 0.00% $0 0.00% $0.91 $0.91 $0.91<br />
2 BR/2.x BA Flat 395 395 329 1,125 1,125 1,110 $1,113 $1,012 $1,086 -$101 -9.07% $74 7.31% $0.99 $0.90 $0.98<br />
2 BR/ 2.Xba Tow nhouse 108 108 108 1,189 1,201 1,189 $1,004 $986 $991 -$18 -1.79% $5 0.51% $0.84 $0.82 $0.83<br />
3 BR Flat 80 80 80 1,355 1,355 1,355 $1,098 $958 $1,026 -$140 -12.75% $68 7.10% $0.81 $0.71 $0.76<br />
3 BR Tow nhouse 55 55 48 1,409 1,409 1,314 $1,154 $1,129 $1,118 -$25 -2.17% ($11) -0.97% $0.82 $0.80 $0.85<br />
4 BR Flat<br />
4 BR Tow nhouse<br />
Number of Units<br />
Average Size<br />
Average Rent<br />
Ave Rent Change<br />
Avg Pr Sq/Ft<br />
Reporting Rent (Square Feet)<br />
(Dollars) 2008 vs. 2009 2009 vs. 2010<br />
(Cents)<br />
Area 2008 2009 2010 2008 2009 2010 2008 2009 2010 Dollars Percent Dollars Percent 2008 2009 2010<br />
N - W. St. Tammany 1,125 1,222 1,450 1,076 1,042 1,230 $1,094 $891 $980 -$203 -18.59% $90 10.06% $1.02 $0.85 $0.80<br />
Efficiencies Flat 20 20 20 650 650 650 $725 $725 $786 $0 0.00% $61 8.41% $1.12 $1.12 $1.21<br />
1 BR Flat 422 482 572 779 759 777 $870 $744 $811 -$126 -14.48% $67 9.01% $1.12 $0.98 $1.04<br />
1BR Tow nhouse 19 19 19 1,183 1,183 1,183 $1,275 $1,050 $1,300 -$225 -17.65% $250 23.81% $1.08 $0.89 $1.10<br />
2 BR/1.X BA Flat 125 23 23 1,060 825 825 $1,044 $627 $647 -$417 -39.94% $20 3.19% $0.98 $0.76 $0.78<br />
2 BR/1.X BA Tow nhouse 32 0 0 1,250 NA NA $1,000 NA NA NA NA NA NA $0.80 NA NA<br />
2 BR/2.x BA Flat 407 479 621 1,119 1,072 2,245 $1,193 $1,064 $1,087 -$129 -10.81% $23 2.16% $1.07 $0.99 $0.48<br />
2 BR/ 2.Xba Tow nhouse 40 72 32 1,414 1,332 1,250 $1,650 $1,082 $933 -$568 -34.42% ($149) -13.77% $1.17 $0.81 $0.75<br />
3 BR Flat 60 123 141 1,150 1,316 1,441 $995 $1,235 $1,360 $240 24.12% $125 10.12% $0.87 $0.94 $0.94<br />
3 BR Tow nhouse 0 4 22 NA 1,200 1,470 NA $598 $918 NA NA NA NA NA NA $0.62<br />
4 BR Flat<br />
4 BR Tow nhouse<br />
Jefferson<br />
Jefferson Total 20,375 21,426 22,139 1,091 1,122 1,124 $951 $929 $914 -$22 -2.36% ($15) -1.57% $0.87 $0.83 $0.81<br />
Efficiencies Flat 1,784 1,762 1,726 483 469 467 $547 $553 $548 $6 1.10% ($5) -0.90% $1.13 $1.18 $1.17<br />
1 BR Flat 10,055 10,282 10,559 729 722 722 $736 $746 $716 $9 1.29% ($30) -3.98% $1.01 $1.03 $0.99<br />
1BR Tow nhouse 177 351 396 786 774 787 $762 $745 $751 -$17 -2.17% $6 0.77% $0.97 $0.96 $0.95<br />
2 BR/1.X BA Flat 2,645 2,665 2,803 881 865 892 $799 $821 $787 $22 2.77% ($34) -4.18% $0.91 $0.95 $0.88<br />
2 BR/1.X BA Tow nhouse 441 537 654 1,011 1,023 1,032 $835 $816 $814 -$19 -2.28% ($3) -0.31% $0.83 $0.80 $0.79<br />
2 BR/2.x BA Flat 3,657 4,133 4,130 1,085 1,073 1,084 $1,010 $987 $943 -$23 -2.32% ($43) -4.40% $0.93 $0.92 $0.87<br />
2 BR/ 2.Xba Tow nhouse 781 778 853 1,211 1,218 1,185 $967 $912 $915 -$56 -5.75% $4 0.40% $0.80 $0.75 $0.77<br />
3 BR Flat 456 526 626 1,211 1,223 1,226 $1,101 $1,062 $1,036 -$39 -3.52% ($27) -2.50% $0.91 $0.87 $0.84<br />
3 BR Tow nhouse 377 382 382 1,390 1,385 1,378 $1,212 $1,082 $1,053 -$130 -10.73% ($29) -2.66% $0.87 $0.78 $0.76<br />
4 BR Flat 0 8 8 NA 1,466 1,466 NA $950 $950 NA NA $0 0.00% NA $0.65 $0.65<br />
4 BR Tow nhouse 2 2 2 2,120 2,120 2,120 $1,545 $1,545 $1,545 $0 $0 $0 0.00% $0.73 $0.73 $0.73<br />
G - Kenner 4,095 4,097 4,117 970 968 933 $826 $830 $811 $4 0.50% ($18) -2.20% $0.85 $0.86 $0.87<br />
Efficiencies Flat 405 405 405 455 455 455 $544 $551 $550 $7 1.29% ($1) -0.18% $1.20 $1.21 $1.21<br />
1 BR Flat 2,426 2,426 2,426 799 796 790 $766 $775 $754 $9 1.17% ($21) -2.71% $0.96 $0.97 $0.95<br />
1BR Tow nhouse 80 82 80 723 722 723 $607 $603 $603 -$4 -0.66% $0 0.00% $0.84 $0.84 $0.83<br />
2 BR/1.X BA Flat 221 221 243 924 910 893 $828 $837 $797 $9 1.09% ($40) -4.78% $0.90 $0.92 $0.89<br />
2 BR/1.X BA Tow nhouse 34 34 34 1,100 1,100 1,100 $850 $850 $850 $0 0.00% $0 0.00% $0.77 $0.77 $0.77<br />
2 BR/2.x BA Flat 771 771 771 1,266 1,266 1,227 $1,091 $1,100 $1,047 $9 0.82% ($53) -4.82% $0.86 $0.87 $0.85<br />
2 BR/ 2.Xba Tow nhouse 158 158 158 1,525 1,525 1,343 $1,093 $1,092 $1,079 -$1 -0.09% ($13) -1.19% $0.72 $0.72 $0.80<br />
3 BR Flat<br />
3 BR Tow nhouse<br />
4 BR Flat<br />
4 BR Tow nhouse<br />
<strong>New</strong> <strong>Orleans</strong> <strong>Market</strong> <strong>Assessment</strong> – An Analysis of Supply and Demand Dynamics 125
Table A11: Continued: <strong>New</strong> <strong>Orleans</strong> Apartment Survey, <strong>Market</strong> Rate Rent Summary: 2008 –<br />
2010<br />
Number of Units<br />
Average Size<br />
Average Rent<br />
Ave Rent Change<br />
Avg Pr Sq/Ft<br />
Reporting Rent<br />
(Square Feet)<br />
(Dollars)<br />
2008 vs. 2009 2009 vs. 2010<br />
(Cents)<br />
Area 2008 2009 2010 2008 2009 2010 2008 2009 2010 Dollars Percent Dollars Percent 2008 2009 2010<br />
H - W. Metairie 7,435 7,335 7,747 1,068 1,074 1,076 $918 $928 $913 $10 1.10% ($15) -1.61% $0.86 $0.86 $0.85<br />
Efficiencies Flat 1,031 1,002 1,001 422 433 431 $533 $544 $549 $11 2.06% $5 0.92% $1.26 $1.26 $1.27<br />
1 BR Flat 3,473 3,437 3,649 650 653 668 $671 $677 $668 $6 0.89% ($9) -1.33% $1.03 $1.04 $1.00<br />
1BR Tow nhouse 4 4 4 630 630 704 $700 $710 $690 $10 1.43% ($20) -2.82% $1.11 $1.13 $0.98<br />
2 BR/1.X BA Flat 1,070 1,044 1,064 906 899 902 $826 $827 $812 $1 0.12% ($15) -1.81% $0.91 $0.92 $0.90<br />
2 BR/1.X BA Tow nhouse 261 261 277 952 965 972 $805 $823 $816 $18 2.24% ($7) -0.85% $0.85 $0.85 $0.84<br />
2 BR/2.x BA Flat 876 891 1,051 1,027 1,014 1,013 $905 $900 $882 -$5 -0.55% ($18) -2.00% $0.88 $0.89 $0.87<br />
2 BR/ 2.Xba Tow nhouse 302 320 317 1,106 1,119 1,119 $886 $883 $879 -$3 -0.34% ($4) -0.45% $0.80 $0.79 $0.79<br />
3 BR Flat 131 131 139 1,198 1,256 1,218 $1,095 $1,126 $1,062 $31 2.83% ($64) -5.68% $0.91 $0.90 $0.87<br />
3 BR Tow nhouse 285 243 243 1,668 1,646 1,617 $1,209 $1,241 $1,224 $32 2.65% ($17) -1.37% $0.72 $0.75 $0.76<br />
4 BR Flat<br />
4 BR Tow nhouse 2 2 2 2,120 2,120 2,120 $1,545 $1,545 $1,545 $0 $0 $0 0.00% $0.73 $0.73 $0.73<br />
I - E. Metairie 1,802 1,695 1,739 967 972 959 $922 $864 $853 -$58 -6.29% ($11) -1.22% $0.95 $0.89 $0.89<br />
Efficiencies Flat 220 219 184 409 407 399 $558 $568 $543 $10 1.79% ($25) -4.40% $1.36 $1.40 $1.36<br />
1 BR Flat 795 755 756 688 681 664 $733 $724 $693 -$9 -1.23% ($31) -4.28% $1.07 $1.06 $1.04<br />
1BR Tow nhouse 12 12 12 971 971 971 $945 $945 $995 $0 0.00% $50 5.29% $0.97 $0.97 $1.02<br />
2 BR/1.X BA Flat 32 14 154 784 776 875 $744 $760 $751 $16 2.15% ($9) -1.18% $0.95 $0.98 $0.86<br />
2 BR/1.X BA Tow nhouse 146 146 202 982 982 990 $851 $805 $815 -$46 -5.41% $10 1.24% $0.87 $0.82 $0.82<br />
2 BR/2.x BA Flat 375 375 174 1,040 1,005 1,069 $978 $962 $922 -$16 -1.64% ($40) -4.16% $0.94 $0.96 $0.86<br />
2 BR/ 2.Xba Tow nhouse 11 10 0 1,175 1,150 NA $1,008 $813 NA -$195 -19.35% NA NA $0.86 $0.71 NA<br />
3 BR Flat 193 146 239 1,214 1,335 1,258 $1,037 $1,088 $998 $51 4.92% ($90) -8.27% $0.85 $0.81 $0.79<br />
3 BR Tow nhouse 18 18 18 1,443 1,443 1,443 $1,443 $1,110 $1,110 -$333 -23.08% $0 0.00% $1.00 $0.77 $0.77<br />
4 BR Flat<br />
4 BR Tow nhouse<br />
J - River Ridge 3,655 3,547 3,595 937 938 934 $844 $849 $794 $5 0.57% ($55) -6.52% $0.90 $0.91 $0.85<br />
Efficiencies Flat 96 96 96 484 484 484 $521 $524 $518 $3 0.58% ($6) -1.15% $1.08 $1.08 $1.07<br />
1 BR Flat 1,991 1,903 1,931 771 772 763 $766 $784 $751 $18 2.35% ($33) -4.21% $0.99 $1.02 $0.98<br />
1BR<br />
Tow nhouse<br />
2 BR/1.X BA Flat 415 395 415 896 897 885 $823 $835 $798 $12 1.46% ($37) -4.43% $0.92 $0.93 $0.90<br />
2 BR/1.X BA Tow nhouse<br />
2 BR/2.x BA Flat 1,024 1,024 1,024 1,064 1,064 1,060 $1,058 $1,054 $955 -$4 -0.38% ($99) -9.39% $0.99 $0.99 $0.90<br />
2 BR/ 2.Xba Tow nhouse 101 101 101 1,209 1,209 1,209 $901 $901 $826 $0 0.00% ($75) -8.32% $0.75 $0.75 $0.68<br />
3 BR Flat<br />
3 BR Tow nhouse 28 28 28 1,200 1,200 1,200 $995 $995 $913 $0 0.00% ($82) -8.24% $0.83 $0.83 $0.76<br />
4 BR Flat<br />
4 BR Tow nhouse<br />
Number of Units Average Size Average Rent<br />
Ave Rent Change<br />
Avg Pr Sq/Ft<br />
Reporting Rent (Square Feet)<br />
(Dollars)<br />
2008 vs. 2009 2009 vs. 2010 (Cents)<br />
Area 2008 2009 2010 2008 2009 2010 2008 2009 2010 Dollars Percent Dollars Percent 2008 2009 2010<br />
K - Harvey Canal W 0 100 0 NA 867 NA NA $900 NA NA NA NA NA NA $1.04 NA<br />
Efficiencies Flat<br />
1 BR Flat 0 28 0 NA 700 NA NA $800 NA NA NA NA NA NA $1.14 NA<br />
1BR<br />
Tow nhouse<br />
2 BR/1.X BA Flat 0 64 0 NA 800 NA NA $900 NA NA NA NA NA NA $1.13 NA<br />
2 BR/1.X BA Tow nhouse<br />
2 BR/2.x BA Flat<br />
2 BR/ 2.Xba Tow nhouse<br />
3 BR Flat 0 8 0 NA 1,100 NA NA $1,000 NA NA NA NA NA NA $0.91 NA<br />
3 BR Tow nhouse<br />
4 BR Flat<br />
4 BR Tow nhouse<br />
L - Harvey Canal E 3,388 4,652 4,941 954 1,004 1,005 $904 $832 $831 -$72 -7.92% ($1) -0.16% $0.95 $0.83 $0.83<br />
Efficiencies Flat 32 40 40 645 565 565 $577 $576 $578 -$1 -0.17% $2 0.35% $0.89 $1.02 $1.02<br />
1 BR Flat 1,370 1,733 1,797 735 731 727 $745 $714 $714 -$31 -4.16% $0 0.00% $1.01 $0.98 $0.98<br />
1BR Tow nhouse 81 253 300 821 772 751 $794 $722 $715 -$72 -9.07% ($7) -0.97% $0.97 $0.94 $0.95<br />
2 BR/1.X BA Flat 907 927 927 897 907 906 $775 $769 $777 -$6 -0.77% $8 1.04% $0.86 $0.85 $0.86<br />
2 BR/1.X BA Tow nhouse 0 96 141 NA 1,046 1,065 NA $787 $774 NA NA ($13) -1.65% NA $0.75 $0.73<br />
2 BR/2.x BA Flat 611 1,072 1,110 1,029 1,015 1,050 $1,019 $918 $911 -$101 -9.91% ($7) -0.76% $0.99 $0.90 $0.87<br />
2 BR/ 2.Xba Tow nhouse 209 189 277 1,038 1,088 1,070 $948 $869 $877 -$79 -8.33% $8 0.92% $0.91 $0.80 $0.82<br />
3 BR Flat 132 241 248 1,220 1,201 1,201 $1,171 $1,035 $1,047 -$136 -11.61% $12 1.16% $0.96 $0.86 $0.87<br />
3 BR Tow nhouse 46 93 93 1,250 1,250 1,250 $1,200 $981 $965 -$219 -18.25% ($16) -1.63% $0.96 $0.78 $0.77<br />
4 BR Flat 0 8 8 NA 1,466 1,466 NA $950 $950 NA NA $0 0.00% NA $0.65 $0.65<br />
4 BR Tow nhouse<br />
Grand Totals 31,821 33,266 34,674 1,045 1,028 1,061 $1,030 $934 $972 -$96 -9.31% $38 4.03% $0.99 $0.91 $0.92<br />
Efficiencies Flat 2,149 2,168 2,129 543 533 527 $696 $672 $674 -$25 -3.55% $2 0.36% $1.28 $1.26 $1.28<br />
1 BR Flat 14,919 15,011 15,845 741 742 733 $872 $780 $767 -$92 -10.52% ($13) -1.66% $1.18 $1.05 $1.05<br />
1BR Tow nhouse 371 575 710 983 982 989 $1,065 $988 $1,025 -$77 -7.23% $37 3.75% $1.08 $1.01 $1.04<br />
2 BR/1.X BA Flat 4,168 4,414 4,238 942 895 925 $835 $800 $842 -$35 -4.18% $42 5.21% $0.89 $0.89 $0.91<br />
2 BR/1.X BA Tow nhouse 837 1,214 1,104 1,063 1,036 1,070 $874 $832 $927 -$42 -4.79% $95 11.38% $0.82 $0.80 $0.87<br />
2 BR/2.x BA Flat 6,522 7,113 7,438 1,092 1,061 1,262 $1,103 $1,036 $1,060 -$67 -6.09% $24 2.29% $1.01 $0.98 $0.84<br />
2 BR/ 2.Xba Tow nhouse 1,474 1,116 1,326 1,256 1,272 1,227 $1,229 $1,103 $1,080 -$126 -10.25% ($23) -2.12% $0.98 $0.87 $0.88<br />
3 BR Flat 930 1,137 1,200 1,294 1,317 1,343 $1,214 $1,160 $1,185 -$54 -4.44% $26 2.22% $0.94 $0.88 $0.88<br />
3 BR Tow nhouse 449 508 655 1,491 1,413 1,470 $1,381 $1,035 $1,185 -$346 -25.04% $149 14.43% $0.93 $0.73 $0.81<br />
4 BR Flat<br />
4 BR Tow nhouse<br />
Source: Survey of property owners and managers and Internet research compiled by the UNO Institute for Economic Development & Real Estate Research<br />
Note: This table should not be compared to earlier reports. Leasing agents/owners may have provided updated information for prior time periods. Total number of units surveyed may vary due<br />
to properties being added or removed (demolitions or due to agent/owner no longer wanting to participate, non-responsiveness over a three year period), changes in unit counts due to<br />
renovations, or units returning to the market upon Katrina repairs being completed.<br />
<strong>New</strong> <strong>Orleans</strong> <strong>Market</strong> <strong>Assessment</strong> – An Analysis of Supply and Demand Dynamics 126
Table A12: <strong>Orleans</strong> Sales Activity by Condition, 2000<br />
Average Sale Price 2000<br />
Planning Districts Poor Fair Average Very Good Excellent <strong>New</strong> All<br />
1A $358,000 $358,000<br />
1B $300,000 $233,553 $526,667 $482,426<br />
2 $46,225 $87,600 $187,939 $370,750 $278,999 $79,900 $234,748<br />
3 $74,808 $96,697 $142,973 $178,683 $271,390 $299,808 $231,563<br />
4 $81,643 $62,451 $65,880 $120,556 $140,306 $79,500 $91,139<br />
5 $123,938 $136,061 $163,279 $194,486 $254,866 $337,031 $229,809<br />
6 $33,277 $58,244 $85,922 $92,853 $133,525 $200,420 $102,227<br />
7 $27,786 $33,227 $60,747 $83,850 $119,399 $84,500 $78,885<br />
8 $10,322 $29,334 $43,430 $66,500 $59,383 $38,576<br />
9 $24,767 $53,880 $83,722 $90,908 $120,460 $113,362 $98,507<br />
10 $55,525 $83,867 $97,164 $91,659<br />
11 $188,600 $188,600<br />
12 $35,645 $51,682 $82,548 $93,926 $143,923 $131,208 $122,417<br />
13 $380,000 $527,821 $509,833 $521,706<br />
No Designation $15,850 $70,200 $86,165 $137,429 $199,033 $231,667 $159,314<br />
All $45,503 $62,046 $99,641 $134,934 $197,506 $193,660 $154,322<br />
Sample Size, 2000<br />
Planning Districts Poor Fair Average Very Good Excellent <strong>New</strong> All<br />
1A 1 1<br />
1B 1 3 21 25<br />
2 8 7 30 8 96 9 158<br />
3 12 26 78 29 337 6 488<br />
4 7 34 55 4 48 4 152<br />
5 8 18 49 18 201 13 307<br />
6 22 49 104 34 166 5 380<br />
7 7 41 46 4 75 1 174<br />
8 9 15 18 2 12 56<br />
9 15 56 115 39 243 18 486<br />
10 4 9 39 52<br />
11 5 5<br />
12 10 35 77 23 325 9 479<br />
13 1 29 3 33<br />
No Designation 4 5 13 7 48 3 80<br />
All 102 291 597 169 1,646 71 2,876<br />
<strong>New</strong> <strong>Orleans</strong> <strong>Market</strong> <strong>Assessment</strong> – An Analysis of Supply and Demand Dynamics 127
Table A12 Continued: <strong>Orleans</strong> Sales Activity by Condition, 2000<br />
Average Days on <strong>Market</strong>, 2000<br />
Planning Districts Poor Fair Average Very Good Excellent <strong>New</strong> All<br />
1A 116 116<br />
1B 79 48 136 123<br />
2 15 135 88 51 60 192 74<br />
3 97 69 66 46 50 70 55<br />
4 103 88 55 31 66 73 68<br />
5 28 54 58 35 63 83 60<br />
6 24 76 57 44 51 42 54<br />
7 11 85 76 70 67 0 71<br />
8 46 101 71 45 42 68<br />
9 20 85 55 31 53 91 56<br />
10 59 52 46 48<br />
11 268 268<br />
12 30 85 75 50 52 120 59<br />
13 67 153 126 148<br />
No Designation 90 42 65 59 48 57 54<br />
All 41 81 64 42 58 99 61<br />
Average Price per Square Foot, 2000<br />
Planning Districts Poor Fair Average Very Good Excellent <strong>New</strong> All<br />
1A $70.29 $70.29<br />
1B $129.76 $104.26 $185.45 $173.48<br />
2 $21.77 $29.84 $62.12 $84.69 $109.52 $61.13 $88.53<br />
3 $42.91 $55.84 $75.19 $99.07 $112.08 $130.30 $100.94<br />
4 $19.90 $33.33 $51.91 $65.39 $82.30 $61.15 $56.48<br />
5 $88.40 $84.99 $95.03 $99.30 $111.80 $120.43 $106.59<br />
6 $24.90 $42.44 $59.10 $68.25 $73.21 $93.08 $62.51<br />
7 $26.43 $28.34 $47.80 $57.41 $79.82 $52.81 $56.27<br />
8 $11.24 $23.02 $35.68 $49.23 $53.39 $32.64<br />
9 $19.18 $35.41 $52.25 $58.40 $63.01 $74.58 $55.94<br />
10 $42.41 $52.29 $58.76 $56.38<br />
11 $58.86 $58.86<br />
12 $24.78 $33.87 $51.69 $55.76 $64.14 $74.18 $58.94<br />
13 $113.23 $126.86 $128.41 $126.59<br />
No designation $14.13 $40.63 $67.44 $86.58 $92.40 $102.46 $81.23<br />
All $28.45 $39.79 $60.08 $74.13 $87.71 $89.39 $74.31<br />
<strong>New</strong> <strong>Orleans</strong> <strong>Market</strong> <strong>Assessment</strong> – An Analysis of Supply and Demand Dynamics 128
Table A13: <strong>Orleans</strong> Sales Activity by Condition, 2004<br />
Average Sale Price 2004<br />
Planning Districts Poor Fair Average Very Good Excellent <strong>New</strong> All<br />
1A $578,830 $578,830<br />
1B $190,000 $714,000 $731,197 $702,688<br />
2 $70,350 $112,644 $201,120 $298,094 $411,327 $383,500 $314,082<br />
3 $77,325 $132,346 $176,555 $269,625 $384,077 $549,017 $326,445<br />
4 $45,600 $62,552 $91,537 $152,096 $185,821 $143,980 $126,616<br />
5 $260,583 $192,769 $232,136 $235,535 $332,058 $391,768 $303,174<br />
6 $55,759 $75,752 $101,606 $145,783 $169,201 $121,000 $135,999<br />
7 $33,477 $53,732 $115,046 $112,945 $186,638 $120,657<br />
8 $25,750 $35,252 $54,286 $63,975 $86,213 $89,933 $51,957<br />
9 $43,703 $74,966 $101,814 $119,309 $148,314 $132,927 $121,352<br />
10 $63,133 $89,000 $94,765 $104,100 $114,633 $120,483 $102,995<br />
11 $179,000 $122,483 $211,500 $167,915<br />
12 $44,389 $70,142 $102,005 $128,489 $179,357 $158,277 $151,138<br />
13 $59,000 $592,212 $620,661 $586,555<br />
No Designation $42,367 $72,619 $138,709 $176,033 $213,150 $440,500 $161,736<br />
All $58,322 $78,557 $130,643 $172,027 $265,892 $276,975 $201,970<br />
Sample Size, 2004<br />
Planning Districts Poor Fair Average Very Good Excellent <strong>New</strong> All<br />
1A 5 5<br />
1B 1 5 16 22<br />
2 14 24 36 24 127 5 230<br />
3 16 25 53 71 311 13 489<br />
4 13 41 38 33 69 5 199<br />
5 6 13 28 57 175 28 307<br />
6 13 48 66 69 167 1 364<br />
7 21 42 46 32 78 219<br />
8 18 28 19 8 20 3 96<br />
9 17 68 110 101 240 31 567<br />
10 3 3 15 5 15 6 47<br />
11 1 6 6 13<br />
12 13 37 54 56 286 33 479<br />
13 1 39 9 49<br />
No Designation 6 13 15 12 29 2 77<br />
All 141 342 487 474 1,583 136 3,163<br />
<strong>New</strong> <strong>Orleans</strong> <strong>Market</strong> <strong>Assessment</strong> – An Analysis of Supply and Demand Dynamics 129
Table A13 Continued: <strong>Orleans</strong> Sales Activity by Condition, 2004<br />
Average Days on <strong>Market</strong>, 2004<br />
Planning Districts Poor Fair Average Very Good Excellent <strong>New</strong> All<br />
1A 39 39<br />
1B 1 102 91 89<br />
2 85 33 68 31 73 38 64<br />
3 44 32 42 60 48 89 49<br />
4 12 51 62 64 75 104 62<br />
5 8 48 41 41 45 88 47<br />
6 43 53 64 44 50 144 52<br />
7 43 40 83 111 80 74<br />
8 50 50 70 37 72 24 56<br />
9 9 59 47 47 61 118 57<br />
10 113 98 32 24 53 16 45<br />
11 173 47 49 58<br />
12 35 64 60 74 57 91 62<br />
13 9 109 199 123<br />
No Designation 71 60 81 39 84 39 70<br />
All 41 51 58 55 59 97 58<br />
Average Price per Square Foot, 2004<br />
Planning Districts Poor Fair Average Very Good Excellent <strong>New</strong> All<br />
1A $249.45 $249.45<br />
1B $146.15 $245.32 $290.92 $273.98<br />
2 $44.68 $69.20 $90.98 $130.51 $163.45 $179.14 $131.94<br />
3 $48.65 $79.40 $97.75 $131.84 $168.92 $181.40 $147.64<br />
4 $28.30 $42.25 $74.68 $95.27 $110.49 $101.00 $81.46<br />
5 $148.79 $113.90 $133.94 $131.60 $148.60 $157.49 $143.45<br />
6 $42.02 $58.49 $70.82 $88.54 $98.02 $95.28 $84.07<br />
7 $29.12 $43.51 $86.01 $89.71 $110.61 $81.71<br />
8 $21.92 $29.38 $44.14 $60.21 $68.95 $73.23 $43.09<br />
9 $32.78 $46.62 $62.40 $72.58 $78.00 $92.10 $69.66<br />
10 $29.35 $50.75 $60.80 $71.49 $67.61 $79.01 $63.79<br />
11 $50.35 $63.30 $83.65 $71.70<br />
12 $29.16 $48.64 $65.27 $75.15 $87.10 $103.55 $79.94<br />
13 $70.83 $146.84 $159.69 $147.65<br />
No designation $28.87 $63.12 $66.89 $98.59 $112.04 $155.52 $87.54<br />
All $39.51 $53.39 $78.37 $97.17 $122.12 $124.84 $100.67<br />
<strong>New</strong> <strong>Orleans</strong> <strong>Market</strong> <strong>Assessment</strong> – An Analysis of Supply and Demand Dynamics 130
Table A14: <strong>Orleans</strong> Sales Activity by Condition, 2006<br />
Average Sale Price, 2006<br />
Planning Districts Poor Fair Average Very Good Excellent <strong>New</strong> All<br />
1A $275,000 $1,665,000 $970,000<br />
1B $845,000 $1,201,700 $1,119,385<br />
2 $83,000 $193,800 $264,857 $287,459 $438,508 $316,750 $361,093<br />
3 $101,657 $165,556 $241,947 $390,177 $519,182 $483,900 $359,076<br />
4 $67,179 $91,064 $132,021 $205,054 $297,579 $193,267 $157,515<br />
5 $130,963 $197,089 $222,992 $375,838 $459,813 $542,000 $210,740<br />
6 $57,509 $88,382 $134,881 $214,293 $340,661 $200,000 $123,479<br />
7 $33,004 $108,828 $147,875 $248,817 $285,568 $174,356<br />
8 $20,317 $24,000 $25,000 $132,000 $27,411<br />
9 $60,669 $71,925 $96,127 $113,824 $137,700 $152,188 $78,509<br />
10 $41,286 $55,267 $59,250 $105,167 $122,000 $69,897<br />
11 $99,667 $110,600 $103,571<br />
12 $77,964 $98,447 $121,112 $154,873 $207,740 $180,477 $178,323<br />
13 $594,367 $568,649 $824,837 $605,582<br />
No Designation $60,938 $136,690 $159,932 $193,714 $320,031 $390,000 $190,365<br />
All $84,455 $130,895 $173,130 $265,745 $377,093 $301,478 $226,952<br />
Sample Size, 2006<br />
Planning Districts Poor Fair Average Very Good Excellent <strong>New</strong> All<br />
1A 1 1 2<br />
1B 3 10 13<br />
2 10 13 14 38 121 6 202<br />
3 91 140 59 123 327 10 750<br />
4 34 34 19 14 36 3 140<br />
5 187 184 69 20 52 1 513<br />
6 132 99 28 15 48 1 323<br />
7 28 18 12 18 37 113<br />
8 12 5 1 1 19<br />
9 145 161 48 17 21 13 405<br />
10 7 12 4 3 6 32<br />
11 9 5 14<br />
12 14 30 42 176 349 30 641<br />
13 15 37 7 59<br />
No Designation 8 21 11 7 16 2 65<br />
All 677 722 307 450 1,062 73 3,291<br />
<strong>New</strong> <strong>Orleans</strong> <strong>Market</strong> <strong>Assessment</strong> – An Analysis of Supply and Demand Dynamics 131
Table A14: Continued: <strong>Orleans</strong> Sales Activity by Condition, 2006<br />
Average Days on <strong>Market</strong>, 2006<br />
Planning Districts Poor Fair Average Very Good Excellent <strong>New</strong> All<br />
1A 46 148 97<br />
1B 268 130 162<br />
2 39 42 63 38 62 108 57<br />
3 36 46 70 68 56 79 55<br />
4 46 86 65 111 76 101 74<br />
5 61 58 84 50 71 114 64<br />
6 57 52 58 91 86 56 61<br />
7 60 52 59 117 76 73<br />
8 52 98 176 84 72<br />
9 50 59 74 61 73 80 59<br />
10 46 41 66 102 50 52<br />
11 86 98 91<br />
12 42 52 60 58 60 109 61<br />
13 110 75 255 106<br />
No Designation 49 68 58 41 66 198 65<br />
All 53 56 70 67 64 115 62<br />
Average Price per Square Foot, 2006<br />
Planning Districts Poor Fair Average Very Good Excellent <strong>New</strong> All<br />
1A $245.54 $157.08 $201.31<br />
1B $260.30 $390.62 $360.54<br />
2 $39.50 $102.12 $126.10 $176.25 $194.66 $151.78 $171.53<br />
3 $58.41 $78.64 $110.28 $175.73 $206.97 $199.31 $152.16<br />
4 $50.97 $57.11 $91.98 $128.95 $145.53 $144.46 $92.14<br />
5 $66.30 $75.20 $89.85 $153.67 $181.72 $162.47 $87.96<br />
6 $34.29 $46.08 $75.71 $100.31 $133.83 $117.65 $59.61<br />
7 $29.44 $72.06 $94.30 $143.16 $188.88 $113.44<br />
8 $16.37 $19.86 $23.67 $99.47 $22.36<br />
9 $29.12 $33.45 $41.44 $68.33 $88.78 $100.67 $39.36<br />
10 $25.54 $30.86 $37.98 $79.29 $78.53 $44.06<br />
11 $37.63 $39.44 $38.27<br />
12 $42.92 $56.17 $74.37 $87.24 $96.75 $107.96 $90.12<br />
13 $153.28 $151.89 $179.90 $155.57<br />
No Designation $47.45 $65.57 $101.56 $110.50 $198.03 $139.23 $109.14<br />
All $46.02 $59.68 $84.29 $129.17 $158.56 $132.91 $102.23<br />
<strong>New</strong> <strong>Orleans</strong> <strong>Market</strong> <strong>Assessment</strong> – An Analysis of Supply and Demand Dynamics 132
Table A15: <strong>Orleans</strong> Sales Activity by Condition, 2007<br />
Average Sale Price, 2007<br />
Planning Districts Poor Fair Average Very Good Excellent <strong>New</strong> All<br />
1A $850,000 $850,000<br />
1B $700,000 $889,000 $1,485,500 $1,209,889<br />
2 $93,787 $86,465 $258,679 $384,197 $429,554 $243,643 $333,858<br />
3 $91,394 $145,120 $213,101 $357,317 $504,630 $468,807 $382,647<br />
4 $49,074 $62,172 $132,675 $247,262 $213,081 $152,000 $131,222<br />
5 $133,556 $172,477 $207,180 $315,625 $376,525 $381,500 $207,708<br />
6 $50,965 $70,548 $152,346 $224,179 $234,217 $370,000 $97,089<br />
7 $31,219 $32,040 $173,500 $229,543 $255,684 $137,360<br />
8 $31,946 $47,000 $121,000 $120,667 $55,498<br />
9 $51,463 $68,415 $101,437 $116,554 $153,743 $153,595 $81,917<br />
10 $39,179 $53,167 $79,000 $115,000 $130,643 $72,770<br />
11 $102,500 $129,000 $195,000 $257,500 $157,300<br />
12 $49,066 $77,916 $127,118 $159,537 $209,576 $183,257 $174,408<br />
13 $435,000 $210,000 $531,364 $571,146 $403,483 $536,243<br />
No Designation $48,750 $77,653 $97,333 $151,175 $377,153 $190,583 $188,867<br />
All $66,378 $90,871 $157,332 $267,754 $344,178 $245,517 $189,168<br />
Sample Size, 2007<br />
Planning Districts Poor Fair Average Very Good Excellent <strong>New</strong> All<br />
1A 1 1<br />
1B 1 7 10 18<br />
2 15 17 12 27 90 14 175<br />
3 33 60 39 79 262 6 479<br />
4 34 32 10 13 42 2 133<br />
5 118 136 25 8 69 6 362<br />
6 196 169 24 14 74 1 478<br />
7 24 20 13 21 19 97<br />
8 10 3 1 3 17<br />
9 250 368 54 26 129 19 846<br />
10 12 6 5 2 7 32<br />
11 2 1 1 1 5<br />
12 14 22 48 101 215 10 410<br />
13 1 1 11 29 4 46<br />
No Designation 8 17 3 8 19 6 61<br />
All 716 852 236 318 970 68 3,160<br />
<strong>New</strong> <strong>Orleans</strong> <strong>Market</strong> <strong>Assessment</strong> – An Analysis of Supply and Demand Dynamics 133
Table A15: Continued: <strong>Orleans</strong> Sales Activity by Condition, 2007<br />
Average Days on <strong>Market</strong>, 2007<br />
Planning Districts Poor Fair Average Very Good Excellent <strong>New</strong> All<br />
1A 84 84<br />
1B 24 65 198 137<br />
2 38 101 44 63 73 61 68<br />
3 75 67 83 90 84 36 82<br />
4 57 84 87 127 100 12 86<br />
5 121 123 164 43 98 202 120<br />
6 111 96 104 97 90 0 101<br />
7 92 73 87 106 137 99<br />
8 91 56 4 31 69<br />
9 83 77 135 75 56 112 80<br />
10 61 38 34 109 63 56<br />
11 23 0 10 79 27<br />
12 55 77 92 102 95 155 96<br />
13 16 102 117 91 149 101<br />
No Designation 113 121 197 41 83 126 102<br />
All 94 88 106 91 86 108 91<br />
Average Price per Square Foot, 2007<br />
Planning Districts Poor Fair Average Very Good Excellent <strong>New</strong> All<br />
1A $220.61 $220.61<br />
1B $169.08 $322.92 $413.75 $364.84<br />
2 $39.79 $50.91 $128.83 $167.67 $196.73 $146.04 $155.92<br />
3 $51.52 $68.13 $133.40 $162.72 $189.82 $210.88 $156.25<br />
4 $33.32 $45.38 $76.24 $94.36 $135.11 $102.84 $78.61<br />
5 $63.75 $69.79 $91.29 $131.67 $154.77 $160.67 $88.38<br />
6 $30.90 $39.34 $70.38 $110.89 $113.91 $119.59 $51.24<br />
7 $24.03 $23.49 $105.02 $147.58 $172.60 $90.62<br />
8 $24.88 $39.57 $75.63 $108.33 $45.18<br />
9 $27.59 $32.53 $44.67 $71.19 $88.07 $101.78 $43.06<br />
10 $25.18 $33.10 $54.73 $65.22 $84.35 $46.73<br />
11 $43.45 $58.64 $76.74 $135.53 $71.56<br />
12 $35.37 $47.58 $74.48 $88.03 $99.26 $120.11 $89.15<br />
13 $85.90 $60.17 $149.85 $151.42 $135.73 $146.27<br />
No Designation $27.98 $41.92 $51.86 $103.86 $195.42 $117.55 $103.95<br />
All $36.09 $43.67 $82.92 $125.80 $146.10 $132.09 $86.49<br />
<strong>New</strong> <strong>Orleans</strong> <strong>Market</strong> <strong>Assessment</strong> – An Analysis of Supply and Demand Dynamics 134
Table A16: <strong>Orleans</strong> Sales Activity by Condition, 2008<br />
Average Sale Price, 2008<br />
Planning Districts Poor Fair Average Very Good Excellent <strong>New</strong> All<br />
1B $379,000 $617,000 $548,333 $751,400 $639,800<br />
2 $46,700 $67,570 $188,400 $373,796 $472,498 $204,282 $326,147<br />
3 $66,329 $166,864 $237,933 $305,546 $489,449 $497,500 $384,149<br />
4 $52,045 $81,909 $121,955 $156,891 $214,440 $123,000 $135,688<br />
5 $129,593 $152,835 $319,500 $316,836 $344,362 $343,214 $242,007<br />
6 $49,461 $61,793 $118,688 $202,453 $215,930 $210,000 $126,730<br />
7 $36,409 $68,413 $219,264 $187,618 $269,037 $124,250 $147,375<br />
8 $18,050 $38,778 $27,868<br />
9 $50,693 $64,115 $110,939 $125,967 $155,971 $226,300 $100,392<br />
10 $30,333 $45,160 $59,300 $116,900 $127,500 $63,298<br />
11 $122,900 $216,000 $192,725<br />
12 $34,372 $73,803 $107,604 $157,401 $201,547 $166,175 $148,009<br />
13 $620,000 $615,000 $547,256 $560,529<br />
No Designation $133,836 $109,514 $85,298 $166,450 $322,933 $155,433 $198,613<br />
All $62,104 $86,304 $165,381 $244,612 $320,345 $214,303 $205,490<br />
Sample Size, 2008<br />
Planning Districts Poor Fair Average Very Good Excellent <strong>New</strong> All<br />
1B 1 1 3 5 10<br />
2 5 15 10 29 61 30 150<br />
3 24 39 40 64 253 3 423<br />
4 11 35 11 16 34 5 112<br />
5 43 92 4 17 105 7 268<br />
6 69 89 16 26 103 1 304<br />
7 16 32 11 17 24 4 104<br />
8 10 9 19<br />
9 73 232 18 15 186 9 533<br />
10 3 11 3 1 4 22<br />
11 1 3 4<br />
12 24 43 43 70 128 8 316<br />
13 1 5 25 31<br />
No Designation 7 7 3 2 14 6 39<br />
All 285 606 161 265 945 73 2,335<br />
<strong>New</strong> <strong>Orleans</strong> <strong>Market</strong> <strong>Assessment</strong> – An Analysis of Supply and Demand Dynamics 135
Table A16: Continued: <strong>Orleans</strong> Sales Activity by Condition, 2008<br />
Average Days on <strong>Market</strong>, 2008<br />
Planning Districts Poor Fair Average Very Good Excellent <strong>New</strong> All<br />
1B 0 56 275 201 189<br />
2 62 73 138 117 90 142 106<br />
3 77 89 98 101 96 133 96<br />
4 93 109 108 105 89 166 103<br />
5 135 144 105 92 101 286 126<br />
6 82 82 115 111 101 203 93<br />
7 83 64 125 109 171 110 107<br />
8 47 49 48<br />
9 92 73 86 78 85 136 82<br />
10 92 65 60 100 75 72<br />
11 56 62 61<br />
12 53 79 109 93 132 285 111<br />
13 23 151 152 148<br />
No Designation 122 59 204 151 64 262 119<br />
All 90 87 107 104 103 181 100<br />
Average Price per Square Foot, 2008<br />
Planning Districts Poor Fair Average Very Good Excellent <strong>New</strong> All<br />
1B $176.53 $220.83 $337.93 $435.90 $359.07<br />
2 $47.34 $42.93 $114.64 $155.96 $179.46 $126.65 $141.98<br />
3 $36.89 $67.81 $126.65 $150.04 $189.78 $198.52 $157.94<br />
4 $39.14 $42.56 $75.02 $95.72 $129.84 $83.22 $81.32<br />
5 $56.34 $69.20 $104.41 $127.28 $150.65 $144.73 $105.23<br />
6 $30.56 $33.83 $56.45 $98.63 $103.49 $122.81 $63.71<br />
7 $26.83 $50.52 $99.33 $115.17 $153.52 $95.45 $88.10<br />
8 $14.70 $26.48 $20.28<br />
9 $28.11 $31.26 $48.89 $75.44 $85.88 $107.97 $53.02<br />
10 $18.00 $26.87 $34.96 $68.76 $82.31 $38.75<br />
11 $31.38 $92.45 $77.19<br />
12 $26.76 $44.46 $62.44 $82.56 $96.88 $113.33 $76.98<br />
13 $115.59 $141.06 $148.88 $146.54<br />
No Designation $38.77 $51.13 $64.91 $169.84 $173.12 $110.66 $109.01<br />
All $33.96 $42.96 $84.80 $118.42 $138.46 $121.53 $94.42<br />
<strong>New</strong> <strong>Orleans</strong> <strong>Market</strong> <strong>Assessment</strong> – An Analysis of Supply and Demand Dynamics 136
Table A17: <strong>Orleans</strong> Sales Activity by Condition, 2009<br />
Average Sale Price, 2009<br />
Planning Districts Poor Fair Average Very Good Excellent <strong>New</strong> All<br />
1A $388,000 $755,000 $571,500<br />
1B $539,875 $1,084,750 $929,071<br />
2 $60,235 $143,986 $240,485 $272,530 $460,528 $230,767 $340,362<br />
3 $70,368 $115,437 $259,695 $349,779 $431,068 $447,500 $352,093<br />
4 $23,458 $38,350 $122,908 $176,793 $205,134 $225,000 $142,484<br />
5 $110,574 $142,531 $230,321 $304,046 $305,032 $325,125 $248,074<br />
6 $37,364 $54,715 $125,691 $193,995 $181,395 $295,000 $127,094<br />
7 $34,725 $44,822 $122,995 $211,078 $283,576 $130,286<br />
8 $13,400 $18,625 $17,100 $127,800 $85,000 $46,810<br />
9 $41,581 $60,846 $93,879 $145,529 $157,893 $159,750 $113,348<br />
10 $26,167 $34,900 $48,333 $113,500 $135,633 $58,129<br />
11 $107,640 $300,000 $257,228 $235,865<br />
12 $55,683 $60,421 $107,334 $155,482 $186,924 $133,000 $141,673<br />
13 $335,500 $390,000 $444,975 $516,139 $685,000 $492,938<br />
No Designation $90,000 $149,500 $290,000 $253,890 $485,860 $147,000 $314,467<br />
All $48,296 $82,354 $159,642 $255,449 $295,115 $269,895 $213,939<br />
Sample Size, 2009<br />
Planning Districts Poor Fair Average Very Good Excellent <strong>New</strong> All<br />
1A 1 1 2<br />
1B 4 10 14<br />
2 10 18 17 30 92 9 176<br />
3 15 46 47 85 244 4 441<br />
4 12 14 28 21 42 1 118<br />
5 18 67 17 19 138 12 271<br />
6 39 56 16 19 113 1 244<br />
7 20 26 11 18 18 93<br />
8 9 4 1 5 1 20<br />
9 54 138 39 23 248 2 504<br />
10 3 7 3 1 3 17<br />
11 1 1 3 5<br />
12 9 40 57 51 117 2 276<br />
13 2 1 4 18 1 26<br />
No Designation 1 6 2 5 15 6 35<br />
All 191 424 240 281 1,067 39 2,242<br />
<strong>New</strong> <strong>Orleans</strong> <strong>Market</strong> <strong>Assessment</strong> – An Analysis of Supply and Demand Dynamics 137
Table A17: Continued: <strong>Orleans</strong> Sales Activity by Condition, 2009<br />
Average Days on <strong>Market</strong>, 2009<br />
Planning Districts Poor Fair Average Very Good Excellent <strong>New</strong> All<br />
1A 69 58 64<br />
1B 218 328 296<br />
2 118 70 111 105 111 63 104<br />
3 54 87 118 106 79 96 88<br />
4 99 85 86 78 116 165 97<br />
5 105 140 108 109 111 253 123<br />
6 93 93 71 115 81 82 88<br />
7 73 104 61 63 146 92<br />
8 37 139 99 104 39 77<br />
9 87 84 96 70 91 214 88<br />
10 50 126 40 43 84 85<br />
11 43 58 263 178<br />
12 94 110 91 136 128 162 118<br />
13 115 128 44 266 2 205<br />
No Designation 1 131 189 86 84 383 147<br />
All 85 99 97 104 103 188 102<br />
Average Price per Square Foot, 2009<br />
Planning Districts Poor Fair Average Very Good Excellent <strong>New</strong> All<br />
1A $95.45 $245.93 $170.69<br />
1B $291.14 $384.80 $358.04<br />
2 $29.88 $67.56 $99.59 $128.94 $188.34 $126.22 $145.11<br />
3 $44.29 $58.87 $105.99 $146.09 $182.63 $208.59 $150.04<br />
4 $22.38 $30.99 $69.90 $116.73 $135.57 $102.27 $92.43<br />
5 $58.72 $58.40 $94.47 $123.98 $136.78 $134.00 $108.54<br />
6 $23.21 $31.16 $59.18 $96.07 $101.01 $109.26 $69.45<br />
7 $24.04 $35.09 $77.51 $129.45 $160.98 $80.36<br />
8 $10.44 $16.73 $16.29 $97.15 $138.89 $40.09<br />
9 $23.17 $29.27 $47.30 $534.79 $85.14 $91.78 $80.82<br />
10 $13.20 $21.67 $37.25 $72.25 $80.62 $36.30<br />
11 $18.77 $93.69 $98.55 $81.62<br />
12 $26.52 $37.93 $58.50 $71.91 $90.84 $99.24 $70.96<br />
13 $85.81 $112.07 $125.57 $130.66 $175.37 $127.43<br />
No Designation $49.18 $53.14 $89.71 $112.11 $191.86 $118.04 $134.12<br />
All $28.10 $40.55 $73.88 $155.19 $133.89 $133.19 $103.46<br />
<strong>New</strong> <strong>Orleans</strong> <strong>Market</strong> <strong>Assessment</strong> – An Analysis of Supply and Demand Dynamics 138
Table A18: <strong>Orleans</strong> Sales Activity by Condition, 2010<br />
Average Sale Price, 2010<br />
Planning Districts Poor Fair Average Very Good Excellent <strong>New</strong> All<br />
1A $50,000 $50,000<br />
1B $1,000,000 $455,000 $1,235,458 $1,162,893<br />
2 $31,901 $82,500 $215,706 $405,415 $509,239 $204,125 $390,089<br />
3 $56,382 $140,194 $213,226 $402,278 $484,130 $582,600 $413,424<br />
4 $19,809 $34,430 $81,876 $189,098 $186,962 $113,021<br />
5 $112,250 $151,814 $218,863 $329,290 $328,779 $349,225 $276,094<br />
6 $44,836 $66,738 $118,089 $263,640 $219,420 $325,375 $157,961<br />
7 $27,211 $76,771 $115,408 $189,045 $260,280 $154,363<br />
8 $9,386 $17,250 $85,000 $18,520<br />
9 $50,384 $64,452 $90,261 $141,555 $155,060 $144,950 $116,531<br />
10 $29,357 $35,500 $56,483 $119,000 $120,000 $55,275<br />
11 $122,500 $140,000 $208,500 $148,375<br />
12 $29,475 $58,396 $92,025 $144,245 $185,167 $221,000 $128,550<br />
13 $95,000 $455,000 $526,782 $498,806<br />
No Designation $21,000 $68,800 $31,450 $188,500 $390,758 $233,000 $235,099<br />
All $48,015 $80,098 $134,512 $284,005 $348,890 $319,752 $247,043<br />
Sample Size, 2010<br />
Planning Districts Poor Fair Average Very Good Excellent <strong>New</strong> All<br />
1A 1 1<br />
1B 1 1 12 14<br />
2 8 8 20 25 77 4 142<br />
3 11 24 24 68 215 5 347<br />
4 9 25 23 21 26 104<br />
5 18 31 8 25 107 4 193<br />
6 28 24 18 20 59 2 151<br />
7 9 21 12 11 27 80<br />
8 7 2 1 10<br />
9 25 60 28 21 128 2 264<br />
10 7 4 3 2 2 18<br />
11 2 1 1 4<br />
12 12 40 38 39 81 2 212<br />
13 1 1 16 18<br />
No Designation 1 5 2 2 10 5 25<br />
All 136 245 179 237 762 24 1,583<br />
<strong>New</strong> <strong>Orleans</strong> <strong>Market</strong> <strong>Assessment</strong> – An Analysis of Supply and Demand Dynamics 139
Table A18: Continued: <strong>Orleans</strong> Sales Activity by Condition, 2010<br />
Average Days on <strong>Market</strong>, 2010<br />
Planning Districts Poor Fair Average Very Good Excellent <strong>New</strong> All<br />
1A 44 44<br />
1B 426 12 182 187<br />
2 132 88 83 97 82 67 87<br />
3 57 89 73 113 75 130 83<br />
4 116 148 90 94 82 105<br />
5 65 119 49 84 79 157 85<br />
6 90 73 75 125 106 171 98<br />
7 37 72 67 62 92 73<br />
8 133 170 150 142<br />
9 52 96 140 149 107 91 106<br />
10 60 34 61 206 185 85<br />
11 36 27 99 50<br />
12 60 87 95 105 97 26 93<br />
13 22 133 205 191<br />
No Designation 184 141 99 130 134 62 120<br />
All 76 98 92 107 93 101 94<br />
Average Price per Square Foot, 2010<br />
Planning Districts Poor Fair Average Very Good Excellent <strong>New</strong> All<br />
1A $35.31 $35.31<br />
1B $211.51 $250.97 $326.27 $312.69<br />
2 $25.66 $60.14 $121.53 $159.83 $174.49 $134.20 $148.49<br />
3 $35.12 $67.19 $108.31 $165.49 $185.32 $223.11 $163.72<br />
4 $13.44 $24.92 $58.49 $112.69 $121.69 $73.27<br />
5 $52.85 $61.29 $103.93 $125.93 $143.60 $148.97 $118.09<br />
6 $24.61 $33.03 $52.24 $88.98 $102.29 $141.65 $69.67<br />
7 $21.90 $48.66 $82.98 $133.43 $176.22 $105.50<br />
8 $7.72 $15.58 $56.67 $14.18<br />
9 $24.64 $29.00 $47.14 $66.18 $83.81 $90.73 $60.51<br />
10 $18.84 $21.73 $33.05 $49.85 $78.57 $31.93<br />
11 $71.65 $74.63 $96.98 $78.73<br />
12 $17.58 $32.95 $52.57 $76.90 $90.40 $91.05 $66.18<br />
13 $65.97 $125.03 $140.93 $135.88<br />
No Designation $17.50 $50.76 $26.34 $104.26 $169.56 $112.07 $111.54<br />
All $26.58 $40.52 $72.44 $123.03 $142.82 $143.98 $106.10<br />
<strong>New</strong> <strong>Orleans</strong> <strong>Market</strong> <strong>Assessment</strong> – An Analysis of Supply and Demand Dynamics 140
Table A19: Road Home Small Rental Summary by Affordability and Bedroom Size<br />
CLOSED ORLEANS<br />
Very Low<br />
Income Low Income<br />
Moderate<br />
Income<br />
Very Low<br />
Income<br />
NULL 3 4 7<br />
1 ‐ One Bedroom 2 2<br />
2 ‐ Two Bedrooms 2 2<br />
3 ‐ Three Bedrooms 1 2 3<br />
Planning District 10 26 4 30<br />
2 ‐ Two Bedrooms 5 5<br />
3 ‐ Three Bedrooms 17 3 20<br />
4 ‐ Four Bedrooms 4 1 5<br />
Planning District 12 24 21 12 57<br />
1 ‐ One Bedroom 3 2 4 9<br />
2 ‐ Two Bedrooms 9 5 2 16<br />
3 ‐ Three Bedrooms 8 6 14<br />
4 ‐ Four Bedrooms 4 8 6 18<br />
Planning District 2 128 56 10 194<br />
0 ‐ Efficiency 2 2<br />
1 ‐ One Bedroom 35 12 1 48<br />
2 ‐ Two Bedrooms 72 19 5 96<br />
3 ‐ Three Bedrooms 15 19 3 37<br />
4 ‐ Four Bedrooms 4 6 1 11<br />
Planning District 3 188 47 16 251<br />
0 ‐ Efficiency 1 1<br />
1 ‐ One Bedroom 34 11 4 49<br />
2 ‐ Two Bedrooms 88 11 6 105<br />
3 ‐ Three Bedrooms 54 21 5 80<br />
4 ‐ Four Bedrooms 11 4 1 16<br />
Planning District 4 363 109 38 510<br />
0 ‐ Efficiency 10 1 11<br />
1 ‐ One Bedroom 66 7 6 79<br />
2 ‐ Two Bedrooms 150 53 25 228<br />
3 ‐ Three Bedrooms 106 47 6 159<br />
4 ‐ Four Bedrooms 28 2 30<br />
5 ‐ Five and more Bedrooms 3 3<br />
Planning District 5 42 19 4 65<br />
1 ‐ One Bedroom 4 3 2 9<br />
2 ‐ Two Bedrooms 15 10 1 26<br />
3 ‐ Three Bedrooms 23 6 1 30<br />
Planning District 6 156 55 15 226<br />
0 ‐ Efficiency 2 2<br />
<strong>New</strong> <strong>Orleans</strong> <strong>Market</strong> <strong>Assessment</strong> – An Analysis of Supply and Demand Dynamics 141
1 ‐ One Bedroom 16 5 1 22<br />
2 ‐ Two Bedrooms 67 19 7 93<br />
3 ‐ Three Bedrooms 58 27 7 92<br />
4 ‐ Four Bedrooms 13 4 17<br />
Planning District 7 212 73 3 288<br />
0 ‐ Efficiency 1 1<br />
1 ‐ One Bedroom 28 17 45<br />
2 ‐ Two Bedrooms 96 25 1 122<br />
3 ‐ Three Bedrooms 70 27 2 99<br />
4 ‐ Four Bedrooms 17 4 21<br />
Planning District 8 175 33 7 215<br />
1 ‐ One Bedroom 15 1 2 18<br />
2 ‐ Two Bedrooms 76 15 4 95<br />
3 ‐ Three Bedrooms 70 12 82<br />
4 ‐ Four Bedrooms 14 5 1 20<br />
Planning District 9 391 115 27 533<br />
1 ‐ One Bedroom 5 5<br />
2 ‐ Two Bedrooms 126 47 12 185<br />
3 ‐ Three Bedrooms 208 59 14 281<br />
4 ‐ Four Bedrooms 52 8 1 61<br />
5 ‐ Five and more Bedrooms 1 1<br />
Grand Total 1708 536 132 2376<br />
NOT CLOSED ORLEANS<br />
Very Low<br />
Income<br />
Low Income<br />
Moderate<br />
Income<br />
Total<br />
NULL 110 28 18 156<br />
0 ‐ Efficiency 2 2<br />
1 ‐ One Bedroom 14 5 3 22<br />
2 ‐ Two Bedrooms 41 17 10 68<br />
3 ‐ Three Bedrooms 48 6 2 56<br />
4 ‐ Four Bedrooms 7 1 8<br />
Planning District 1 2 1 3<br />
2 ‐ Two Bedrooms 2 1 3<br />
Planning District 10 8 10 1 19<br />
2 ‐ Two Bedrooms 4 2 1 7<br />
3 ‐ Three Bedrooms 4 7 11<br />
4 ‐ Four Bedrooms 1 1<br />
Planning District 11 1 1<br />
4 ‐ Four Bedrooms 1 1<br />
Planning District 12 58 37 7 102<br />
0 ‐ Efficiency 3 3<br />
1 ‐ One Bedroom 10 1 1 12<br />
<strong>New</strong> <strong>Orleans</strong> <strong>Market</strong> <strong>Assessment</strong> – An Analysis of Supply and Demand Dynamics 142
2 ‐ Two Bedrooms 23 15 1 39<br />
3 ‐ Three Bedrooms 19 20 4 43<br />
4 ‐ Four Bedrooms 3 1 1 5<br />
Planning District 2 252 87 40 379<br />
0 ‐ Efficiency 2 4 6<br />
1 ‐ One Bedroom 77 23 14 114<br />
2 ‐ Two Bedrooms 113 37 12 162<br />
3 ‐ Three Bedrooms 47 22 3 72<br />
4 ‐ Four Bedrooms 12 5 7 24<br />
5 ‐ Five and more Bedrooms 1 1<br />
Planning District 3 338 132 41 511<br />
0 ‐ Efficiency 4 2 6<br />
1 ‐ One Bedroom 35 20 3 58<br />
2 ‐ Two Bedrooms 164 66 22 252<br />
3 ‐ Three Bedrooms 96 37 13 146<br />
4 ‐ Four Bedrooms 38 7 3 48<br />
5 ‐ Five and more Bedrooms 1 1<br />
Planning District 4 750 262 91 1103<br />
0 ‐ Efficiency 15 4 3 22<br />
1 ‐ One Bedroom 151 39 19 209<br />
2 ‐ Two Bedrooms 368 125 41 534<br />
3 ‐ Three Bedrooms 180 85 23 288<br />
4 ‐ Four Bedrooms 36 9 5 50<br />
Planning District 5 48 29 29 106<br />
1 ‐ One Bedroom 11 5 9 25<br />
2 ‐ Two Bedrooms 20 17 17 54<br />
3 ‐ Three Bedrooms 16 7 3 26<br />
4 ‐ Four Bedrooms 1 1<br />
Planning District 6 245 66 18 329<br />
0 ‐ Efficiency 5 2 7<br />
1 ‐ One Bedroom 19 4 5 28<br />
2 ‐ Two Bedrooms 155 28 8 191<br />
3 ‐ Three Bedrooms 51 26 3 80<br />
4 ‐ Four Bedrooms 15 6 2 23<br />
Planning District 7 592 148 46 786<br />
0 ‐ Efficiency 9 1 10<br />
1 ‐ One Bedroom 81 20 8 109<br />
2 ‐ Two Bedrooms 308 65 21 394<br />
3 ‐ Three Bedrooms 165 51 14 230<br />
4 ‐ Four Bedrooms 29 11 3 43<br />
Planning District 8 426 76 19 521<br />
<strong>New</strong> <strong>Orleans</strong> <strong>Market</strong> <strong>Assessment</strong> – An Analysis of Supply and Demand Dynamics 143
0 ‐ Efficiency 4 4<br />
1 ‐ One Bedroom 33 10 3 46<br />
2 ‐ Two Bedrooms 219 26 10 255<br />
3 ‐ Three Bedrooms 141 31 6 178<br />
4 ‐ Four Bedrooms 32 5 37<br />
5 ‐ Five and more Bedrooms 1 1<br />
Planning District 9 350 113 40 503<br />
1 ‐ One Bedroom 13 2 15<br />
2 ‐ Two Bedrooms 149 19 13 181<br />
3 ‐ Three Bedrooms 147 80 24 251<br />
4 ‐ Four Bedrooms 40 14 1 55<br />
5 ‐ Five and more Bedrooms 1 1<br />
Grand Total 3180 989 350 4519<br />
<strong>New</strong> <strong>Orleans</strong> <strong>Market</strong> <strong>Assessment</strong> – An Analysis of Supply and Demand Dynamics 144
Map of LHFA Housing Projects<br />
<strong>New</strong> <strong>Orleans</strong> <strong>Market</strong> <strong>Assessment</strong> – An Analysis of Supply and Demand Dynamics 145
<strong>New</strong> <strong>Orleans</strong> <strong>Market</strong> <strong>Assessment</strong> – An Analysis of Supply and Demand Dynamics 146
City of <strong>New</strong> <strong>Orleans</strong> ‐ Planning District Summary Data<br />
Summary of Planning District 1<br />
Planning District 1 contain both the historic French Quarter, which draws tourists from all over the<br />
world, and more modern developments such as the <strong>Louisiana</strong> Superdome, <strong>New</strong> <strong>Orleans</strong>’ financial<br />
district (the Central Business District (CBD)) and the <strong>New</strong> <strong>Orleans</strong> Convention Center. Between the<br />
tourist industry and the businesses located in the CBD, this district is the primary economic engine of the<br />
city. Originally developed as St Marie, one of the first neighborhoods outside of the French Quarter, the<br />
CBD benefited from 1970s oil boom when it quickly became the primary business center of <strong>New</strong><br />
<strong>Orleans</strong>. Today, District 1 experiences some of the highest land values in the city.<br />
The historic architecture of the French Quarter collides at Canal Street with the modern skyscrapers of<br />
the CBD which contain a mixture of residential and commercial uses. Structures in the French Quarter<br />
and the Warehouse District typically contain businesses at the street level with residences on the upper<br />
floors. Structures in the CBD typically contain a single use as opposed to those in the French Quarter.<br />
Most structures are used commercially for hotels, stores and offices or residentially for high‐end highrises<br />
apartments. There are limited affordable housing options in the area.<br />
Built on the natural silt levee deposited by the river, District 1 received virtually no flood damage from<br />
Hurricane Katrina. The majority of the damage that occurred was a result of high winds and heavy rain.<br />
Few businesses in the CBD reported 1 to 3 feet of water damage and a small number of rental units<br />
reported flood damage from the storm. Approximately 32% of the units in district 1a sustained damage<br />
of which only 6 units were reported with severe flood damage while 615 reported minor non‐flood<br />
related damage. 1b incurred similar damages with 48% of the units sustaining damage, primarily minor<br />
non‐flood related damages as well. 26<br />
26 FEMA, Katrina, Rita and Wilma Damage Report 2/12/06<br />
<strong>New</strong> <strong>Orleans</strong> <strong>Market</strong> <strong>Assessment</strong> – An Analysis of Supply and Demand Dynamics 147
Household Characteristics<br />
Planning District 1 – French Quarter & CBD<br />
Estimated Renters 2010 3,930<br />
Projected Change in Renters 2010 – 2015 8%<br />
Estimated Owners 2010 1,470<br />
Projected Change in Owners 2010 – 2015 7%<br />
Estimated Households 2010 5,400<br />
Estimated Change in Households 2010 ‐ 2015 8%<br />
Median Household Income, 2010 $48,004<br />
Average Household Size, 2010 0.62<br />
Family Poverty Rate, 2010 1%<br />
Source: Nielson Claritas, Inc. 2010<br />
Housing Characteristics<br />
Planning District 1 – French Quarter & CBD<br />
Total Housing Units 7,235<br />
Single Family Detached 602<br />
Single Family Attached 230<br />
Duplexes 441<br />
Triplexes and Fourplexes 1,065<br />
Small Complex (5‐19 units) 2,231<br />
Medium Complex (20 – 49 units) 678<br />
Large Complex (50+ units) 1,962<br />
Median Age 1939<br />
Units Built After 2000 1,372<br />
Units Built Before 1940 4,418<br />
Total Subsidized Units 753<br />
Source: Nielson Claritas, Inc. 2010 and GCR & Associates, Inc. using data provided by the <strong>Louisiana</strong> Housing Finance Agency and<br />
<strong>Louisiana</strong> Office of Community Development/Disaster Recovery Unit<br />
Housing Cost Characteristics<br />
Planning District 1 – French Quarter & CBD<br />
Average Value, Single Family Home $750,285<br />
Change in Average Value, Single Family Home, 17%<br />
2004‐2009<br />
Source: University of <strong>New</strong> <strong>Orleans</strong> Institute for Economic Development and Real Estate Research and GCR & Associates, Inc.<br />
analysis of sold homes recorded by the <strong>New</strong> <strong>Orleans</strong> Metro Area Association of Realtors.<br />
Survey Results ‐ Characteristics of For Rent Units<br />
Planning District 1 – French Quarter & CBD<br />
Total Units Available for Rent 51<br />
Median Asking Rent, 1‐Bedroom $1,400<br />
<strong>New</strong> <strong>Orleans</strong> <strong>Market</strong> <strong>Assessment</strong> – An Analysis of Supply and Demand Dynamics 148
Median Asking Rent, 2‐Bedroom $2,240<br />
Total Units Available for Rent Accepting Section 8 0<br />
Vouchers<br />
Source: GCR & Associates, Inc. (online, field and phone survey conducted September – October, 2010.)<br />
FEMA Recovery Projects<br />
Planning District 1 – French Quarter & CBD<br />
Project Name<br />
Lafitte Greenway<br />
Gallier Hall Renovations<br />
Project Address<br />
Tremé to Canal Blvd.<br />
545 Saint Charles Ave.<br />
Source: <strong>Louisiana</strong> Office of Community Development/Disaster Recovery Unit (available at www.rebuild.la.gov)<br />
Recovery Project Descriptions<br />
Saenger Theatre Renewal Project‐<br />
The Saenger Theatre originally opened in 1927 and hosted both motion pictures and live theater.<br />
Damaged by Hurricane Katrina, the theater has remained vacant since the storm. The Canal Street<br />
Development Corporation (CSDC) developed a plan to restore the theater through a combination of<br />
public and private financing. The city of <strong>New</strong> <strong>Orleans</strong> earmarked $13 million in Disaster Community<br />
Development Block Grant funding to support the project. The developers are utilizing funds from<br />
several other sources including $2 million from the <strong>Louisiana</strong> Recovery Authority and $38 million in<br />
federal and states tax credits. In total the project is estimated to cost $45.8 million. 27 CSDC expects the<br />
theater to reopen by the end of 2011.<br />
200 Carondelet<br />
Built in 1929, the National American Bank Building was placed on the National Register of Historic Places<br />
in 1986. The Modernistic structure was recently redeveloped into a mixed‐income housing<br />
development with commercial space on the first floor and a variety of residential amenities. Located in<br />
the Central Business District, the development offers 76 one bedroom affordable units for households<br />
earning 60%AMI or less. The development provides affordable housing in close proximity to<br />
transportation options and jobs.<br />
Reinventing the Crescent‐<br />
Reinventing the Crescent is a $294 million project expected to transform and “reclaim” six miles of<br />
unused industrial and commercial space along the Mississippi River. The project will transform the<br />
eastbank of the river from Jackson Avenue to the Industrial Canal. Design schemes include recreational<br />
uses such as dog parks and bike paths, entertainment pavilions at the Mandeville and Piety Wharfs and<br />
public art exhibitions. $30 million in disaster CDBG funds have been allocated to the project. The design<br />
team estimates the project will create over 24,000 new jobs and incentivize investment in the<br />
27 The Times-Picayune, October 21, 2001. Retrieved 11/18/10<br />
http://www.nola.com/politics/index.ssf/2010/10/new_orleans_city_council_is_ex.html<br />
<strong>New</strong> <strong>Orleans</strong> <strong>Market</strong> <strong>Assessment</strong> – An Analysis of Supply and Demand Dynamics 149
esidential, commercial and education industries as a result. 28 Although the project experienced delays<br />
to pushback from surrounding neighborhood associations with concerns regarding park maintenance,<br />
parking safety and the level of noise produced during events, the bid process is complete and<br />
construction should start soon.<br />
930 Poydras‐<br />
The recently opened 21‐ story residential high‐rise at 930 Poydras has 250 residential units renting at<br />
$1,500 per month on average. The 462,000 square foot mixed‐use development includes retail spaces<br />
on the ground level, a 509 space parking garage on the first 8 floors and 12 floors of residential living on<br />
top. Reginelli’s Pizza recently moved into the first floor. The 930 Poydras LLC, Brian Gibbs Development<br />
LLC and Gibbs Construction LLC, combined known as the Gibbs Family Trust, paid $3.12 million for the<br />
land and spent an estimated $60.7 million in the design and construction of the tower. Although the<br />
project originally qualified for Gulf Opportunity Zone bonds, the luxury apartment building completed<br />
construction in the spring of 2010 with alternative funding streams. 29<br />
World Trade Center‐<br />
In its heyday, the World Trade Center (WTC) located at the foot of Canal Street was the center of<br />
maritime trade across Latin America, Europe and the US. The 404‐foot tall tower opened its doors in<br />
1967 as the first world trade center in the country. Today the tower stands mostly empty with the only<br />
tenant being the WTC Incorporated Board of Directors who continues to negotiate their existing lease<br />
with the city. The group requested a $1.2 million buyout of the organization’s leasehold. Under Mayor<br />
Nagin’s administration several bids were considered for redeveloping the structure into a luxury hotel.<br />
Other proposals include creating a civic monument to draw tourist to the area. 30 The recent economic<br />
downturn stifled redevelopment plans. Demolition remains a likely solution to the 12 year effort to<br />
redevelop the WTC.<br />
Benson Tower/ Superdome Entertainment Complex‐<br />
Previously known as the Dominion Tower at 1450 Poydras Street, the new Benson Tower and<br />
surrounding vacant structures were recently purchased by Zelia LLC for $42.1 million. 31 Saints owner<br />
Tom Benson and his family make up the newly formed Zelia LLC group. The group is refurbishing the 26‐<br />
story tower, the 400,000‐ square foot <strong>New</strong> <strong>Orleans</strong> Centre mall and 2,000 space parking garage into a<br />
sports entertainment district and state office building. More than 55 state agencies are expected to<br />
move into the space by the end of 2010. The agreement replaces contracts which expire in two years<br />
28 Reinventing the Crescent, Development Plan. Retrieved 11/18/10<br />
http://www.reinventingthecrescent.org/files/documents/Book_Full_001.pdf<br />
29 The Times-Picayune, “<strong>New</strong> <strong>Orleans</strong> renovation project delays threaten lucrative GO Zone financing,” January 06,<br />
2009. Retrieved 11/19/10. http://www.nola.com/news/index.ssf/2009/01/delays_threaten_go_zone_financ.html<br />
30 Gambit <strong>New</strong> <strong>Orleans</strong>, “Tall Order” August 9, 2010. Retrieved online 11/19/10<br />
http://www.bestofneworleans.com/gambit/tall-order/Contentoid=1330789<br />
31 The Times-Picayune, “Benson family completes purchase of Dominion Tower.” September 15,2009. Retrieved<br />
11/19/10. http://www.nola.com/business/index.ssf/2009/09/benson_family_completes_purcha.html<br />
<strong>New</strong> <strong>Orleans</strong> <strong>Market</strong> <strong>Assessment</strong> – An Analysis of Supply and Demand Dynamics 150
and require the state to pay escalating annual subsidies which recently reached $23.5 million. 32<br />
Although the rental contract is between the state and Benson’s family, the agreement is contingent on<br />
the Saints remaining in <strong>New</strong> <strong>Orleans</strong>. The plaza, which will replace the vacant <strong>New</strong> <strong>Orleans</strong> Centre mall,<br />
will be used for events connected to the Saints, Super Bowls and some <strong>New</strong> <strong>Orleans</strong> Hornets activities.<br />
All earnings from the plaza above $2.3 million will be split evenly between the state and Zelia LLC. The<br />
new plaza will bring job and economic growth with a built‐in stage, music and vendor stands,<br />
restaurants, night clubs and entertainment venues. This deal is the first step towards a thriving sports<br />
and entertainment district<br />
Recent Housing Developments<br />
Planning District 1 – French Quarter & CBD<br />
Project Name<br />
Constance Lofts‐<br />
1041 Constance St.<br />
200 Carondelet‐<br />
200 Carondelet St.<br />
Nine 27‐<br />
1026 Constance St<br />
St. Joe Lofts‐<br />
400 St. Joseph St.<br />
Tivoli Place Apt‐<br />
1040 St. Charles Ave<br />
Fischer IV, Part III Homeownership‐<br />
2135 Landry Blvd<br />
Hoffman Triangle Project‐<br />
Scattered Sites<br />
Miles Legacy‐<br />
Scattered Sites<br />
Cornerstone Estates‐<br />
Scattered Sites<br />
Raymond Joseph Drive‐<br />
Scattered Sites<br />
Lafitte Redevelopment Blocks 1‐3‐<br />
Description<br />
1. LIHTC and CDBG<br />
2. Mid‐rise<br />
3. <strong>Market</strong> Rate‐ 27 Affordable‐ 23<br />
1. LIHTC and CDBG<br />
2. High‐rise<br />
3. <strong>Market</strong> Rate‐ 114 Affordable‐ 76<br />
1. LIHTC and CDBG<br />
2. Mid‐rise<br />
3. <strong>Market</strong> Rate‐ 60 Affordable‐ 16<br />
1. LIHTC<br />
2. Mid‐rise<br />
3. <strong>Market</strong> Rate‐ 11 Affordable‐ 50<br />
1. LIHTC<br />
2. High‐rise<br />
3. <strong>Market</strong> Rate‐ 0 Affordable‐ 166<br />
1. Housing Trust Fund<br />
2. Single Family Houses<br />
3. <strong>Market</strong> Rate‐ 0 Affordable‐ 26<br />
1. HOME<br />
2. Single & Double Family Houses<br />
3. <strong>Market</strong> Rate‐ 0 Affordable‐ 5<br />
1. Housing Trust Fund<br />
2. Single & Double Family Houses<br />
3. <strong>Market</strong> Rate‐ 0 Affordable‐ 10<br />
1. HOME<br />
2. Single & Double Family Houses<br />
3. <strong>Market</strong> Rate‐ 0 Affordable‐ 15<br />
1. Housing Trust Fund<br />
2. Single & Double Family Houses<br />
3. <strong>Market</strong> Rate‐ 0 Affordable‐ 20<br />
1. LIHTC and CDBG<br />
32 The Times-Picayune, “<strong>New</strong> <strong>Orleans</strong> Saints, Superdome game plan is multilayered effort for state,” February 21, 2010.<br />
Retrieved 11/19/10. http://www.nola.com/business/index.ssf/2010/02/new_orleans_saints_complicated.html<br />
<strong>New</strong> <strong>Orleans</strong> <strong>Market</strong> <strong>Assessment</strong> – An Analysis of Supply and Demand Dynamics 151
2421 Magic St. 2. Low‐rise<br />
3. <strong>Market</strong> Rate‐ 0 Affordable‐ 134<br />
Source: GCR & Associates, Inc. analysis of data provided by <strong>Louisiana</strong> Housing Finance Agency and <strong>Louisiana</strong> Office of<br />
Community Development<br />
Assessor Data<br />
Planning District 1 – French Quarter & CBD<br />
Total Residential Properties 3,877<br />
Properties with Homestead Exemption 1,223<br />
Residential Properties without Homestead 2,654<br />
Exemption<br />
Average Assessed Value, Residential Properties $105,494<br />
Commercial Properties 3,809<br />
Source: <strong>Louisiana</strong> Tax Commission, 2010<br />
GCR Activity Index©<br />
Planning District 1 – French Quarter & CBD<br />
Total Residential Addresses 1,899<br />
Active Addresses 1,818<br />
Inactive Addresses 81<br />
Percentage Inactive 4.27%<br />
Change in Activity 2008 ‐ 2010 7.9%<br />
Commercial Addresses 1,790<br />
Active Addresses 1,570<br />
Inactive Addresses 220<br />
Percentage Inactive 11.6%<br />
Change in Activity 2008 ‐ 2010 ‐0.27%<br />
Source: GCR Activity Index is a determination of address‐level activity based on utility usage, mail delivery service, garbage<br />
collection, voter registration and spot surveys.<br />
Area Businesses<br />
Planning District 1 – French Quarter & CBD<br />
Total Businesses 930<br />
Retail 654<br />
Restaurants 275<br />
Grocery and Food 1<br />
Total Business Earnings<br />
n/a<br />
Total Employees<br />
n/a<br />
Source: Dun and Bradstreet, 2010<br />
<strong>New</strong> <strong>Orleans</strong> <strong>Market</strong> <strong>Assessment</strong> – An Analysis of Supply and Demand Dynamics 152
Summary of Planning District 2<br />
District 2 experienced residential development as early as the 1830s at which point the extravagant<br />
houses of the Garden District were built during the same time period as the modest workforce housing<br />
developed in Central City. The topography of the district exemplifies a cross section of <strong>New</strong> <strong>Orleans</strong> as a<br />
whole displaying the juxtaposition of economic and ethnic diversity as it corresponds with geography.<br />
Affluent single family structures are typically located on high ground closer to the river while the<br />
workforce housing found at the northern point of the district in Hoffman Triangle and Zion City were<br />
significantly affected by flood waters.<br />
Most of the neighborhoods remain primarily residential with a few major commercial thoroughfares.<br />
Magazine Street and St Charles Avenue are epitomized as successful organic examples of mixeddevelopments<br />
prized by <strong>New</strong> Urbanists across the country. Oretha Castle Haley Boulevard, originally<br />
named Dryades Street, was once a prominent shopping district said to rival Canal Street as an<br />
entertainment and shopping alternative for ethnically diverse communities. Although the shopping<br />
corridor fell on hard times during the oil bust of the 1980s, a renewal effort began in the 1990s and<br />
continues today through the programs such as the OC Haley Boulevard Main Street project and Parkway<br />
Partners community garden programs. The largely low‐ to middle‐class population is comprised of<br />
primarily renters except in a few enclaves such as the Garden District. Three large public housing<br />
developments are located within the district including Rivergarden (formally St. Thomas development),<br />
Guste and CJ Peete (currently under construction).<br />
The high ground along the river did not incur much damage and has recently experienced increased<br />
repopulation rates as many incoming residents move to higher ground. Central City and Milan<br />
repopulated at a much slower pace because many of the housing units were severely damaged by flood<br />
waters. Across the district, approximately 50% of the units sustained damage, just over 3,000 owner<br />
occupied units were damaged and 6,700 rental units were damaged. 33<br />
33 FEMA, Katrina, Rita and Wilma Damage Report 2/12/06<br />
<strong>New</strong> <strong>Orleans</strong> <strong>Market</strong> <strong>Assessment</strong> – An Analysis of Supply and Demand Dynamics 153
Household Characteristics<br />
Planning District 2 – Garden District<br />
Estimated Renters 2010 12,218<br />
Projected Change in Renters 2010 – 2015 13%<br />
Estimated Owners 2010 6,426<br />
Projected Change in Owners 2010 – 2015 12%<br />
Estimated Households 2010 18,644<br />
Estimated Change in Households 2010 ‐ 2015 13%<br />
Median Household Income, 2010 $26,250<br />
Median Household Size, 2010 2.15<br />
Family Poverty Rate, 2010 25%<br />
Source: Nielson Claritas, Inc. 2010<br />
Housing Characteristics<br />
Planning District 2 – Garden District<br />
Total Housing Units 21,570<br />
Single Family Detached 5,506<br />
Single Family Attached 3,294<br />
Duplexes 2,286<br />
Triplexes and Fourplexes 3,204<br />
Small Complex (5‐19 units) 4,046<br />
Medium Complex (20 – 49 units) 977<br />
Large Complex (50+ units) 1,417<br />
Median Age 1942<br />
Units Built After 2000 1,387<br />
Units Built Before 1940 10,730<br />
Total Subsidized Units 2,358<br />
Housing Cost Characteristics<br />
Planning District 2 – Garden District<br />
Average Value, Single Family Home $340,362<br />
Change in Average Value, Single Family Home, 8%<br />
2004‐2009<br />
Characteristics of For Rent Units<br />
Planning District 2 – Garden District<br />
Total Units Available for Rent 218<br />
Median Asking Rent, 1‐Bedroom $750<br />
Median Asking Rent, 2‐Bedroom $900<br />
<strong>New</strong> <strong>Orleans</strong> <strong>Market</strong> <strong>Assessment</strong> – An Analysis of Supply and Demand Dynamics 154
Total Units Available for Rent Accepting Section 8 3<br />
Vouchers<br />
Source: GCR & Associates, Inc. (online, field and phone survey conducted September – October, 2010.)<br />
FEMA Recovery Projects<br />
Planning District 2 – Garden District<br />
Project Name<br />
Broad and Washington Streetscape<br />
South Claiborne Streetscape<br />
Oretha Castle Haley Blvd Streetscape<br />
Lyons Center<br />
Project Address<br />
S. Broad @ Fourth to <strong>Louisiana</strong><br />
S. Claiborne @ Napoleon Ave. to Martin Luther<br />
King Jr. Blvd.<br />
Oretha Castle Haley Blvd @ Felicity – MLK Blvd.<br />
624 <strong>Louisiana</strong> Ave.<br />
Recovery Project Descriptions<br />
Oretha Castle Haley Streetscape‐<br />
Historic Oretha Castle Haley Boulevard developed as the commercial corridor for Central City in the<br />
1830s and peaked in the 1940s with more than 200 businesses lining the boulevard. Urban<br />
deterioration and disinvestment negatively affected the boulevard starting in the late 60s. 34 Today a<br />
handful of businesses and nonprofits have dedicated financial resources in an effort to spark<br />
revitalization of the corridor which was earmarked as a node of recovery in the <strong>New</strong> <strong>Orleans</strong> Master<br />
Plan. Listed as one of Mayor Landrieu’s 100 recovery projects, the streetscape development of O.C.<br />
Haley will assist organizations along the boulevard with anticipated renewal of the area. With an<br />
expected $3million budget, the project may include sidewalk improvements, bikeways, traffic and<br />
pedestrian signage, landscaping, lighting and public art along OC Haley Boulevard between Felicity<br />
Street and Martin Luther King Jr. Boulevard. The project, which is currently in the design phase, will<br />
bring much needed public investment along the blocks of the corridor that has seen the most private<br />
investment since Hurricane Katrina.<br />
Muses‐<br />
Located one block south of O.C. Haley Boulevard and one block north of St. Charles Avenue, the Muses<br />
mixed‐income development is located in the Central City neighborhood. The total development cost is<br />
estimated at $60 million and was funded with a combination of private investment, Gulf Opportunity<br />
(GO Zone) tax credits and Community Development Block Grant (CDBG) funds. The first phase of the<br />
development consisting of 211 apartment units is complete and the second phase consisting of another<br />
52 units is currently under construction. Of the 263 units 106 are reserved for low income renters.<br />
Another 4,000 square feet of development will be designated for commercial use. Disinvestment in the<br />
34 Historical references taken from GNOCDC, Central City/Garden District Neighborhood Snapshot, Retrieved<br />
11/07/10 http://www.gnocdc.org/orleans/6/index.html<br />
<strong>New</strong> <strong>Orleans</strong> <strong>Market</strong> <strong>Assessment</strong> – An Analysis of Supply and Demand Dynamics 155
area has been extensive, leaving the neighborhood filled with blighted and vacant properties. The<br />
particular lots developed by the Muses project have been vacant since before 2005.<br />
1409 Oretha Castle Haley Boulevard‐<br />
The <strong>New</strong> <strong>Orleans</strong> Redevelopment Authority (NORA), First Evangelist Housing and Community<br />
Development Corporation and the Gulf Coast Housing Partnership have partnered together to construct<br />
an 84,000 square foot mixed‐use development at the corner of Martin Luther King Jr. Boulevard and<br />
Oretha Castle Haley Boulevard. The four story structure will fill the 1400 block of O.C. Haley which<br />
currently consists of several vacant and blighted properties. NORA will relocate its offices to the upper<br />
floors of the structure which will also include 20,000 square feet of commercial space and 70 mixedincome<br />
apartments for seniors aged 55 and older. First Evangelist Housing and Community<br />
Development Corporation will provide on‐site services for the elderly residents.<br />
River Garden Redevelopment‐<br />
Developed through the HUD HOPE VI program, the former St. Thomas Housing Development began its<br />
transformation in October 2001 when most of the units were demolished. Now known as the River<br />
Garden Development, the mixed‐use community is located in the Lower Garden District. The first phase<br />
of construction was completed prior to Hurricane Katrina with a total project cost of $31.4 million for<br />
296 apartments. After Hurricane Katrina, 38 single‐family homeownership houses, 347 mixed‐income<br />
apartments and 57 elderly units were constructed. 48% of the units developed thus far are reserved for<br />
low income renters and homeowners. Another 100 offsite project based rental units and 50 affordable<br />
homeownership units are in the planning stage.<br />
Harmony Oaks Development‐<br />
Formerly known as C.J. Peete, Harmony Oaks is a mixed‐income development financed with Gulf<br />
Opportunity (GO Zone) tax credits, Community Development Block Grant (CDBG) funds and private<br />
investments. Located in the Central City neighborhood, the development is located eight blocks from St.<br />
Charles Avenue, a fairly pedestrian friendly commercial corridor with traditional street car transit, and<br />
two blocks from Claiborne Avenue, a large commercial thoroughfare with limited pedestrian mobility.<br />
Of the 510 rental and homeownership units, 75% of the units are reserved for low income households.<br />
Fifty homeownership units will be developed as in‐fill housing in the surrounding neighborhood in an<br />
effort to boost investment in the community. All of the onsite units are under construction and<br />
expected to be complete by the end of 2011.<br />
Recent Housing Developments<br />
Planning District 2 – Garden District<br />
Project Name<br />
Workforce Housing Now‐<br />
3109 & 3111 St. Thomas<br />
Description<br />
1. Housing Trust Fund<br />
2. Single Family Houses<br />
3. <strong>Market</strong> Rate‐ 0 Affordable‐ 3<br />
<strong>New</strong> <strong>Orleans</strong> <strong>Market</strong> <strong>Assessment</strong> – An Analysis of Supply and Demand Dynamics 156
Guste I‐<br />
1301 Simon Bolivar Blvd <strong>New</strong> <strong>Orleans</strong><br />
Handleman Lofts‐<br />
1824‐1832 Oretha Castle Haley Blvd<br />
River Garden Elderly Apts‐<br />
2017 Laurel St<br />
Flint Goodridge Apartments‐<br />
2425 Constance St<br />
Redemptorist Apts‐<br />
2050 Constance St<br />
CHS <strong>New</strong> <strong>Orleans</strong> I‐<br />
Various Locations<br />
GCHP‐MLK‐<br />
1931 MLK Blvd<br />
CJ Peete I‐<br />
2520 Washington Ave<br />
River Garden Historic Apts‐<br />
1801 St. Thomas<br />
River Garden CS II‐<br />
1800‐1900 St. Thomas<br />
The Muses II‐<br />
1731 Polymnia Street<br />
Liberty Place Apartments‐<br />
2301‐31 Toledano<br />
Crescent Garden Homes‐<br />
Various Locations<br />
The Muses‐<br />
1731 Polymnia Street<br />
1. LIHTC<br />
2. Low‐rise<br />
3. <strong>Market</strong> Rate‐ 0 Affordable‐ 82<br />
1. LIHTC<br />
2. Mid‐rise<br />
3. <strong>Market</strong> Rate‐ 0 Affordable‐ 24<br />
1. LIHTC<br />
2. Garden<br />
3. <strong>Market</strong> Rate‐ 0 Affordable‐ 57<br />
1. LIHTC<br />
2. Mid‐rise<br />
3. <strong>Market</strong> Rate‐ 0 Affordable‐ 89<br />
1. LIHTC<br />
2. Mid‐rise<br />
3. <strong>Market</strong> Rate‐ 0 Affordable‐ 107<br />
1. LIHTC<br />
2. Single family<br />
3. <strong>Market</strong> Rate‐ 63 Affordable‐ 43<br />
1. LIHTC and CDBG<br />
2. Mid‐rise<br />
3. <strong>Market</strong> Rate‐ 21 Affordable‐ 49<br />
1. LIHTC and CDBG<br />
2. Low‐rise, townhouse<br />
3. <strong>Market</strong> Rate‐ 130 Affordable‐ 330<br />
1. LIHTC<br />
2. Low‐rise, townhouse<br />
3. <strong>Market</strong> Rate‐ 0 Affordable‐ 37<br />
1. LIHTC and CDBG<br />
2. Low‐rise, townhouse<br />
3. <strong>Market</strong> R ate‐ 186 Affordable‐ 124<br />
1. LIHTC and CDBG<br />
2. Mid‐rise<br />
3. <strong>Market</strong> Rate‐ 41 Affordable‐ 11<br />
1. LIHTC<br />
2. Low‐rise<br />
3. <strong>Market</strong> Rate‐ 0 Affordable‐ 34<br />
1. LIHTC and CDBG<br />
2. Single & Double Family Houses<br />
3. <strong>Market</strong> Rate‐ 86 Affordable‐ 57<br />
1. LIHTC and CDBG<br />
2. Mid‐rise<br />
3. <strong>Market</strong> Rate‐ 135 Affordable‐ 76<br />
Assessor Data<br />
Planning District 2 – Garden District<br />
<strong>New</strong> <strong>Orleans</strong> <strong>Market</strong> <strong>Assessment</strong> – An Analysis of Supply and Demand Dynamics 157
Total Residential Properties 8,812<br />
Properties with Homestead Exemption 4,078<br />
Residential Properties without Homestead 4,734<br />
Exemption<br />
Average Assessed Value, Residential Properties $26,829<br />
Commercial Properties 2,705<br />
GCR Activity Index©<br />
Planning District 2 – Garden District<br />
Total Residential Addresses 14,193<br />
Active Addresses 11,648<br />
Inactive Addresses 2,545<br />
Percentage Inactive 17.9%<br />
Change in Activity 2008 ‐ 2010 8.02%<br />
Commercial Addresses 1,660<br />
Active Addresses 1,331<br />
Inactive Addresses 329<br />
Percentage Inactive 19.81%<br />
Change in Activity 2008 ‐ 2010 3.86%<br />
Area Businesses<br />
Planning District 2 – Garden District<br />
Total Businesses 372<br />
Retail 289<br />
Restaurants 79<br />
Grocery and Food 4<br />
Total Business Earnings $606,197,000.00<br />
Total Employees 4,498<br />
<strong>New</strong> <strong>Orleans</strong> <strong>Market</strong> <strong>Assessment</strong> – An Analysis of Supply and Demand Dynamics 158
Summary of Planning District 3<br />
Originally incorporated in the town of Carrollton, Planning District 3 is in the southwestern corner of the<br />
city and is bordered by the river on the south and Jefferson Parish on the west. The area was<br />
incorporated into <strong>New</strong> <strong>Orleans</strong> proper in 1874. Development trends in the district are similar to<br />
tendencies found in districts one and two, with older residential development located close to the river<br />
and along natural occurring ridges in the land. Low‐lying land was not developed until the 1920s and<br />
30s. Most of the neighborhoods are filled with Victorian and Craftsman style single family, two family<br />
and small multi‐family residences with a fairly even mix of owner occupied units and rental properties.<br />
The district retains the residential qualities originally incorporated in the initial development of the area<br />
with few changes regarding university development and limited commercial expansion along South<br />
Carrollton Avenue, St Charles Avenue, Magazine Street, South Claiborne Avenue and Maple Street. The<br />
area is well known for the number of collegiate establishments including Tulane University, Loyola<br />
University, and <strong>New</strong>comb College, Tulane’s college for women established in 1870. 35 There is a healthy<br />
mix of homeowners and renters living in primarily market‐rate structures with the exceptions of<br />
Hollygrove and Dixon areas. Recent rental surveys in Hollygrove and Dixon show a large percentage of<br />
available rental stock identified as Section 8 rental properties, however there are no large developments<br />
targeting low‐income residents. 36<br />
Approximately 61% of all the housing units in the district were damaged by Hurricane Katrina. 37 Most of<br />
the damage in the district was caused by flooding generally affecting neighborhoods located further<br />
away from the Mississippi River such as Broadmoor, Fountainbleau, Hollygrove and Dixon. Areas across<br />
the income spectrum were affected by the storm from affluent neighborhoods to low‐income areas<br />
both rental and owner occupied. Rebuilding in the area was driven by a robust network of<br />
neighborhood associations.<br />
35 Historical references taken from GNOCDC, Uptown District Neighborhood Snapshot, Retrieved 11/07/10<br />
http://www.gnocdc.org/orleans/6/index.html<br />
36 Survey taken September 2010<br />
37 FEMA, Katrina, Rita and Wilma Damage Report 2/12/06<br />
<strong>New</strong> <strong>Orleans</strong> <strong>Market</strong> <strong>Assessment</strong> – An Analysis of Supply and Demand Dynamics 159
Household Characteristics<br />
Planning District 3 ‐ Uptown<br />
Estimated Renters 2010 12,017<br />
Projected Change in Renters 2010 – 2015 12%<br />
Estimated Owners 2010 14,327<br />
Projected Change in Owners 2010 – 2015 13%<br />
Estimated Households 2010 26,344<br />
Estimated Change in Households 2010 ‐ 2015 12%<br />
Median Household Income, 2010 $38,377<br />
Average Household Size, 2010 3.04<br />
Family Poverty Rate, 2010 12%<br />
Source: Nielson Claritas, Inc. 2010<br />
Housing Characteristics<br />
Planning District 3 ‐ Uptown<br />
Total Housing Units 28,363<br />
Single Family Detached 13,246<br />
Single Family Attached 3,438<br />
Duplexes 5,890<br />
Triplexes and Fourplexes 3,100<br />
Small Complex (5‐19 units) 1,519<br />
Medium Complex (20 – 49 units) 339<br />
Large Complex (50+ units) 400<br />
Median Age 1939<br />
Units Built After 2000 1,838<br />
Units Built Before 1940 15,556<br />
Total Subsidized Units 1,130<br />
Housing Cost Characteristics<br />
Planning District 3 ‐ Uptown<br />
Average Value, Single Family Home $352,093<br />
Change in Average Value, Single Family Home, 8%<br />
2004‐2009<br />
Characteristics of For Rent Units<br />
Planning District 3 ‐ Uptown<br />
Total Units Available for Rent 244<br />
Median Asking Rent, 1‐Bedroom $788<br />
Median Asking Rent, 2‐Bedroom $975<br />
<strong>New</strong> <strong>Orleans</strong> <strong>Market</strong> <strong>Assessment</strong> – An Analysis of Supply and Demand Dynamics 160
Total Units Available for Rent Accepting Section 8 10<br />
Vouchers<br />
Source: GCR & Associates, Inc. (online, field and phone survey conducted September – October, 2010.)<br />
Recovery Projects<br />
Planning District 3 – Uptown<br />
Project Name<br />
Rosa Keller Library<br />
Napoleon, Broad and Fontainebleau Intersection<br />
Design<br />
Harrell Stadium<br />
Latter Library Renovations<br />
Earhart Blvd Roadway Improvements<br />
Napoleon‐Freret Roadway Improvements<br />
Freret St Streetscape<br />
Marlyville & Fontainbleau Road Repairs<br />
Broadmoor Streetscape<br />
Carrollton Hollygrove Senior Center<br />
Wisner Playground<br />
South Carrollton Ave Streetscape<br />
Project Address<br />
4300 S Broad St.<br />
Broad Street @ Napoleon Ave.<br />
2300 Leonidas St.<br />
5120 St. Charles Avenue<br />
Earhart Blvd @ Hamilton St<br />
Napoleon @ Freret<br />
Freret St @ Napoleon Ave<br />
Marlyville & Fontainbleau Road Repairs<br />
General Pershing @ Broad St. to Miro St.<br />
3300 Hamilton St.<br />
4877 Laurel St.<br />
Carrollton Ave @ Palmetto St<br />
Recovery Project Descriptions<br />
<strong>Louisiana</strong> Freedman‐<br />
Located in the Uptown neighborhood between Audubon and Broadway Streets and south of Earhart<br />
Boulevard, the <strong>Louisiana</strong> Freedmen Home was the first Low Income Tax Credit finance multifamily<br />
housing complex to be built with modular construction. The development consists of 29 threebedroom,<br />
two‐bath apartments reserved for low‐ and moderate‐income families. The $4.7 million in<br />
construction costs was financed through a combination of <strong>Louisiana</strong> Housing Finance Agency’s HOME<br />
funds, Gulf Opportunity Zone credits, energy credits and private investments. 38<br />
Broadmoor Streetscape‐<br />
The Broadmoor neighborhood located in the Uptown Planning District sustained severe damage due to<br />
nine foot high flood water. Many of the public amenities were damaged and are in need of repair. The<br />
Broadmoor Streetscape project will funnel $250,000 into the communities’ public thoroughfares such as<br />
sidewalks, bikeways, street signage, landscaping, lighting and public art. The project will focus its<br />
resources on General Pershing Street between Broad and Miro Streets.<br />
38 The Urban Institute. “Affordable Rental Housing in Healthy Communities, Rebuilding after Hurricanes Katrina and<br />
Rita.” May 2007. Retrieved 11/19/10 http://www.urban.org/UploadedPDF/411514_affordable_rental_housing.pdf<br />
<strong>New</strong> <strong>Orleans</strong> <strong>Market</strong> <strong>Assessment</strong> – An Analysis of Supply and Demand Dynamics 161
Rosa F. Keller Library‐<br />
Rosa F. Keller Library is located in the Broadmoor neighborhood and is an integral asset for residents<br />
that chose to return and rebuild in the community. During Hurricane Katrina, the library received<br />
approximately 2 feet of water which remained in the building for over a week. FEMA identified storm<br />
related damages resulting in repair costs estimated at 53% more than the replacement costs. $15.8<br />
million has been funneled from FEMA to the replacement costs of several libraries in <strong>New</strong> <strong>Orleans</strong> and in<br />
2009 FEMA announced an additional $2 million dedicated to the replacement of Rosa Keller Library. 39<br />
The <strong>Louisiana</strong> Recovery Authority and the City of <strong>New</strong> <strong>Orleans</strong> also earmarked funds for library<br />
replacement across the city. In total the Rosa Keller Library received $3.4 million in recovery funds. In<br />
addition, the library also received a $2 million grant from the Carnegie Corporation of <strong>New</strong> York for<br />
rebuilding, restocking and refurbishing. 40 Construction on the library began in June of 2010 and<br />
estimated to take approximately 370 days.<br />
Carrollton‐Hollygrove Senior Center‐<br />
Located at 3300 Hamilton, the Carrollton‐Hollygrove Senior Center was founded in 1977 as a community<br />
facility for elderly members of the community. The center provides a variety of services including an<br />
adult daycare program and a community health center. 41 Hollygrove received an estimated nine feet in<br />
flood waters during Hurricane Katrina. The center is scheduled to receive approximately $1.8 million<br />
from the city’s recovering funds and is currently in the planning phase.<br />
Recent Housing Developments<br />
Planning District 3 ‐ Uptown<br />
Project Name<br />
Project Address<br />
Tudor Square Apartments‐<br />
3011 Milan Street<br />
Palmetto Apt Homes‐<br />
3980 Cambronne Street<br />
<strong>Louisiana</strong> Freedmen‐<br />
3103‐3135 Audubon St<br />
Wisdom Manor‐<br />
4324 General Ogden Street<br />
Description<br />
1. LIHTC<br />
2. Low‐rise<br />
3. <strong>Market</strong> Rate‐ 0 Affordable‐ 51<br />
1. LIHTC and HOME<br />
2. Low‐rise<br />
3. <strong>Market</strong> Rate‐ 74 Affordable‐ 50<br />
1. LIHTC<br />
2. Duplex<br />
3. <strong>Market</strong> Rate‐ 0 Affordable‐ 29<br />
1. LIHTC<br />
2. Mid‐rise<br />
39 FEMA. “Broadmoor Neighborhood’s Rosa F. Keller Library Funded for Replacement.” September 28, 2009.<br />
Retrieved 11/19/10. http://www.fema.gov/news/newsrelease.femaid=49592<br />
40 Clinton Global Initiative. "Community Identifies Rosa F. Keller Library as Priority Project." Press Release, Harvard<br />
University, Belfer Center for Science and International Affairs, June 19, 2007<br />
41 GNOCDC Hollygrove Neighborhood Snapshot. Retrieved 11/19/10.<br />
http://www.gnocdc.org/orleans/3/12/snapshot.html<br />
<strong>New</strong> <strong>Orleans</strong> <strong>Market</strong> <strong>Assessment</strong> – An Analysis of Supply and Demand Dynamics 162
3. <strong>Market</strong> Rate‐ 0 Affordable‐ 32<br />
Cypress Manor I Apts.‐<br />
8401 Stroelitz St<br />
Opportunity Homes‐<br />
9019 Oleander<br />
Black Pearl Homes‐<br />
7467 Leake<br />
A.B.E. Homes‐<br />
9310 & 9312 Belfast St<br />
Jo Green‐<br />
9013 & 9015 Green<br />
La. Georgia Housing Collaborative‐<br />
1319 Gen. Ogden<br />
His Work Homes‐<br />
9302 & 9304 Fig<br />
1. LIHTC and CDBG<br />
2. Mid‐rise<br />
3. <strong>Market</strong> Rate‐ 0 Affordable‐ 32<br />
1. LIHTC<br />
2. Single & Double Family Houses<br />
3. <strong>Market</strong> Rate‐ 0 Affordable‐ 54<br />
1. Housing Trust Fund<br />
2. Single Family Houses<br />
3. <strong>Market</strong> Rate‐ 0 Affordable‐ 3<br />
1. Housing Trust Fund<br />
2. Single Family Houses<br />
3. <strong>Market</strong> Rate‐ 5 Affordable‐ 3<br />
1. Housing Trust Fund<br />
2. Single Family Houses<br />
3. <strong>Market</strong> Rate‐ 1 Affordable‐ 4<br />
1. Housing Trust Fund<br />
2. Single Family Houses<br />
3. <strong>Market</strong> Rate‐ 2 Affordable‐ 2<br />
1. Housing Trust Fund<br />
2. Single Family Houses<br />
3. <strong>Market</strong> Rate‐ 3 Affordable‐ 0<br />
Assessor Data<br />
Planning District 3 ‐ Uptown<br />
Total Residential Properties 16,549<br />
Properties with Homestead Exemption 9,054<br />
Residential Properties without Homestead 7,495<br />
Exemption<br />
Average Assessed Value, Residential Properties $32,919<br />
Commercial Properties 1,377<br />
GCR Activity Index©<br />
Planning District 3 ‐ Uptown<br />
Total Residential Addresses 26,260<br />
Active Addresses 22,451<br />
Inactive Addresses 1,061<br />
Percentage Inactive 4.04%<br />
Change in Activity 2008 ‐ 2010 2.75%<br />
Commercial Addresses 1,244<br />
Active Addresses 1,031<br />
Inactive Addresses 231<br />
<strong>New</strong> <strong>Orleans</strong> <strong>Market</strong> <strong>Assessment</strong> – An Analysis of Supply and Demand Dynamics 163
Percentage Inactive 18.6%<br />
Change in Activity 2008 ‐ 2010 ‐5.56%<br />
Area Businesses<br />
Planning District 3 ‐ Uptown<br />
Total Businesses 338<br />
Retail 239<br />
Restaurants 93<br />
Grocery and Food 6<br />
Total Business Earnings $715,494,000.00<br />
Total Employees 3,987<br />
Summary of Planning District 4<br />
Planning District 4 consists of the eight neighborhoods that stretch across the middle of the city above<br />
South Claiborne Avenue from Martin Luther King Boulevard to Elysian Fields Avenue and Highway 610<br />
East. Much of the district was low‐lying swampland until drainage projects opened the area for<br />
development in the late 19 th century. Development of the district followed two primary trends,<br />
proximity to the French Quarter and topography. Reflecting architectural designs from the early 20 th<br />
century, residential structures in district 4 include bungalows, shotguns doubles and a few double<br />
galleries.<br />
Primarily a low‐ and middle‐income district with a large percentage of rental units, approximately 64%<br />
of all units in the area are renter occupied. Planning District 4 has the highest family poverty rate in the<br />
city and contains four large public housing developments in a range of redevelopment stages. 42 Lafitte,<br />
BW Cooper and St. Bernard housing developments are currently under construction, while Iberville is in<br />
the design phase. Although most of the district is residential, there are large corridors of commercial<br />
and industrial uses which generally coincide with large thoroughfares.<br />
The district is comprised of generally low laying land which received up to 6 or 7 feet of water during<br />
Katrina and roughly 75% of the housing stock was damaged. 43 With half of the units in the district<br />
severely damaged or destroyed by the storm, several outside developers have targeted the area’s empty<br />
warehouses and low‐rise structures for mixed‐income developments. Others are used for art studios,<br />
Mardi Gras dens, and commercial uses. Many of the historic warehouses, however, remain vacant<br />
including the Dixie Brewery and Blue Plate Mayonnaise.<br />
42 Claritas<br />
43 FEMA, Katrina, Rita and Wilma Damage Report 2/12/06<br />
<strong>New</strong> <strong>Orleans</strong> <strong>Market</strong> <strong>Assessment</strong> – An Analysis of Supply and Demand Dynamics 164
Household Characteristics<br />
Planning District 4 – Mid City<br />
Estimated Renters 2010 13,086<br />
Projected Change in Renters 2010 – 2015 11%<br />
Estimated Owners 2010 7,267<br />
Projected Change in Owners 2010 – 2015 14%<br />
Estimated Households 2010 20,353<br />
Estimated Change in Households 2010 – 2015 12%<br />
Median Household Income, 2010 $24,286<br />
Average Household Size, 2010 2.35<br />
Family Poverty Rate, 2010 28%<br />
Source: Nielson Claritas, Inc. 2010<br />
Housing Characteristics<br />
Planning District 4 – Mid City<br />
Total Housing Units 22,774<br />
Single Family Detached 6,941<br />
Single Family Attached 4,859<br />
Duplexes 3,644<br />
Triplexes and Fourplexes 3,122<br />
Small Complex (5‐19 units) 2,437<br />
Medium Complex (20 – 49 units) 508<br />
Large Complex (50+ units) 892<br />
Median Age 1943<br />
Units Built After 2000 714<br />
Units Built Before 1940 10,159<br />
Total Subsidized Units 4,455<br />
Housing Cost Characteristics<br />
Planning District 4 – Mid City<br />
Average Value, Single Family Home $142,484<br />
Change in Average Value, Single Family Home, 13%<br />
2004‐2009<br />
Characteristics of For Rent Units<br />
Planning District 4 – Mid City<br />
Total Units Available for Rent 283<br />
<strong>New</strong> <strong>Orleans</strong> <strong>Market</strong> <strong>Assessment</strong> – An Analysis of Supply and Demand Dynamics 165
Median Asking Rent, 1‐Bedroom $750<br />
Median Asking Rent, 2‐Bedroom $850<br />
Total Units Available for Rent Accepting Section 8 9<br />
Vouchers<br />
Source: GCR & Associates, Inc. (online, field and phone survey conducted September – October, 2010.)<br />
Recovery Projects<br />
Planning District 4 – Mid City<br />
Project Name<br />
Project Address<br />
Saenger Theatre Renewal Project<br />
801 N Rampart St<br />
Louis Armstrong Park & Old Fire Station<br />
901 N Rampart St<br />
Claiborne Avenue Streetscape<br />
Claiborne Ave @ Cleveland St.<br />
Nora Navra Library Design‐Build<br />
1902 St. Bernard Ave.<br />
St. Bernard Ave<br />
St. Bernard Ave @ Claiborne Ave‐ N. Miro St.<br />
Comiskey Park & Playground<br />
Corner of S. Jeff Davis Pkwy & Baudin<br />
Tulane Ave and Jeff Davis Pkwy Streetscape Tulane Ave @ Jeff Davis Pkwy Streetscape<br />
Rosenwald Center<br />
1120 S Broad St.<br />
NOFD Engine 26<br />
436 S Jefferson Davis Pkwy<br />
Gert Town Community Pool<br />
7400 Stroelitz Street<br />
Hunter's Field<br />
1600 North Claiborne Ave.<br />
Broad St. and Lafitte St Streetscape<br />
Broad St. @ Bienville St to <strong>Orleans</strong> Ave<br />
BW Cooper Infrastructure<br />
BW Cooper Housing Project<br />
Bayou Rd Streetscape<br />
Bayou Rd @ Broad St to Rocheblave St<br />
Treme Center<br />
900 N Villere St.<br />
VA Medical Center<br />
Mid City<br />
Claiborne Ave<br />
Claiborne Ave @ Esplanade Ave to St. Anthony St<br />
Gentilly Roadway Improvements<br />
Gentilly St.<br />
Tulane University Community Health Clinic 711 N. Broad Street<br />
Carrollton Intersection S. Carrollton Ave.@ Palm St. to I‐10<br />
Norwood Thompson Playground<br />
7200 Forshey St.<br />
<strong>New</strong> <strong>Orleans</strong> <strong>Market</strong> <strong>Assessment</strong> – An Analysis of Supply and Demand Dynamics 166
Recovery Project Descriptions<br />
VA/ LSU Hospital Development‐<br />
Both the VA Medical Center and LSU Charity Hospital incurred severe damages during Hurricane Katrina.<br />
After the storm neither hospital returned to <strong>New</strong> <strong>Orleans</strong> leaving veterans, underinsured and lowincome<br />
populations without adequate health care. The VA received $3.3 million in federal money in<br />
March 2010 to prepare the construction site. Another $325 million in federal disaster‐recovery funds<br />
and $300 million in VA major‐construction funding will cover more than 60% of the estimated $995<br />
million for the VA hospital alone. Construction of a new LSU Academic Medical Center will cost an<br />
estimated $833 million. Combined the two projects will cost an estimated $2 billion. The hospitals will<br />
provide over 500 beds combined, hospice care and state of the art medical facilities.<br />
Lafitte Greenway‐<br />
The proposed Lafitte Greenway, also known as the Lafitte Corridor, will run along what was once the<br />
Carondelet Basin. The 3.1 mile linear park will connect the French Quarter with Lake Pontchartrain via<br />
Bayou St. John. The project will create a corridor of continuous parks, bike trails, recreational facilities<br />
and pedestrian public greenspace running through the center of the city. Currently in the bid and award<br />
phase, the $11.6 million in disaster‐recovery funds was recently allocated to the project. Set‐backs due<br />
to contractual issues between the city and the development firm initially hired to complete the corridor<br />
have delayed the project. A new Request for Proposals from the city was issued in March 2010.<br />
Lafitte Housing Development‐<br />
Providence Community Housing and Enterprise were selected to design the redevelopment strategies<br />
for the revitalization of the former 896‐unit Lafitte development. The group has incorporated the HOPE<br />
VI design strategies in the redevelopment process for the project incorporating the Lafitte Resident<br />
Council’s input in the designs and a promise to provide community support services for all residents.<br />
When construction is complete, the project will feature 1,500 homes and apartments which include 276<br />
public housing units, 524 affordable rental units and 600 homeownership units. This plan reduces the<br />
number of onsite units from 900 to 517 which will include both rental units and 61 homeownership<br />
units, 40 of which will be sold to households earning no more than 80% of the HUD area median.<br />
Nora Navra Neighborhood Library‐<br />
Located at 1902 St. Bernard Avenue, the new 6,100 square feet Nora Navra Neighborhood Library will<br />
include meeting rooms, Wi‐Fi, enterprise space and the basic library collection. The original library was<br />
completely destroyed by Hurricane Katrina. The replacement facility will not be located on the original<br />
footprint of the library. The $3.2 million project is currently under construction.<br />
<strong>New</strong> <strong>Orleans</strong> <strong>Market</strong> <strong>Assessment</strong> – An Analysis of Supply and Demand Dynamics 167
Recent Housing Developments<br />
Planning District 4 – Mid City<br />
Project Name<br />
Project Address<br />
GCHP‐Esplanade‐<br />
2535 Esplanade Avenue<br />
Lafitte Redev. Offsite III‐<br />
2528 Conti<br />
Dorgenois Lofts‐<br />
2601 Perdido Streets<br />
Lafitte Off‐site Rehabs‐<br />
1212 Columbus<br />
Lafitte Redev. Adjudicated Housing‐<br />
1936 Conti<br />
Lafitte Senior Housing‐<br />
700 North Galvez<br />
2222 Tulane Apartments‐<br />
2222 Tulane Avenue<br />
For The Children‐<br />
1603 & 1605 Gentilly<br />
The Meridian‐<br />
750 S. Jefferson Davis Pkwy<br />
Classic Construction of NO Venture I‐<br />
2126‐28 Annette St<br />
St. Michael Senior Housing (formerly Tulane)‐<br />
3433 Tulane Avenue<br />
The Terraces‐<br />
3615 Tulane Ave<br />
Eleven 37 Apts‐<br />
1137 Esplande Avenue<br />
1540 House‐<br />
1540 Johnson St<br />
Description<br />
1. LIHTC and HOME<br />
2. Mid‐rise<br />
3. <strong>Market</strong> Rate‐ 0 Affordable‐ 42<br />
1. LIHTC<br />
2. Low‐rise<br />
3. <strong>Market</strong> Rate‐ 0 Affordable‐ 95<br />
1. LIHTC<br />
2. Mid‐rise<br />
3. <strong>Market</strong> Rate‐ 0 Affordable‐ 20<br />
1. LIHTC<br />
2. Single & Double Family Houses<br />
3. <strong>Market</strong> Rate‐ 0 Affordable‐ 46<br />
1. LIHTC<br />
2. Single & Double Family Houses<br />
3. <strong>Market</strong> Rate‐ 0 Affordable‐ 84<br />
1. LIHTC<br />
2. Mid‐rise<br />
3. <strong>Market</strong> Rate‐ 0 Affordable‐ 100<br />
1. LIHTC and HOME<br />
2. Mid‐rise<br />
3. <strong>Market</strong> Rate‐ 0 Affordable‐ 60<br />
1. Housing Trust Fund<br />
2. Single & Double Family Houses<br />
3. <strong>Market</strong> Rate‐ 2 Affordable‐ 5<br />
1. LIHTC<br />
2. Mid‐rise<br />
3. <strong>Market</strong> Rate‐ 0 Affordable‐ 56<br />
1. LIHTC<br />
2. Mid‐rise<br />
3. <strong>Market</strong> Rate‐ 0 Affordable‐ 56<br />
1. LIHTC<br />
2. Mid‐rise<br />
3. <strong>Market</strong> Rate‐ 0 Affordable‐ 60<br />
1. LIHTC<br />
2. Garden<br />
3. <strong>Market</strong> Rate‐ 0 Affordable‐ 199<br />
1. LIHTC<br />
2. Mid‐rise<br />
3. <strong>Market</strong> Rate‐ 0 Affordable‐ 199<br />
1. Housing Trust Fund<br />
2. Mid‐rise<br />
3. <strong>Market</strong> Rate‐ 0 Affordable‐ 12<br />
<strong>New</strong> <strong>Orleans</strong> <strong>Market</strong> <strong>Assessment</strong> – An Analysis of Supply and Demand Dynamics 168
BW Cooper II‐<br />
3402 Earhart<br />
Lafitte Redevelopment Blocks 5‐7‐<br />
2016 <strong>Orleans</strong> Ave<br />
Cypress Manor II Apts.‐<br />
3613 Cambronne St<br />
Falstaff Apartments‐<br />
2600 Gravier St<br />
The Preserve‐<br />
4301 Tulane Ave<br />
The Crescent Club‐<br />
3000 Tulane Ave<br />
The Marquis Apts‐<br />
710 Broad Street<br />
St. Bernard II‐<br />
4050 Hamburg Street<br />
St. Bernard I‐<br />
3801 St. Bernard Ave<br />
1. LIHTC<br />
2. Mid‐rise<br />
3. <strong>Market</strong> Rate‐ 123 Affordable‐ 287<br />
1. LIHTC<br />
2. Mid‐rise<br />
3. <strong>Market</strong> Rate‐ 0 Affordable‐ 105<br />
1. LIHTC<br />
2. Garden<br />
3. <strong>Market</strong> Rate‐ 0 Affordable‐ 48<br />
1. LIHTC<br />
2. Mid‐rise<br />
3. <strong>Market</strong> Rate‐ 72 Affordable‐ 75<br />
1. LIHTC<br />
2. Mid‐rise<br />
3. <strong>Market</strong> Rate‐ 109 Affordable‐ 74<br />
1. LIHTC<br />
2. Mid‐rise<br />
3. <strong>Market</strong> Rate‐ 136 Affordable‐ 91<br />
1. LIHTC<br />
2. Mid‐rise<br />
3. <strong>Market</strong> Rate‐ 150 Affordable‐ 100<br />
1. LIHTC<br />
2. Garden<br />
3. <strong>Market</strong> Rate‐ 17 Affordable‐ 32<br />
1. LIHTC<br />
2. Garden<br />
3. <strong>Market</strong> Rate‐ 156 Affordable‐ 310<br />
Assessor Data<br />
Planning District 4 – Mid City<br />
Total Residential Properties 9,966<br />
Properties with Homestead Exemption 3,987<br />
Residential Properties without Homestead 5,979<br />
Exemption<br />
Average Assessed Value, Residential Properties $16,271<br />
Commercial Properties 1,439<br />
GCR Activity Index©<br />
Planning District 4 – Mid City<br />
Total Residential Addresses 20,387<br />
Active Addresses 14,886<br />
Inactive Addresses 5,501<br />
Percentage Inactive 26.98%<br />
<strong>New</strong> <strong>Orleans</strong> <strong>Market</strong> <strong>Assessment</strong> – An Analysis of Supply and Demand Dynamics 169
Change in Activity 2008 ‐ 2010 15.06%<br />
Commercial Addresses 2,366<br />
Active Addresses 1,601<br />
Inactive Addresses 765<br />
Percentage Inactive 32.33%<br />
Change in Activity 2008 ‐ 2010 3.15%<br />
Area Businesses<br />
Planning District 4 – Mid City<br />
Total Businesses 317<br />
Retail 238<br />
Restaurants 77<br />
Grocery and Food 3<br />
Total Business Earnings $1,008,541,000.00<br />
Total Employees 3,797<br />
Total Annual Wages<br />
Average Annual Wage<br />
<strong>New</strong> <strong>Orleans</strong> <strong>Market</strong> <strong>Assessment</strong> – An Analysis of Supply and Demand Dynamics 170
Summary of Planning District 5<br />
Development of Planning District 5 evolved from early entertainment attractions such as lake front<br />
resorts, the earliest being the redevelopment of Spanish Fort into a resort area in 1823, to early 20 th<br />
century suburban style neighborhoods. The area was not developed for residential purposes until after<br />
the swamps were drained around 1910; however most of the housing stock was built after World War II<br />
in the late 1940s, 50s and 60s. The district is also home to the largest park in the city, City Park, which<br />
was developed in 1872.<br />
Developed as a suburban escape with access to leisure activities including City Park, country clubs and<br />
Lake Pontchartrain, the majority of the residential structures are single family homes with limited multifamily<br />
structures located around Delgado Community College. The district is a primarily middle to<br />
upper‐middle income community. Most of the district is comprised of residential uses with commercial<br />
uses designated to major thoroughfares including Robert E Lee Boulevard and Harrison Avenue. Both<br />
residential and commercial structures were severely impacted by flood depths exceeding eight feet in<br />
some area.<br />
The district was devastated with flood waters after the London Avenue Canal breached shortly after<br />
Hurricane Katrina. 83% of all housing units in the district sustained damage and all of the owner<br />
occupied units were damaged. 44 Over half of the residential units in the area were severely damaged or<br />
destroyed. Almost all of the businesses in the district received over two feet of flooding and the West<br />
End Marina was nearly washed away by the tidal wave. The Robert E. Lee Shopping Center and several<br />
smaller commercial developments have returned.<br />
44 FEMA, Katrina, Rita and Wilma Damage Report 2/12/06<br />
<strong>New</strong> <strong>Orleans</strong> <strong>Market</strong> <strong>Assessment</strong> – An Analysis of Supply and Demand Dynamics 171
Household Characteristics<br />
Planning District 5 ‐ Lakeview<br />
Estimated Renters 2010 2,202<br />
Projected Change in Renters 2010 – 2015 10%<br />
Estimated Owners 2010 5,397<br />
Projected Change in Owners 2010 – 2015 10%<br />
Estimated Households 2010 7,599<br />
Estimated Change in Households 2010 ‐ 2015 10%<br />
Median Household Income, 2010 $66,204<br />
Average Household Size, 2010 0.88<br />
Family Poverty Rate, 2010 3%<br />
Source: Nielson Claritas, Inc. 2010<br />
Housing Characteristics<br />
Planning District 5 ‐ Lakeview<br />
Total Housing Units 7,976<br />
Single Family Detached 4,650<br />
Single Family Attached 783<br />
Duplexes 1,407<br />
Triplexes and Fourplexes 484<br />
Small Complex (5‐19 units) 281<br />
Medium Complex (20 – 49 units) 72<br />
Large Complex (50+ units) 113<br />
Median Age 1950<br />
Units Built After 2000 52<br />
Units Built Before 1940 2,025<br />
Total Subsidized Units 171<br />
Housing Cost Characteristics<br />
Planning District 5 ‐ Lakeview<br />
Average Value, Single Family Home $248,074<br />
Change in Average Value, Single Family Home, ‐18%<br />
2004‐2009<br />
Characteristics of For Rent Units<br />
Planning District 5 ‐ Lakeview<br />
Total Units Available for Rent 42<br />
<strong>New</strong> <strong>Orleans</strong> <strong>Market</strong> <strong>Assessment</strong> – An Analysis of Supply and Demand Dynamics 172
Median Asking Rent, 1‐Bedroom $895<br />
Median Asking Rent, 2‐Bedroom $995<br />
Total Units Available for Rent Accepting Section 8 0<br />
Vouchers<br />
Source: GCR & Associates, Inc. (online, field and phone survey conducted September – October, 2010.)<br />
Recovery Projects<br />
Planning District 5 – Lakeview<br />
Project Name<br />
City Park Festival and Recreation Complex<br />
City Park Road repairs<br />
Robert E. Smith Library Design‐Build<br />
Fleur de Lis Roadway Improvements<br />
<strong>New</strong> <strong>Orleans</strong> Museum of Art<br />
Catina & Louisville Roadway Improvements<br />
Drain Point Repair Services<br />
Gernon Brown Gym Renovations<br />
NOPD Police Stables<br />
Harrison Ave Bridge over Bayou St. John<br />
Improvements<br />
Lakeshore ‐ Lake Vista Road Repairs<br />
Marconi Blvd. Bikeways<br />
Harrison Ave Streetscape<br />
West Roadway<br />
West End Park<br />
West End Road Repairs<br />
Municipal Yacht Harbor Repairs<br />
Project Address<br />
1Palm Drive, City Park<br />
City Park Ave<br />
6301 Canal Blvd.<br />
Fleur de Lis @ Veterans Blvd to Harrison Ave<br />
1 Collins Diboll Circle<br />
Catina @ Mouton to Robert E Lee and Louisville @<br />
Filmore to Robert E Lee<br />
Navarre Neighborhood<br />
1001 Harrison Ave.<br />
Harrison Avenue & Marconi Dr.<br />
Harrison Ave Bridge @ Bayou St. John<br />
Lakeshore @ Lake Vista<br />
Marconi Blvd @ Robert E. Lee to Norfolk Southern<br />
Railroad<br />
Harrison Ave @ West End Blvd to <strong>Orleans</strong> Ave<br />
West Roadway @ Lake Marina Ave<br />
South Rd<br />
West End Ave<br />
401 N. Roadway St.<br />
Recovery Project Descriptions<br />
<strong>New</strong> <strong>Orleans</strong> Museum of Art‐<br />
Located in City Park, the <strong>New</strong> <strong>Orleans</strong> Museum of Art will receive $5.9 million for renovations to the<br />
museum facilities. Over all, City Park received $43 million in damages during Hurricane Katrina. The<br />
park received little to no public funding until after the storm. Dependent on donations and event fees,<br />
the park has completed a number of recovery projects since 2005. The current renovations are<br />
currently in the design phase.<br />
Municipal Yacht Harbor Repairs‐<br />
<strong>New</strong> <strong>Orleans</strong> <strong>Market</strong> <strong>Assessment</strong> – An Analysis of Supply and Demand Dynamics 173
Damaged by the storm surge which pushed contents from the marine service yards and boathouses into<br />
the marina, the Municipal Yacht Harbor is still in need of repair. After the storm, it was estimated that<br />
over 125 sunken vessels lay at the bottom of the marina. 45 The marina was also full of fuel from<br />
destroyed boats and chemicals from the nearby marine service yards. Cleanup involved not only<br />
removing destroyed boats and removing chemicals from the water, but repairing the infrastructure of<br />
the harbor itself. Three projects have been identified and funded in an effort to repair the harbor.<br />
Repairs to the Harbor Administration Building, the Boat House and the Harbor facilities including piers,<br />
bulkheads and rental slips are in the design and bid/ award phases. The combined cost to the city is<br />
estimated at $31 million.<br />
City Park Festival and Recreation Complex‐<br />
The 1,300 acre park suffered approximately $43 million in damages during Hurricane Katrina. 46 The<br />
park, which prior to Katrina receive little to no public assistance, is operated and managed by the nonprofit<br />
City Park Improvement Association (CPIA). Since the storm, the CPIA has completed several<br />
recovery projects with funds from FEMA and private investors. Now the CPIA is focusing on creating a<br />
better regional park with improved amenities. Identified as one of Mayor Mitch Landrieu’s 100 recovery<br />
projects, the 62 acres City Park Festival and Recreation Complex will be built with a projected budget of<br />
$4 million. The project is currently in the bid and award phase.<br />
Assessor Data<br />
Planning District 5 ‐ Lakeview<br />
Total Residential Properties 7,253<br />
Properties with Homestead Exemption 4,302<br />
Residential Properties without Homestead 2,951<br />
Exemption<br />
Average Assessed Value, Residential Properties $22,681<br />
Commercial Properties 647<br />
GCR Activity Index©<br />
Planning District 5 ‐ Lakeview<br />
Total Residential Addresses 11,296<br />
Active Addresses 8,095<br />
Inactive Addresses 3,201<br />
Percentage Inactive 28.34%<br />
Change in Activity 2008 ‐ 2010 14%<br />
Commercial Addresses 361<br />
Active Addresses 262<br />
45 Mad Mariner, Daily Boating Magazine. “Katrina’s Marina Damage.” January 13, 2008. Retrieved 11/19/10<br />
http://madmariner.com/news/story/NEW_ORLEANS_KATRINA_MARINA_DAMAGE_011008_AP#<br />
46 City Park, <strong>New</strong> <strong>Orleans</strong> website. Retrieved 11/19/10<br />
http://neworleanscitypark.com<br />
<strong>New</strong> <strong>Orleans</strong> <strong>Market</strong> <strong>Assessment</strong> – An Analysis of Supply and Demand Dynamics 174
Inactive Addresses 99<br />
Percentage Inactive 27.42%<br />
Change in Activity 2008 ‐ 2010 ‐0.62%<br />
Area Businesses<br />
Planning District 5 ‐ Lakeview<br />
Total Businesses 71<br />
Retail 52<br />
Restaurants 18<br />
Grocery and Food 1<br />
Total Business Earnings $133,650,000.00<br />
Total Employees 694<br />
<strong>New</strong> <strong>Orleans</strong> <strong>Market</strong> <strong>Assessment</strong> – An Analysis of Supply and Demand Dynamics 175
Summary of Planning District 6<br />
A significant force in the development of Planning District 6 was Pontchartrain Beach, which opened in<br />
1928. The amusement park located on the south shore of Lake Pontchartrain drew crowds of families<br />
along Elysian Fields Avenue on the Pontchartrain Railroad. Much of the land in district 6 was swampland<br />
until several canals were built in the area between 1900 and 1945. 47 Developed following World War II,<br />
the 8.8 square miles of the district are zoned primarily for residential uses and retain the architectural<br />
character of the time.<br />
Most of the single family structures that make up the district’s housing stock are homeowner occupied<br />
with the exception of mid‐rise multifamily rental developments near the University of <strong>New</strong> <strong>Orleans</strong> and<br />
Dillard University. The mostly middle‐income neighborhoods are generally ethnically diverse with large<br />
student populations and residents over the age of 65. The four higher education facilities located in the<br />
district provided significant economic engines in the wake of Hurricane Katrina providing jobs and<br />
support to the community. Dillard University, Southern University, The <strong>New</strong> <strong>Orleans</strong> Baptist Theological<br />
Seminary and the University of <strong>New</strong> <strong>Orleans</strong> have been highly involved in redeveloping the district.<br />
Approximately 84% of the units were inundated with flood water of more than four feet deep. 48 Unlike<br />
other neighborhoods which were buoyed by strong neighborhood associations or national media,<br />
Gentilly has recovered slowly with limited direction. Recent momentum stems from unique<br />
partnerships between government agencies, non‐profits, residents, banks and the area universities<br />
which have collaborated to create programs to support new development both residential and<br />
commercial.<br />
47 Historical references taken from GNOCDC, Gentilly District Neighborhood Snapshot, Retrieved 11/09/10<br />
http://www.gnocdc.org/orleans/6/index.html<br />
48 FEMA, Katrina, Rita and Wilma Damage Report 2/12/06<br />
<strong>New</strong> <strong>Orleans</strong> <strong>Market</strong> <strong>Assessment</strong> – An Analysis of Supply and Demand Dynamics 176
Household Characteristics<br />
Planning District 6 ‐ Gentilly<br />
Estimated Renters 2010 2,451<br />
Projected Change in Renters 2010 – 2015 3%<br />
Estimated Owners 2010 7,975<br />
Projected Change in Owners 2010 – 2015 7%<br />
Estimated Households 2010 10,426<br />
Estimated Change in Households 2010 ‐ 2015 7%<br />
Median Household Income, 2010 $46,950<br />
Average Household Size, 2010 1.2<br />
Family Poverty Rate, 2010 7%<br />
Source: Nielson Claritas, Inc. 2010<br />
Housing Characteristics<br />
Planning District 6 ‐ Gentilly<br />
Total Housing Units 10,947<br />
Single Family Detached 7,639<br />
Single Family Attached 882<br />
Duplexes 1,126<br />
Triplexes and Fourplexes 302<br />
Small Complex (5‐19 units) 162<br />
Medium Complex (20 – 49 units) 68<br />
Large Complex (50+ units) 193<br />
Median Age 1954<br />
Units Built After 2000 31<br />
Units Built Before 1940 1,566<br />
Total Subsidized Units 1,018<br />
Housing Cost Characteristics<br />
Planning District 6 ‐ Gentilly<br />
Average Value, Single Family Home $127,094<br />
Change in Average Value, Single Family Home, ‐7%<br />
2004‐2009<br />
Characteristics of For Rent Units<br />
Planning District 6 ‐ Gentilly<br />
Total Units Available for Rent 102<br />
<strong>New</strong> <strong>Orleans</strong> <strong>Market</strong> <strong>Assessment</strong> – An Analysis of Supply and Demand Dynamics 177
Median Asking Rent, 1‐Bedroom $750<br />
Median Asking Rent, 2‐Bedroom $875<br />
Total Units Available for Rent Accepting Section 8 0<br />
Vouchers<br />
Source: GCR & Associates, Inc. (online, field and phone survey conducted September – October, 2010.)<br />
Recovery Projects<br />
Planning District 6 – Gentilly<br />
Project Name<br />
Mosquito Control Administration Building<br />
Joseph Bartholomew Concessions, Club House &<br />
Maintenance Warehouse Building Repairs<br />
Pontchartrain Park<br />
Joseph Bartholomew Golf Course<br />
Milne Boys Home<br />
Parks & Parkways Gentilly Facility<br />
Norman Mayer Library Design‐Build<br />
Robert E. Lee Blvd Bikeways<br />
Park Island Bridge over Bayou St. John<br />
Filmore Road Repairs<br />
St. Anthony Path Landscape<br />
Gentilly Streetscape<br />
Wesley Barrow Stadium<br />
Gentilly Woods Road Repairs<br />
Robert E. Lee Blvd and Paris Ave. Roadway<br />
Improvements<br />
Project Address<br />
Leon C. Simon Blvd @ Elysian Field Ave.<br />
6514 Congress Dr.<br />
5721 Press Drive, 6455 Press Drive, 482 Hayne<br />
Blvd<br />
6514 Congress Dr.<br />
5420 Franklin Ave.<br />
2829 Gentilly Blvd.<br />
2098 Foy St.<br />
Robert E. Lee Blvd @ St. Bernard Ave to Paris Ave<br />
Park Island Bridge @ Bayou St. John<br />
Filmore St<br />
St. Anthony Path @ Mirabeau to Pelopidas<br />
Gentilly @ Caton, Gentilly & Elysian Fields<br />
6500 Press Dr.<br />
Gentilly Woods Neighborhood<br />
Robert E. Lee Blvd @ Perlita Dr to Chatham & Paris<br />
Ave. @ Robert E Lee<br />
Recovery Project Descriptions<br />
Gentilly Boulevard and Elysian Fields Avenue‐<br />
Identified during the Unified <strong>New</strong> <strong>Orleans</strong> Plan (UNOP) as a primary intersection of transit and<br />
commerce, the residents of District 6 requested the intersection be redeveloped into a town center<br />
which would drive recovery in the surrounding neighborhoods. The town center proposed by Andres<br />
Duany integrated mixed‐use development and greenspace. The design gained the support of residents,<br />
business owners and public officials, but never came to fruition. The intersection is still considered a<br />
target area of investment by city officials. Approximately $700,000 has been earmarked for streetscape<br />
improvements including sidewalk repair, new bikeways, signage, landscaping and public art. Retail<br />
stores have continued to return to the intersection and most of the store fronts are in use. Still the<br />
design phase, the project will assist in the beautification process of the highly trafficked intersection.<br />
<strong>New</strong> <strong>Orleans</strong> <strong>Market</strong> <strong>Assessment</strong> – An Analysis of Supply and Demand Dynamics 178
Gentilly Woods Shopping Center‐<br />
With $38 million in federal recovery aid, the <strong>New</strong> <strong>Orleans</strong> Redevelopment Authority (NORA) has<br />
purchased vacant and blighted properties all over the city. In October 2008, NORA purchased the<br />
Gentilly Woods Shopping Center for $4.3 million in an effort to direct commercial and residential<br />
redevelopment into the neighborhood. The shopping center was almost completely occupied at the<br />
time of the storm when the property received an estimated $15 million in flood damages.<br />
Redevelopment of the commercial site is part of a larger plan to redevelop the Pontilly Area, which<br />
includes the Pontilly Housing Opportunity Zone and renovations to the Pontchartrain Park Golf Course. 49<br />
The site will remain a strip mall, but with façade improvements estimated at $23.6 million. 50 Based on<br />
community input, the redevelopment plan will incorporate a department store and a full‐service<br />
grocery. Possible tenants proposed by the development firm in December 2009 included TJ Maxx and<br />
Marshall’s department stores and Albertson’s grocery.<br />
Pontchartrain Park Combined Investments‐<br />
Built in 1956, Pontchartrain Park neighborhood golf course was the first African American golf course<br />
built in <strong>New</strong> <strong>Orleans</strong>. In 1979 the golf course was renamed Joe M. Bartholomew Sr. Municipal Golf<br />
Course after the prominent African American golf course architect who designed the course. 51 The park<br />
and surrounding neighborhood was severely damaged during Hurricane Katrina. Approximately $32.3<br />
million was designated for park renovations in Mayor Landrieu’s list of recovery projects. Currently in<br />
the design phase, the Pontchartrain Park community golf course will receive $500,000 for renovations<br />
and enhancements to the course. $2.7 million will be used to complete the renovations of the<br />
concession building, lights and park grounds. The project is currently in the bid and award phase.<br />
Norman Mayer Library Design‐Build‐<br />
Classified as the new “Music Branch” the Norman Mayer Library located in the Gentilly district will<br />
include public computers, Wi‐Fi, community meeting rooms and children’s story time room. The original<br />
library built in 1949 was completely destroyed by Hurricane Katrina. 52 Construction of the 21,000<br />
square foot library began in December 2009. The $6.3 million replacement branch is expected to open<br />
in June 2010.<br />
Milne Boys Home‐<br />
49 NORA, Gentilly Woods Shopping Center, Project Description. Retrieved 11/22/10<br />
http://www.rebuildrecoveroneneworleans.com/media/docs/Gentilly%20Woods%20Commercial%20Acquisition%20P<br />
roject%20Decription.pdf<br />
50 The Times-Picayune, “NORA passes on Wal-mart, sticks with strip-mall plan for Gentilly Woods site.” December 17,<br />
2009. Retrieved 11/22/10<br />
http://www.nola.com/politics/index.ssf/2009/12/nora_passes_on_wal-mart_mixed-.html<br />
51 GNOCDC Pontchartrain Park Neighborhood Snapshot. Retrieved 11/22/10.<br />
http://www.gnocdc.org/orleans/6/31/snapshot.html<br />
52 The Times-Picayune, “City to break ground at Norman Mayer Library in Gentilly Tuesday.” December 29, 2009.<br />
Retrieved 11/22/10. http://www.nola.com/politics/index.ssf/2009/12/city_to_break_ground_at_norman.html<br />
<strong>New</strong> <strong>Orleans</strong> <strong>Market</strong> <strong>Assessment</strong> – An Analysis of Supply and Demand Dynamics 179
Establish in 1933 as a residential facility for troubled or needy boys, the Milne Boys Home no longer<br />
houses boys but the Louis Armstrong Manhood Development Program still offers after school activities<br />
for troubled boys. The 11 acre campus was once the home to the Colored Waif’s Home for Boys where<br />
Louis Armstrong learned to play the cornet. 53 The three structures that make up the Milne Boys Home<br />
were not in peak condition prior to the storm, but severe flooding and strong winds damaged the<br />
structures greatly. Currently in the design phase, renovations to the historic boy’s home will cost an<br />
estimated $12.6 million. Multiple buildings on the campus will be renovated during the process.<br />
Recent Housing Developments<br />
Planning District 6 ‐ Gentilly<br />
Project Name<br />
Project Address<br />
St. John Berchman Manor‐<br />
3400 Saint Anthony Ave<br />
Filmore Park II‐<br />
1945‐47 Windsor Dr<br />
Filmore Park I‐<br />
1945‐47 Windsor Dr<br />
Chateau Carre‐<br />
3000 Gentilly Blvd<br />
Description<br />
1. LIHTC and HOME<br />
2. Mid‐rise<br />
3. <strong>Market</strong> Rate‐ 0 Affordable‐ 149<br />
1. LIHTC<br />
2. Garden<br />
3. <strong>Market</strong> Rate‐ 0 Affordable‐ 56<br />
1. LIHTC<br />
2. Garden<br />
3. <strong>Market</strong> Rate‐ 0 Affordable‐ 108<br />
1. LIHTC<br />
2. Garden<br />
3. <strong>Market</strong> Rate‐ 88 Affordable‐ 62<br />
Assessor Data<br />
Planning District 6 ‐ Gentilly<br />
Total Residential Properties 9,630<br />
Properties with Homestead Exemption 5,291<br />
Residential Properties without Homestead 4,239<br />
Exemption<br />
Average Assessed Value, Residential Properties $12,994<br />
Commercial Properties 239<br />
GCR Activity Index©<br />
Planning District 6 ‐ Gentilly<br />
Total Residential Addresses 15,944<br />
Active Addresses 10,941<br />
Inactive Addresses 5,003<br />
53 NY Times. “Music Landmark Caught in Tug of Priorities After Storm.” March 19, 2006 Retrieved 11/22/10<br />
http://www.nytimes.com/2006/03/19/national/nationalspecial/19waifs.htmlpagewanted=print<br />
<strong>New</strong> <strong>Orleans</strong> <strong>Market</strong> <strong>Assessment</strong> – An Analysis of Supply and Demand Dynamics 180
Percentage Inactive 31.4%<br />
Change in Activity 2008 ‐ 2010 16%<br />
Commercial Addresses 479<br />
Active Addresses 293<br />
Inactive Addresses 186<br />
Percentage Inactive 38.83%<br />
Change in Activity 2008 ‐ 2010 0.4%<br />
Area Businesses<br />
Planning District 6 ‐ Gentilly<br />
Total Businesses 61<br />
Retail 41<br />
Restaurants 18<br />
Grocery and Food 2<br />
Total Business Earnings $100,371,000.00<br />
Total Employees<br />
Total Annual Wages<br />
Average Annual Wage<br />
474 (no employees reported for either grocery<br />
store at the time of the survey)<br />
<strong>New</strong> <strong>Orleans</strong> <strong>Market</strong> <strong>Assessment</strong> – An Analysis of Supply and Demand Dynamics 181
Summary of Planning District 7<br />
Planning District 7 developed in stages throughout the 19 th and 20 th centuries based on population<br />
growth, topography and technological advances (specifically pumps). The slow progression of<br />
development accumulated in a diversity of housing styles, ethnic enclaves and income groups. Early<br />
development began with the Marigny, Bywater and St. Roch neighborhoods, while other neighborhoods<br />
were not developed until the early 20 th century. The Industrial Canal and a number of railroads running<br />
along the eastern side of the district heavily impacted development of the area as low lying land was<br />
developed to house workers of the canal.<br />
The area retains the mixed‐use design originally incorporated in the organic expansion of the city with<br />
commercial, industrial and residential uses in close proximity of one another. Prevalent housing<br />
typologies of the area include Victorian and Craftsman shotgun doubles, Creole Cottages and small<br />
bungalows. There is a healthy mixture of affordable housing and rental to owner properties. Desire and<br />
Florida Housing Developments were under renovation when flooding from Hurricane Katrina destroyed<br />
all the units.<br />
Floodwaters in parts of the St. Roch, St. Claude and Florida neighborhoods reached over eight feet high,<br />
significantly damaging much of the community. 54 Approximately 77% of the housing units in the district<br />
were damaged and nearly half the units were severely damaged or destroyed. 55 Both owner and renter<br />
occupied units were devastated by the flood waters. The Marigny and Bywater neighborhoods received<br />
minimal damage from high winds and nominal flooding. Gentrification of neighborhoods on higher<br />
grounds close to the Mississippi River continues to alter the demographics and land values of these<br />
areas while the low lying land in the northern part of the continue to struggle with high poverty rates<br />
and disinvestment.<br />
54 UNOP, District 7, Chapter 1: Introduction to the District. Retrieved 11/10/10<br />
http://unifiedneworleansplan.com/home3/districts/7/plans/<br />
55 FEMA, Katrina, Rita and Wilma Damage Report 2/12/06<br />
<strong>New</strong> <strong>Orleans</strong> <strong>Market</strong> <strong>Assessment</strong> – An Analysis of Supply and Demand Dynamics 182
Household Characteristics<br />
Planning District 7 ‐ Bywater<br />
Estimated Renters 2010 5,369<br />
Projected Change in Renters 2010 – 2015 13%<br />
Estimated Owners 2010 4,907<br />
Projected Change in Owners 2010 – 2015 13%<br />
Estimated Households 2010 10,276<br />
Estimated Change in Households 2010 ‐ 2015 13%<br />
Median Household Income, 2010 $26,094<br />
Average Household Size, 2010 1.18<br />
Family Poverty Rate, 2010 24%<br />
Source: Nielson Claritas, Inc. 2010<br />
Housing Characteristics<br />
Planning District 7 ‐ Bywater<br />
Total Housing Units 11,721<br />
Single Family Detached 5,229<br />
Single Family Attached 1,847<br />
Duplexes 1,407<br />
Triplexes and Fourplexes 947<br />
Small Complex (5‐19 units) 636<br />
Medium Complex (20 – 49 units) 189<br />
Large Complex (50+ units) 247<br />
Median Age 1950<br />
Units Built After 2000 44<br />
Units Built Before 1940 5,122<br />
Total Subsidized Units 1,471<br />
Housing Cost Characteristics<br />
Planning District 7 ‐ Bywater<br />
Median Value, Single Family Home $130,286<br />
Change in Median Value, Single Family Home, 8%<br />
2005‐2009<br />
Characteristics of For Rent Units<br />
Planning District 7 ‐ Bywater<br />
Total Units Available for Rent 178<br />
Median Asking Rent, 1‐Bedroom $650<br />
Median Asking Rent, 2‐Bedroom $800<br />
<strong>New</strong> <strong>Orleans</strong> <strong>Market</strong> <strong>Assessment</strong> – An Analysis of Supply and Demand Dynamics 183
Total Units Available for Rent Accepting Section 8<br />
Vouchers<br />
6<br />
Recovery Projects<br />
Planning District 7 – Bywater<br />
Project Name<br />
Reinventing the Crescent<br />
St. Roch <strong>Market</strong><br />
St. Roch and St. Claude Roadway Improvements<br />
Desire/Florida Multi‐Service Center<br />
St. Roch Pool / Park<br />
Congress Street Roadway Improvements<br />
Stallings St. Claude Community Center<br />
St. Roch Avenue Roadway Improvements<br />
NOPD Fifth District Police Station<br />
Project Address<br />
Riverfront<br />
2381 St Claude Ave.<br />
St. Roch @ St. Claude Ave.<br />
2727 Louisa St.<br />
1800 St. Roch Ave.<br />
Congress Street<br />
4300 St Claude Ave.<br />
St. Roch Ave<br />
3900 N Claiborne<br />
Recovery Project Descriptions<br />
St. Roch <strong>Market</strong>‐<br />
Built in 1875, the St. Roch <strong>Market</strong> operated as an outdoor market with meat and produce stands until<br />
the 1930s when refrigerated cases and plumbing were incorporated into the market. The market was<br />
enclosed after World War II when the building was scheduled for demolition, but saved by public<br />
outcry. 56 After Hurricane Katrina, the market received funding from FEMA for a new roof and basic<br />
structural repairs. The St. Roch <strong>Market</strong> is scheduled to receive up to $3 million for the restorations.<br />
Although the project is still in the design phase and the end use of the structure is not determined, a<br />
recently released market survey prepared by several neighborhood associations and the St. Claude Main<br />
Street program indicate community stakeholders would prefer the historic market be restored to a<br />
source of fresh food and produce. 57<br />
St. Claude Avenue Commercial Corridor Improvements‐<br />
The Main Street program along St. Claude Avenue extends from Elysian Fields to Press Street and offers<br />
grants for commercial façade improvements and street improvements which include street lights,<br />
signage and landscaping. The area is also receiving $1.4 million in road resurfacing funds. These funds<br />
will assist in the rehabilitation of roadways and resurfacing the streets around St. Roch and St. Claude.<br />
The proposed Rampart‐St. Claude Streetcar will be funded through a combination of local funds and<br />
supplemental federal grants. Funding has not been secured for this project.<br />
56 <strong>Louisiana</strong> Landmarks Society. Retrieved 11/22/10 http://www.pitothouse.org/q=node/12<br />
57 St. Roch <strong>Market</strong> Survey. Retrieved 11/22/10 http://www.scribd.com/doc/43035835/St-Roch-<strong>Market</strong>-Survey-Results<br />
<strong>New</strong> <strong>Orleans</strong> <strong>Market</strong> <strong>Assessment</strong> – An Analysis of Supply and Demand Dynamics 184
Stallings St. Claude Community Center‐<br />
Located at 4300 St. Claude Avenue, the Stallings St. Claude Community Center was demolished in March<br />
2010 after FEMA declared the complex over 50% damaged. The existing pool and pool building will be<br />
renovated while the primary buildings will be replaced. The complete project is estimated to cost $4.4<br />
million and will include a new parking lot and recreational facility. 58 The new center will include<br />
basketball courts, multi‐purpose activity rooms and locker rooms. Before the storm the facility provided<br />
9 th ward residents basketball, volleyball, weightlifting, swimming, ceramics, ballet and bingo.<br />
<strong>New</strong> Desire Community‐<br />
The conventional public housing site, Desire was in the middle of the redevelopment process when<br />
Hurricane Katrina struck. Completed units and those under construction were lost during the storm.<br />
Today the community is being redeveloped as a mixed‐income development with a variety of housing<br />
types including 285 public housing units and 140 low‐income and project based units. Through a<br />
combination of funding including HUD HOME funds and GO Zone Low Income Tax Credits, over half the<br />
units are complete. Developed in four stages, Abundance Square (73 units), Treasure Village (34 units)<br />
and <strong>New</strong> Savoy Phase I (158 units) are complete. The fourth phase, comprised of 160 units, the <strong>New</strong><br />
Savoy Place Phase II is currently under construction. 59 A Multi‐Service Center is in the planning stages<br />
and will provide health services and community meeting rooms. The community center is estimated to<br />
cost up to $12.2 million.<br />
Recent Housing Developments<br />
Planning District 7 ‐ Bywater<br />
Project Name<br />
Project Address<br />
3501 St. Claude‐<br />
3501 St. Claude<br />
Bywater Arts Loft‐<br />
3725 Dauphine St<br />
Annunciation Inn‐<br />
1220 Spain St<br />
St. Roch Initiative‐<br />
1428 & 1430 Franklin<br />
<strong>New</strong> Savoy Place II‐<br />
3800 Desire Parkway<br />
Description<br />
1. LIHTC<br />
2. Mid‐rise<br />
3. <strong>Market</strong> Rate‐ 0 Affordable‐ 36<br />
1. LIHTC<br />
2. Low‐rise<br />
3. <strong>Market</strong> Rate‐ 0 Affordable‐ 37<br />
1. LIHTC and HOME<br />
2. Mid‐rise<br />
3. <strong>Market</strong> Rate‐ 0 Affordable‐ 106<br />
1. Housing Trust Fund<br />
2. Single & Double Family Houses<br />
3. <strong>Market</strong> Rate‐ 0 Affordable‐ 7<br />
1. LIHTC<br />
2. Garden<br />
3. <strong>Market</strong> Rate‐ 0 Affordable‐ 7<br />
58 The Times-Picayune. “Demolition begins on NORD’s Stallings Center.” July 30, 2010. Retrieved 11/22/10<br />
http://www.nola.com/politics/index.ssf/2010/03/demolition_begins_on_nords_sta.html<br />
59 HANO website. Retrieved 11/22/10 http://www.hano.org/index.phpq=node/34<br />
<strong>New</strong> <strong>Orleans</strong> <strong>Market</strong> <strong>Assessment</strong> – An Analysis of Supply and Demand Dynamics 185
Florida II‐B Central‐<br />
3801 Law Street<br />
1. LIHTC and HOME<br />
2. Garden<br />
3. <strong>Market</strong> Rate‐ 0 Affordable‐ 128<br />
Assessor Data<br />
Planning District 7 ‐ Bywater<br />
Total Residential Properties 6,894<br />
Properties with Homestead Exemption 2,745<br />
Residential Properties without Homestead 4,149<br />
Exemption<br />
Average Assessed Value, Residential Properties $11,672<br />
Commercial Properties 783<br />
GCR Activity Index©<br />
Planning District 7 ‐ Bywater<br />
Total Residential Addresses 14,230<br />
Active Addresses 9,565<br />
Inactive Addresses 4,665<br />
Percentage Inactive 32.78%<br />
Change in Activity 2008 ‐ 2010 11.58%<br />
Commercial Addresses 1,039<br />
Active Addresses 726<br />
Inactive Addresses 313<br />
Percentage Inactive 30.1%<br />
Change in Activity 2008 ‐ 2010 3.53%<br />
Area Businesses<br />
Planning District 7 ‐ Bywater<br />
Total Businesses 174<br />
Retail 127<br />
Restaurants 45<br />
Grocery and Food 2<br />
Total Business Earnings $539,943,000.00<br />
Total Employees 2042<br />
Total Annual Wages<br />
Average Annual Wage<br />
<strong>New</strong> <strong>Orleans</strong> <strong>Market</strong> <strong>Assessment</strong> – An Analysis of Supply and Demand Dynamics 186
Summary of Planning District 8<br />
Located east of the Industrial Canal, Planning District 8 consists of two distinct neighborhoods, Holy<br />
Cross and the Lower 9th Ward. The Holy Cross neighborhood was developed much earlier than the<br />
Lower 9th due to its vicinity to the Mississippi River which deposits settlements along the bank,<br />
eventually building up natural levee protection. One of the last neighborhoods developed in the city,<br />
the Lower 9th Ward was not developed until the early 20 th century because the land was too swampy.<br />
After the development of the Industrial Canal in 1923, residential and industrial development increased<br />
along the western edge of the district.<br />
The district is predominantly working class African American families. The district was developed as a<br />
predominantly owner occupied single family residential community. Several events affected the<br />
number of homeowners in the area including the destruction caused by the 1965 Hurricane Betsy, the<br />
financial restrictions caused by the oil crises in the 1980s and new shipping technologies limiting the<br />
number of jobs on the Industrial Canal. 60 The 2000 US Census reported the area was comprised of 56%<br />
homeowners and 44% renters. The damage caused by Hurricane Katrina directly impacted both groups<br />
equally.<br />
FEMA estimated 93% of the housing units in the district were damaged by the storm of which 82% were<br />
severely damaged or destroyed. 61 The devastation in the Lower 9th Ward caused by the levee breach<br />
along the Industrial Canal has been publicized as the biggest man‐made disaster in US history. With<br />
limited funds to rebuild, many residents have not returned to the area. Several housing campaigns are<br />
underway in the neighborhoods providing technical, financial and emotional support to returning<br />
residents. The area still suffers from limited infrastructure and services including privately and publicly<br />
funded programs such as supermarkets, health care providers, police and fire substations.<br />
Redevelopment remains scattered throughout the district with areas closer to the river recovering a bit<br />
faster.<br />
60 Greater <strong>New</strong> <strong>Orleans</strong> Community Data Center, Lower 9 th Ward District Neighborhood Snapshot. Retrieved<br />
11/10/10. http://www.gnocdc.org/orleans/8/index.html<br />
61 FEMA, Katrina, Rita and Wilma Damage Report 2/12/06<br />
<strong>New</strong> <strong>Orleans</strong> <strong>Market</strong> <strong>Assessment</strong> – An Analysis of Supply and Demand Dynamics 187
Household Characteristics<br />
Planning District 8 – Lower 9 th Ward<br />
Estimated Renters 2010 620<br />
Projected Change in Renters 2010 – 2015 2%<br />
Estimated Owners 2010 846<br />
Projected Change in Owners 2010 – 2015 4%<br />
Estimated Households 2010 1466<br />
Estimated Change in Households 2010 ‐ 2015 3%<br />
Median Household Income, 2010 $27,500<br />
Average Household Size, 2010 0.17<br />
Family Poverty Rate, 2010 20%<br />
Source: Nielson Claritas, Inc. 2010<br />
Housing Characteristics<br />
Planning District 8 – Lower 9 th Ward<br />
Total Housing Units 1,642<br />
Single Family Detached 897<br />
Single Family Attached 284<br />
Duplexes 204<br />
Triplexes and Fourplexes 68<br />
Small Complex (5‐19 units) 42<br />
Medium Complex (20 – 49 units) 7<br />
Large Complex (50+ units) 46<br />
Median Age 1956<br />
Units Built After 2000 2<br />
Units Built Before 1940 303<br />
Total Subsidized Units 861<br />
Housing Cost Characteristics<br />
Planning District 8 – Lower 9 th Ward<br />
Average Value, Single Family Home $46,810<br />
Change in Average Value, Single Family Home, ‐10%<br />
2004‐2009<br />
Characteristics of For Rent Units<br />
Planning District 8 – Lower 9 th Ward<br />
Total Units Available for Rent 39<br />
Median Asking Rent, 1‐Bedroom $502<br />
Median Asking Rent, 2‐Bedroom $800<br />
<strong>New</strong> <strong>Orleans</strong> <strong>Market</strong> <strong>Assessment</strong> – An Analysis of Supply and Demand Dynamics 188
Total Units Available for Rent Accepting Section 8<br />
Vouchers<br />
0<br />
Recovery Projects<br />
Planning District 8 – Lower 9 th Ward<br />
Project Name<br />
Holy Cross Roadway Improvements<br />
Lower Ninth Ward Streetscape<br />
Oliver Bush Playground<br />
Sanchez (Copelin‐Byrd) Center‐ Pool, Gym,<br />
Community Center, and Health Clinice<br />
Sam Bonart Playground & Pool<br />
NOFD Engine Nos. 22 and 39<br />
Lower Ninth Ward Road Repairs<br />
Project Address<br />
Douglass St. @ Andry St. to N. Peters St<br />
N. Claiborne @ Andry to Lamanche<br />
2500 Caffin St.<br />
1616 Caffin Ave.<br />
1200 Forstall St.<br />
N Claiborne Ave & Caffin Ave<br />
Lower Ninth Ward<br />
Recovery Project Descriptions<br />
Sanchez Center‐<br />
Located in the Lower Ninth Ward, the Andrew P. Sanchez Sr. Multi‐Service Center was severely damaged<br />
by Hurricane Katrina. In 2009 FEMA announced the structure was more than 50% damaged and called<br />
for the demolition and replacement of the structure which also housed the Etta Morris Senior Center,<br />
the Copelin/Thompson‐Byrd Center and the offices of several community organizations. FEMA<br />
estimated the demolition will cost $300,000 and replacement of the structure will cost another $9.3<br />
million. The city has designated funds for the redevelopment of the community center including $1<br />
million for land acquisition, $12.4 million to replace the gym, health clinic and police substation, and<br />
$2.3 million for a new pool and locker‐room.<br />
Make It Right‐<br />
In response to the devastation caused in the Lower 9th Ward when the levees breached, actor Brad Pitt<br />
started a non‐profit to rebuild using sustainable green technologies. Starting in 2006, Pitt’s Make It<br />
Right foundation commissioned 13 architecture firms to develop sustainable and affordable houses.<br />
Five years after the storm nearly 50 houses have been built in the Lower 9th Ward. 62 Houses built by<br />
the program are energy efficient, elevated single family structures. On average the single family units<br />
cost $150,000 and doubles cost $200,000. Residents use a combination of Road Home funds, grants and<br />
mortgage financing to contribute on average $75,000 for the purchase of the homes. Make It Right also<br />
62 The Times-Picayune. “Brad Pitt talks about Hurricane Katrina, his Make It Right work and his love for <strong>New</strong> <strong>Orleans</strong>.”<br />
August 26, 2010. Retrieved 11/22/10<br />
http://www.nola.com/katrina/index.ssf/2010/08/brad_pitt_talks_about_hurrican.html<br />
<strong>New</strong> <strong>Orleans</strong> <strong>Market</strong> <strong>Assessment</strong> – An Analysis of Supply and Demand Dynamics 189
offers gap financing to assist homeowners purchase homes in the form of soft seconds and affordable<br />
mortgages.<br />
MLK Charter School‐<br />
After Hurricane Katrina and the breached levee system devastated the Lower 9th Ward, the community<br />
fought hard to bring back what they identified as a cornerstone of recovery, the Martin Luther King<br />
Junior School. The school reopened for the 2007‐2008 school year as a science and technology charter<br />
school serving grades K through 12. In June 2007 more than 600 students had enrolled for the<br />
approaching school year and by August 2010 the school had a waiting list of more than 400 students.<br />
The charter school which cost approximately $12 million to renovate was rebuilt with FEMA recovery<br />
dollars. The agency has disbursed $46.8 million to the Recovery School District to restore five schools in<br />
the Lower 9th Ward. To date the MLK Charter School remains the only public school open in the district.<br />
Oliver Bush Playground‐<br />
Residents of the Lower 9th Ward are looking for investment in their neighborhood. Public amenities are<br />
necessary to attract new and returning residents to the area. The Oliver Bush recreation center is<br />
located near the intersection of Caffin and Florida Avenues. Restoration of the center was originally set<br />
at the price range of $2.7 million to $3.3 million to completely replace the basketball, baseball and<br />
tennis areas. More recently the mayor’s office projected to total restoration costs to be closer to<br />
$736,000 for the project which remains in the design phase. 63<br />
Recent Housing Developments<br />
Planning District 8 – Lower 9 th Ward<br />
Project Name<br />
Project Address<br />
Global Green/Douglas Andry‐<br />
5413 N. Peters<br />
Classic Construction of NO Venture II‐<br />
2201 Charbonnet St<br />
Rising Sun‐<br />
1422 Charbonnet St<br />
Douglas & Andry‐<br />
5413 N. Peters Street<br />
Description<br />
1. Housing Trust Fund<br />
2. Single & Double Family Houses<br />
3. <strong>Market</strong> Rate‐ 6 Affordable‐ 12<br />
1. LIHTC<br />
2. Duplexes<br />
3. <strong>Market</strong> Rate‐ 0 Affordable‐ 56<br />
1. LIHTC<br />
2. Low‐rise<br />
3. <strong>Market</strong> Rate‐ 0 Affordable‐ 33<br />
1. LIHTC and HOME<br />
2.<br />
3. <strong>Market</strong> Rate‐ 6 Affordable‐ 12<br />
Assessor Data<br />
63 Project NOLA.com “9 th Ward may not get money for two city swimming pools.” November 11, 2010. Retrieved<br />
11/23/10. http://www.projectnola.com/component/content/article/86-the-lens/115110-9th-ward-may-not-getmoney-for-two-city-swimming-pools<br />
<strong>New</strong> <strong>Orleans</strong> <strong>Market</strong> <strong>Assessment</strong> – An Analysis of Supply and Demand Dynamics 190
Planning District 8 – Lower 9 th Ward<br />
Total Residential Properties 1,641<br />
Properties with Homestead Exemption 550<br />
Residential Properties without Homestead 1,091<br />
Exemption<br />
Average Assessed Value, Residential Properties $4,319<br />
Commercial Properties 80<br />
GCR Activity Index©<br />
Planning District 8 – Lower 9 th Ward<br />
Total Residential Addresses 6,029<br />
Active Addresses 1,948<br />
Inactive Addresses 4,081<br />
Percentage Inactive 67.7%<br />
Change in Activity 2008 ‐ 2010 41.44%<br />
Commercial Addresses 232<br />
Active Addresses 87<br />
Inactive Addresses 145<br />
Percentage Inactive 62.5%<br />
Change in Activity 2008 ‐ 2010 ‐9.17%<br />
Area Businesses<br />
Planning District 8 – Lower 9 th Ward<br />
Total Businesses 6<br />
Retail 4<br />
Restaurants 2<br />
Grocery and Food 0<br />
Total Business Earnings $4,847,000.00<br />
Total Employees 4<br />
Total Annual Wages<br />
Average Annual Wage<br />
<strong>New</strong> <strong>Orleans</strong> <strong>Market</strong> <strong>Assessment</strong> – An Analysis of Supply and Demand Dynamics 191
Summary of Planning District 9<br />
Located on the east side of the Industrial Canal, Planning District 9, 10, and 11 are collectively known as<br />
<strong>New</strong> <strong>Orleans</strong> East. District 9 is closest to the canal and contains the earliest developments of <strong>New</strong><br />
<strong>Orleans</strong> East. Early residential development began in the 1920s and 30s along the perimeter of the lake.<br />
Primarily “fishing camps,” development increased when the first African American amusement park,<br />
Lincoln Beach, opened in 1939. Growth in the area significantly increased after World War II, when<br />
substantial numbers of double and single‐family houses were constructed for residents using the GI Bill.<br />
The district is primarily suburban in nature with mostly residential structures and very limited<br />
commercial use which is designated along key corridors including Chef Menteur Highway, Morrison<br />
Road and Crowder Boulevard. The predominant housing style is slab‐on‐grade ranch style structures<br />
surrounded by large yards with independent driveways. District 9 is primarily comprised of working<br />
class homeowners and renters. Many of the landlords in the area were approved for Section 8 rentals in<br />
the 1990s which increased the number of low‐income renters in the district. The 2000 Census reported<br />
that approximately 45% of the units were renter occupied.<br />
Measuring the effects of the storm is difficult because the district experienced a fair amount of growth<br />
in rental units between the 2000 Census and the 2005 hurricane season. The 2006 Property Damage<br />
Estimates released by FEMA reported 99% of the district was damaged by the storm, of which 75% were<br />
severely damage or destroyed. Both owner and renter occupied units were affected by the storm with<br />
11,990 owner occupied units were severely damaged or destroyed by flood water as compared to 7,676<br />
rental units. 64 The eastern portion of the district repopulated more quickly than the western side.<br />
Neighborhoods along the lakes edge and those houses built on higher ground or at a higher elevation<br />
received earlier reinvestment. 65<br />
64 FEMA, Katrina, Rita and Wilma Damage Report 2/12/06<br />
65 District 9, 10, & 11 Unified <strong>New</strong> <strong>Orleans</strong> Plan for Recovery and Rebuilding, Chapter 3: Recovery <strong>Assessment</strong><br />
Overview. Retrieved 11/11/10. http://unifiedneworleansplan.com/home3/districts/9/plans/<br />
<strong>New</strong> <strong>Orleans</strong> <strong>Market</strong> <strong>Assessment</strong> – An Analysis of Supply and Demand Dynamics 192
Household Characteristics<br />
Planning District 9 – <strong>New</strong> <strong>Orleans</strong> East<br />
Estimated Renters 2010 5,203<br />
Projected Change in Renters 2010 – 2015 3%<br />
Estimated Owners 2010 10,076<br />
Projected Change in Owners 2010 – 2015 4%<br />
Estimated Households 2010 15,279<br />
Estimated Change in Households 2010 ‐ 2015 4%<br />
Median Household Income, 2010 $48,980<br />
Average Household Size, 2010 1.76<br />
Family Poverty Rate, 2010 9%<br />
Source: Nielson Claritas, Inc. 2010<br />
Housing Characteristics<br />
Planning District 9 – <strong>New</strong> <strong>Orleans</strong> East<br />
Total Housing Units 15,826<br />
Single Family Detached 9,865<br />
Single Family Attached 1,460<br />
Duplexes 606<br />
Triplexes and Fourplexes 488<br />
Small Complex (5‐19 units) 1,459<br />
Medium Complex (20 – 49 units) 507<br />
Large Complex (50+ units) 1,121<br />
Median Age 1974<br />
Units Built After 2000 39<br />
Units Built Before 1940 247<br />
Total Subsidized Units 1,958<br />
Housing Cost Characteristics<br />
Planning District 9 – <strong>New</strong> <strong>Orleans</strong> East<br />
Average Value, Single Family Home $113,348<br />
Change in Average Value, Single Family Home, ‐7%<br />
2004‐2009<br />
Characteristics of For Rent Units<br />
Planning District 9 – <strong>New</strong> <strong>Orleans</strong> East<br />
Total Units Available for Rent 185<br />
Median Asking Rent, 1‐Bedroom $700<br />
Median Asking Rent, 2‐Bedroom $900<br />
<strong>New</strong> <strong>Orleans</strong> <strong>Market</strong> <strong>Assessment</strong> – An Analysis of Supply and Demand Dynamics 193
Total Units Available for Rent Accepting Section 8<br />
Vouchers<br />
6<br />
Recovery Projects<br />
Planning District 9 – <strong>New</strong> <strong>Orleans</strong> East<br />
Project Name<br />
Project Address<br />
Edgelake Court<br />
Edgelake Court @ Crowder Rd to Hayne Blvd<br />
Kingswood Playground<br />
7200 Edgefield Dr.<br />
<strong>New</strong> <strong>Orleans</strong> East Streetscape Improvements Read Blvd @ Dwyer to Lakeforest Blvd<br />
Joe Brown Center and Park Enhancements 5601 Read Blvd.<br />
<strong>New</strong> <strong>Orleans</strong> East Regional Library Design‐Build 5641 Read Blvd<br />
NOFD Engine 10<br />
14069 Morrison Road<br />
Digby Park<br />
6600 Virgilian St.<br />
NOPD Seventh District Police Station<br />
10101 Dwyer Road<br />
<strong>New</strong> <strong>Orleans</strong> East Hospital Development 5620 Reed Blvd<br />
Di Benedetto Playground<br />
4700 Papania St.<br />
Crowder Boulevard Bikeways Crowder Boulevard @ Dwyer Rd to US 90<br />
Recovery Project Descriptions<br />
Lake Forest Plaza Mall‐<br />
Although developer’s released a plan for the 81‐acre Lake Forest Plaza Mall site in 2009, development<br />
has not begun and most of the plaza remains vacant. Redevelopment of the site is expected to cost<br />
approximately $220 million. Developers and residents are pushing for a mix of commercial types<br />
including big box stores to anchor the shopping district and smaller stores including a renovated theater<br />
as infill. The possible development might also include green space and hotels. Until the tax increment<br />
finance (TIF) district is approved by the state economic development office, development will not move<br />
forward. Development of the first anchor store estimated at a total cost of $58 million, cannot move<br />
forward without the $42 million in TIF backed bonds. Negotiations regarding the TIF district have been<br />
underway since mid‐2009. 66<br />
<strong>New</strong> <strong>Orleans</strong> East Hospital Land Acquisition & Development‐<br />
After several failed negotiations with the previous owners of the Pendleton Memorial Methodist<br />
Hospital, the city recently purchased the hospital for $16.25 million. Located in <strong>New</strong> <strong>Orleans</strong> East on<br />
Read Boulevard, the hospital has remained vacant since it was severely damaged by Hurricane Katrina.<br />
Residents in <strong>New</strong> <strong>Orleans</strong> East have struggled with limited emergency care facilities since the storm.<br />
The recently announced plan to renovate the Methodist Hospital site will cost an estimated $110<br />
66 The Times-Picayune, “Lake Forest Plaza redevelopment plan detailed,” August 11, 2009. Retrieved 11/23/10<br />
http://www.nola.com/business/index.ssf/2009/08/lake_forest_plaza_redevelopmen.html#<br />
<strong>New</strong> <strong>Orleans</strong> <strong>Market</strong> <strong>Assessment</strong> – An Analysis of Supply and Demand Dynamics 194
million. A full‐service hospital is expected to open on the site by fall of 2013 and emergency‐room<br />
services will be available as early as mid‐2011.<br />
Joe Brown Multiuse Center and Park‐<br />
Located in <strong>New</strong> <strong>Orleans</strong> East on Read Boulevard, the Joe Brown Center and Park provided recreation<br />
facilities including a pool, baseball fields and tennis courts prior to Hurricane Katrina. The facilities were<br />
also used for summer sports camps and cheerleading competitions. Nearly a dozen contracts for park<br />
improvements ranging in price from $35,000 to $4 million are underway. The 135 acres park will receive<br />
a total of $12 million in recovery dollars. Some contracts are in the bid and award phase, however most<br />
of the enhancements are still in the design phase. Projects will include upgrading the baseball fields,<br />
park shelters, lighting and indoor pool.<br />
Nazareth, Walnut Square and Georgetown Apartments‐<br />
Through a combination of HUD Home funds, Community Development Block Grant Recovery funds and<br />
GO Zone tax credits, Nazareth, Walnut Square and Georgetown Apartments supply 601 affordable<br />
housing units in <strong>New</strong> <strong>Orleans</strong> East. The combined total investment of these three properties is<br />
estimated at more than $105 million. These developments include increased amenities such as<br />
playgrounds, on‐site laundry facilities, community centers, greenspace and mixed use development.<br />
Recent Housing Developments<br />
Planning District 9 – <strong>New</strong> <strong>Orleans</strong> East<br />
Project Name<br />
Project Address<br />
Old Morrison Homes‐<br />
6729 W. Laverne Street<br />
Delille Inn‐<br />
6924 Chef Menteur Hwy<br />
Nazarath Inn I‐<br />
9630 Haynes Blvd<br />
<strong>New</strong> Savoy Place Phase I‐<br />
3800 Desire Parkway<br />
Georgetown of <strong>New</strong> <strong>Orleans</strong> II‐<br />
7209 E. Suffolk Dr<br />
Georgetown of NO III‐<br />
6200 Morrison<br />
Walnut Square Apt‐<br />
8501 1‐10 Service Rd<br />
Description<br />
1. LIHTC<br />
2. Single & Double Family Houses<br />
3. <strong>Market</strong> Rate‐ 0 Affordable‐ 38<br />
1. LIHTC and HOME<br />
2. Mid‐rise<br />
3. <strong>Market</strong> Rate‐ 0 Affordable‐ 51<br />
1. LIHTC and HOME<br />
2. Mid‐rise<br />
3. <strong>Market</strong> Rate‐ 1 Affordable‐ 149<br />
1. LIHTC and HOME<br />
2. Garden<br />
3. <strong>Market</strong> Rate‐ 0 Affordable‐ 156<br />
1. LIHTC<br />
2. Garden<br />
3. <strong>Market</strong> Rate‐ 0 Affordable‐ 119<br />
1. LIHTC<br />
2. Garden<br />
3. <strong>Market</strong> Rate‐ 0 Affordable‐ 80<br />
1. LIHTC<br />
2. Garden<br />
<strong>New</strong> <strong>Orleans</strong> <strong>Market</strong> <strong>Assessment</strong> – An Analysis of Supply and Demand Dynamics 195
Nazareth Inn II Apts‐<br />
9640 Hayne Blvd<br />
Georgetown Manor‐<br />
6211 Bridgehampton<br />
3. <strong>Market</strong> Rate‐ 125 Affordable‐ 84<br />
1. LIHTC and HOME<br />
2. Mid‐rise<br />
3. <strong>Market</strong> Rate‐ 0 Affordable‐ 119<br />
1. LIHTC and HOME<br />
2. Garden<br />
3. <strong>Market</strong> Rate‐ 73 Affordable‐ 49<br />
Assessor Data<br />
Planning District 9 – <strong>New</strong> <strong>Orleans</strong> East<br />
Total Residential Properties 14,639<br />
Properties with Homestead Exemption 7,610<br />
Residential Properties without Homestead 7,029<br />
Exemption<br />
Average Assessed Value, Residential Properties $13,986<br />
Commercial Properties 747<br />
GCR Activity Index©<br />
Planning District 9 – <strong>New</strong> <strong>Orleans</strong> East<br />
Total Residential Addresses 21,155<br />
Active Addresses 15,789<br />
Inactive Addresses 5,366<br />
Percentage Inactive 25.4%<br />
Change in Activity 2008 ‐ 2010 18.26%<br />
Commercial Addresses 994<br />
Active Addresses 644<br />
Inactive Addresses 350<br />
Percentage Inactive 35.2%<br />
Change in Activity 2008 ‐ 2010 7.72%<br />
Area Businesses<br />
Planning District 9 – <strong>New</strong> <strong>Orleans</strong> East<br />
Total Businesses 164<br />
Retail 135<br />
Restaurants 27<br />
Grocery and Food 2<br />
Total Business Earnings $875,845,000.00<br />
Total Employees 2143<br />
Total Annual Wages<br />
Average Annual Wage<br />
<strong>New</strong> <strong>Orleans</strong> <strong>Market</strong> <strong>Assessment</strong> – An Analysis of Supply and Demand Dynamics 196
<strong>New</strong> <strong>Orleans</strong> <strong>Market</strong> <strong>Assessment</strong> – An Analysis of Supply and Demand Dynamics 197
Summary of Planning District 10<br />
As part of <strong>New</strong> <strong>Orleans</strong> East, district 10 faces similar issues with subsidence as districts 9 and 11. A large<br />
portion of the district is comprised of brackish marshes and wetlands which are preserved by the Bayou<br />
Sauvage National Refuge. The limited land that was developed in the 1960s was built on drained<br />
marshland. The district is comprised of mostly residential single family structures and rural landscape<br />
with very limited commercial uses.<br />
The community is primarily African American, with a large active Vietnamese community which moved<br />
into the area in the 1970s and 80s. 67 This community was one of the first to begin a recovery planning<br />
process after Hurricane Katrina. The Mary Queen of Viet Nam Community Development Corporation<br />
launched a neighborhood planning process which included surveying the neighborhood, facilitating<br />
community wide meetings and focus groups to better identify the vision of the community.<br />
Both district 9 and 10 grew between 2000 and 2005, which somewhat skews damage reports for the<br />
area. The district was severely damage by Hurricane Katrina, with reportedly 106% of the mostly slabon‐grade<br />
ranch style housing units incurring damage. Due to the increase in the number of single family<br />
housing units between 2000 and 2005, the FEMA damage assessment reports 117% of owner occupied<br />
units were damaged. When looking at actual numbers, FEMA reported 1,781 owner occupied units and<br />
1,713 rental units damaged by the storm of which 73% were severely damaged or destroyed. 68 Flooding<br />
caused the majority of the damage with flood depths ranging from 2 to 12 feet deep. That said, by 2007<br />
nearly 65% of the housing units were occupied and 842 building permits had been issued for hurricane<br />
repairs. 69<br />
67 Greater <strong>New</strong> <strong>Orleans</strong> Community Data Center, Village d L’East District Neighborhood Snapshot. Retrieved<br />
11/10/10. http://www.gnocdc.org/orleans/8/index.html<br />
68 FEMA, Katrina, Rita and Wilma Damage Report 2/12/06<br />
69 District 9, 10, & 11 Unified <strong>New</strong> <strong>Orleans</strong> Plan for Recovery and Rebuilding, Chapter 3: Recovery <strong>Assessment</strong><br />
Overview. Retrieved 11/11/10. http://unifiedneworleansplan.com/home3/districts/9/plans/<br />
<strong>New</strong> <strong>Orleans</strong> <strong>Market</strong> <strong>Assessment</strong> – An Analysis of Supply and Demand Dynamics 198
Household Characteristics<br />
Planning District 10 – Village de Lest Area<br />
Estimated Renters 2010 1,157<br />
Projected Change in Renters 2010 – 2015 3%<br />
Estimated Owners 2010 1,752<br />
Projected Change in Owners 2010 – 2015 8%<br />
Estimated Households 2010 2,909<br />
Estimated Change in Households 2010 ‐ 2015 6%<br />
Median Household Income, 2010 $43,906<br />
Average Household Size, 2010 0.33<br />
Family Poverty Rate, 2010 20%<br />
Housing Characteristics<br />
Planning District 10 – Village de Lest Area<br />
Total Housing Units 3,021<br />
Single Family Detached 1,681<br />
Single Family Attached 218<br />
Duplexes 133<br />
Triplexes and Fourplexes 194<br />
Small Complex (5‐19 units) 240<br />
Medium Complex (20 – 49 units) 27<br />
Large Complex (50+ units) 104<br />
Median Age 1979<br />
Units Built After 2000 444<br />
Units Built Before 1940 81<br />
Total Subsidized Units 651<br />
Housing Cost Characteristics<br />
Planning District 10 – Village de Lest Area<br />
Average Value, Single Family Home $58,129<br />
Change in Average Value, Single Family Home, ‐44%<br />
2004‐2009<br />
Characteristics of For Rent Units<br />
Planning District 10 – Village de Lest Area<br />
Total Units Available for Rent 15<br />
Median Asking Rent, 1‐Bedroom $400<br />
Median Asking Rent, 2‐Bedroom $725<br />
Total Units Available for Rent Accepting Section 8 3<br />
Vouchers<br />
<strong>New</strong> <strong>Orleans</strong> <strong>Market</strong> <strong>Assessment</strong> – An Analysis of Supply and Demand Dynamics 199
Recovery Projects<br />
Planning District 10 – Village de Lest Area<br />
Project Name<br />
Alcee Fortier Blvd Streetscape<br />
<strong>New</strong> <strong>Orleans</strong> East Community Health Clinic<br />
Project Address<br />
Alcee Fortier Blvd @ Chef Menteur<br />
13085 Chef Menteur Hwy<br />
Recovery Project Descriptions<br />
Viet Village Urban Farm Project‐<br />
Mary Queen of Viet Nam Community Development Corporation acquired 20 acres in November 2007 to<br />
support the growing economic driver in <strong>New</strong> <strong>Orleans</strong> East, the Vietnamese Farmers <strong>Market</strong>. The land<br />
will house the Viet Village Urban Farm which will incorporate gardening and animal husbandry. The<br />
farm will be built in several phases. Phase 1 will involve site clearing, composting, and construction of<br />
irrigation canals, water retention ponds and community plots. Phase 2 will involve expansion of<br />
community and commercial plots and the final phase will incorporate livestock areas. The $1.5 million<br />
in estimated costs will come from private foundations and in‐kind donations. Construction of phase 1 is<br />
scheduled to begin in 2011. 70<br />
Blade Dynamics Ltd.‐<br />
British wind turbine company Blade Dynamics Ltd. will begin manufacturing turbine blades and<br />
components in the Michoud Assembly Facility in <strong>New</strong> <strong>Orleans</strong> East. The facility is currently used to<br />
house several NASA projects and offices for the U.S. Coast Guard, U.S. Department of Agriculture,<br />
Lockheed Martin (which is closing its facility soon) and Boeing. The new wind turbine blade<br />
manufacturing facility will provide 600 new jobs by 2015 with an average salary of $48,000 annually.<br />
The total capital investment of this project is estimated at $13 million. 71<br />
Recent Housing Developments<br />
Planning District 10 – Village de Lest Area<br />
Project Name<br />
Project Address<br />
Gulfway Terrace Apts‐<br />
14765 Chef Menteur Hwy<br />
Peltier Gardens‐<br />
Description<br />
1. LIHTC<br />
2. Low‐rise<br />
3. <strong>Market</strong> Rate‐ 0 Affordable‐ 206<br />
1. LIHTC and HOME<br />
70 Mary Queen of Viet Nam Community Development Corporation, Inc. Retrieved 11/23/10<br />
http://www.mqvncdc.org/page.phpid=18<br />
71 The Times-Picayune. “Wind turbine company to plant 600 jobs in Michoud.” August 18, 2010. Retrieved 11/23/10.<br />
http://www.nola.com/business/index.ssf/2010/08/wind_firm_to_plant_600_jobs_in.html<br />
<strong>New</strong> <strong>Orleans</strong> <strong>Market</strong> <strong>Assessment</strong> – An Analysis of Supply and Demand Dynamics 200
14639 Saigon 2. Low‐rise<br />
3. <strong>Market</strong> Rate‐ 0 Affordable‐ 396<br />
Assessor Data<br />
Planning District 10 – Village de Lest Area<br />
Total Residential Properties 1,810<br />
Properties with Homestead Exemption 1,038<br />
Residential Properties without Homestead 772<br />
Exemption<br />
Average Assessed Value, Residential Properties $22,520<br />
Commercial Properties 109<br />
GCR Activity Index©<br />
Planning District 10 – Village de Lest Area<br />
Total Residential Addresses 3,086<br />
Active Addresses 2,183<br />
Inactive Addresses 903<br />
Percentage Inactive 29.26%<br />
Change in Activity 2008 ‐ 2010 9.22%<br />
Commercial Addresses 178<br />
Active Addresses 132<br />
Inactive Addresses 46<br />
Percentage Inactive 25.84%<br />
Change in Activity 2008 ‐ 2010 ‐1.05%<br />
Area Businesses<br />
Planning District 10 – Village de Lest Area<br />
Total Businesses 46<br />
Retail 37<br />
Restaurants 9<br />
Grocery and Food 0<br />
Total Business Earnings $76,652,000.00<br />
Total Employees 283<br />
<strong>New</strong> <strong>Orleans</strong> <strong>Market</strong> <strong>Assessment</strong> – An Analysis of Supply and Demand Dynamics 201
Summary of Planning District 11<br />
District 11 is comprised of three neighborhood areas, Lake Catherine, Venetian Isles and Irish Bayou.<br />
Venetian Isles and Lake Catherine represent the largest track of uninhabited land within the boundaries<br />
of the city. As compared to the rest of <strong>New</strong> <strong>Orleans</strong> East, District 11 has a more rural atmosphere with<br />
very few organized subdivisions secluded by the Bayou Sauvage National Wildlife Refuge and a<br />
significant number of manufacturing facilities. Lake Catherine contains three significant historical<br />
landmarks: Bayou Sauvage National Wildlife Refuge, the Fort Pike State Historic Site and Fort Macomb.<br />
The largest residential development in the area is the Venetian Isles subdivision which opened in the<br />
late 1960s. 72 Venetian Isles subdivision is predominantly slab‐on‐grade, ranch style single family houses.<br />
Other housing units outside the subdivision are elevated fishing camps. The rest of Venetian Isles<br />
neighborhood is comprised of manufacturing and industrial structures including NASA’s Michoud<br />
Assembly Facility and Folger’s Coffee Company. Almost all of the structures in district 11 are outside the<br />
levee protection systems which resulted in significant damage to residential, commercial and industrial<br />
structures in 2005.<br />
Although the area is not highly residential, the owner occupied structures in the district were severely<br />
damaged with 88% of the 592 units reporting damage. 73 Of these units, 80% were severely damaged or<br />
destroyed by the storm. The damage to the small number of residential units was so great that many<br />
houses reportedly were washed away by the storm surge. Repopulation of the area has been slow<br />
though the industrial and manufacturing uses have returned. By 2007 the NASA facility, Textron and the<br />
Folgers Coffee Company were back in operation. 74 The storm surge devastated Bayou Sauvage National<br />
Wildlife Refuge, severely damaging the natural resources in the area. Fort Pike was also severely<br />
damaged by the storm surge.<br />
72 Greater <strong>New</strong> <strong>Orleans</strong> Community Data Center, <strong>New</strong> <strong>Orleans</strong> East Area District 11 Neighborhood Snapshot.<br />
Retrieved 11/10/10. http://www.gnocdc.org/orleans/8/index.html<br />
73 FEMA, Katrina, Rita and Wilma Damage Report 2/12/06<br />
74 District 9, 10, & 11 Unified <strong>New</strong> <strong>Orleans</strong> Plan for Recovery and Rebuilding, Chapter 3: Recovery <strong>Assessment</strong><br />
Overview. Retrieved 11/11/10. http://unifiedneworleansplan.com/home3/districts/9/plans/<br />
<strong>New</strong> <strong>Orleans</strong> <strong>Market</strong> <strong>Assessment</strong> – An Analysis of Supply and Demand Dynamics 202
Household Characteristics<br />
Planning District 11 – Venetian Isles<br />
Estimated Renters 2010 30<br />
Projected Change in Renters 2010 – 2015 0%<br />
Estimated Owners 2010 386<br />
Projected Change in Owners 2010 – 2015 3%<br />
Estimated Households 2010 416<br />
Estimated Change in Households 2010 ‐ 2015 3%<br />
Median Household Income, 2010 $58,224<br />
Median Household Size, 2010 .05<br />
Family Poverty Rate, 2010 3%<br />
Housing Characteristics<br />
Planning District 11 – Venetian Isles<br />
Total Housing Units 588<br />
Single Family Detached 318<br />
Single Family Attached 4<br />
Duplexes 1<br />
Triplexes and Fourplexes 3<br />
Small Complex (5‐19 units) 5<br />
Medium Complex (20 – 49 units) 0<br />
Large Complex (50+ units) 0<br />
Median Age 1972<br />
Units Built After 2000 9<br />
Units Built Before 1940 21<br />
Total Subsidized Units 1<br />
Housing Cost Characteristics<br />
Planning District 11 – Venetian Isles<br />
Average Value, Single Family Home $235,865<br />
Change in Average Value, Single Family Home, 40%<br />
2004‐2009<br />
FEMA Recovery Projects<br />
Planning District 11 – Venetian Isles<br />
Project Name<br />
NOFD Engine 31 Alba Rd.<br />
Project Address<br />
4300 Alba Road<br />
Assessor Data<br />
<strong>New</strong> <strong>Orleans</strong> <strong>Market</strong> <strong>Assessment</strong> – An Analysis of Supply and Demand Dynamics 203
Planning District 11 – Venetian Isles<br />
Total Residential Properties 298<br />
Properties with Homestead Exemption 203<br />
Residential Properties without Homestead 95<br />
Exemption<br />
Average Assessed Value, Residential Properties $18,399<br />
Commercial Properties 15<br />
GCR Activity Index©<br />
Planning District 11 – Venetian Isles<br />
Total Residential Addresses 504<br />
Active Addresses 371<br />
Inactive Addresses 133<br />
Percentage Inactive 26.4%<br />
Change in Activity 2008 ‐ 2010 13.51%<br />
Commercial Addresses 34<br />
Active Addresses 18<br />
Inactive Addresses 16<br />
Percentage Inactive 47%<br />
Change in Activity 2008 ‐ 2010 ‐3.23%<br />
Area Businesses<br />
Planning District 11 – Venetian Isles<br />
Total Businesses 6<br />
Retail 5<br />
Restaurants 1<br />
Grocery and Food 0<br />
Total Business Earnings $6,609,000.00<br />
Total Employees 24<br />
Total Annual Wages<br />
Average Annual Wage<br />
<strong>New</strong> <strong>Orleans</strong> <strong>Market</strong> <strong>Assessment</strong> – An Analysis of Supply and Demand Dynamics 204
Summary of Planning District 12<br />
Located on the West Bank, District 12 is comprised of seven neighborhoods and the <strong>New</strong> <strong>Orleans</strong> Navel<br />
Support Base. The oldest neighborhood in the district is Old Algiers which dates to the late 18 th century<br />
and is located directly across the river from the French Quarter. The remaining areas were developed in<br />
the latter half of the 20 th century, following the post‐war suburban development patterns.<br />
The district is diverse both economically and culturally, with a strong middle class base of white and<br />
black/African American households. Residential development is equally split between rental and<br />
homeowner occupied units. With the exception of Old Algiers, commercial uses are not integrated<br />
throughout neighborhoods, but instead are concentrated along major roadways. There are a significant<br />
number of multi‐family developments located adjacent to these thoroughfares.<br />
Although the levees were not breached during the storm, approximately 66% of the residential units in<br />
the district were damaged during Hurricane Katrina. 75 This damaged was caused primarily by wind and<br />
rain. Out of the 11,471 houses with reported damage after the storm, only 471 received flood damage<br />
and less than 100 were severely damaged or destroyed. The area was one of the first parts of the city to<br />
reopen and has quickly repopulated.<br />
The area is slated for significant economic development over the next five years as the <strong>New</strong> <strong>Orleans</strong><br />
Naval Support Base transitions into Federal City, which will serve as the headquarters for the<br />
Household Characteristics<br />
Planning District 12 ‐ Algiers<br />
Estimated Renters 2010 8,829<br />
Projected Change in Renters 2010 – 2015 11%<br />
Estimated Owners 2010 12,555<br />
Projected Change in Owners 2010 – 2015 14%<br />
Estimated Households 2010 21,384<br />
Estimated Change in Households 2010 ‐ 2015 12%<br />
Median Household Income, 2010 $39,795<br />
Average Household Size, 2010 2.47<br />
Family Poverty Rate, 2010 13%<br />
Housing Characteristics<br />
Planning District 12 ‐ Algiers<br />
Total Housing Units 23,325<br />
Single Family Detached 12,780<br />
Single Family Attached 1,711<br />
Duplexes 1,248<br />
75 FEMA, Katrina, Rita and Wilma Damage Report 2/12/06<br />
<strong>New</strong> <strong>Orleans</strong> <strong>Market</strong> <strong>Assessment</strong> – An Analysis of Supply and Demand Dynamics 205
Triplexes and Fourplexes 1,348<br />
Small Complex (5‐19 units) 2,748<br />
Medium Complex (20 – 49 units) 1,055<br />
Large Complex (50+ units) 2,016<br />
Median Age 1967<br />
Units Built After 2000 2,620<br />
Units Built Before 1940 2,438<br />
Total Subsidized Units 1,216<br />
Housing Cost Characteristics<br />
Planning District 12 ‐ Algiers<br />
Median Value, Single Family Home $141,673<br />
Change in Median Value, Single Family Home, ‐6%<br />
2005‐2009<br />
Apartment Survey Results ‐ Characteristics of For Rent Units<br />
Planning District 12 ‐ Algiers<br />
Total Units Available for Rent 116<br />
Median Asking Rent, 1‐Bedroom $700<br />
Median Asking Rent, 2‐Bedroom $900<br />
Total Units Available for Rent Accepting Section 8 6<br />
Vouchers<br />
Source: GCR & Associates, Inc.; online, field and phone survey conducted September – October, 2010<br />
Recovery Projects<br />
Planning District 12 ‐ Algiers<br />
Project Name<br />
Brechtel Memorial Park, Golf Course, Club House,<br />
& Maintenance Building Renovations<br />
Arthur Monday Center<br />
Algiers Regional Library Design‐Build<br />
Whitney Ave & L.B. Landry Bikeways<br />
General Meyer Ave Streetscape<br />
Cita Hubbell Library<br />
Cut Off Center<br />
Behrman Center Gym, Pool & Soccer Stadium<br />
Renovations<br />
Project Address<br />
3700 Behrman Place<br />
1111 <strong>New</strong>ton St.<br />
3014 Holiday Dr.<br />
Whitney Ave @ Mardi Gras Blvd to Patterson<br />
General Meyer Ave@ Hendee St to Odeon Ave<br />
725 Pelican Ave.<br />
6600 Belgrade St.<br />
2529 General Meyer Ave.<br />
Recovery Project Descriptions<br />
Federal City Redevelopment‐<br />
<strong>New</strong> <strong>Orleans</strong> <strong>Market</strong> <strong>Assessment</strong> – An Analysis of Supply and Demand Dynamics 206
Federal City in Algiers has adapted to numerous federal uses since it opened in 1903. In May 2005 the<br />
Navy and Defense Department announced its plans to close the Naval Support Activity. However,<br />
instead of closing the base, state and local officials persuaded the federal board to consider<br />
decommissioning costly parts of the military institution and transforming the area into a mixed‐use<br />
development. The installation will incorporate “zone based” urban design that will provide scaled levels<br />
of security allowing a range of employees from high‐level military to civilian workers to live and work in<br />
the community. With both public and military investment, the development will provide 1,400<br />
residential units, child care services, supermarkets, recreational facilities, and educational institutions<br />
from elementary to college levels. Federal City is expected to provide up to 10,000 federal and civilian<br />
jobs when the development is fully operational. 76<br />
Behrman Center and Park Enhancements‐<br />
Located in Algiers, the 60 acres park named for Mayor Martin Behrman is expected to receive large<br />
investments from the city’s recovery funds. Five recovery projects have been identified for the park<br />
including a new soccer stadium, gymnasium, pool repairs, and new turf for the football field. The<br />
combined investment totals more than $16 million and is still in the design phase. 77 In the past the park<br />
was utilized for local Friday night football games and various sports camps such as tennis, dance and<br />
cheerleading.<br />
Brechtel Memorial Park‐<br />
Developed in the 1940s through the Civil Works Administration, the park was named after the first Parks<br />
Director of <strong>Louisiana</strong>. 78 The 100 acres park is comprised of a sports field, playground, lagoon and golf<br />
course. The 18‐hole Brechtel Memorial Park Golf Course opened in 1965. Renovations of the golf<br />
course, driving range, and clubhouse will cost an estimated $7 million. The project is still in the design<br />
phase and has not gone to bid.<br />
Algiers Regional Library Design‐Build‐<br />
Prior to Hurricane Katrina, the Algiers Regional Library was the largest branch of the <strong>New</strong> <strong>Orleans</strong> Public<br />
Library system. Due to the extensive roof damage caused by the storm, most of the books and library<br />
materials were destroyed by rainwater. Over the last five years the building was used to sort book<br />
donations, but in March 2010 the building was demolished. The new regional library building will<br />
contain a children’s reading room, Wi‐Fi hotspots and community meeting rooms. The 30,000 square<br />
foot structure is expected to cost an estimated $8 million including demolition costs. Although the<br />
demolition and site leveling is complete, construction has not started due to design changes and issues<br />
in planning and zoning. The branch is expected to be complete by the end of 2011.<br />
76 Federal City at Naval Support Activity, <strong>New</strong> <strong>Orleans</strong> <strong>Louisiana</strong>. Retrieved 11/17/10.<br />
http://www.nolafederalcity.com/index.html<br />
77 <strong>New</strong> <strong>Orleans</strong> City Council. List of 100 Recovery Projects. Retrieved 11/18/10<br />
http://nolacitycouncil.com/content/docs2010<br />
78 City of <strong>New</strong> <strong>Orleans</strong> Press Releases. Accessed 11/18/10<br />
http://www.cityofno.com/pg-1-66-press-releases.aspxpressid=5487<br />
<strong>New</strong> <strong>Orleans</strong> <strong>Market</strong> <strong>Assessment</strong> – An Analysis of Supply and Demand Dynamics 207
Fischer Housing Development‐<br />
Built on the West Bank in 1965, the Fischer Housing Development was the last conventional public<br />
housing development built in <strong>New</strong> <strong>Orleans</strong>. The Housing Authority of <strong>New</strong> <strong>Orleans</strong> is overseeing the<br />
HUD‐HOPE VI two‐phase revitalization plan for the development. The first phase is complete and<br />
includes 123 mixed income rental units, 100 elderly public housing units, a management office and a<br />
community center. The second phase is currently under construction and is partially funded with GO<br />
Zone tax credits. This phase incorporates 124 single family housing units that will provide both<br />
affordable rental and homeownership opportunities.<br />
Recent Housing Developments<br />
Planning District 12 ‐ Algiers<br />
Project Name<br />
Project Address<br />
Patterson Homes‐<br />
Patterson St<br />
Oak Villa II‐<br />
3600 Bender Blvd<br />
Fischer III‐<br />
2135 L.B. Landry Blvd<br />
Renaissance Place‐<br />
3601 Texas Drive<br />
Elmwood Homes‐<br />
Elmwood Park Dr<br />
<strong>Orleans</strong> Place‐<br />
Maumas Street<br />
Indiana Homes‐<br />
Indiana Ave<br />
Oak Villa‐<br />
Texas Dr. & Memorial Pkway<br />
Forest Park Apartments‐<br />
3708 Garden Oaks Drive<br />
Description<br />
1. LIHTC<br />
2. Low‐rise<br />
3. <strong>Market</strong> Rate‐ 0 Affordable‐ 30<br />
1. LIHTC<br />
2. Mid‐rise<br />
3. <strong>Market</strong> Rate‐ 0 Affordable‐ 80<br />
1. LIHTC and HOME<br />
2. Garden<br />
3. <strong>Market</strong> Rate‐ 0 Affordable‐ 103<br />
1. LIHTC<br />
2. Mid‐rise<br />
3. <strong>Market</strong> Rate‐ 0 Affordable‐ 307<br />
1. LIHTC<br />
2. Single Family<br />
3. <strong>Market</strong> Rate‐ 0 Affordable‐ 40<br />
1. LIHTC<br />
2. Low‐rise<br />
3. <strong>Market</strong> Rate‐ 0 Affordable‐ 60<br />
1. LIHTC<br />
2. Single Family<br />
3. <strong>Market</strong> Rate‐ 0 Affordable‐ 60<br />
1. LIHTC<br />
2. Mid‐rise<br />
3. <strong>Market</strong> Rate‐ 0 Affordable‐ 80<br />
1. LIHTC<br />
2. Low‐rise<br />
3. <strong>Market</strong> Rate‐ 0 Affordable‐ 284<br />
Assessor Data<br />
Planning District 12 ‐ Algiers<br />
<strong>New</strong> <strong>Orleans</strong> <strong>Market</strong> <strong>Assessment</strong> – An Analysis of Supply and Demand Dynamics 208
Total Residential Properties 12,525<br />
Properties with Homestead Exemption 8,619<br />
Residential Properties without Homestead 3,906<br />
Exemption<br />
Average Assessed Value, Residential Properties $16,208<br />
Commercial Properties 419<br />
GCR Activity Index©<br />
Planning District 12 ‐ Algiers<br />
Total Residential Addresses 16,054<br />
Active Addresses 14,558<br />
Inactive Addresses 1,496<br />
Percentage Inactive 9.32%<br />
Change in Activity 2008 ‐ 2010 ‐0.92%<br />
Commercial Addresses 613<br />
Active Addresses 518<br />
Inactive Addresses 95<br />
Percentage Inactive 15.5%<br />
Change in Activity 2008 ‐ 2010 ‐8.84%<br />
Area Businesses<br />
Planning District 12 ‐ Algiers<br />
Total Businesses 144<br />
Retail 104<br />
Restaurants 36<br />
Grocery and Food 4<br />
Total Business Earnings $363,071,000.00<br />
Total Employees 2,004<br />
<strong>New</strong> <strong>Orleans</strong> <strong>Market</strong> <strong>Assessment</strong> – An Analysis of Supply and Demand Dynamics 209
Summary of Planning District 13<br />
District 13, commonly known as Lower Coast or English Turn, is located at the southernmost point of the<br />
city at the edge of the Barataria‐Terrebonne National Estuary Program. The district has a unique mix of<br />
suburban dwellings and undeveloped greenspace. Of the 5,500 acres that make up the district,<br />
approximately 2200 acres are used for residential purposes. The other half remains open space and<br />
wetlands. The Audubon Center for Research of Endangered Species (ACRES) occupies approximately<br />
1,200 acres. 79 Levee protection surrounds the district providing both hurricane protection and added<br />
greenspace.<br />
The area developed as a high‐end suburban‐type development within the boundaries of the city, largely<br />
comprised of luxury single family residences. Accordingly the households are predominantly wealthy,<br />
with a household median income of $196,000 per year. The area is sparsely populated, with less than<br />
1,000 households, and is largely zoned for residential uses. As a result, there is limited retail or business<br />
activity.<br />
Though the district was spared from flood damage, the area structures and hardwood forests sustained<br />
wind damage. Of the 1,424 homes that received damage, 95% received wind damage of which 26<br />
reported being severely damaged or destroyed. Residents have united in an effort to protect the area<br />
from future hurricane disaster given its southern location along the Mississippi and low lying lands. The<br />
district does fall under FEMA’s high risk zones and is dependent on man‐made levees and canals for<br />
protection. 80<br />
79 Greater <strong>New</strong> <strong>Orleans</strong> Community Data Center, <strong>New</strong> Aurora/ English Turn District Neighborhood Snapshot.<br />
Retrieved 11/12/10. http://www.gnocdc.org/orleans/8/index.html<br />
80 UNOP-District 13: Introduction to the District, 2005, pg.5<br />
http://willdoo-storage.com/Plans/D13/District_13_Chapter_01_Introduction_to_the_District.pdf<br />
<strong>New</strong> <strong>Orleans</strong> <strong>Market</strong> <strong>Assessment</strong> – An Analysis of Supply and Demand Dynamics 210
Household Characteristics<br />
Planning District 13 – English Turn<br />
Estimated Renters 2010 28<br />
Projected Change in Renters 2010 – 2015 21%<br />
Estimated Owners 2010 653<br />
Projected Change in Owners 2010 – 2015 21%<br />
Estimated Households 2010 681<br />
Estimated Change in Households 2010 ‐ 2015 21%<br />
Median Household Income, 2010 $196,429<br />
Average Household Size, 2010 0.08<br />
Family Poverty Rate, 2010 1%<br />
Housing Characteristics<br />
Planning District 13 – English Turn<br />
Total Housing Units 732<br />
Single Family Detached 620<br />
Single Family Attached 0<br />
Duplexes 0<br />
Triplexes and Fourplexes 0<br />
Small Complex (5‐19 units) 0<br />
Medium Complex (20 – 49 units) 0<br />
Large Complex (50+ units) 0<br />
Median Age 2001<br />
Units Built After 2000 401<br />
Units Built Before 1940 4<br />
Total Subsidized Units 0<br />
Housing Cost Characteristics<br />
Planning District 13 – English Turn<br />
Median Value, Single Family Home $492,938<br />
Change in Median Value, Single Family Home, ‐16%<br />
2005‐2009<br />
Characteristics of For Rent Units<br />
Planning District 13 – English Turn<br />
Total Units Available for Rent 5<br />
Median Asking Rent, 1‐Bedroom $850<br />
Median Asking Rent, 2‐Bedroom $965<br />
Total Units Available for Rent Accepting Section 8 0<br />
Vouchers<br />
<strong>New</strong> <strong>Orleans</strong> <strong>Market</strong> <strong>Assessment</strong> – An Analysis of Supply and Demand Dynamics 211
Assessor Data<br />
Planning District 13 – English Turn<br />
Total Residential Properties 514<br />
Properties with Homestead Exemption 401<br />
Residential Properties without Homestead 113<br />
Exemption<br />
Average Assessed Value, Residential Properties $39,642<br />
Commercial Properties 5<br />
GCR Activity Index©<br />
Planning District 13 – English Turn<br />
Total Residential Addresses 566<br />
Active Addresses 549<br />
Inactive Addresses 17<br />
Percentage Inactive 3%<br />
Change in Activity 2008 ‐ 2010 ‐0.67%<br />
Commercial Addresses 19<br />
Active Addresses 18<br />
Inactive Addresses 1<br />
Percentage Inactive 5.26%<br />
Change in Activity 2008 ‐ 2010 13.79%<br />
Area Businesses<br />
Planning District 13 – English Turn<br />
Total Businesses 4<br />
Retail 3<br />
Restaurants 1<br />
Grocery and Food 0<br />
Total Business Earnings $1,854,000<br />
Total Employees 13<br />
<strong>New</strong> <strong>Orleans</strong> <strong>Market</strong> <strong>Assessment</strong> – An Analysis of Supply and Demand Dynamics 212
St. Bernard Parish ‐ Summary Data<br />
Summary of Arabi, LA<br />
Originally developed in the 19 th century as a suburb of <strong>New</strong> <strong>Orleans</strong>, the neighborhoods of Arabi were<br />
developed on existing riverfront plantations. Arabi was originally part of <strong>Orleans</strong> Parish until an 1870s<br />
law prohibited slaughterhouses within <strong>New</strong> <strong>Orleans</strong> city limits. Flood water during Hurricane Betsy<br />
overtopped levees inundating much of Arabi with flood waters; however the storm surge from<br />
Hurricane Katrina devastated the area. In St. Bernard Parish as a whole, 68% of the residential<br />
structures were severely damaged or destroyed by Hurricane Katrina. 81 Today, approximately 54% of<br />
the pre‐Katrina active addresses in Arabi are not currently receiving mail. The area continues to recover<br />
with a 14.9% increase in residential active addresses between 2008 and 2010. 82<br />
Household Characteristics<br />
Arabi<br />
Estimated Renters 2010 437<br />
Projected Change in Renters 2010 – 2015 10%<br />
Estimated Owners 2010 803<br />
Projected Change in Owners 2010 – 2015 10%<br />
Estimated Households 2010 1,240<br />
Estimated Change in Households 2010 ‐ 2015 10%<br />
Median Household Income, 2010 $38,343<br />
Average Household Size, 2010 2.27<br />
Family Poverty Rate, 2010 1%<br />
Housing Characteristics<br />
Arabi<br />
Total Housing Units 1,315<br />
Single Family Detached 972<br />
Single Family Attached 20<br />
Duplexes 101<br />
Triplexes and Fourplexes 43<br />
Small Complex (5‐19 units) 37<br />
Medium Complex (20 – 49 units) 0<br />
Large Complex (50+ units) 0<br />
Median Age 1967<br />
Units Built After 2000 396<br />
Units Built Before 1940 65<br />
Total Subsidized Units<br />
N/A<br />
81 FEMA, Katrina, Rita and Wilma Damage Report 2/12/06<br />
82 GCR Activity Index<br />
<strong>New</strong> <strong>Orleans</strong> <strong>Market</strong> <strong>Assessment</strong> – An Analysis of Supply and Demand Dynamics 213
Housing Cost Characteristics<br />
Arabi<br />
Average Value, Single Family Home<br />
Change in Average Value, Single Family Home,<br />
2004‐2009<br />
Estimated Median Rent, 1‐bedroom<br />
Estimated Median Rent, 2‐bedroom<br />
$79,306<br />
N/A<br />
N/A<br />
N/A<br />
Characteristics of For Rent Units<br />
Arabi<br />
Total Units Available for Rent<br />
Median Asking Rent, 1‐Bedroom<br />
Median Asking Rent, 2‐Bedroom<br />
Total Units Available for Rent Accepting Section 8<br />
Vouchers<br />
N/A<br />
N/A<br />
N/A<br />
N/A<br />
Recovery Projects<br />
Arabi<br />
Project Name<br />
Project Address<br />
N/A<br />
Recent Housing Developments<br />
Arabi<br />
Project Name<br />
Project Address<br />
Description<br />
N/A<br />
Assessor Data<br />
Arabi<br />
Total Residential Properties 3,194<br />
Properties with Homestead Exemption 2,298<br />
Residential Properties without Homestead 896<br />
Exemption<br />
Average Assessed Value, Residential Properties N/A<br />
<strong>New</strong> <strong>Orleans</strong> <strong>Market</strong> <strong>Assessment</strong> – An Analysis of Supply and Demand Dynamics 214
Commercial Properties 178<br />
GCR Activity Index©<br />
Arabi<br />
Total Residential Addresses 3,470<br />
Active Addresses 1,566<br />
Inactive Addresses 1,904<br />
Percentage Inactive 54%<br />
Change in Activity 2008 ‐ 2010 14.9%<br />
Commercial Addresses 225<br />
Active Addresses 141<br />
Inactive Addresses 84<br />
Percentage Inactive 37%<br />
Change in Activity 2008 ‐ 2010 17.2%<br />
Area Businesses<br />
Arabi<br />
Total Businesses 16<br />
Retail 9<br />
Restaurants 7<br />
Grocery and Food 0<br />
Total Business Earnings $102,613,000.00<br />
Total Employees 111<br />
Total Annual Wages N/A<br />
Average Annual Wage N/A<br />
<strong>New</strong> <strong>Orleans</strong> <strong>Market</strong> <strong>Assessment</strong> – An Analysis of Supply and Demand Dynamics 215
Summary of Chalmette, LA<br />
Located on the east bank of the Mississippi River, south of Arabi, Chalmette was named after plantation<br />
owner I. Martin de Lino de Chalmette. The Mississippi River Gulf Outlet (MRGO), dug in the 1960’s as an<br />
emergency outlet and commerce channel, overflowed during Hurricane Katrina and inundated the<br />
Chalmette community with flood waters. Due to the damage caused to the canal by Hurricane Katrina<br />
and community indignation, the MRGO closed in July of 2009. Gradual recovery processes in the area<br />
have been slow with approximately 44% of the pre‐Katrina addresses remain inactive in 2010. 83<br />
Household Characteristics<br />
Chalmette<br />
Estimated Renters 2010 3,252<br />
Projected Change in Renters 2010 – 2015 14%<br />
Estimated Owners 2010 4,194<br />
Projected Change in Owners 2010 – 2015 13%<br />
Estimated Households 2010 7,446<br />
Estimated Change in Households 2010 ‐ 2015 13%<br />
Median Household Income, 2010 $41,370<br />
Average Household Size, 2010 2.4<br />
Family Poverty Rate, 2010 1.5%<br />
Housing Characteristics<br />
Chalmette<br />
Total Housing Units 7,819<br />
Single Family Detached 4,982<br />
Single Family Attached 254<br />
Duplexes 973<br />
Triplexes and Fourplexes 365<br />
Small Complex (5‐19 units) 341<br />
Medium Complex (20 – 49 units) 0<br />
Large Complex (50+ units) 7<br />
Median Age 1976<br />
Units Built After 2000 2,659<br />
Units Built Before 1940 1,289<br />
Total Subsidized Units<br />
N/A<br />
Housing Cost Characteristics<br />
Chalmette<br />
Average Value, Single Family Home<br />
$96,363<br />
83 GCR Activity Index<br />
<strong>New</strong> <strong>Orleans</strong> <strong>Market</strong> <strong>Assessment</strong> – An Analysis of Supply and Demand Dynamics 216
Change in Average Value, Single Family Home,<br />
2004‐2009<br />
Estimated Median Rent, 1‐bedroom<br />
Estimated Median Rent, 2‐bedroom<br />
N/A<br />
N/A<br />
N/A<br />
Characteristics of For Rent Units<br />
Chalmette<br />
Total Units Available for Rent<br />
Median Asking Rent, 1‐Bedroom<br />
Median Asking Rent, 2‐Bedroom<br />
Total Units Available for Rent Accepting Section 8<br />
Vouchers<br />
N/A<br />
N/A<br />
N/A<br />
N/A<br />
Recovery Projects<br />
Chalmette<br />
Project Name<br />
Project Address<br />
N/A<br />
Recent Housing Developments<br />
Chalmette<br />
Project Name<br />
Project Address<br />
Description<br />
N/A<br />
Assessor Data<br />
Chalmette<br />
Total Residential Properties 9,645<br />
Properties with Homestead Exemption 6,648<br />
Residential Properties without Homestead 2,997<br />
Exemption<br />
Average Assessed Value, Residential Properties N/A<br />
Commercial Properties 865<br />
GCR Activity Index©<br />
Chalmette<br />
Total Residential Addresses 11,694<br />
<strong>New</strong> <strong>Orleans</strong> <strong>Market</strong> <strong>Assessment</strong> – An Analysis of Supply and Demand Dynamics 217
Active Addresses 6,547<br />
Inactive Addresses 5,147<br />
Percentage Inactive 44%<br />
Change in Activity 2008 ‐ 2010 13.7%<br />
Commercial Addresses 996<br />
Active Addresses 648<br />
Inactive Addresses 348<br />
Percentage Inactive 35%<br />
Change in Activity 2008 ‐ 2010 11.9%<br />
Area Businesses<br />
Chalmette<br />
Total Businesses 112<br />
Retail 78<br />
Restaurants 27<br />
Grocery and Food 7<br />
Total Business Earnings $4,521,226,000.00<br />
Total Employees 631<br />
Total Annual Wages N/A<br />
Average Annual Wage N/A<br />
<strong>New</strong> <strong>Orleans</strong> <strong>Market</strong> <strong>Assessment</strong> – An Analysis of Supply and Demand Dynamics 218
Summary of Meraux, LA<br />
Also affected by the destruction of the Mississippi River Gulf Outlet levee, Meraux was devastated by<br />
Hurricane Katrina floodwaters and wind. Though the community is much smaller than Chalmette, it has<br />
recovered more quickly than its neighbor to the north. Of the 3,444 residential addresses receiving mail<br />
prior to Hurricane Katrina, approximately 60% of the addresses are now active again. 84<br />
Household Characteristics<br />
Meraux<br />
Estimated Renters 2010 748<br />
Projected Change in Renters 2010 – 2015 26%<br />
Estimated Owners 2010 1,750<br />
Projected Change in Owners 2010 – 2015 19%<br />
Estimated Households 2010 2,498<br />
Estimated Change in Households 2010 ‐ 2015 21%<br />
Median Household Income, 2010 $52,326<br />
Average Household Size, 2010 2.6<br />
Family Poverty Rate, 2010 1.2%<br />
Housing Characteristics<br />
Meraux<br />
Total Housing Units 2,548<br />
Single Family Detached 1,719<br />
Single Family Attached 10<br />
Duplexes 41<br />
Triplexes and Fourplexes 56<br />
Small Complex (5‐19 units) 66<br />
Medium Complex (20 – 49 units) 0<br />
Large Complex (50+ units) 75<br />
Median Age 1977<br />
Units Built After 2000 842<br />
Units Built Before 1940 17<br />
Total Subsidized Units<br />
N/A<br />
Housing Cost Characteristics<br />
Meraux<br />
Average Value, Single Family Home<br />
Change in Average Value, Single Family Home,<br />
2004‐2009<br />
$103,697<br />
N/A<br />
84 GCR Activity Index<br />
<strong>New</strong> <strong>Orleans</strong> <strong>Market</strong> <strong>Assessment</strong> – An Analysis of Supply and Demand Dynamics 219
Estimated Median Rent, 1‐bedroom<br />
Estimated Median Rent, 2‐bedroom<br />
N/A<br />
N/A<br />
Characteristics of For Rent Units<br />
Meraux<br />
Total Units Available for Rent<br />
Median Asking Rent, 1‐Bedroom<br />
Median Asking Rent, 2‐Bedroom<br />
Total Units Available for Rent Accepting Section 8<br />
Vouchers<br />
N/A<br />
N/A<br />
N/A<br />
N/A<br />
Recovery Projects<br />
Meraux<br />
Project Name<br />
Project Address<br />
N/A<br />
Recent Housing Developments<br />
Meraux<br />
Project Name<br />
Project Address<br />
Description<br />
N/A<br />
Assessor Data<br />
Meraux<br />
Total Residential Properties 3,223<br />
Properties with Homestead Exemption 1,835<br />
Residential Properties without Homestead 1,388<br />
Exemption<br />
Average Assessed Value, Residential Properties N/A<br />
Commercial Properties 97<br />
GCR Activity Index©<br />
Meraux<br />
Total Residential Addresses 3,444<br />
Active Addresses 2,060<br />
Inactive Addresses 1,384<br />
<strong>New</strong> <strong>Orleans</strong> <strong>Market</strong> <strong>Assessment</strong> – An Analysis of Supply and Demand Dynamics 220
Percentage Inactive 40%<br />
Change in Activity 2008 ‐ 2010 5.1%<br />
Commercial Addresses 151<br />
Active Addresses 84<br />
Inactive Addresses 67<br />
Percentage Inactive 44%<br />
Change in Activity 2008 ‐ 2010 29.3%<br />
Area Businesses<br />
Meraux<br />
Total Businesses 11<br />
Retail 8<br />
Restaurants 3<br />
Grocery and Food 0<br />
Total Business Earnings $880,535,000.00<br />
Total Employees 62<br />
Total Annual Wages N/A<br />
Average Annual Wage N/A<br />
<strong>New</strong> <strong>Orleans</strong> <strong>Market</strong> <strong>Assessment</strong> – An Analysis of Supply and Demand Dynamics 221
Summary of Poydras, LA<br />
First settled in the 18 th Century as a Spanish Colony, Poydras is located downriver from Violet on the<br />
east bank of the Mississippi River. A crabbing and fishing community, Poydras was devastated by<br />
Hurricane Katrina. The community continues to rebound with approximately 70% of the residential<br />
addresses returning to active status by 2010. Most of this recovery occurred prior to 2008 with the<br />
change in activity between 2008 and 2010 remaining low at 4.5% change. 85<br />
Household Characteristics<br />
Poydras<br />
Estimated Renters 2010 683<br />
Projected Change in Renters 2010 – 2015 25%<br />
Estimated Owners 2010 1,963<br />
Projected Change in Owners 2010 – 2015 25%<br />
Estimated Households 2010 2,646<br />
Estimated Change in Households 2010 ‐ 2015 25%<br />
Median Household Income, 2010 $39,229<br />
Average Household Size, 2010 2.8<br />
Family Poverty Rate, 2010 1.9%<br />
Housing Characteristics<br />
Poydras<br />
Total Housing Units 3,065<br />
Single Family Detached 1,158<br />
Single Family Attached 5<br />
Duplexes 10<br />
Triplexes and Fourplexes 5<br />
Small Complex (5‐19 units) 6<br />
Medium Complex (20 – 49 units) 0<br />
Large Complex (50+ units) 0<br />
Median Age 2003<br />
Units Built After 2000 1,600<br />
Units Built Before 1940 53<br />
Total Subsidized Units<br />
N/A<br />
Housing Cost Characteristics<br />
Poydras<br />
Average Value, Single Family Home<br />
Change in Average Value, Single Family Home,<br />
$61,101<br />
N/A<br />
85 GCR Activity Index<br />
<strong>New</strong> <strong>Orleans</strong> <strong>Market</strong> <strong>Assessment</strong> – An Analysis of Supply and Demand Dynamics 222
2004‐2009<br />
Estimated Median Rent, 1‐bedroom<br />
Estimated Median Rent, 2‐bedroom<br />
N/A<br />
N/A<br />
Characteristics of For Rent Units<br />
Poydras<br />
Total Units Available for Rent<br />
Median Asking Rent, 1‐Bedroom<br />
Median Asking Rent, 2‐Bedroom<br />
Total Units Available for Rent Accepting Section 8<br />
Vouchers<br />
N/A<br />
N/A<br />
N/A<br />
N/A<br />
Recovery Projects<br />
Poydras<br />
Project Name<br />
Project Address<br />
N/A<br />
Recent Housing Developments<br />
Poydras<br />
Project Name<br />
Project Address<br />
Description<br />
N/A<br />
Assessor Data<br />
Poydras<br />
Total Residential Properties 1,111<br />
Properties with Homestead Exemption 403<br />
Residential Properties without Homestead 708<br />
Exemption<br />
Average Assessed Value, Residential Properties N/A<br />
Commercial Properties 45<br />
GCR Activity Index©<br />
Poydras<br />
Total Residential Addresses 1,169<br />
Active Addresses 823<br />
<strong>New</strong> <strong>Orleans</strong> <strong>Market</strong> <strong>Assessment</strong> – An Analysis of Supply and Demand Dynamics 223
Inactive Addresses 346<br />
Percentage Inactive 30%<br />
Change in Activity 2008 ‐ 2010 4.5%<br />
Commercial Addresses 69<br />
Active Addresses 55<br />
Inactive Addresses 14<br />
Percentage Inactive 20%<br />
Change in Activity 2008 ‐ 2010 7.0%<br />
Area Businesses<br />
Poydras<br />
Total Businesses 16<br />
Retail 11<br />
Restaurants 3<br />
Grocery and Food 2<br />
Total Business Earnings $110,174,000.00<br />
Total Employees 80<br />
Total Annual Wages<br />
Average Annual Wage<br />
<strong>New</strong> <strong>Orleans</strong> <strong>Market</strong> <strong>Assessment</strong> – An Analysis of Supply and Demand Dynamics 224
Summary of Violet, LA<br />
Located approximately 7.5 miles southeast of <strong>New</strong> <strong>Orleans</strong>, Violet was originally part of the Livaudais<br />
Plantation. Located at the Violet Canal, the community was devastated after Hurricane Katrina<br />
destroyed the levee protection surround the area. Approximately 34% of the residential addresses<br />
remained inactive in 2010 with 9.4% of this change occurring between 2008 and 2010. 86<br />
Household Characteristics<br />
Violet<br />
Estimated Renters 2010 527<br />
Projected Change in Renters 2010 – 2015 12%<br />
Estimated Owners 2010 1,061<br />
Projected Change in Owners 2010 – 2015 14%<br />
Estimated Households 2010 1,628<br />
Estimated Change in Households 2010 ‐ 2015 13%<br />
Median Household Income, 2010 $32,755<br />
Average Household Size, 2010 2.9<br />
Family Poverty Rate, 2010 2.9%<br />
Housing Characteristics<br />
Violet<br />
Total Housing Units 1,683<br />
Single Family Detached 1,173<br />
Single Family Attached 24<br />
Duplexes 100<br />
Triplexes and Fourplexes 44<br />
Small Complex (5‐19 units) 12<br />
Medium Complex (20 – 49 units) 0<br />
Large Complex (50+ units) 0<br />
Median Age 1979<br />
Units Built After 2000 128<br />
Units Built Before 1940 24<br />
Total Subsidized Units<br />
N/A<br />
Housing Cost Characteristics<br />
Violet<br />
Average Value, Single Family Home<br />
Change in Average Value, Single Family Home,<br />
2004‐2009<br />
$71,308<br />
N/A<br />
86 GCR Activity Index<br />
<strong>New</strong> <strong>Orleans</strong> <strong>Market</strong> <strong>Assessment</strong> – An Analysis of Supply and Demand Dynamics 225
Estimated Median Rent, 1‐bedroom<br />
Estimated Median Rent, 2‐bedroom<br />
N/A<br />
N/A<br />
Characteristics of For Rent Units<br />
Violet<br />
Total Units Available for Rent<br />
Median Asking Rent, 1‐Bedroom<br />
Median Asking Rent, 2‐Bedroom<br />
Total Units Available for Rent Accepting Section 8<br />
Vouchers<br />
N/A<br />
N/A<br />
N/A<br />
N/A<br />
Recovery Projects<br />
Violet<br />
Project Name<br />
Project Address<br />
N/A<br />
Recent Housing Developments<br />
Violet<br />
Project Name<br />
Project Address<br />
Description<br />
N/A<br />
Assessor Data<br />
Violet<br />
Total Residential Properties 2,667<br />
Properties with Homestead Exemption 1,367<br />
Residential Properties without Homestead 1,300<br />
Exemption<br />
Average Assessed Value, Residential Properties N/A<br />
Commercial Properties 67<br />
GCR Activity Index©<br />
Violet<br />
Total Residential Addresses 2,733<br />
Active Addresses 1,805<br />
Inactive Addresses 928<br />
<strong>New</strong> <strong>Orleans</strong> <strong>Market</strong> <strong>Assessment</strong> – An Analysis of Supply and Demand Dynamics 226
Percentage Inactive 34%<br />
Change in Activity 2008 ‐ 2010 9.4%<br />
Commercial Addresses 99<br />
Active Addresses 73<br />
Inactive Addresses 26<br />
Percentage Inactive 26%<br />
Change in Activity 2008 ‐ 2010 7.1%<br />
Area Businesses<br />
Violet<br />
Total Businesses 11<br />
Retail 7<br />
Restaurants 3<br />
Grocery and Food 1<br />
Total Business Earnings $96,931,000.00<br />
Total Employees 59<br />
Total Annual Wages N/A<br />
Average Annual Wage N/A<br />
<strong>New</strong> <strong>Orleans</strong> <strong>Market</strong> <strong>Assessment</strong> – An Analysis of Supply and Demand Dynamics 227