Teejet Catalog 51 - Farmco Distributing Inc
Teejet Catalog 51 - Farmco Distributing Inc
Teejet Catalog 51 - Farmco Distributing Inc
Create successful ePaper yourself
Turn your PDF publications into a flip-book with our unique Google optimized e-Paper software.
Spray Distribution Quality<br />
One of the most overlooked factors that can<br />
dramatically influence the effectiveness of<br />
a given crop production chemical is spray<br />
distribution. The uniformity of the spray<br />
distribution across the boom or within the<br />
spray swath is an essential component to<br />
achieving maximum chemical effectiveness<br />
with minimal cost and minimal non-target<br />
contamination. This is more than critical if<br />
carrier and chemical rates are applied at<br />
the recommended minimum rate. There<br />
are many other factors influencing a crop<br />
production chemical’s effectiveness, such<br />
as weather, application timing, active<br />
ingredient rates, pest infestation, etc.<br />
However, an operator must become aware<br />
of spray distribution quality if maximum<br />
efficiency is expected.<br />
Measurement Techniques<br />
Spray distribution can be measured in<br />
different ways. TeeJet Technologies and<br />
some sprayer manufacturers, as well as<br />
other research and testing stations, have<br />
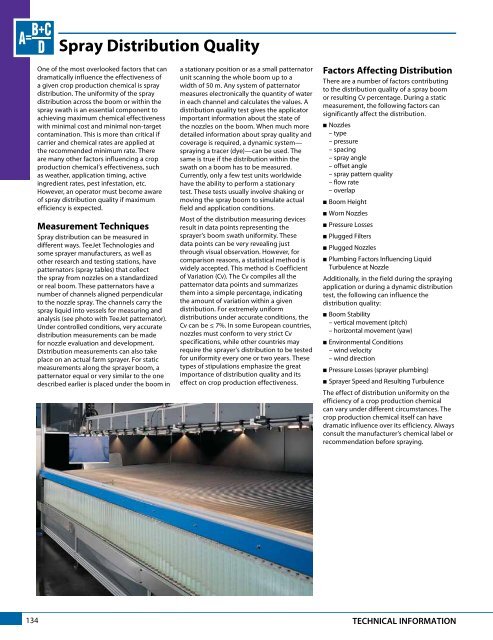
patternators (spray tables) that collect<br />
the spray from nozzles on a standardized<br />
or real boom. These patternators have a<br />
number of channels aligned perpendicular<br />
to the nozzle spray. The channels carry the<br />
spray liquid into vessels for measuring and<br />
analysis (see photo with TeeJet patternator).<br />
Under controlled conditions, very accurate<br />
distribution measurements can be made<br />
for nozzle evaluation and development.<br />
Distribution measurements can also take<br />
place on an actual farm sprayer. For static<br />
measurements along the sprayer boom, a<br />
patternator equal or very similar to the one<br />
described earlier is placed under the boom in<br />
a stationary position or as a small patternator<br />
unit scanning the whole boom up to a<br />
width of 50 m. Any system of patternator<br />
measures electronically the quantity of water<br />
in each channel and calculates the values. A<br />
distribution quality test gives the applicator<br />
important information about the state of<br />
the nozzles on the boom. When much more<br />
detailed information about spray quality and<br />
coverage is required, a dynamic system—<br />
spraying a tracer (dye)—can be used. The<br />
same is true if the distribution within the<br />
swath on a boom has to be measured.<br />
Currently, only a few test units worldwide<br />
have the ability to perform a stationary<br />
test. These tests usually involve shaking or<br />
moving the spray boom to simulate actual<br />
field and application conditions.<br />
Most of the distribution measuring devices<br />
result in data points representing the<br />
sprayer’s boom swath uniformity. These<br />
data points can be very revealing just<br />
through visual observation. However, for<br />
comparison reasons, a statistical method is<br />
widely accepted. This method is Coefficient<br />
of Variation (Cv). The Cv compiles all the<br />
patternator data points and summarizes<br />
them into a simple percentage, indicating<br />
the amount of variation within a given<br />
distribution. For extremely uniform<br />
distributions under accurate conditions, the<br />
Cv can be ≤ 7%. In some European countries,<br />
nozzles must conform to very strict Cv<br />
specifications, while other countries may<br />
require the sprayer’s distribution to be tested<br />
for uniformity every one or two years. These<br />
types of stipulations emphasize the great<br />
importance of distribution quality and its<br />
effect on crop production effectiveness.<br />
Factors Affecting Distribution<br />
There are a number of factors contributing<br />
to the distribution quality of a spray boom<br />
or resulting Cv percentage. During a static<br />
measurement, the following factors can<br />
significantly affect the distribution.<br />
K Nozzles<br />
– type<br />
– pressure<br />
– spacing<br />
– spray angle<br />
– offset angle<br />
– spray pattern quality<br />
– flow rate<br />
– overlap<br />
K Boom Height<br />
K Worn Nozzles<br />
K Pressure Losses<br />
K Plugged Filters<br />
K Plugged Nozzles<br />
K Plumbing Factors Influencing Liquid<br />
Turbulence at Nozzle<br />
Additionally, in the field during the spraying<br />
application or during a dynamic distribution<br />
test, the following can influence the<br />
distribution quality:<br />
K Boom Stability<br />
– vertical movement (pitch)<br />
– horizontal movement (yaw)<br />
K Environmental Conditions<br />
– wind velocity<br />
– wind direction<br />
K Pressure Losses (sprayer plumbing)<br />
K Sprayer Speed and Resulting Turbulence<br />
The effect of distribution uniformity on the<br />
efficiency of a crop production chemical<br />
can vary under different circumstances. The<br />
crop production chemical itself can have<br />
dramatic influence over its efficiency. Always<br />
consult the manu fac turer’s chemical label or<br />
recommendation before spraying.<br />
134<br />
TECHNICAL INFORMATION


