Download - MSP Steel & Power Ltd.
Download - MSP Steel & Power Ltd.
Download - MSP Steel & Power Ltd.

You also want an ePaper? Increase the reach of your titles
YUMPU automatically turns print PDFs into web optimized ePapers that Google loves.
<strong>MSP</strong> <strong>Steel</strong> & <strong>Power</strong> <strong>Ltd</strong><br />
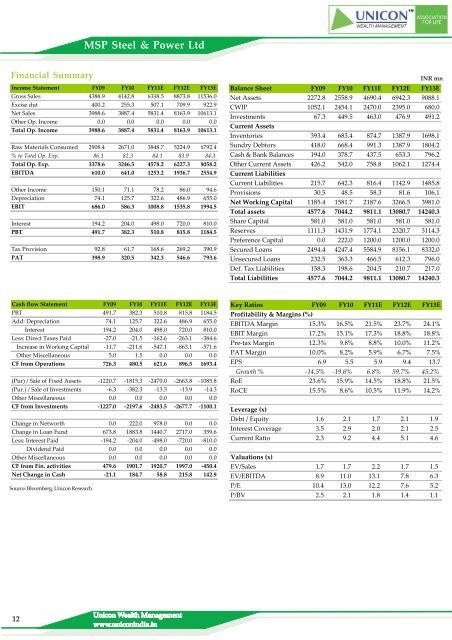
Financial Summary<br />
Income Statement FY09 FY10 FY11E FY12E FY13E<br />
Gross Sales 4388.9 4142.8 6338.5 8873.8 11536.0<br />
Excise dut 400.2 255.3 507.1 709.9 922.9<br />
Net Sales 3988.6 3887.4 5831.4 8163.9 10613.1<br />
Other Op. Income 0.0 0.0 0.0 0.0 0.0<br />
Total Op. Income 3988.6 3887.4 5831.4 8163.9 10613.1<br />
Raw Materials Consumed 2908.4 2671.0 3848.7 5224.9 6792.4<br />
% to Total Op. Exp. 86.1 82.3 84.1 83.9 84.3<br />
Total Op. Exp. 3378.6 3246.5 4578.2 6227.3 8058.2<br />
EBITDA 610.0 641.0 1253.2 1936.7 2554.9<br />
Other Income 150.1 71.1 78.2 86.0 94.6<br />
Depreciation 74.1 125.7 322.6 486.9 655.0<br />
EBIT 686.0 586.3 1008.8 1535.8 1994.5<br />
Interest 194.2 204.0 498.0 720.0 810.0<br />
PBT 491.7 382.3 510.8 815.8 1184.5<br />
Tax Provision 92.8 61.7 168.6 269.2 390.9<br />
PAT 398.9 320.5 342.3 546.6 793.6<br />
INR mn<br />
Balance Sheet FY09 FY10 FY11E FY12E FY13E<br />
Net Assets 2272.8 2558.9 4690.4 6942.3 9088.1<br />
CWIP 1052.1 2454.1 2470.0 2395.0 680.0<br />
Investments 67.3 449.5 463.0 476.9 491.2<br />
Current Assets<br />
Inventories 393.4 683.4 874.7 1387.9 1698.1<br />
Sundry Debtors 418.0 668.4 991.3 1387.9 1804.2<br />
Cash & Bank Balances 194.0 378.7 437.5 653.3 796.2<br />
Other Current Assets 426.2 542.0 758.8 1062.1 1274.4<br />
Current Liabilities<br />
Current Liabilities 215.7 642.3 816.4 1142.9 1485.8<br />
Provisions 30.5 48.5 58.3 81.6 106.1<br />
Net Working Capital 1185.4 1581.7 2187.6 3266.5 3981.0<br />
Total assets 4577.6 7044.2 9811.1 13080.7 14240.3<br />
Share Capital 581.0 581.0 581.0 581.0 581.0<br />
Reserves 1111.3 1431.9 1774.1 2320.7 3114.3<br />
Preference Capital 0.0 222.0 1200.0 1200.0 1200.0<br />
Secured Loans 2494.4 4247.4 5584.9 8156.1 8332.0<br />
Unsecured Loans 232.5 363.3 466.5 612.3 796.0<br />
Def. Tax Liabilities 158.3 198.6 204.5 210.7 217.0<br />
Total Liabilities 4577.6 7044.2 9811.1 13080.7 14240.3<br />
Cash flow Statement FY09 FY10 FY11E FY12E FY13E<br />
PBT 491.7 382.3 510.8 815.8 1184.5<br />
Add: Depreciation 74.1 125.7 322.6 486.9 655.0<br />
Interest 194.2 204.0 498.0 720.0 810.0<br />
Less: Direct Taxes Paid -27.0 -21.5 -162.6 -263.1 -384.6<br />
Increase in Working Capital -11.7 -211.6 -547.1 -863.1 -571.6<br />
Other Miscellaneous 5.0 1.5 0.0 0.0 0.0<br />
CF from Operations 726.3 480.5 621.6 896.5 1693.4<br />
(Pur) / Sale of Fixed Assets -1220.7 -1815.3 -2470.0 -2663.8 -1085.8<br />
(Pur.) / Sale of Investments -6.3 -382.3 -13.5 -13.9 -14.3<br />
Other Miscellaneous 0.0 0.0 0.0 0.0 0.0<br />
CF from Investments -1227.0 -2197.6 -2483.5 -2677.7 -1100.1<br />
Change in Networth 0.0 222.0 978.0 0.0 0.0<br />
Change in Loan Fund 673.8 1883.8 1440.7 2717.0 359.6<br />
Less: Interest Paid -194.2 -204.0 -498.0 -720.0 -810.0<br />
Dividend Paid 0.0 0.0 0.0 0.0 0.0<br />
Other Miscellaneous 0.0 0.0 0.0 0.0 0.0<br />
CF from Fin. activities 479.6 1901.7 1920.7 1997.0 -450.4<br />
Net Change in Cash -21.1 184.7 58.8 215.8 142.9<br />
Source: Bloomberg, Unicon Research<br />
Key Ratios FY09 FY10 FY11E FY12E FY13E<br />
Profitability & Margins (%)<br />
EBITDA Margin 15.3% 16.5% 21.5% 23.7% 24.1%<br />
EBIT Margin 17.2% 15.1% 17.3% 18.8% 18.8%<br />
Pre-tax Margin 12.3% 9.8% 8.8% 10.0% 11.2%<br />
PAT Margin 10.0% 8.2% 5.9% 6.7% 7.5%<br />
EPS 6.9 5.5 5.9 9.4 13.7<br />
Growth % -14.5% -19.6% 6.8% 59.7% 45.2%<br />
RoE 23.6% 15.9% 14.5% 18.8% 21.5%<br />
RoCE 15.5% 8.6% 10.5% 11.9% 14.2%<br />
Leverage (x)<br />
Debt / Equity 1.6 2.1 1.7 2.1 1.9<br />
Interest Coverage 3.5 2.9 2.0 2.1 2.5<br />
Current Ratio 2.3 9.2 4.4 5.1 4.6<br />
Valuations (x)<br />
EV/Sales 1.7 1.7 2.2 1.7 1.5<br />
EV/EBITDA 8.9 11.0 13.1 7.8 6.3<br />
P/E 10.4 13.0 12.2 7.6 5.2<br />
P/BV 2.5 2.1 1.8 1.4 1.1<br />
12<br />
Unicon Wealth Management<br />
www.uniconindia.in