The West Coast Paper Mills Ltd. 123.pmd - Unicon
The West Coast Paper Mills Ltd. 123.pmd - Unicon
The West Coast Paper Mills Ltd. 123.pmd - Unicon
- No tags were found...

Create successful ePaper yourself
Turn your PDF publications into a flip-book with our unique Google optimized e-Paper software.
3.Ron produces a gun, and BANG! He shoots Tommy, dead. Markfreezes. Tears run down Ron’s face, as he aims the gun atMark. <strong>The</strong> share a look. An intense look. Ron’s slowly pullsthe trigger.MARKSon of a bitch.CUT TO:RONSon of a bitch.INT. RON’S HOUSE - KITCHEN - MIDDAY/EARLIERMIRA (30’s), a tired looking women with a beautiful, butbruised face hurries around the kitchen. She takes a bowl ofsoup and puts it in front of Ron who sits at a table. Miralooks at her son as if to say “Sorry, that’s all we have toeat”.Ron eats the soup without saying anything. Mira sits downnext to Ron. Neither properly acknowledge each other.MIRADo you like it?Ron shakes his head: No.MIRA (CONT’D)(smiling)Neither do I.Ron pushes the bowl towards the centre of the table.MIRA (CONT’D)Do you wanna buy something to eat?Something nice?Mira caresses his hair.Ron smiles.MIRA (CONT’D)C’mon, I know you do.Sure.RONMIRA<strong>The</strong>re are 20 bucks in my dress.Take them and buy a pizza orsomething. Just bring me a piece,all right?RONOf course.
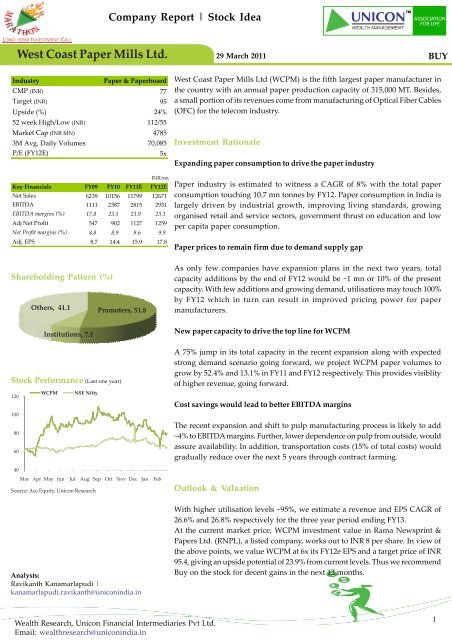
<strong>West</strong> <strong>Coast</strong> <strong>Paper</strong> <strong>Mills</strong> <strong>Ltd</strong>.Investment Rationale<strong>Paper</strong> consumption in India is expected to touch 10.7mn MT by FY12 from 9.2 mn MT in FY10Expanding paper consumption to drive the paper industryAs per ASSOCHAM, paper industry to witness a CAGR of 8% with the totalpaper consumption touching 10.7 mn tonnes by FY12. <strong>Paper</strong> consumption inIndia is driven by industrial growth, improving living standards withincreasing disposable income, growing organised retail and service sectors,government's thrust on education and low per capita paper consumption.Increasing demand from organized retail sector for paperbased bags and growing industrial output to help IPsegment grow at 7.5% in the next few yearsAt 9.2kgs of per capita consumption, paper consumed in India is far below to42kgs in China and 350kgs in developed world. As per industry estimates, IPwhich account for ~50% of total paper consumed in India is expected to grow at~7.5% backed by industrial growth and increasing demand for paperboardbased carry bags from organised retail. Implementation of Right of Children toFree Education and Compulsory Act will require 1 lac tonnes of cream wovepaper per annum. In addition, increase in literacy rate to improve readershipand circulation for magazines and news papers. News print is estimated tocontribute for 15% of total paper demand is expected to grow at ~8.5% over thenext few years.Branded copier segment which contribute for 5% of totalpaper demand in the country is growing at 16%With few expansion plans, industry average capacityutilisation is expected to touch 100% by FY12Expected higher utilisation levels for next 3-5 yearsmay bring in pricing power for the paper industryFurther, increase in employment opportunities to have positive effect on paperconsumption. For example, each new IT employment process is estimated toconsume 4kgs of paper in the form of letters, instructions and training material.In addition, increasing advertisement through mailers and growing bankingand mobile services are leading the WPP segment growth. Among differenttypes of WPP paper, branded copier segment is expected to grow at the fastestannual rate of 16%. This segment gives better EBITDA margins and estimated tocontribute for ~5% of total paper demand in FY10.<strong>Paper</strong> prices expected to rule with fewer expansion plans by the industryAs only few companies have expansion plans in the next two years, totalcapacity additions by the end of FY12 would be ~1 mn tonnes or ~10% of thepresent capacity. With few additions industry utilisations may touch 100% byFY12. Planned capacity additions beyond FY12 too are not encouraging as only~2.0 mn tonnes (Source: CRISIL Research) are expected in the next three yearsending FY15. With growing paper demand, the market is able to absorb theadditional capacities such as from WCPM.With higher capacity utilisations, paper industry may witness an improvedpricing power environment going forward. This scenario can already bewitnessed as companies have started upward revising their prices with theraw material procurement costs such as transportation costs going up. WCPMin Feb'11 increased its prices by ~2.5% across its product lines to match theincrease in these costs. With increasing pricing power, even if industry planshuge expansions in the future, long gestation period of 3-5 years from plan stagemay benefit paper prices to rule firm.However, increase in cheaper imports from China and other Asian countriescan spoil the industry's prospects, though their presence is negligible at themoment.Wealth Research, <strong>Unicon</strong> Financial Intermediaries Pvt <strong>Ltd</strong>.Email: wealthresearch@uniconindia.in4
<strong>West</strong> <strong>Coast</strong> <strong>Paper</strong> <strong>Mills</strong> <strong>Ltd</strong>.With the expanded capacity WCPM paper volumes areexpected to grow at 52.4% and 13.1% for FY11 andFY12 respectivelyWCPM is expected to witness increased cash flowsthrough reduced raw material requirement and surpluspower capacityWCPM is expected to yield the benefits of contract farmingstarting from 2012New paper capacity to drive the top line for WCPMWCPM added 1,35,000 MT of paper capacity in May 2010, a 75% jump in itstotal capacity. With growing paper consumption, WCPM was able to fullyutilize this additional capacity in less than six months of commissioning.Utilisation of the expanded capacity touched 96% in 3QFY11 as compared to72% in 2QFY11. With expected strong demand scenario goingforward, weproject WCPM paper volumes to grow by 52.4% and 13.1% in FY11 and F12respectively. For the same period, increasing paper prices can lead to fastergrowth rate in paper revenues at 66.1% and 16.5%. With the above expansion,WCPM has also increased the thermal power generation from 40.3MW to70.3MW, out of which it can export 20MW of surplus capacity to the grid.Cost savings from expansion programme and contract farming to improveEBITDA marginsWith the recent expansion WCPM replaced the old pulp unit with ElementalChlorine Free (ECF) plant and increased capacity from 300 tpd to 725 tpd. Withthe ECF process, consumption of pulp in paper manufacturing is expected tocome down by 10%. In addition, ECF process is also an environmental friendlyoperation as it consumes 33% less water. Further, the increased capacity willreduce the dependence on pulp from outside, thus improving operating margins.As raw material costs amount to ~30% of net sales, the shift to ECF shouldimprove EBITDA margins by ~4%.WCPM is investing in contract farming, by providing high yielding samplingsthrough clonal technology to the farmers. In contract farming the trees areharvested after five years of planting them. Though WCPM is a late entrant incontract farming, it has aggressive plans to cover up to 1 lac acres in the nextfew years. At the end of FY10, WCPM has already covered 16,200 acres withinthe radius of 250kms from the plant. With its contract farming start yieldingfrom year 2012, WCPM is expected to save on transportation costs as the currentaverage radius of the raw material sources is 800kms. WCPM expects to procureat least 10% of its raw material requirement from contract farming in 2012 andgradually increase to 50% of the requirement by the year 2016. As transportationcosts account for 15% of the total costs, we expect WCPM to benefit from thegradual decrease in coverage area radius in the next few years. In addition,with contract farming, WCPM will be able to achieve uniformity in raw materialquality and raw material security.Wealth Research, <strong>Unicon</strong> Financial Intermediaries Pvt <strong>Ltd</strong>.Email: wealthresearch@uniconindia.in5
<strong>West</strong> <strong>Coast</strong> <strong>Paper</strong> <strong>Mills</strong> <strong>Ltd</strong>.Outlook & ValuationWith the WCPM utilisation levels already reaching 95%, we estimate a revenueand EPS CAGR of 26.6% and 26.8% respectively for the three year period endingFY13.Besides, with the completed expansion programme and an expected surplus cashflows scenario ahead we expect WCPM to increase dividend per share startingFY11. On INR 3 per share for FY11, dividend yield works out to 3.75% which iscomparable with the industry average of 3.6%. At CMP of INR 80 the stock currentlytrades at 5x our FY12e EPS.From the below table, it can be seen that WCPM's share is trading in line with theindustry on both PE and EV/EBITDA parameters. Considering the fact that papercompanies are more or less comparable, we expect WCPM share has limitedchances of getting a premium over other companies. However, as we believe animproved pricing power ahead for the paper industry, one may witness animproved industry valuation going forward. Further, at today's price, WCPMinvestment value in RNPL, a listed company, works out to INR 8 per share.WCPM management is looking to convert the preferential shares into equity sharesby the end of FY11. We have considered the impact of the same from FY12 onwards.In view of the above points, we value WCPM at 6x its FY12e EPS and a target priceof INR 95.4, giving an upside potential of 23.9% from current levels. Thus werecommend Buy on the stock for decent gains in the next 12 months.Peer ComparisonCMP Mkt Cap EBITDA Margins (%) PE (x)PB (x) EV/EBITDA (x) ROE (%)(INR) (INR Mn) FY11e FY12e FY11e FY12e FY11e FY12e FY11e FY12e FY11e FY12eBILT 32.5 21173 20.8 22.6 8.9 6.5 0.8 0.7 6.7 5.7 10.1 12.9JK <strong>Paper</strong> 47.5 3800 20.0 23.2 3.5 3.4 0.6 0.5 NA NA 20.3 17.5TNPL 123.0 8564 32.0 33.5 5.6 4.9 0.9 0.8 NA NA 17.4 17.5WCPM 77.0 4832 23.5 23.9 5.4 4.9 0.8 0.6 7.1 5.3 14.8 14.8Source: Bloomberg, <strong>Unicon</strong> ResearchWealth Research, <strong>Unicon</strong> Financial Intermediaries Pvt <strong>Ltd</strong>.Email: wealthresearch@uniconindia.in6
<strong>West</strong> <strong>Coast</strong> <strong>Paper</strong> <strong>Mills</strong> <strong>Ltd</strong>.Summarised Financials and RatiosINR mnINR mnIncome Statement FY09 FY10 FY11E FY12E FY13E Balance Sheet FY09 FY10 FY11E FY12E FY13ERevenues 6198 6239 10156 11799 12671 Net Assets 2068 8056 14547 13757 12957Other Op. Income 0 0 0 0 0 CWIP 11200 7469 200 200 200Total Op. Income 6198 6239 10156 11799 12671 Investments 460 467 467 467 467Cost of Revenues 2193 2288 3112 3632 3955 Current Assets% to Total Op. Exp. 43.9 44.6 40.1 40.4 40.6 Inventories 1437 1791 2539 2655 2534Total Op. Exp. 4995 5128 7769 8984 9740 Sundry Debtors 434 342 711 826 887EBITDA 1202 1111 2387 2815 2931 Cash & Bank Balances 2844 1166 914 988 982Other Current Assets 1433 1833 2539 2950 3168Other Income 79 63 63 63 63 Current LiabilitiesDepreciation 199 238 978 989 1000 Current Liabilities 1915 1886 2031 2360 2534EBIT 1082 936 1471 1889 1994 Provisions 147 213 102 118 127Net Working Capital 4085 3033 4570 4941 4910Interest 77 122 502 480 420 Total assets 17814 19025 19784 19366 18534PBT 1005 815 969 1409 1574 Share Capital 121 125 125 142 142Tax Provision 99 268 68 282 315 Reserves 4792 5238 5959 7475 8521PAT 905 547 902 1127 1259 Non-Convertible Pref. shares 650 650 650 0 0Advance against share capital 115 0 0 0 0Secured Loans 9442 9396 9338 8133 6672Unsecured Loans 2294 2951 3047 2950 2534Def. Tax Liabilities 400 665 665 665 665Total Liabilities 17814 19025 19784 19366 18534INR mnCash flow Statement FY09 FY10 FY11E FY12E FY13E Key Ratios FY09 FY10 FY11E FY12E FY13EPBT 1005 815 969 1409 1574 Profitability & Margins (%)Add: Depreciation 199 238 978 989 1000 EBITDA Margin 19.4 17.8 23.5 23.9 23.1Interest 77 122 502 480 420 EBIT Margin 17.5 15.0 14.5 16.0 15.7Less: Direct Taxes Paid -131 -98 -68 -282 -315 Pre-tax Margin 16.2 13.1 9.5 11.9 12.4Increase in Working Capital -399 -595 -1789 -297 25 PAT Margin 14.6 8.8 8.9 9.6 9.9Other Miscellaneous 0 0 0 0 0 EPS 15.0 8.7 14.4 15.8 17.7CF from Operations 751 481 593 2300 2704 Growth % 30.5 (41.9) 64.8 10.2 11.7RoE 18.4 10.2 14.8 14.8 14.5(Pur) / Sale of Fixed Assets -8167 -2497 -200 -200 -200 RoCE 6.2 5.1 7.7 10.1 11.2(Pur.) / Sale of Investments 105 -4 0 0 0Other Miscellaneous 0 0 0 0 0 Leverage (x)CF from Investments -8062 -2501 -200 -200 -200 Debt / Equity 2.5 2.4 2.1 1.5 1.1Interest Coverage 14.0 7.7 2.9 3.9 4.7Change in Networth 900 0 0 0 0 Current Ratio 3.0 2.4 3.1 3.0 2.8Change in Loan Fund 7686 611 38 -1302 -1877Less: Interest Paid -77 -122 -502 -480 -420 Valuations (x)Dividend Paid -201 -147 -181 -243 -214 EV/Sales 2.3 2.7 1.7 1.3 1.0Other Miscellaneous 0 0 0 0 0 EV/EBITDA 12.0 15.0 7.1 5.3 4.5CF from Fin. activities 8307 342 -645 -2026 -2511 P/E 5.1 8.8 5.4 4.9 4.4Net Change in Cash 996 -1679 -252 74 -6 P/BV 1.0 0.9 0.8 0.6 0.6Source : Company, <strong>Unicon</strong> ResearchWealth Research, <strong>Unicon</strong> Financial Intermediaries Pvt <strong>Ltd</strong>.Email: wealthresearch@uniconindia.in7
<strong>West</strong> <strong>Coast</strong> <strong>Paper</strong> <strong>Mills</strong> <strong>Ltd</strong>.Research Recommendation 2010Date ofRecommendationCompany Name Report Type Sector Recommendation RecommendedPrice7-Mar-11 Hindusthan National Glass & Industries <strong>Ltd</strong>. Initiating Coverage Glass Buy 212.0 351.028-Feb-11 Deepak Fertilisers & Petrochemicals <strong>Ltd</strong>. Initiating Coverage Fertilisers Buy 152.0 202.03-Feb-11 Ceat <strong>Ltd</strong>. Investment Idea Auto Ancillaries Buy 109.0 149.031-Jan-11 MIC Electronics <strong>Ltd</strong>. Initiating Coverage Led Display & Lighting Buy 31.6 51.012-Jan-11 Diamond Power & Infrastructure <strong>Ltd</strong> Initiating Coverage Power Buy 193.0 257.031-Dec-10 Hathway Cable & Datacom <strong>Ltd</strong> Initiating Coverage Media Buy 164.0 227.031-Dec-10 Jindal Poly Films <strong>Ltd</strong> Investment Idea Packaging Accumulate 525.0 620.031-Dec-10 Allahabad Bank Investment Idea Banking Buy 225.0 304.022-Dec-10 Sasken Communication Tech. <strong>Ltd</strong> Investment Idea IT Buy 168.0 226.030-Nov-10 Banco Product Initiating Coverage Auto Buy 93.0 149.030-Nov-10 Allcargo Global Logistics Investment Idea Shipping & Logistics Buy 155.0 233.018-Nov-10 Jyoti Structure Investment Idea Power Buy 137.0 171.016-Nov-10 Pennar Industries Investment Idea Steel Buy 49.0 63.03-Nov-10 HSIL <strong>Ltd</strong> Initiating Coverage Building Product Buy 141.0 171.027-Oct-10 IDBI Bank Initiating Coverage Banking Buy 171.0 228.026-Oct-10 MSP Steel and Power Initiating Coverage Steel Buy 72.0 114.029-Sep-10 Nakoda Textiles Investment Idea Textiles Buy 15.0 23.016-Sep-10 Kajaria Ceramics Investment Idea Ceramic Tiles Buy 70.0 88.015-Sep-10 Gokul Refoils Investment Idea Food Processing Accumulate 97.3 109.014-Sep-10 Aqua Logistic Investment Idea Logistic Hold 59.1 60.831-Aug-10 Lakshmi Precision Screws Investment Idea Fastner Accumulate 79.8 91.827-Aug-10 BGR Energy System Initiating Coverage Power Buy 786.0 1020.030-Jul-10 Patel Engineering Initiating Coverage Infrastructure Buy 416.0 480.026-Jul-10 KPR <strong>Mills</strong> <strong>Ltd</strong> Investment Idea Textiles Accumulate 156.0 181.014-Jul-10 IDBI Bank Investment Idea Banking Accumulate 125.0 142.09-Jul-10 Opto Circuit Initiating Coverage Healthcare Buy 243.0 293.026-Jun-10 BGR Energy System <strong>Ltd</strong> Investment Idea Capital Goods Accumulate 697.0 820.023-Jun-10 Biocon <strong>Ltd</strong> Investment Idea Pharmaceuticals Buy 321.0 387.019-Jun-10 Emmbi Polyarns Investment Idea Packaging Buy 15.6 26.018-Jun-10 Indian Bank Investment Idea Banking Buy 221.0 276.017-Jun-10 Diamond Power & Infrastructure <strong>Ltd</strong> Investment Idea Power Ancillary Accumulate 196.0 226.012-Jun-10 Man Industries Investment Idea Steel Pipes Buy 85.0 102.05-Jun-10 Usher Agro Investment Idea Food Processing Buy 79.0 110.010-May-10 Greaves Cotton Investment Idea Construction Buy 67.0 82.030-Apr-10 Indraprastha Gas <strong>Ltd</strong> Initiating Coverage Gas Distribution Buy 233.0 290.016-Apr-10 Heidelburg Cement Investment Idea Cement Accumulate 59.0 60.016-Apr-10 KEC International <strong>Ltd</strong> Investment Idea Power Transmission Accumulate 570.0 655.516-Apr-10 Piramal Glass <strong>Ltd</strong> Investment Idea Packaging Accumulate 97.0 111.67-Apr-10 Setco Automative Investment Idea Auto Ancillaries Buy 90.0 135.06-Apr-10 Den Networks Investment Idea Media Accumulate 197.0 226.65-Apr-10 Arshiya International Investment Idea Logistic Buy 204.0 291.022-Feb-10 Patni Computer Initiating Coverage IT Buy 475.0 590.06-Feb-10 Shree Cement <strong>Ltd</strong> Initiating Coverage Cement Buy 1995.0 2470.0TargetWealth Research, <strong>Unicon</strong> Financial Intermediaries Pvt <strong>Ltd</strong>.Email: wealthresearch@uniconindia.in8
<strong>West</strong> <strong>Coast</strong> <strong>Paper</strong> <strong>Mills</strong> <strong>Ltd</strong>.<strong>Unicon</strong> Investment Ranking MethodologyRating Buy Accumulate Hold Reduce SellReturn Range >= 20% 10% to 20% -10% to 10% -10% to -20%