Statistics In Brief 2009 - Land Transport Authority
Statistics In Brief 2009 - Land Transport Authority
Statistics In Brief 2009 - Land Transport Authority
You also want an ePaper? Increase the reach of your titles
YUMPU automatically turns print PDFs into web optimized ePapers that Google loves.
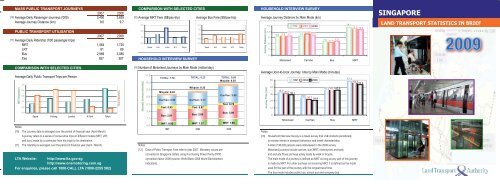
MASS PUBLIC TRANSPORT JOURNEYS COMPARISON WITH SELECTED CITIES HOUSEHOLD INTERVIEW SURVEY<br />
2007 2008<br />
[10] Average Daily Passenger-Journeys ('000) 3,450 3,635 [12] Average MRT Fare (S$/pax-trip) Average Bus Fare (S$/pax-trip) Average Journey Distance by Main Mode (km)<br />
Average Journey Distance (km) 9.6 9.7 MRT<br />
14.1<br />
3.0<br />
2.4<br />
15<br />
2008<br />
13.5 13.2<br />
PUBLIC TRANSPORT UTILISATION<br />
12<br />
1.8<br />
2.0<br />
9.6 9.9 10.0<br />
2007 2008<br />
1.2<br />
1.0<br />
9<br />
0.6<br />
[11] Average Daily Ridership ('000 passenger-trips)<br />
7.0 7.3 6.5<br />
0.0<br />
0.0<br />
6<br />
MRT 1,564 1,720<br />
LRT 81 89<br />
3<br />
Spore H.K. L'don N.Y. Tokyo<br />
Spore H.K. L'don N.Y. Tokyo<br />
Bus 2,969 3,085<br />
0<br />
Taxi 927 907 HOUSEHOLD INTERVIEW SURVEY<br />
Motorised Car/Van Bus MRT<br />
Journey Distance (km)<br />
SINGAPORE<br />
LAND TRANSPORT STATISTICS IN BRIEF<br />
LAND TRANSPORT STATISTICS IN BRIEF<br />
<strong>2009</strong><br />
COMPARISON WITH SELECTED CITIES<br />
[13] Number of Motorised Journeys by Main Mode (million/day)<br />
A<br />
Time by Main Mode (minutes)<br />
11.9<br />
Average Daily Public <strong>Transport</strong> Trips per Person<br />
TOTAL: 7.50<br />
TOTAL: 8.23<br />
TOTAL: 9.86<br />
M/cycle: 0.35<br />
60<br />
1997 2004 2008<br />
57.3<br />
10.2<br />
54.8<br />
52.2<br />
1.0<br />
M/cycle: 0.33<br />
48<br />
8.5<br />
42.8 42.742.6<br />
0.8<br />
M/cycle: 0.22<br />
38.0 36.8<br />
36<br />
35.1<br />
0.6<br />
Car/Van: 3.95<br />
6.8<br />
29.6 26.7 24.9<br />
Car/Van: 2.52 Car/Van: 3.11<br />
0.4<br />
24<br />
5.1<br />
Taxi: 0.78<br />
0.2<br />
Taxi: 0.93<br />
Taxi: 0.87<br />
12<br />
0.0<br />
3.4<br />
Bus: 3.09<br />
Bus: 2.91<br />
Bus: 2.65<br />
0<br />
Spore H.Kong London N.York Tokyo<br />
1.7<br />
Motorised Car/Van Bus MRT<br />
MRT: 0.92 MRT: 1.27<br />
MRT: 1.68<br />
0.0<br />
Notes:<br />
1997 2004 2008<br />
[10] The Journey data is averaged over the period of financial year (April-March). Notes:<br />
A journey refers to a series of consecutive trips on different modes (MRT, LRT, [13] Household <strong>In</strong>terview Survey is a travel survey that LT<br />
A conducts periodically<br />
and bus), made by a commuter from his origin to his destination.<br />
to monitor trends in transport behaviour and travel characteristics.<br />
[11] The ridership is averaged over the period of financial year (April - March). Notes: A total of 38,000 persons were interviewed in the 2008 survey.<br />
[12] Data of Public <strong>Transport</strong> Fare refer to year 2007. Monetary values are Motorised journeys include car/van, bus, MRT, motorcycles and taxis<br />
converted to Singapore dollars using Purchasing Power Parity (PPP)<br />
and exclude those journeys solely made by walk or bicycle.<br />
LTA Website: http://www.lta.gov.sg conversion factor 2006 (source: World Bank 2008 World Development The main mode of a journey is defined as MRT so long as any part of this journey<br />
http://www.onemotoring.com.sg <strong>In</strong>dicators). is made by MRT. For other journeys not involving MRT, it is defined as the mode<br />
For enquiries, please call 1800-CALL LTA (1800-2255 582)<br />
used for the part of the journey with the longest travel time.<br />
The bus mode includes public bus, school bus and company bus.<br />
MRT (trip/person)<br />
Bus (trip/person)<br />
Motorised Journeys (million/day)<br />
Journey Time (min)
GENERAL INFORMATION PEDESTRIAN FACILITIES MOTOR VEHICLE POPULATION MOTOR VEHICLE FUEL EFFICIENCY<br />
2007 2008 2007 2008 2007 2008 2007 2008<br />
[1] Total Population ('000) 4,589 4,839 [2] Number of Pedestrian Overhead Bridges 449 466 [4] All Vehicles 851,336 894,682 [7] Average Petrol Consumption per Vehicle (litres/100km)<br />
Singapore Residents ('000) 3,583 3,643 Number of Pedestrian Underpasses 55 54 Private Cars 451,745 476,634 Cars (


