ANALYSING THE WAVE SPECTRUM FOR THE PERSIAN GULF IN ...
ANALYSING THE WAVE SPECTRUM FOR THE PERSIAN GULF IN ...
ANALYSING THE WAVE SPECTRUM FOR THE PERSIAN GULF IN ...

You also want an ePaper? Increase the reach of your titles
YUMPU automatically turns print PDFs into web optimized ePapers that Google loves.
چهاردهمين كنفرانس ژئوفيزيك ايران، تهران، 23-21 ارديبهشت 89، موسسه ژئوفيزيك، مقالات پوستري، فيزيك فضا، صفحه 177-174.<br />
.<br />
.<br />
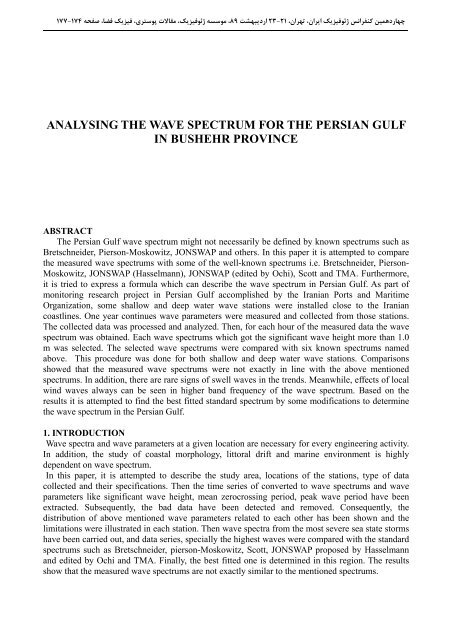
<strong>ANALYS<strong>IN</strong>G</strong> <strong>THE</strong> <strong>WAVE</strong> <strong>SPECTRUM</strong> <strong>FOR</strong> <strong>THE</strong> <strong>PERSIAN</strong> <strong>GULF</strong><br />
<strong>IN</strong> BUSHEHR PROV<strong>IN</strong>CE<br />
ABSTRACT<br />
The Persian Gulf wave spectrum might not necessarily be defined by known spectrums such as<br />
Bretschneider, Pierson-Moskowitz, JONSWAP and others. In this paper it is attempted to compare<br />
the measured wave spectrums with some of the well-known spectrums i.e. Bretschneider, Pierson-<br />
Moskowitz, JONSWAP (Hasselmann), JONSWAP (edited by Ochi), Scott and TMA. Furthermore,<br />
it is tried to express a formula which can describe the wave spectrum in Persian Gulf. As part of<br />
monitoring research project in Persian Gulf accomplished by the Iranian Ports and Maritime<br />
Organization, some shallow and deep water wave stations were installed close to the Iranian<br />
coastlines. One year continues wave parameters were measured and collected from those stations.<br />
The collected data was processed and analyzed. Then, for each hour of the measured data the wave<br />
spectrum was obtained. Each wave spectrums which got the significant wave height more than 1.0<br />
m was selected. The selected wave spectrums were compared with six known spectrums named<br />
above. This procedure was done for both shallow and deep water wave stations. Comparisons<br />
showed that the measured wave spectrums were not exactly in line with the above mentioned<br />
spectrums. In addition, there are rare signs of swell waves in the trends. Meanwhile, effects of local<br />
wind waves always can be seen in higher band frequency of the wave spectrum. Based on the<br />
results it is attempted to find the best fitted standard spectrum by some modifications to determine<br />
the wave spectrum in the Persian Gulf.<br />
1. <strong>IN</strong>TRODUCTION<br />
Wave spectra and wave parameters at a given location are necessary for every engineering activity.<br />
In addition, the study of coastal morphology, littoral drift and marine environment is highly<br />
dependent on wave spectrum.<br />
In this paper, it is attempted to describe the study area, locations of the stations, type of data<br />
collected and their specifications. Then the time series of converted to wave spectrums and wave<br />
parameters like significant wave height, mean zerocrossing period, peak wave period have been<br />
extracted. Subsequently, the bad data have been detected and removed. Consequently, the<br />
distribution of above mentioned wave parameters related to each other has been shown and the<br />
limitations were illustrated in each station. Then wave spectra from the most severe sea state storms<br />
have been carried out, and data series, specially the highest waves were compared with the standard<br />
spectrums such as Bretschneider, pierson-Moskowitz, Scott, JONSWAP proposed by Hasselmann<br />
and edited by Ochi and TMA. Finally, the best fitted one is determined in this region. The results<br />
show that the measured wave spectrums are not exactly similar to the mentioned spectrums.
صفحه 175<br />
چهاردهمين كنفرانس ژئوفيزيك ايران<br />
.<br />
.<br />
2. STUDY AREA<br />
Data set used in this study comprises of wave data parameters gathered in six stations in Naiband<br />
Gulf, Nakhle-Taghi port, Parak region, Taheri and Kangan port locations, during six months field<br />
measurements from August 23 rd 2008 to February 23 rd 2009. The Plan view of the measurement<br />
stations locations is plotted in figure #1.<br />
Figure 1. Study area in Persian Gulf<br />
3. METHODOLOGY AND DATA PROCESS<strong>IN</strong>G<br />
3.1. DATA<br />
The data available for this research are obtained by ADCP (Acoustic Doppler Current Profiler) and<br />
ADV (Acoustic Doppler Velocimeters) wave and current measurement instruments which are<br />
manufactured by the NORTEK (Norwegian) Company and their work mechanism is by sending and<br />
receiving under water transmission acoustic signals.<br />
The present data collected is driven directly from the installed instrument applied in the six<br />
locations during six months and measure waves in 17 minute intervals and the wave parameters are<br />
sampled every hour. Some severe storms occurred during the study and all wave parameters are<br />
recorded and stored from these events.<br />
The time series and power spectrums, derived through Fast Fourier Transform (FFT) became<br />
available. Next step was finding bad data or errors that could be detected by means of empirical<br />
observations. The pressure signal is utilized to estimate the non-directional, energy spectrum. The<br />
total energy distribution in this spectrum is then used to estimate wave height and period. The<br />
cross-correlation of the U and V velocity measurements (of the waves’ orbital velocities) provided<br />
us with a means to estimate the wave direction at specified frequencies. Time series estimates<br />
utilize the “zero-crossing” technique to identify individual waves in a time record.<br />
Table 1. Location, water depth and data recording specifications of the marine measurement instruments.<br />
If smoothing was not used than values would appear extremely noisy. The smoothing used specified<br />
by the number of FFT bins used in processing. A value of 64 is encouraged; however the most<br />
suitable of course is dependent on the number of samples recorded for each burst.
صفحه 176<br />
چهاردهمين كنفرانس ژئوفيزيك ايران<br />
.<br />
.<br />
3.2. DISTRIBUTION AND RANGES<br />
The range and average value of wave parameters of the data considered in the study is shown in<br />
figure #3 to #5.<br />
Figure 2. Variation of mean wave period with<br />
significant wave height<br />
Figure 3. Variation of peak wave period with<br />
significant wave height<br />
Figure 4- Variation of peak wave period with<br />
mean wave period.<br />
4. RESULTS, DISCUSSIONS AND CONCLUSIONS<br />
4.1. DATA DISTRIBUTION AND RANGE<br />
Sea state is generally defined using few parameters derived from the wave spectrum. Significant<br />
wave height (H s ) and peak period (T p ) are the most commonly used parameters. Mean wave period<br />
associated with high wave is usually obtained by assuming a significant wave steepness. In the<br />
present case, waves with H s higher than 0.5m are only considered. It was found that T m02 varies<br />
0.5<br />
0.5<br />
between 2.5H s<br />
and 7H<br />
s<br />
(figure #3). While ISSC (1979) recommendation shows T m02 is in a range<br />
0.5<br />
0.5<br />
of 2.6H s<br />
and 3.9H<br />
s<br />
.The present study shows that T m02 beyond ISSC range. T p was found to be<br />
0.5<br />
0.5<br />
between 3.2H s<br />
and 12.5H<br />
s<br />
(figure #4). T p was found to be varying between the values estimated<br />
using the equations given below (figure #5):<br />
T<br />
p<br />
4.5T<br />
m02<br />
4.8,<br />
T 9.15 3.95 0.55<br />
2<br />
p<br />
T<br />
m02 T<br />
m02<br />
.<br />
And also it was obviated that the relation between peak wave period and mean wave period is:<br />
T p 1.51 Tm<br />
02<br />
(2)<br />
4.2. COMPARISONS BETWEEN MEASURED <strong>WAVE</strong> <strong>SPECTRUM</strong>S AND STANDARD<br />
<strong>SPECTRUM</strong>S RESULTS<br />
The measured wave spectrum has been compared with the aforementioned well-known spectrums.<br />
The spectral peak period estimated by the Scott and JONSWAP (Hasselmann) was higher than the<br />
measured peak value (sometimes they deviate too much). It was found that the Pierson-Moskowitz<br />
spectrum can sometimes estimate the spectral peak value but in prediction of peak wave period and<br />
frequency band it is not reliable due to independency of T p in their formulas. It was found that<br />
although most of the spectra were with predominant single peak, lots of them have local maximums<br />
in higher frequencies as well. Another phenomenon which can be seen in comparisons is that TMA<br />
spectrum fits better in deeper stations than the shallow waters although, the whole trend is not<br />
acceptable.<br />
Generally, the comparisons showed that the measured wave spectrum is more close to JONSWAP<br />
spectrum modified by Ochi than the other spectrums. Then it was attempted to justify the modified<br />
JONSWAP spectrum formula mentioned in equation #3.<br />
4<br />
2<br />
g<br />
<br />
5 f<br />
<br />
<br />
S( f ) exp<br />
<br />
4 5 (2 ) f 4 <br />
<br />
f <br />
p<br />
<br />
0.07, f
صفحه 177<br />
چهاردهمين كنفرانس ژئوفيزيك ايران<br />
.<br />
.<br />
0.34<br />
9.5Hs<br />
f<br />
4.5H f<br />
2 4<br />
s p<br />
It has been found that by modifying the peak enhancement factor, γ, in Ochi formula as mentioned<br />
in equation #4 the measured spectrum will fit better with the modified JONSWAP wave spectrum.<br />
0.34<br />
7.5H<br />
s<br />
f p<br />
(4)<br />
Figure #6 shows the measured and parameterized wave spectrums for one of the stations during the<br />
most severe storms in 2008 -2009.<br />
p<br />
Figure 5- Comparison of Standard Spectral<br />
Formulations with the Measured Spectra in the AQ1<br />
station<br />
.<br />
Figure6 - Measured and parameterized wave spectra<br />
for the most severe sea state measured at the shallow<br />
water location, AQ1. Date 30.11.2008, Hs =0.97 m,<br />
Tp=4.75 s, HsDir=172.69°<br />
In this study six measured wave stations were considered to study the wave spectrum in Persian<br />
Gulf. Based on In order to find a general formula which can describe the wave spectrum in Persian<br />
Gulf, more measured wave data from other locations in Persian Gulf will be required. The outcomes<br />
of this study should be checked by other measured wave data in order to verify the suggested wave<br />
spectrum in Persian Gulf.<br />
Therefore, further studies and investigations will be required.<br />
5. REFERENCES<br />
1. V. Sanil Kumar, K.A.K., Spectral characteristic of high shallow water waves. Ocean Engineering, 2008. 35.<br />
2. Chakrabarti, S.K., Handbook of Offshore Engineering. Ocean Engineering Series. Vol. 1. 2005, Amsterdam:<br />
Elsevier.<br />
3. Hasselmann, Measurment of wind wave growth and swell decay during the Joint North Sea Wave Project<br />
(JONSWAP). Deutsche Hydrographische Zeitschrift, 1973. A 12: p. 95.<br />
4. Ochi, M.K., Hubble, E.N. One six parameter wave spectra. in Proceeding of the 15th Coastal Engineering<br />
Conference. 1976. New York: ASCE.<br />
5. Ochi, M.K. On hurricane-generated seas. in Proceeding of the Second International Symposium on Ocean Wave<br />
Measuremnet and Analysis 1993. New Orleans: ASCE.<br />
6. Young, I.R., Observation of the spectra of hurricane generated waves. Ocean Engineering, 1998. 25: p. 261-276.<br />
7. J.M.J. Journee, W.W.M., Offshore Hydrodynamics. first ed. 2001: Delft University of Technology.<br />
8. Sorensen, R.M., Basic Coastal Engineering. Third ed. 2006: Springer.<br />
9. Holthuijsen, L.H., Waves in Oceanic and Coastal Waters. 2007, New York: Cambridge university press.